
Abstract
History-graded increases in older adults’ levels of cognitive performance are well documented, but little is known about historical shifts in within-person change: cognitive decline and onset of decline. We combined harmonized perceptual-motor speed data from independent samples recruited in 1990 and 2010 to obtain 2,008 age-matched longitudinal observations (M = 78 years, 50% women) from 228 participants in the Berlin Aging Study (BASE) and 583 participants in the Berlin Aging Study II (BASE-II). We used nonlinear growth models that orthogonalized within- and between-person age effects and controlled for retest effects. At age 78, the later-born BASE-II cohort substantially outperformed the earlier-born BASE cohort (d = 1.20; 25 years of age difference). Age trajectories, however, were parallel, and there was no evidence of cohort differences in the amount or rate of decline and the onset of decline. Cognitive functioning has shifted to higher levels, but cognitive decline in old age appears to proceed similarly as it did two decades ago.
Keywords
It is well established that historical and sociocultural context shapes individual functioning (see Baltes et al., 2006). The most prominent example of how changes in historical context are reshaping adult functioning is the Flynn effect: When comparing cognitive performance levels at the same ages, research has shown that adults born more recently perform better than those born earlier (Flynn, 1999). Initially shown for fluid abilities among young men, the Flynn effect has now been found in multiple abilities and among adults of all ages (Pietschnig & Voracek, 2015; Trahan et al., 2014). For example, we found that older Berliners in Germany today perform better on a perceptual-motor speed test than same-aged peers 20 years ago by an astonishing 0.85 standard deviations (Gerstorf et al., 2015). Similar findings in direction and size have been reported repeatedly from older adults in many Western countries (e.g., Hessel et al., 2018; Munukka et al., 2021).
However, these studies have examined history-graded shifts in only the level of cognitive function. Little is known about how trajectories of cognitive aging may have shifted. It is an open question whether cognitive declines are getting shallower and/or the onset of decline is increasingly postponed to later ages (Gerstorf et al., 2020). We consider these two possibilities in turn.
Are Cognitive Declines in Old Age Shallower Today?
In one scenario, rates and amount of cognitive declines in old age have shifted over the past decades such that declines are shallower now. Factors that might contribute to historical differences in preservation (Salthouse, 2006) and maintenance (Stern, 2012) of cognitive function can be derived from the vascular hypothesis of cognitive aging (Casserly & Topol, 2004). Diseases of vascular origin (e.g., coronary heart disease, stroke) and vascular risk factors (e.g., hypertension) presumably influence the heart and the brain in ways that accelerate cognitive aging. Historical improvements in vascular health over the last decades should thus be accompanied by shallower cognitive decline.
Select areas of vascular health have indeed changed historically. In the United States, for example, prevalence and incidence of myocardial infarction and the incidence of heart disease and stroke are lower among older adults born between 1924 and 1934 than among those born between 1913 and 1923 (Crimmins et al., 2019). These and further improved prevention efforts (e.g., reducing high blood pressure: Neuhauser et al., 2016) may have contributed to shallower cognitive declines.
Empirical evidence of historical shifts in rates and amount of cognitive decline is equivocal. Some studies have found that later-born cohorts exhibit shallower declines (Dodge et al., 2014, 2017; Grasset et al., 2018; Vonk et al., 2019), whereas other studies have found no cohort differences (Zelinski & Kennison, 2007) or that later-born cohorts exhibit steeper decline (Brailean et al., 2018; Karlsson et al., 2015). For example, Gerstorf et al. (2011) found that older adults born between 1914 and 1948 experienced shallower declines between ages 50 and 80 on all five primary mental abilities than same-aged peers born between 1886 and 1913. In contrast, Finkel et al. (2007) found no evidence for differences in declines between ages 62 and 78 on verbal and spatial ability, memory, and speed among Swedish cohorts born between 1900 and 1925 versus between 1926 and 1948. And Thorvaldsson et al. (2017) found that Swedish older adults born in 1930 exhibited steeper declines between ages 70 and 80 on spatial ability, reasoning, and perceptual-motor speed than those born 1901 and 1906. In sum, it is not yet known whether rates and amount of cognitive declines have shifted over time.
Statement of Relevance
Psychological scientists have long asked whether and how the way people age cognitively has changed historically over the past decades. Here, we conducted a direct empirical test of two such hypotheses. Hypothesis 1 was that older adults today may age and decline more slowly, and Hypothesis 2 was that the onset of age-related declines may be postponed to later ages. Our empirical data did not support either of these two possibilities. Instead, our analysis indicated that the rate and extent of age-related cognitive declines have not changed historically, even though overall levels of cognitive functioning are much higher today. As a practical implication arising from our findings, older adults of today should on average reach functional impairment thresholds and be diagnosed with dementia at later ages than their same-aged peers in the past—yet, not because age has been kinder to them but only because the declines started from higher levels.
Is the Onset of Cognitive Declines in Old Age Postponed to Later Ages Today?
In an alternative scenario, the onset of decline has shifted to later ages—prototypical cognitive declines proceed in the same way as these always have but kick in later in life. Consider a case in which noticeable signs of cognitive decrements among earlier-born cohorts commence when individuals are 70 years old. When the onset of decline is postponed, noticeable signs of cognitive decrements among later-born cohorts may commence only when individuals are at the age of 75. The age curve is simply shifted to the right.
Expectations about a postponed onset of cognitive decline among later-born cohorts can be derived from the cognitive-reserve hypothesis (Stern, 2012). Better performance on cognitive tasks presumably indicates that people have more reserve capacity, which allows them to withstand larger pathology burdens before exhibiting cognitive decrements. With higher lifetime cognitive performance, later-born cohorts have, as per the Flynn effect, more reserve capacity than earlier-born cohorts and thus cope better and longer with accumulating age-related brain pathologies. Hence, we expected the onset of cognitive decline to manifest at older ages in later-born cohorts compared with earlier-born cohorts. To the best of our knowledge, no empirical study has directly examined historical change in the age of onset of cognitive decline.
The Present Study
Extending earlier work on historical changes in levels of cognitive functioning, our study examined cohort differences in within-person trajectories of perceptual-motor speed as older adults move through their 70s and early 80s. We took advantage of a unique opportunity to pool longitudinal-change data obtained over 30 years from independent studies, the Berlin Aging Study (BASE; from 1990 to 1993 onward) and the Berlin Aging Study II (BASE-II; from 2010 onward). Both studies measured perceptual-motor speed via Digit Symbol and Digit Letter tests, which are known as strong indicators of general intelligence and memory performance, have very good psychometric properties, and represent a sensitive proxy of cognitive decline in old age (Tucker-Drob et al., 2014). The longitudinal data provided an excellent opportunity to examine cohort differences in cognitive aging.
On the basis of conceptual perspectives (Gerstorf et al., 2020; Stern, 2012), we hypothesized and simultaneously tested whether later-born older adults perform at higher levels of cognitive functioning, exhibit shallower declines, and/or experience a later onset of declines than earlier-born older adults. To do so, we (a) harmonized Digit Symbol and Digit Letter test data from the two studies, (b) age-matched the longitudinal observations of the cohorts, and (c) fitted contemporary nonlinear growth models that orthogonalized within- and between-person age effects and accommodated retest effects. Our models also examined sex and education as potential predictors and moderators.
Open Practices
The data presented in this study are available on request from the BASE office (https://www.base-berlin.mpg.de/project-information/data-documentation) and the BASE-II office (https://www.base2.mpg.de/7549/data-documentation). To that end, we have established procedures for more than a decade that we have successfully implemented hundreds of times. Data cannot be made publicly available because they contain information that could compromise research participants’ privacy. The studies reported here were not preregistered. Our statistical analysis code is available in the Supplemental Material available online (see the Statistical Analysis Code section).
Method
Participants and procedure
Our analysis of cohort differences made use of 2,008 measurements of older adults’ perceptual-motor speed data obtained from matched subsamples of participants in two independent studies: BASE, launched in 1990/1993 (Lindenberger & Baltes, 1997), and BASE-II, launched in 2010 (Bertram et al., 2014). Because the studies are well established in the literature, here we present select details relevant to the current article and provide a more comprehensive description in the Supplemental Material. Data obtained from 228 BASE participants (earlier-born cohort, born between 1889 and 1922) were matched with data obtained from 583 BASE-II participants (later-born cohort, born between 1925 and 1948). Selectivity analyses reported in the Supplemental Material (see the Sample Description section) highlight two aspects of the samples. First, both samples represent positively select portions of populations living in the greater Berlin, Germany, area (specifically with respect to education and income). As a consequence, findings obtained may not necessarily generalize to less resource-rich populations. Second, and most important for interpretation of our findings, the selectivity analyses suggest that our case-matched control design (described below) provides a relatively conservative test of cohort differences because either the amount of positive selection was comparable across the cohort samples or the earlier-born participants were even more positively selected than the later-born participants.
Cognitive testing of the earlier-born BASE sample took place in the following years: At baseline Time 1 in 1990/1993 (intake assessment, intensive protocol), Time 2 in 1993/1994 (intake assessment), Time 3 in 1995/1996 (intake assessment, intensive protocol), Time 4 in 1997/1998 (intake assessment, intensive protocol), Time 5 in 2000 (intake assessment, intensive protocol), and Time 6 in 2004/2005 (intake assessment, intensive protocol). Cognitive testing of the later-born BASE-II sample took place in the following years: Time 1 in 2010, Time 2 and Time 3 in 2012/2013, Time 4 in 2016, Time 5 in 2017, and Time 6 in 2018/2019. Specifics regarding the number of data points included in our observation-matched analyses and the average age of participants are provided in Table 1. Of the 228 BASE participants included in the analysis, 92.11% provided longitudinal data, and of the 583 BASE-II participants, 48.54% provided longitudinal data. Of the 1,004 observations used to characterize each sample, 98.21% and 70.12% were longitudinal for BASE and BASE-II, respectively. Ethical approval for BASE was granted by the Berlin Medical Association. Ethics approval for BASE-II was granted by the ethics committee of the Charité-Universitätsmedizin Berlin and the ethics committee of the Max Planck Institute for Human Development, Berlin, Germany.
Sample Characteristics and Descriptive Statistics for the Digit Symbol Tests at Each Measurement Occasion, Separately for the Two Studies
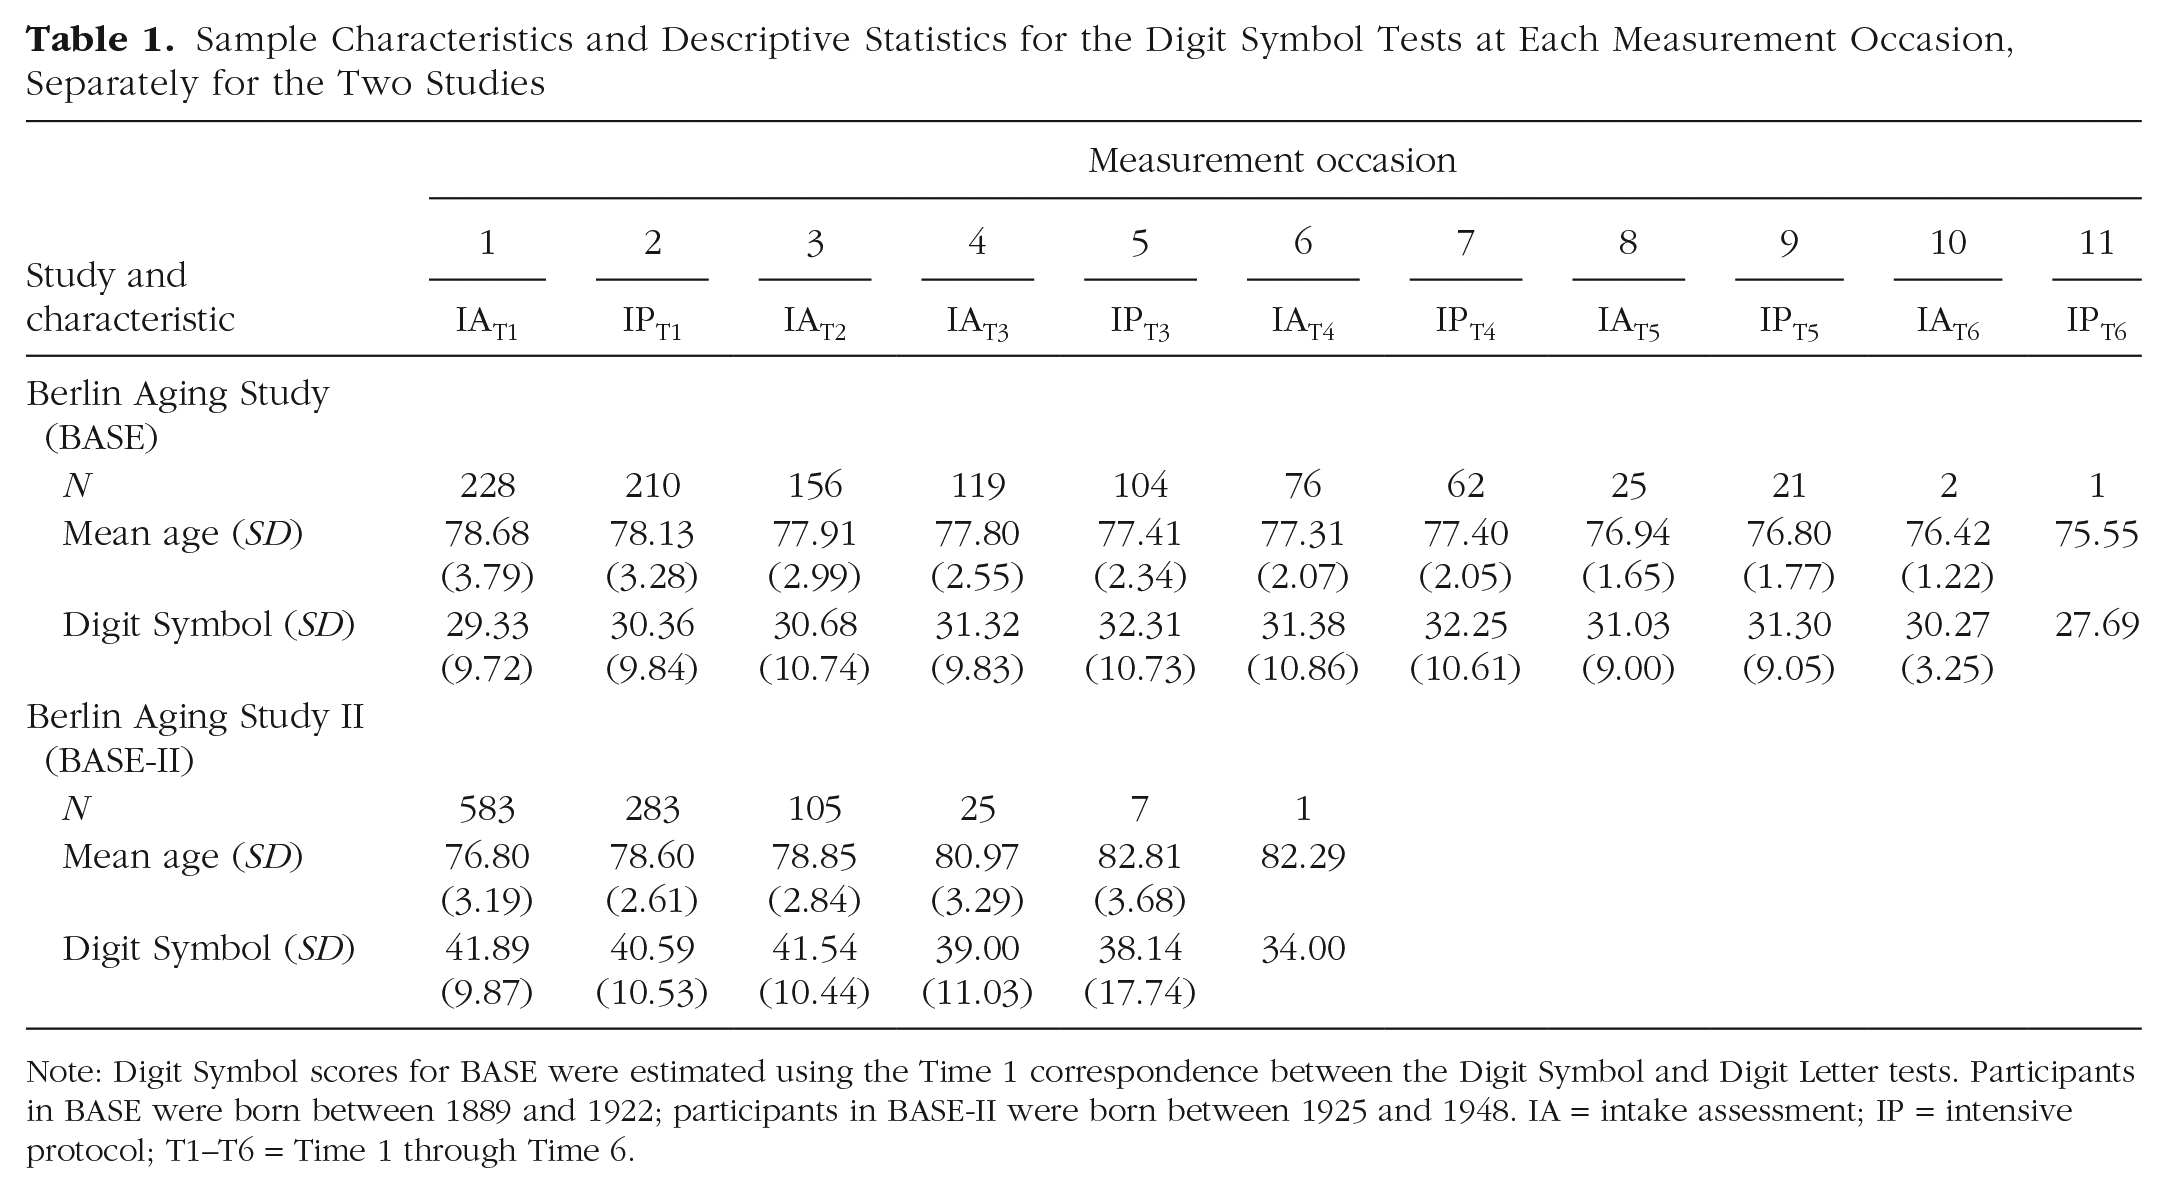
Note: Digit Symbol scores for BASE were estimated using the Time 1 correspondence between the Digit Symbol and Digit Letter tests. Participants in BASE were born between 1889 and 1922; participants in BASE-II were born between 1925 and 1948. IA = intake assessment; IP = intensive protocol; T1–T6 = Time 1 through Time 6.
Measures
Perceptual-motor speed
Cognitive performance was measured on multiple occasions using the Digit Letter Substitution test in BASE and the Digit Symbol Substitution test in BASE-II. The tests consist of a code box with nine digit-symbol/digit-letter pairs in which each digit is paired with a corresponding letter or symbol and rows of double boxes with a digit in the top box and an empty lower box. Participants were asked to fill in as many corresponding letters/symbols as possible in 90 s. Scores indicate the number of correctly filled boxes, with a penalty for wrong answers (score = total – wrong). Although the two studies assessed cognition in multiple ways, the Digit Symbol and Digit Letter tests were the only cognitive tests administered in a similar way across waves and studies.
At the Time 1 baseline assessment in BASE, participants completed both the Digit Letter and the Digit Symbol tests (r = .86). Data from the two tests were harmonized by calculating the individual-specific correspondences of the two test versions and using that mapping to obtain a pseudo-Digit Symbol score that was comparable across all persons at all waves (including Time 1) in both studies.
Age
Chronological age was measured at each observation as the difference (in number of years) between an individual’s birth date and the testing date.
Cohort
Cohort was articulated using a binary observation-specific base2 variable where 0 indicates that the observation was obtained from the earlier-born BASE sample and 1 indicates that the observation was obtained from the later-born BASE-II sample.
Test exposure (retest)
To account for retest effects, we measured individuals’ repeated exposure to the Digit Symbol and Digit Letter tests in two ways: as 10 and five dummy-coded variables (0 or 1) for each measurement occasion after the first in BASE and BASE-II, respectively, and as a single variable that was the count of the number of prior test exposures.
Correlates
Sociodemographic variables included binary variables for sex (woman = 1, man = 0) and education (number of years necessary to obtain the final school degree).
Data preparation
To accommodate differences in average ages between the two samples, we used propensity-score matching (Thoemmes & Kim, 2011). Specifically, we used a 1:1 matching method to select for each observation from BASE (2,108 observations in total) a matching observation from BASE-II (6,233 observations in total) that was obtained at the same (or as similar as possible) age. After calculating the between-group distance matrix (using the logit-transformed propensity scores), we used a caliper-matching algorithm to identify nearby matches. With a caliper distance (maximum allowable distance between matched observation) of c = 0.144 standard deviations, cohort differences in age were no longer reliably different from 0 at p < .05. Observations obtained from the earlier-born BASE cohort were matched with the most similar observation obtained from the later-born BASE-II cohort only if this observation fell within the caliper distance. With this procedure, a suitable match for 1,004 observations from each cohort could be identified. Figure 1 shows the distribution of matched longitudinal observations across chronological age for the BASE and BASE-II studies. Between the ages of 70 and 88 years, data are directly comparable between the two studies.
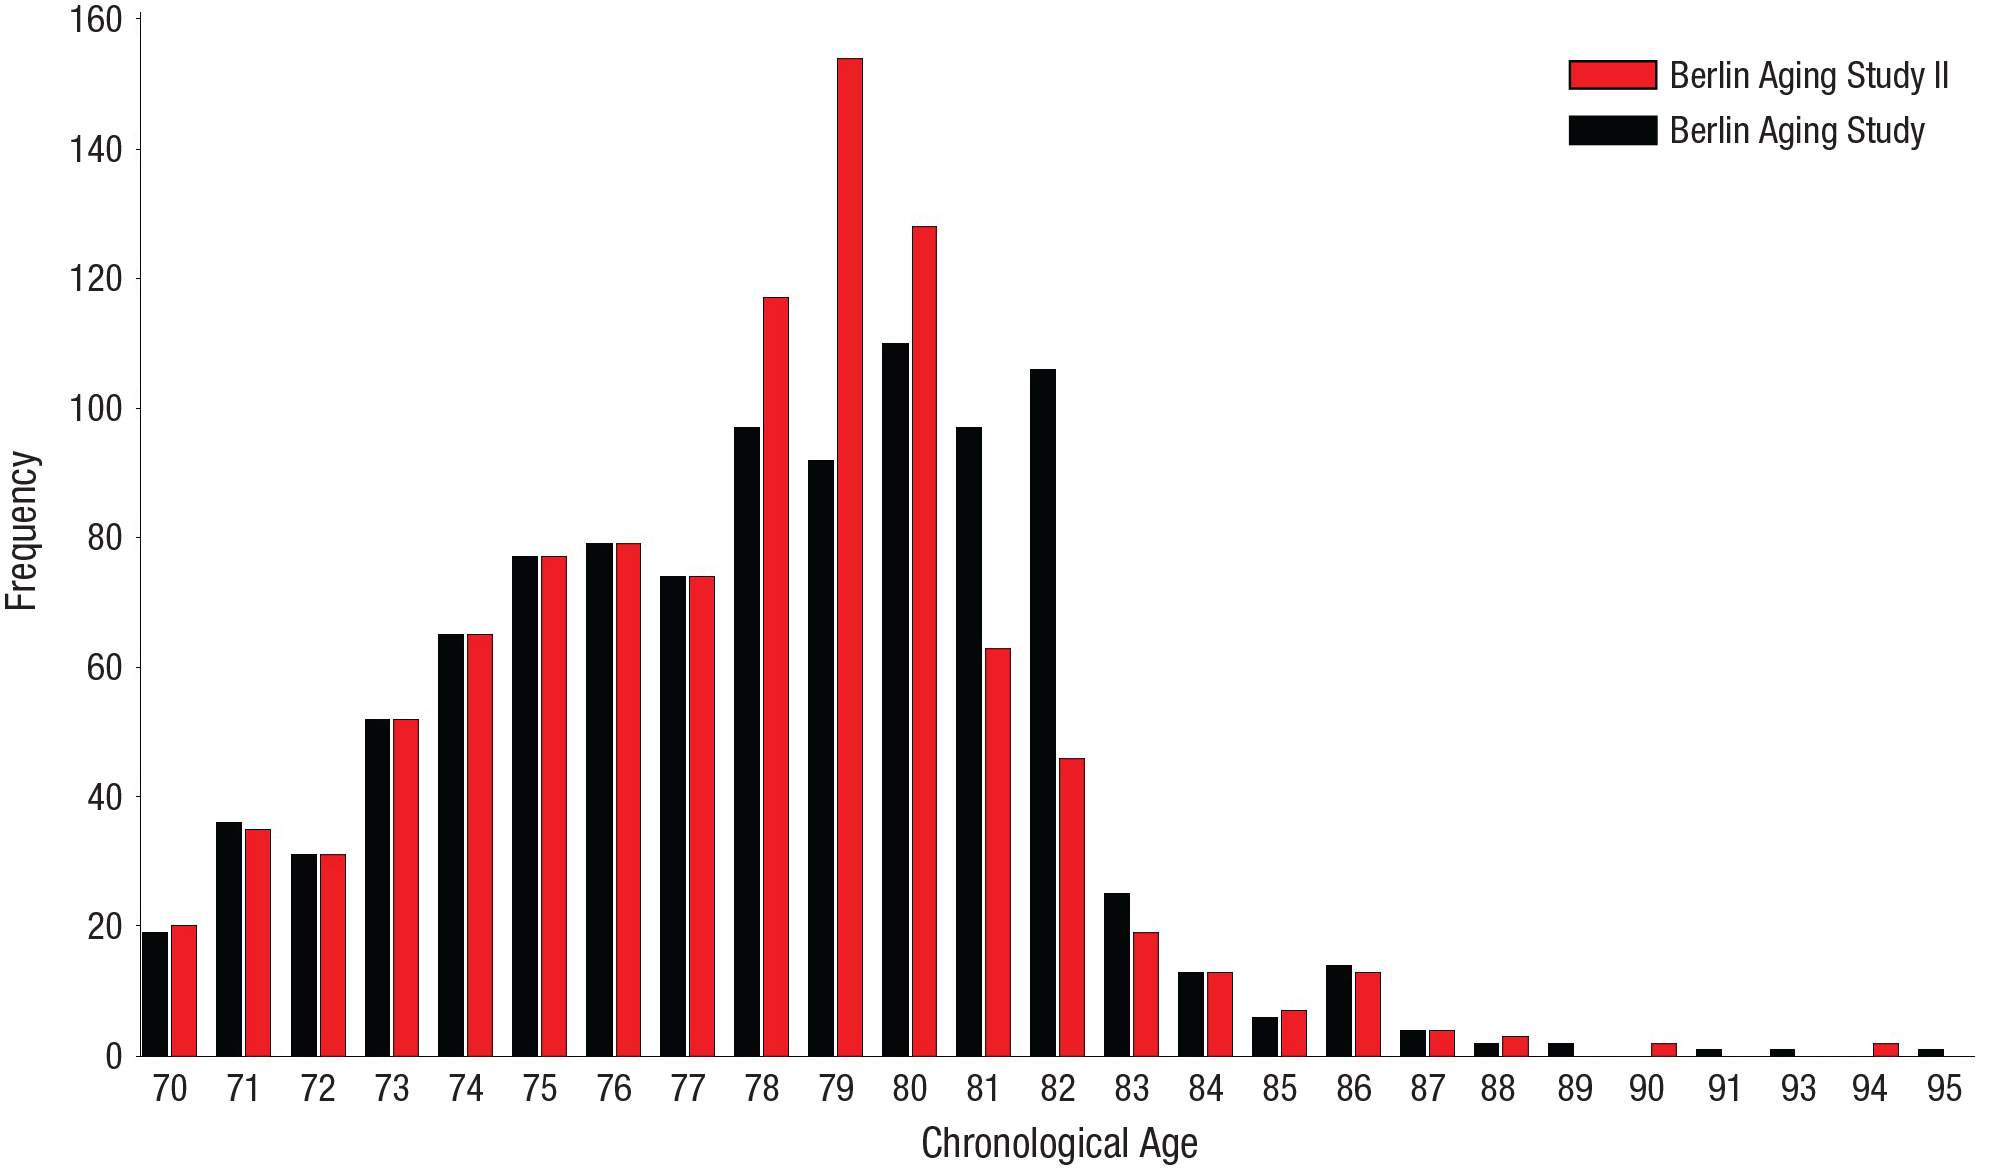
Frequency of observations across chronological age, separately for the earlier-born Berlin Aging Study I and later-born Berlin Aging Study II participants. From each cohort, 1,004 age-matched observations were available for analysis.
Data analysis
Our examination of cohort differences made use of nonlinear growth models (Grimm et al., 2016) implemented in a multilevel modeling framework that accommodated the nested nature of the data (repeated assessments nested within individuals). A classical person-mean centering strategy was used to orthogonalize between- and within-person age effects (Raudenbush & Bryk, 2002). Such disaggregation of between-person and within-person effects within the multilevel framework entails centering covariates that are repeatedly assessed in time because they carry information about both between-person differences (e.g., some participants are overall older than others) and within-person changes (e.g., participants get older across repeated assessments). To disentangle within- and between-person age effects, we proceeded as follows. First, for each individual i, we calculated the mean of their repeated age values. This person-specific mean value is thus a between-person predictor, which we call bpAge i . Then, for every individual, we subtracted bpAge i from their repeated age values across times t and called the resulting differences wpAge it , which was a within-person covariate. Thus, we estimated between-person age effects via bpAge i and within-person age effects via wpAge it . To keep the interpretation of the overall intercept consistent, we centered the person-specific means variable bpAge i at the overall sample mean (77.80 years). For similar disaggregations, see Thorvaldsson et al. (2020).
The hypotheses that later-born cohorts of older adults exhibit shallower cognitive declines or later onset of cognitive decline than earlier-born cohorts were articulated using two pairs of exponential growth models (Ghisletta et al., 2020).
Are old-age declines in perceptual-motor speed shallower today?
The first pair of models was specifically designed to test for cohort differences in the amount of exponential decline. The harmonized Digit Symbol/Digit Letter outcome Yit, for individual i at age t, were first modeled as shown in Equation 1:
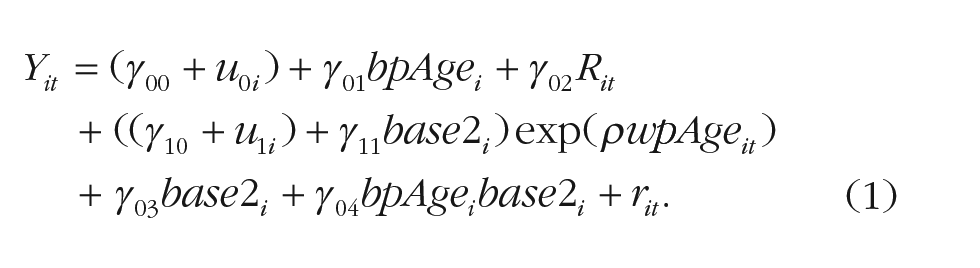
Equation 1 specifies an exponential rate of decline, estimated by the parameter ρ, between wpAge it and the perceptual-motor speed outcome Yit. The overall amount of exponential decline and the cohort effect (Base 2, comparing BASE-II participants with the reference group of BASE participants) on this decline are estimated by the parameters γ10 and γ11, respectively. The parameter γ00 represents the overall intercept, whereas γ01, γ03, and γ04 represent the shift from the intercept value due to the between-person age effect, the cohort effect, and their interaction, respectively. We also considered two ways that retest effects might manifest. Using 10 and five dummy-coded variables (0 or 1) for each measurement occasion starting at the second in BASE and BASE-II, respectively, we estimated a separate retest effect after each repeated exposure, such that estimated retest effects may diminish in magnitude as time passes. Using a single predictor counting the number of individual-specific test exposures, articulated by the Rit variable in Equation 1, we estimated a general linear retest effect that supposes an equal-magnitude effect across all adjacent occasions. The former approach estimates more parameters than the latter and so model parsimony must also be considered when statistically comparing the two. We found that the latter was more adequate in describing retest effects of the perceptual-motor speed indicator in both cohorts. The extent of improvement with each retest is estimated by γ02.
Finally, we estimated individual differences around the overall intercept, represented by u0i, and around the amount of exponential decline, with u1i. As customary, any differences between the expected and the observed trajectories are captured by individual- and age-specific residuals rit. Classical assumptions are that random effects (u0i and u0i) are centered at zero, normally distributed, with variance τ20 and τ21, and may covary, with covariance τ01. The residuals (rit) are also centered at zero and normally distributed, with variance σ2.
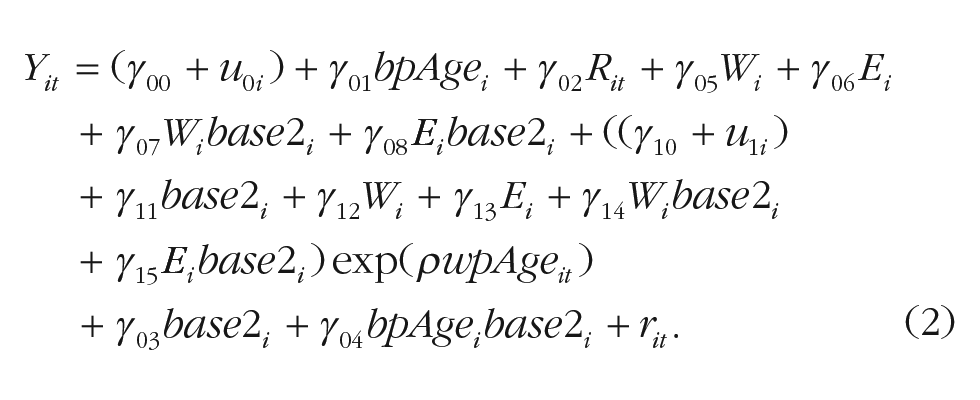
In a second model, we additionally included sex (Wi) and education (Ei; centered at its mean), with estimated effects γ05 and γ06; their two-way interaction with the cohort variable, estimated at γ07 and γ08; their effects on the amount of exponential decline, estimated at γ12 and γ13; and their two-way interaction effects with cohort on the amount of exponential decline, estimated at γ14 and γ15. Specifically, the model was expanded as shown in Equation 2:
Is the onset of old-age declines in perceptual-motor speed postponed to later ages today?
The second pair of models was specifically designed to test for cohort differences in the age of onset of exponential decline. Here, the Digit Symbol/Digit Letter outcome Yit, for individual i at age t, was first modeled as shown in Equation 3:
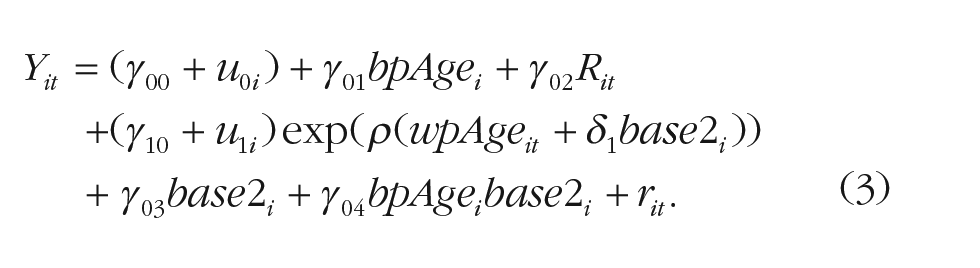
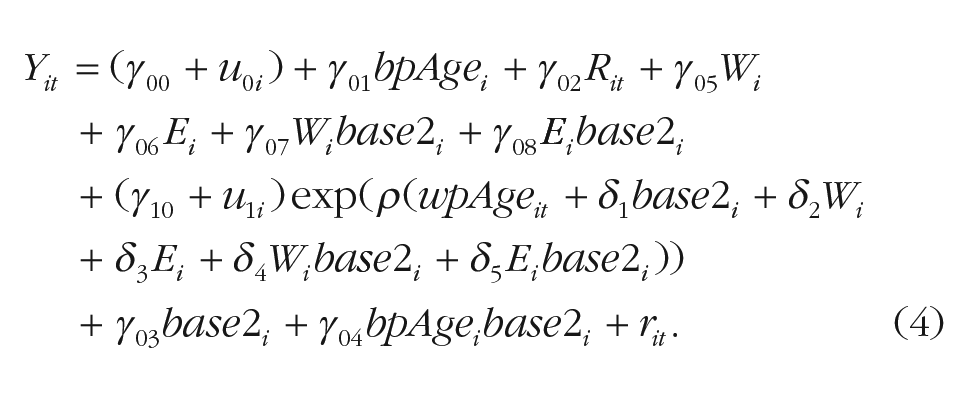
The difference between the models in Equations 1 and 3 is that the cohort effect is no longer included as a moderator of the amount of cognitive decline but instead as a moderator of onset of decline, shifting the age of its onset by δ1 years. As in the previous pair of models, we then added sex and education to moderate the age of onset by direct effects δ2 and δ3 and in interaction with cohort, δ4 and δ5. Specifically, the model was expanded as shown in Equation 4:
The exponential growth models were estimated with SAS PROC MIXED, with its default estimator (adaptive Gauss-Hermite quadrature). To check the robustness of the solutions, we also used an alternative quicker estimator (first-order method) and consistently obtained virtually identical parameter estimates. Incomplete data were accommodated under usual missing-at-random assumptions, with included variables (age, sex, education, cognition) serving as attrition-informative variables that alleviate longitudinal selectivity for the outcome variables (Grimm et al., 2016). We cannot rule out the possibility that our results were affected by limited statistical power because there is no clear guidance on how to calculate statistical power for the models estimated in this study. However, there are several reasons to assume that our models should have sufficient power to detect relevant differences and even more so than commonly used models such as those using linear and quadratic change (for a detailed discussion of statistical power in multilevel models, see the Supplemental Material).
Results
Are declines in perceptual-motor speed shallower today?
Results from the first pair of exponential growth models testing for cohort differences in the amount of cognitive decline are reported in Table 2. Average performance (γ00) of the earlier-born BASE sample on the Digit Symbol test at age 77.80 years (the overall mean age of the two samples) was 40.41 symbols (p < .01). The between-person age effect, γ01 = −0.36 (p < .01), indicates that every additional year of age in the between-person difference space of the BASE sample was associated with lower performance by 0.36 symbols. The linear retest effect, estimated at γ02 = 0.90 (p < .01), means that, on average, BASE participants increase their performance by 0.90 symbols with each additional test exposure (i.e., at each additional assessment), after the first. Parameter estimates of the amount of exponential decline (γ10 = −12.40, p < .01) and the exponential rate of decline (ρ = 0.09, p < .01) combined indicate that BASE participants experienced substantial within-person age-related decline after age 70 years that was accelerating in advanced ages. For example, the average amount of decline between ages 72 and 74 years was 1.44 symbols, whereas the average amount of decline between ages 82 and 84 was 3.52 symbols.
Exponential Growth Models With Cohort Differences in the Amount of Exponential Decline
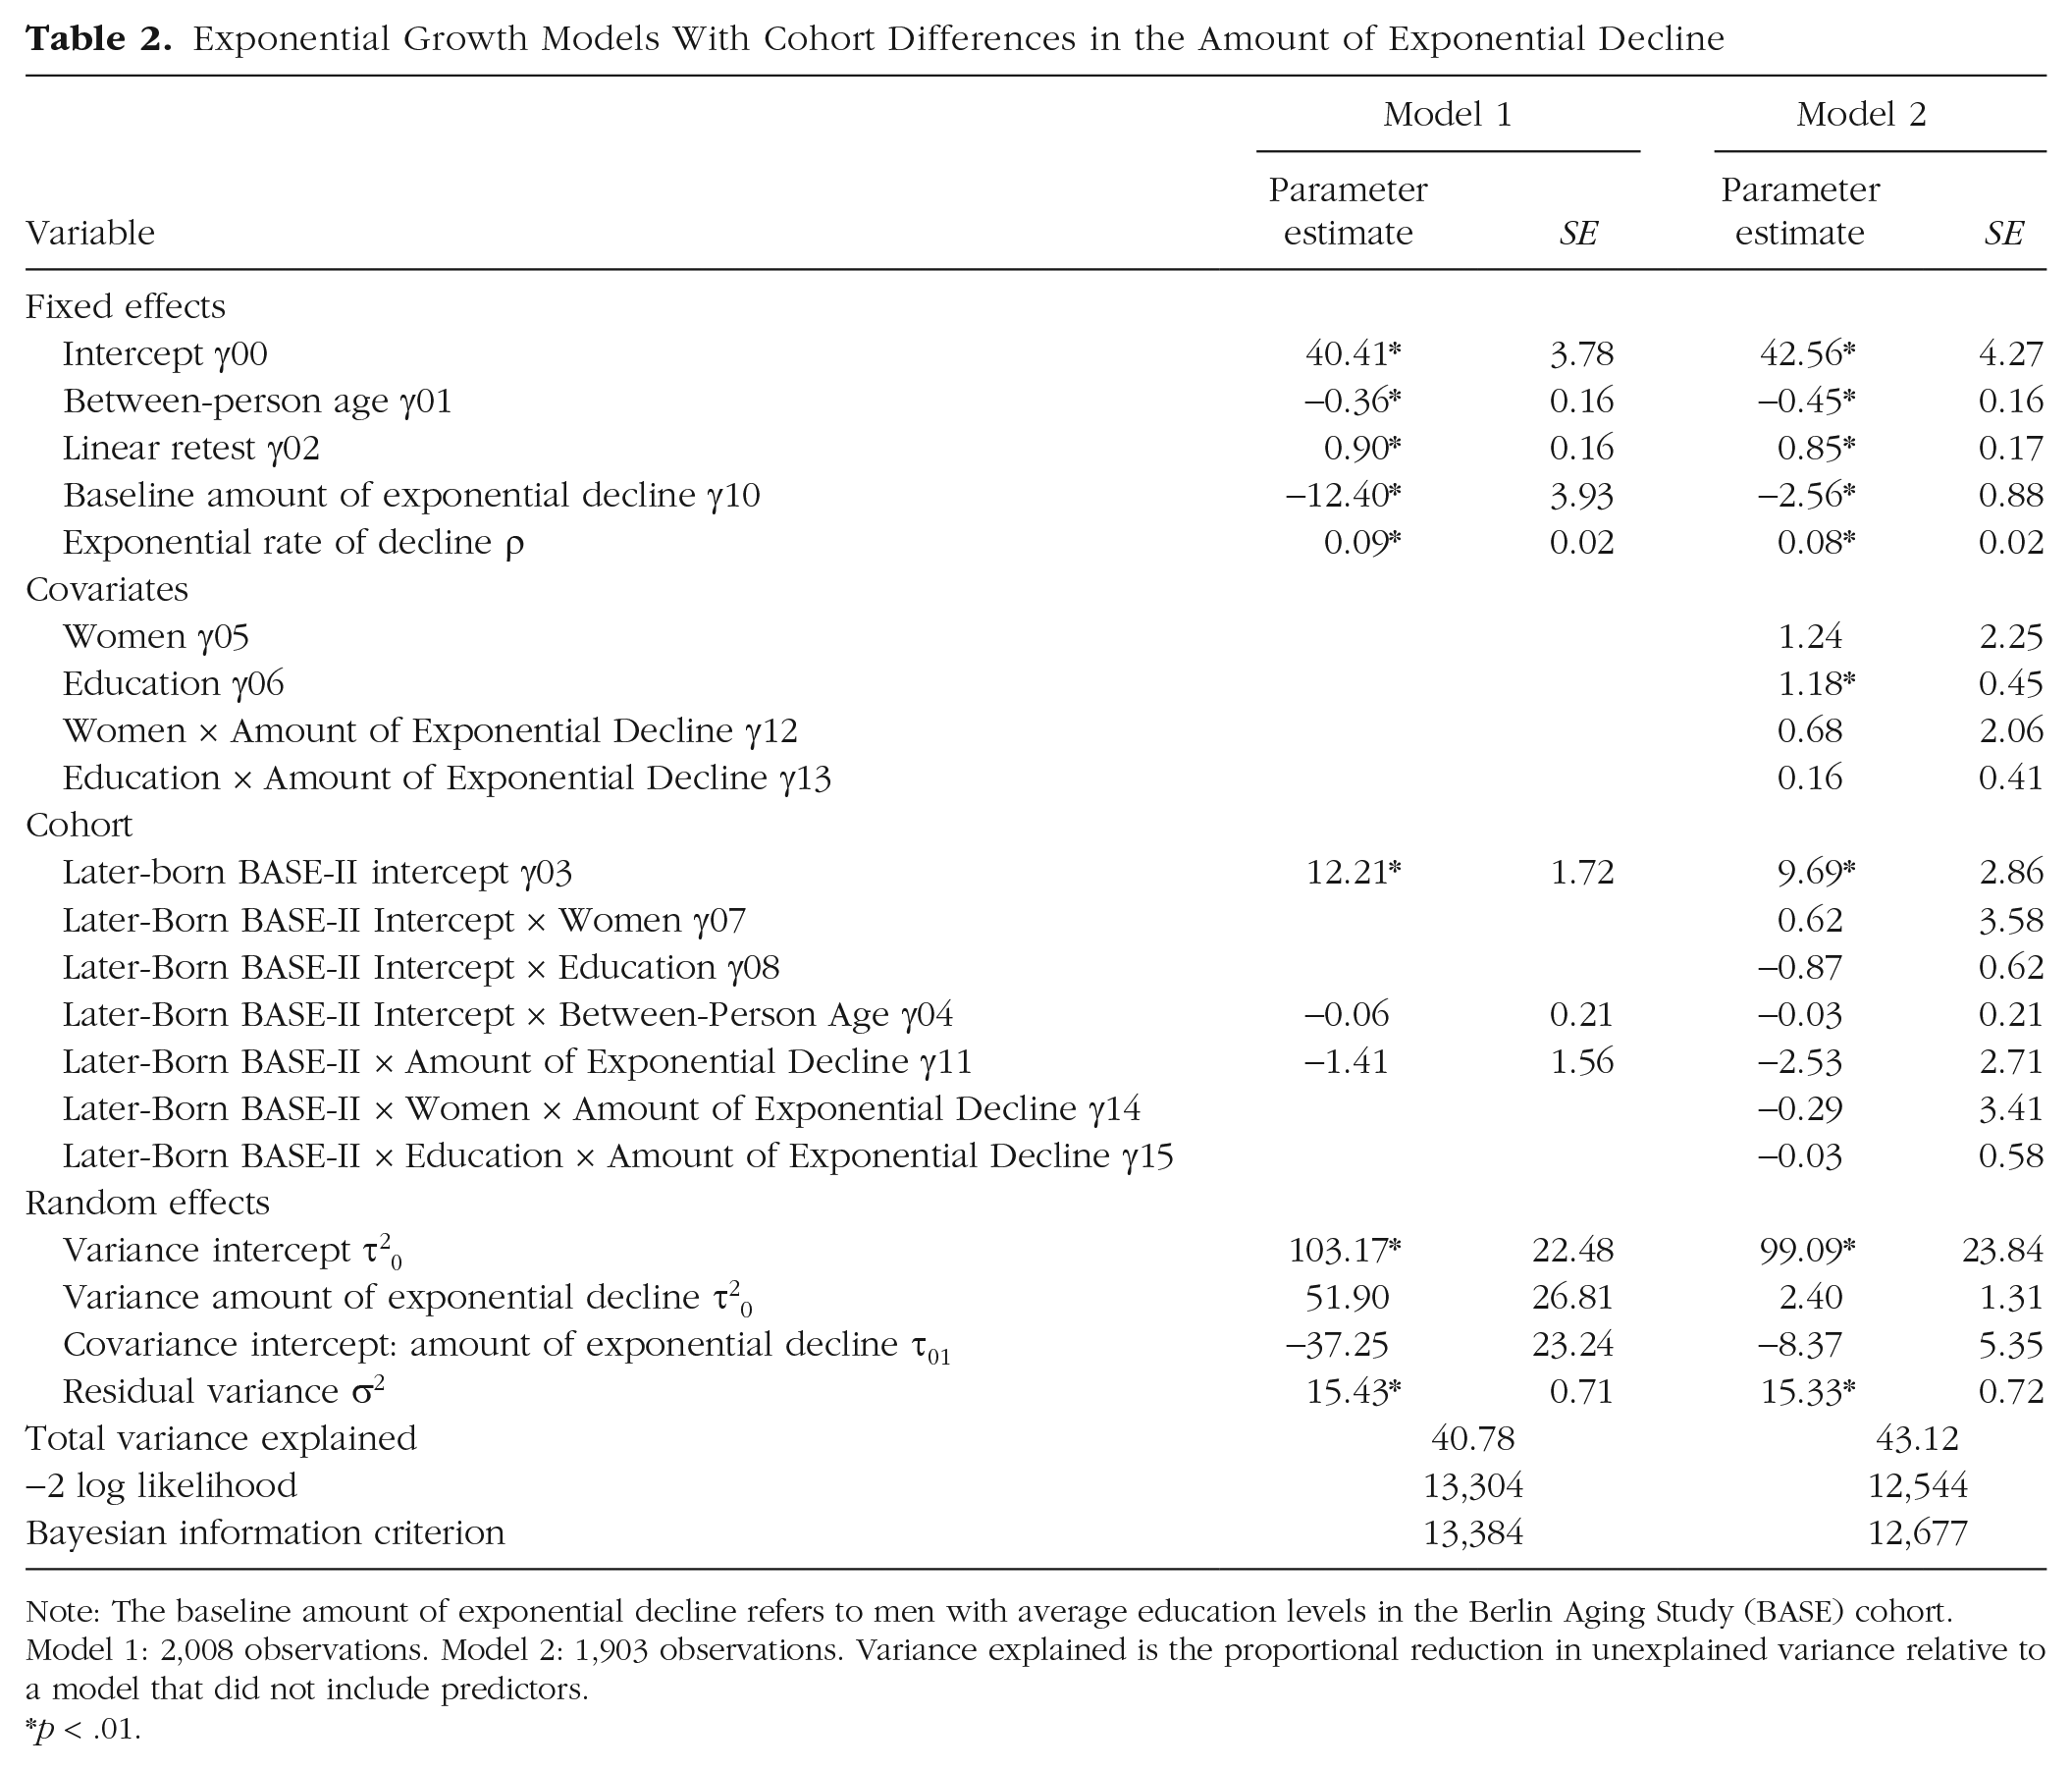
Note: The baseline amount of exponential decline refers to men with average education levels in the Berlin Aging Study (BASE) cohort. Model 1: 2,008 observations. Model 2: 1,903 observations. Variance explained is the proportional reduction in unexplained variance relative to a model that did not include predictors.
p < .01.
Of primary interest for the hypotheses were the parameters indicating the extent of cohort differences (between the BASE and BASE-II participants) in level of Digit Symbol/Digit Letter performance and amount of age-related decline. In line with hypotheses and prior findings, the main effect of cohort, γ03 = 12.21 (p < .01), indicated that at age 77.80 years, the average participant in the later-born BASE-II cohort outperformed the average participant in the earlier-born BASE cohort by 12.21 symbols. Converted into “years” using results from prior meta-analysis where age-related differences were quantified as being about 0.46 symbols per year (as per Hoyer et al., 2004), the differences in Digit Symbol/Digit Letter performance seen here between cohorts assessed 20 years apart is about the same size as would be expected for 25 years of age difference. Converted to Cohen’s effect sizes, the cohort difference in level translates into a standardized difference (see Table 2: γ03 / √ τ20 or 12.21/√103.17) of d = 1.20; and quantified as pseudo-R2, specifically as proportional reduction in unexplained variance relative to a model that did not include the cohort variable revealed that the cohort variable accounted for 11.9% of the variance in the intercept.
Contrary to our hypotheses, results showed no evidence that the cohorts differed in the between-person age gradient, γ04 = −0.06 (p > .10), or in the amount of within-person age-related exponential decline, γ11 = −1.41 (p > .10). Figure 2 shows the model-implied means of the exponential growth model (with linear between-person age gradient and linear retest effects) for cognitive aging trajectories of perceptual-motor speed between the matched BASE (in black) and BASE-II (in red) samples. The two bold lines are almost parallel. Indeed, the overall amount of cognitive decline between ages 72 and 84 for the average BASE and BASE-II participants amounted to 14.16 symbols and 15.77 symbols, respectively. If anything, the size of the cohort difference was larger at age 72 than at age 84 (11.37 vs. 9.77).
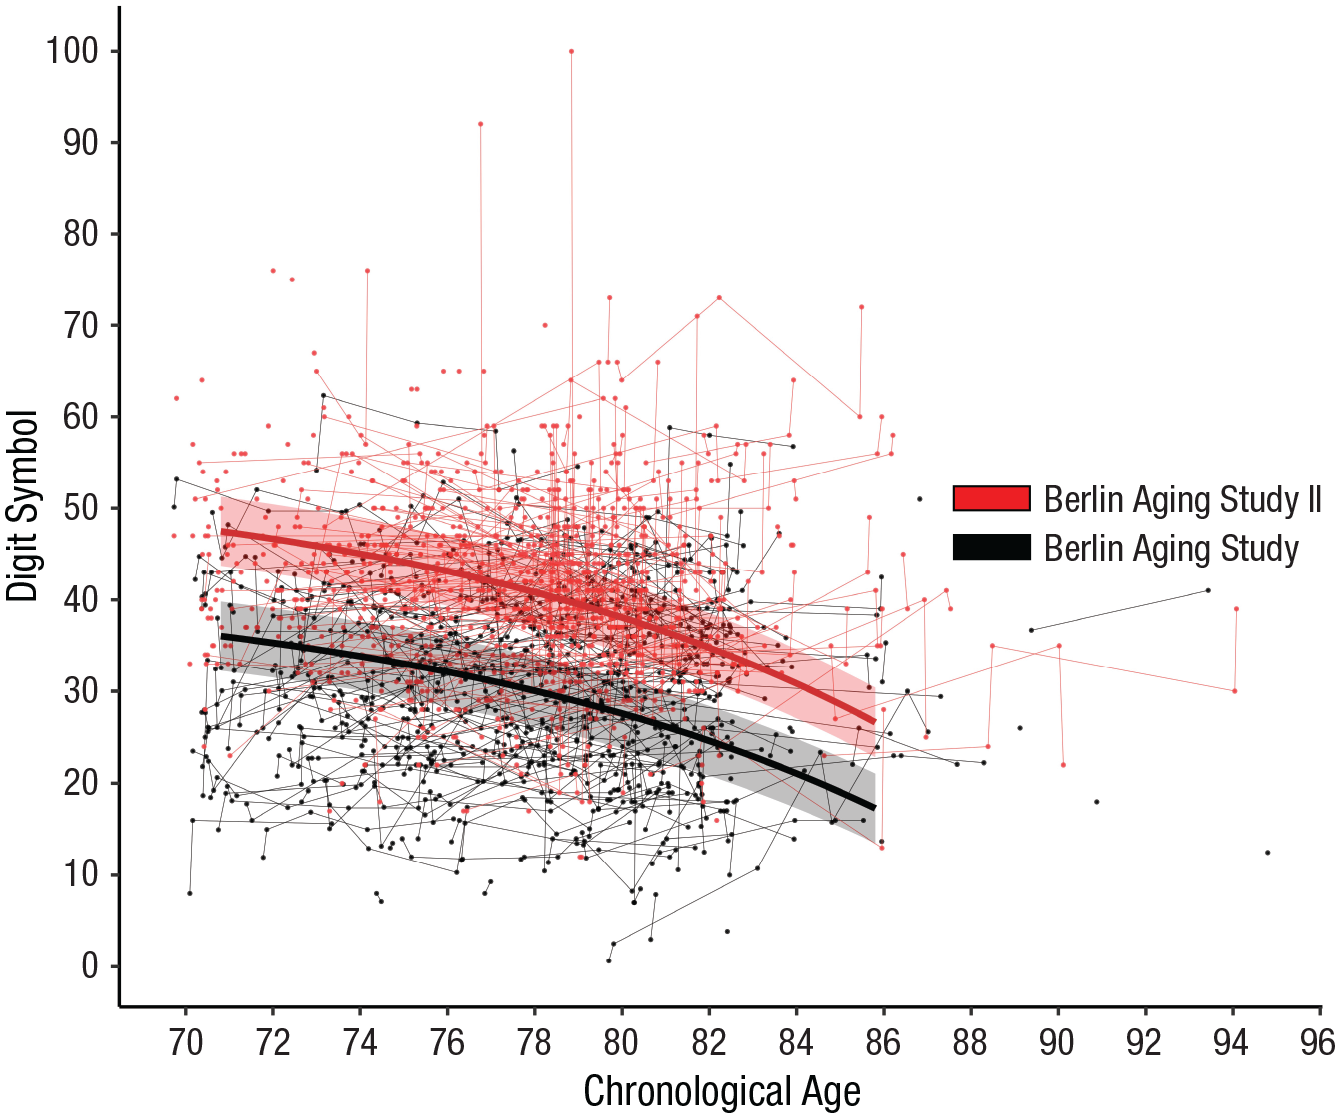
Individual trajectories and model-implied means from the exponential change model for cognitive aging trajectories of perceptual-motor speed (measured via the Digit Symbol test), separately for the matched Berlin Aging Study and Berlin Aging Study II samples. Error ribbons around the mean trajectories are based on the standard error of the intercept. When tested at the same ages, the later-born BASE-II cohort performed substantially better on the perceptual-motor speed measure than the earlier-born BASE cohort (at age 78, d = 1.20, or more than 25 years of age differences). Most importantly, age-related trajectories were statistically parallel between the two cohorts, with no differences in the amount or rate of exponential age-related declines and in the age of onset of decline.
Looking at Model 2 in Table 2 reveals that, as expected, more years of education were associated with better performance on the Digit Symbol test (γ06 = 1.18, p < .01). However, there was no evidence for other main effects or that sex and education were moderating any of the cohort effects.
Is the onset of declines in perceptual-motor speed postponed to later ages today?
Results from the second pair of exponential growth models testing for cohort differences in the onset of cognitive decline are reported in Table 3. Similar to Models 1 and 2, results showed a sizeable level difference between cohorts (γ03 = 10.67), with the pseudo-R2 indicating that the cohort variable accounted for 14.1% of the variance in the intercept. In Model 3, the parameter of primary interest, δ1 = −0.12 (p > .10), was not significantly different from zero, indicating that there was no evidence of a cohort difference in the age of onset of exponential decline. The pattern of results was similar when, in Model 4, sex and education were included as covariates. There was still no evidence of cohort differences in the age of onset of exponential decline (δ1 = −0.94, p > .10). As expected, differences in education were related to level of performance on the Digit Symbol/Digit Letter tests (γ06 = 1.58, p < .01) for the earlier-born BASE cohort, but now with the additional caveat that when we assumed the two cohorts can differ only in the intercept and the onset of decline, the education advantage is almost entirely erased for the later-born BASE-II cohort (γ08 = −1.11, p < .01).
Exponential Growth Models With Cohort Differences in the Age of Onset of Exponential Decline
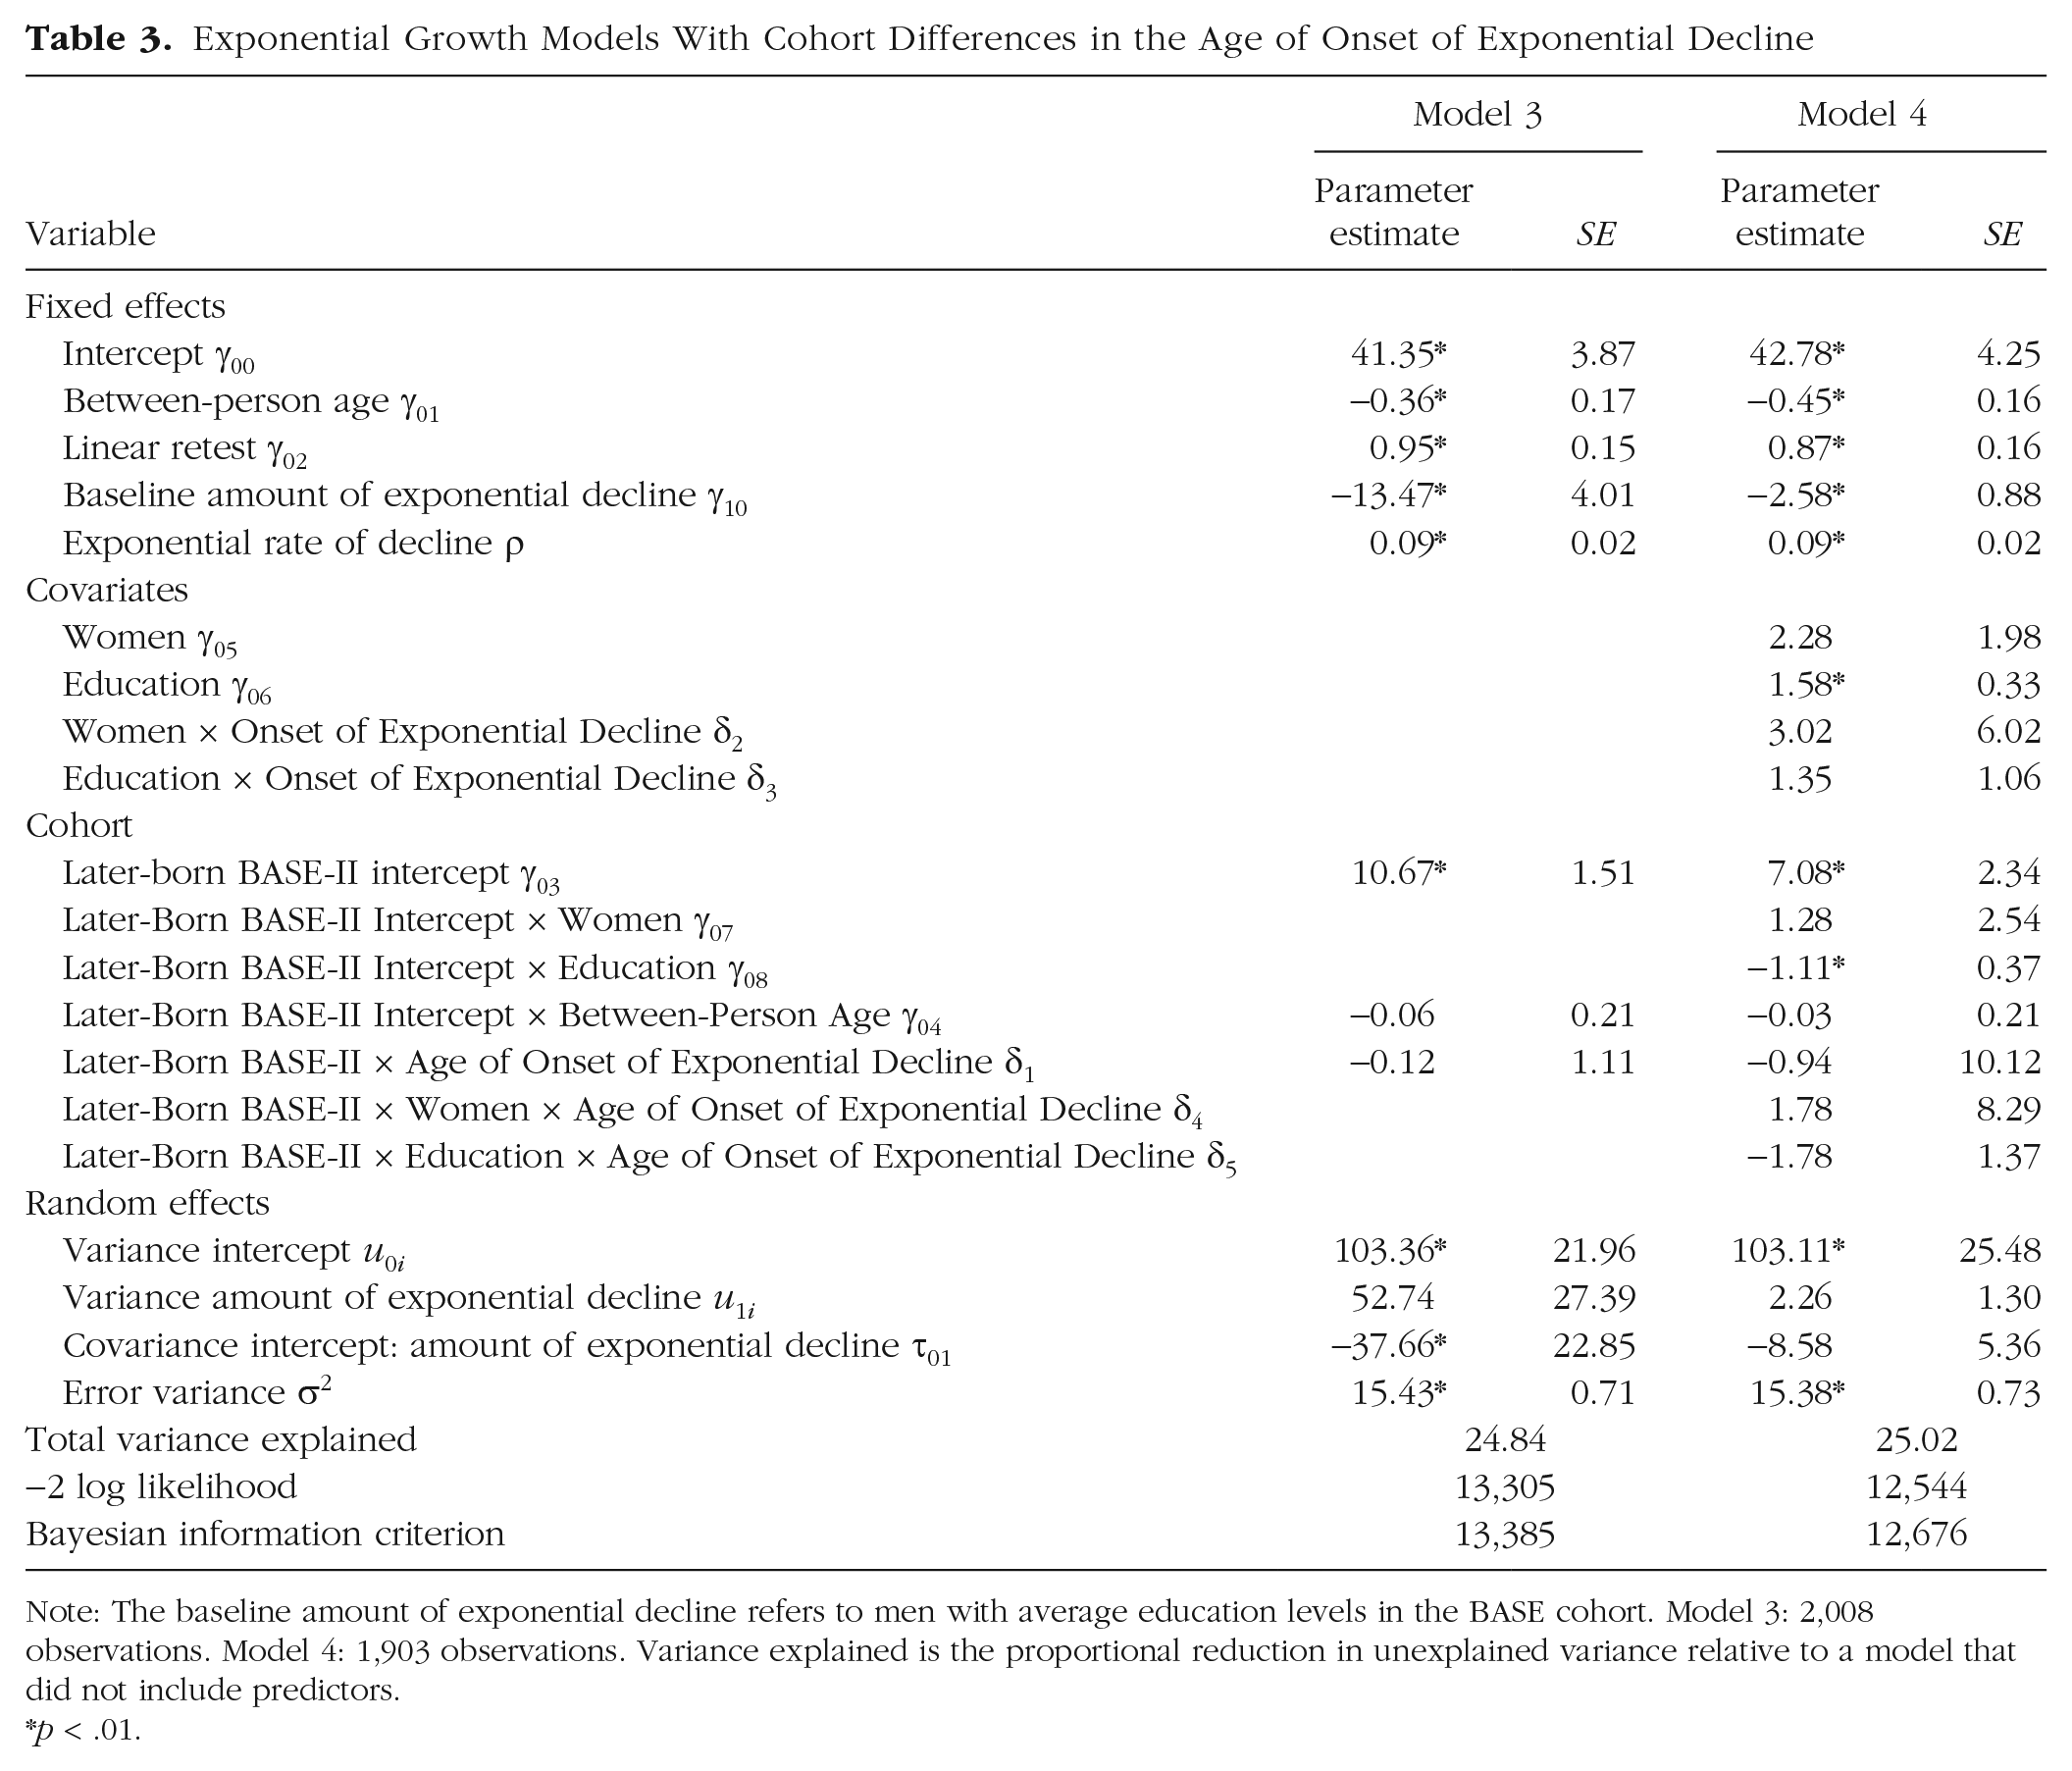
Note: The baseline amount of exponential decline refers to men with average education levels in the BASE cohort. Model 3: 2,008 observations. Model 4: 1,903 observations. Variance explained is the proportional reduction in unexplained variance relative to a model that did not include predictors.
p < .01.
Comparisons of the relative fit of the two pairs of models shown in Tables 2 and 3 reveal that both sets of models fit the data equally well (e.g., Model 1 in Table 2 and Model 3 in Table 3: Bayesian information criterions = 13,384 vs. 13,385). This further suggests that rate and amount of decline as well as age of onset of decline are basically identical across the two cohorts. The lack of differences between models means that we do not have any evidence that either of our two conceptual scenarios is better than the other.
We conducted a series of follow-up analyses to test the robustness of our findings. First, we estimated models where the change function was linear and quadratic (i.e., a second-degree polynomial). These follow-up models revealed substantively the same pattern of results with large intercept differences between the cohorts but no cohort differences in either the between-person age gradients, the linear within-person age gradients, or the residualized quadratic within-person age gradients. Second, we systematically tested whether the retest effects differed across cohorts, but none of the cohort-by-retest effects were significantly different from zero. This suggests that eventual group differences in cognitive change were not absorbed by the retest parameters. Instead, the earlier-born cohort of older adults living in Berlin in the 1990s benefitted from repeated test exposure as much as the later-born cohort of older adults living in Berlin in the 2010s.
Discussion
Our findings indicate that later-born older Berliners tested in the 2010s outperformed their earlier-born age peers tested in the 1990s. Contrary to our hypotheses, results showed that later-born older adults did not exhibit shallower declines on perceptual-motor speed or a later onset of decline. The later born cohort’s cognitive performance was shifted upward from the earlier-born cohort’s, but trajectories of cognitive aging were parallel.
Historical change in cognitive performance
Consistent with the Flynn effect (Pietschnig & Voracek, 2015), results from our carefully matched longitudinal data obtained from same-aged older adults tested two decades apart provide more evidence of historical change in levels of performance. The effect size (d = 1.20) is striking and even larger than that obtained in our earlier time-lagged cross-sectional analysis of a subset of participants (Gerstorf et al., 2015: d = 0.85). This constitutes one more set of evidence that cultural changes over the last 30 years, including better access to individual resources (e.g., quantity and quality of education) and innovations in science and technology (e.g., advances in medicine and nutrition; Drewelies et al., 2019), have contributed to improved cognitive performance in old age. Future work should detail how the many different mechanisms that drive improvements in unique and specific resource constellations can further improve cognitive functioning (and productivity) of older adults.
Are old-age cognitive declines today shallower or postponed to later ages?
Our results parallel those of studies that did not find history-graded improvements in cognitive aging trajectories (e.g., Brailean et al., 2018) but differ from studies that had found such improvements (e.g., Dodge et al., 2014). Beyond similarities in the calendar years participants were born and tested, the discrepant findings may result from country-level differences in health care and differences in the studies’ measurement and analysis procedures.
In the 1990s, studies had documented that elevated blood pressure in midlife (rather than old age) is predictive of steeper cognitive declines in old age (Launer et al., 1995). Since then, widespread prescription and use of effective anti-hypertensive medication may have weakened those links. However, implementation in Germany occurred about a decade later than in the United States and other nations (Wolf-Maier et al., 2003). Consequently, our later-born older Berliners may have already been too old to have benefitted from widespread changes in delivery of health care. Back when this generation of older adults was in midlife, blood pressure treatment had not yet improved (Koenig et al., 2018). Going forward, cross-national studies can be used to test hypotheses about long-latency treatment effects of midlife blood pressure for cognitive decline in old age.
Interestingly, studies that reported cohort differences in rates of cognitive decline either did not include perceptual speed measures (Dodge et al., 2017 and Gerstorf et al., 2011: reasoning, verbal meaning, and memory), did not find cohort effects on perceptual speed measures (but on verbal fluency and working memory; Grasset et al., 2018), or found that cohort differences in perceptual speed measures were smaller than for other measures (executive functions; Dodge et al., 2014). Although measures of perceptual speed capture age-related declines well, they may not be very sensitive to history-graded changes in decline. More systematic charting of how cohort differences manifest across a wider set of aging-sensitive (e.g., memory) and more aging-resilient (e.g., crystallized) abilities is needed.
Our analytic approach also differed from approaches used in other studies. The nonlinear growth-modeling framework allowed us to account for a variety of potential confounds. First, the observation-level age matching between BASE and BASE-II samples drawn from the same underlying population provided a strong foundation for testing differences between same-age observations obtained from different cohorts. Second, we modeled and accounted for retest effects that often emerge with repeated test taking. Third, our model explicitly separated between-person from within-person age effects (age gradients vs. intraindividual change), allowing for more precise testing of hypotheses about history-graded shifts in cognitive aging—a distinctly intraindividual process.
To our knowledge, this is the first study to directly test cohort differences in the age of onset of cognitive decline. Contrary to the cognitive-reserve hypothesis, results showed no evidence for a shift in the onset of decline. However, this finding is consistent with both the preserved-differentiation perspective (Salthouse, 2006), by which level differences established in early life are maintained and carried forward into old age, and recent meta-analyses showing that differences in education have substantial effects on levels of cognitive functioning but null effects on rates of cognitive aging (Lövdén et al., 2020) or brain aging (Nyberg et al., 2021). It seems that history-graded improvements resulting from early-life education, cognitive stimulation, and health care persist into old age, but not because aging processes have been any kinder.
Limitations and future directions
Several limitations in our design and sample must also be noted. A time window of two decades may suffice to identify historical change in levels of perceptual-motor speed but may not be long enough to identify historical change in key features of cognitive aging trajectories. Further, because our assessments were obtained only in old age, we were unable to disentangle late-life processes from those unfolding during early life and mid-life. With the Flynn effect reversing among young men (Bratsberg & Rogeberg, 2018), future research should systematically examine how history-graded changes may proceed differentially throughout life.
Participants were drawn from one geographical region and represent a positively selected population segment. One key question is whether our findings apply to resource-poor population segments. Conceptual perspectives on manufactured survival (Olshansky & Carnes, 2019) suggest that some older adults today carry disease burdens longer than did older adults in the past. Future research should carefully examine whether cohort differences in decline emerge in more diverse samples and are moderated by access to resources.
Conclusions
The prospect of more favorable cognitive aging trajectories holds promise for extending the window of productive years for an aging population. For perceptual-motor speed it seems, though, as if the extensions are currently reached through a general upward shift of individuals’ lifetime levels of cognitive functioning, not through slowing of the rate of cognitive decline or postponement of the onset of these declines. Historical changes in cognitive reserve manifest themselves as profound level differences but do not offset or alleviate aging-related decline on this key cognitive ability.
Supplemental Material
sj-docx-1-pss-10.1177_09567976221118541 – Supplemental material for Today’s Older Adults Are Cognitively Fitter Than Older Adults Were 20 Years Ago, but When and How They Decline Is No Different Than in the Past
Supplemental material, sj-docx-1-pss-10.1177_09567976221118541 for Today’s Older Adults Are Cognitively Fitter Than Older Adults Were 20 Years Ago, but When and How They Decline Is No Different Than in the Past by Denis Gerstorf, Nilam Ram, Johanna Drewelies, Sandra Duezel, Peter Eibich, Elisabeth Steinhagen-Thiessen, Stefan Liebig, Jan Goebel, Ilja Demuth, Arno Villringer, Gert G. Wagner, Ulman Lindenberger and Paolo Ghisletta in Psychological Science
Footnotes
Acknowledgements
This article reports data from the Berlin Aging Study (BASE; https://www.base-berlin.mpg.de/en) and the Berlin Aging Study II (BASE-II; ![]() ). The BASE was initiated by the late Paul B. Baltes in collaboration with Hanfried Helmchen, psychiatry; Elisabeth Steinhagen-Thiessen, internal medicine and geriatrics; and Karl Ulrich Mayer, sociology. Principal investigators for the Berlin Aging Study II are Lars Bertram, Ilja Demuth, Johanna Drewelies, Sandra Duezel, Denis Gerstorf, Ulman Lindenberger, Graham Pawelec, Elisabeth Steinhagen-Thiessen, and Gert G. Wagner.
). The BASE was initiated by the late Paul B. Baltes in collaboration with Hanfried Helmchen, psychiatry; Elisabeth Steinhagen-Thiessen, internal medicine and geriatrics; and Karl Ulrich Mayer, sociology. Principal investigators for the Berlin Aging Study II are Lars Bertram, Ilja Demuth, Johanna Drewelies, Sandra Duezel, Denis Gerstorf, Ulman Lindenberger, Graham Pawelec, Elisabeth Steinhagen-Thiessen, and Gert G. Wagner.
Transparency
Action Editor: Karen Rodrigue
Editor: Patricia J. Bauer
Author Contributions
D. Gerstorf: conceptualization, formal analysis, funding acquisition methodology, writing – original draft, writing – review and editing.
N. Ram: conceptualization, formal analysis, methodology, writing – original draft, writing – review and editing.
J. Drewelies: data curation, investigation, formal analysis, methodology, writing – review and editing.
S. Duezel: data curation, investigation, writing – review and editing.
P. Eibich: methodology, writing – review and editing.
E. Steinhagen-Thiessen: investigation, funding acquisition, writing – review and editing.
S. Liebig: methodology, writing – review and editing.
J. Goebel: methodology, writing – review & editing.
I. Demuth: funding acquisition, investigation, writing – review and editing.
A. Villringer: methodology, writing – review and editing.
G. G. Wagner: funding acquisition, methodology, writing – review and editing.
U. Lindenberger: conceptualization, formal analysis, funding acquisition, investigation, methodology, writing – review and editing.
P. Ghisletta: conceptualization, data curation, formal analysis, methodology, writing – original draft, writing – review and editing.
References
Supplementary Material
Please find the following supplemental material available below.
For Open Access articles published under a Creative Commons License, all supplemental material carries the same license as the article it is associated with.
For non-Open Access articles published, all supplemental material carries a non-exclusive license, and permission requests for re-use of supplemental material or any part of supplemental material shall be sent directly to the copyright owner as specified in the copyright notice associated with the article.