
Abstract
Does growing up with a sister rather than a brother affect personality? In this article, we provide a comprehensive analysis of the effects of siblings’ gender on adults’ personality, using data from 85,887 people from 12 large representative surveys covering nine countries (United States, United Kingdom, The Netherlands, Germany, Switzerland, Australia, Mexico, China, and Indonesia). We investigated the personality traits of risk tolerance, trust, patience, locus of control, and the Big Five. We found no meaningful causal effects of the gender of the next younger sibling and no associations with the gender of the next older sibling. Given the high statistical power and consistent results in the overall sample and relevant subsamples, our results suggest that siblings’ gender does not systematically affect personality.
Personality is an important predictor of economic, social, and physical well-being (e.g., Almlund et al., 2011; Heckman et al., 2006; Soto, 2019). Although there is consensus that both genes and the environment shape personality (Vukasović & Bratko, 2015), comparatively little is known about whether and to what extent specific environmental factors matter, such as the childhood family environment. In this article, we focus on one part of this environment: the gender of one’s siblings. Growing up with a sister rather than a brother may affect the interactions between siblings as well as those between parents and their children. These interactions take place at a crucial time—when children are young and their personality is most malleable (Roberts & DelVecchio, 2000; Sutter et al., 2019).
Two theories make opposing predictions about the causal effects of siblings’ gender on personality. The theory of social learning states that siblings learn from each other and assimilate to each other through social interactions (e.g., Brim, 1958). Thus, having a sister would lead to more feminine characteristics; having a brother would lead to more masculine characteristics. From this, it follows that children with an opposite-gender sibling will have fewer gender-stereotypical characteristics compared with those with a same-gender sibling. In contrast, the theory of sibling differentiation states that, because of sibling rivalry, siblings will differentiate themselves in the process of developing their identities (Bossard & Boll, 1956). The differentiation process may also be driven by parental behavior; for example, fathers might spend more time with their sons and mothers more time with their daughters in households with children of both genders (Brenøe, 2022). According to the sibling-differentiation theory, having a sister reduces feminine characteristics, whereas having a brother reduces masculine characteristics. Consequently, children with an opposite-gender sibling should have more gender-stereotypical characteristics compared with those with a same-gender sibling.
Both theories have received some empirical support since the 1950s. Studies have found results supporting the social-learning theory, in particular in children (e.g., Brim, 1958; Okudaira et al., 2015; Stoneman et al., 1986; Sutton-Smith et al., 1964), but also supporting the sibling-differentiation theory in both children (e.g., Grotevant, 1978; Leventhal, 1970; Rodgers et al., 1998) and, more recently, in adults (Brenøe, 2022). In addition, multiple studies resulted in either mixed findings or not much support for either theory (e.g., Detlefsen et al., 2018; Endendijk et al., 2013; Lamke et al., 1980; McHale et al., 1999). The literature thus remains inconclusive.
Why did previous studies fail to paint a clear picture about the effects of siblings’ gender on personality? A closer look at the studies reveals a number of potential problems, such as highly selective samples, a multitude of different outcome variables, and statistical evidence of unknown or weak strength. The seminal study on the effects of sibling gender investigated 384 schoolchildren from Chicago (Brim, 1958). All children came from White, urban, two-child families. Teachers rated children on 58 items divided into instrumental masculine traits (e.g., aggressiveness, curiosity) and expressive feminine traits (e.g., anger, affectionateness), and each item was tested for statistical differences. Findings suggested that children with an opposite-gender sibling had more traits of the opposite. Due to incomplete reporting, it is impossible to evaluate the strength of the evidence provided in this study.
A later study by Leventhal (1970) investigated a sample of male psychology students at North Carolina State University. Among the assessed outcomes were 30 extracurricular interests, an unspecified number of additional questions (e.g., interest in joining a social fraternity), and records of athletic performance. Results revealed that men with a sister showed greater interest in outdoor activities and that men with an older sister had higher motor fitness scores and showed more interest in social fraternities. This was interpreted as evidence for sibling differentiation, but again the strength of the statistical evidence seems questionable.
McHale et al. (2001) investigated 198 pairs of first- and second-born children from almost exclusively White, intact, working and middle-class families. The researchers assessed gender role attitudes, expressivity and instrumentality, and “sex-typed leisure activities” (e.g., handicrafts as a feminine activity; hunting and fishing as masculine activities). The findings support the social-learning theory: Girls with younger brothers had less traditional gender role attitudes. But once again, given the number of hypotheses conducted, the statistical evidence was not quite compelling.
The problems that make it difficult to interpret these findings are not idiosyncrasies of the literature on the effects of siblings’ gender but, rather, reflect both common research practices and the limited data availability at the time. Researchers now have the possibility to draw on large and nationally representative panel studies. For example, Golsteyn and Magnée (2020) made use of data from the British Cohort Study, which provides a representative picture of the British population born around 1970. Mothers rated their children’s personality at both age 10 years and age 16 years on a number of adjectives that could be mapped onto the Big Five personality traits of conscientiousness, extraversion, agreeableness, and emotional stability. Based on a sample of 2,868 children, their findings support the social-learning theory, showing that boys with younger sisters scored higher on agreeableness (assessed with negatively coded items, such as “destroys belongings,” “fights with others,” and “disobedient”); this pattern held at both ages but was more pronounced at age 16 years.
Statement of Relevance
Siblings are a central part of the childhood family environment, which is often believed to play a crucial and long-lasting role in personality development. For example, growing up with siblings of the opposite gender (as opposed to the same gender) may lead to different interactions between siblings and their parents. These different interactions may in turn leave a mark on one’s personality. However, existing theories make opposing predictions—siblings of the opposite gender may plausibly result in having either less gender-stereotypical personalities (e.g., a girl may take on more masculine traits because she imitates her brother) or more gender-stereotypical personalities (e.g., a girl may take on a more feminine role to differentiate herself from her brother). Previous empirical studies have resulted in inconsistent findings. In this study, we analyzed 12 large surveys from nine different countries to clarify the situation. Overall, we found that siblings’ gender has no meaningful effects on personality.
Apart from effects of siblings’ gender on attitudes and personality, studies in economics have mainly investigated siblings’ gender effects on educational achievement, career choices, and wages. Butcher and Case (1994) investigated the effects on education in three national U.S. surveys. They found that women with one or more sisters receive less education than women who have only brothers, holding the number of siblings constant. However, the authors also raised potential issues with the interpretation of these differences if parents have preferences over the gender composition of their children. For example, parents who prefer daughters may be more likely to stop having children after they have a girl, meaning that these daughters are less likely to have a sister. These families may also be more likely to invest more resources into their daughter’s education. Such behavior could induce spurious associations between siblings’ gender and educational outcomes when analyses condition on the number of siblings—an issue that questions whether the estimates reported in the literature on sibling gender can be interpreted as causal effects.
More recently, researchers in economics have established a way to identify causal effects of sibling gender—by focusing on the gender of the next younger sibling. Parents’ decision to have another child likely depends on the gender but also may depend on the personality of their current children (Jokela, 2010). Thus, the ultimate sibling composition is not random. As a result, differences between people with a brother and people with a sister may exist even in the absence of causal effects of siblings’ gender. But when parents decide to have another child, the gender of that next younger sibling is essentially random (Brenøe, 2022; Cools & Patacchini, 2019; Peter et al., 2018). This results in a natural experiment that allows for the estimation of causal effects of the next younger sibling’s gender: Differences between people with a next younger sister and people with a next younger brother can be attributed to the next younger sibling’s gender.
Using this approach, Cools and Patacchini (2019) reported a “brother-earnings penalty” in data from the United States. Women with a younger brother earned about 7% less than women with a younger sister. Brenøe (2022) used Danish administrative data to uncover a potential mechanism underlying this earnings penalty: traditional gender roles. Women with a younger brother were more likely to choose traditionally female occupations, and their wages dropped more drastically when entering motherhood than women with a younger sister. These studies provide convincing, albeit indirect, evidence for one form of sibling differentiation: Women with brothers seem to take more traditional paths through life.
In this study, we combined the focus on causal identification from economics with the rich data sources available to modern researchers to settle the question of whether siblings’ gender has lasting effects on personality. We analyzed a broad range of common personality measures across 12 representative surveys covering nine countries (United States, United Kingdom, The Netherlands, Germany, Switzerland, Australia, Mexico, China, and Indonesia). The resulting sample size of 85,887 people allowed us to detect even very small effects of siblings’ gender on adult personality.
Among both men and women, social learning predicts that sisters (as opposed to brothers) lead to more typically female characteristics, whereas sibling differentiation predicts that sisters lead to more typically male characteristics. But the dynamics implied by the theories may play out differently for men and women (e.g., one theory may apply to women and the other one to men), which is why we conducted analyses separately for men and women.
Based on the model of studies from economics, our central analyses focused on the effects of the gender of the next younger sibling, which results in estimates that can be interpreted as causal effects. Because these estimates address only a narrow research question, we additionally investigated associations between personality and the gender of the next older sibling. Furthermore, going beyond consecutive siblings, we also probed for potential dose-response relationships—testing whether the total number of sisters (vs. brothers) within the sibship is associated with personality. The estimates from these additional analyses may not correspond to the causal effect of interest, but they help us provide a more comprehensive picture of the relationships between siblings’ gender and personality.
Open-Practices Statement
We analyzed survey data that are not under our direct control; requests to access the data should be directed to the respective data-holding institutions. Analysis scripts are provided at https://osf.io/4zm2u/.
Method
Data
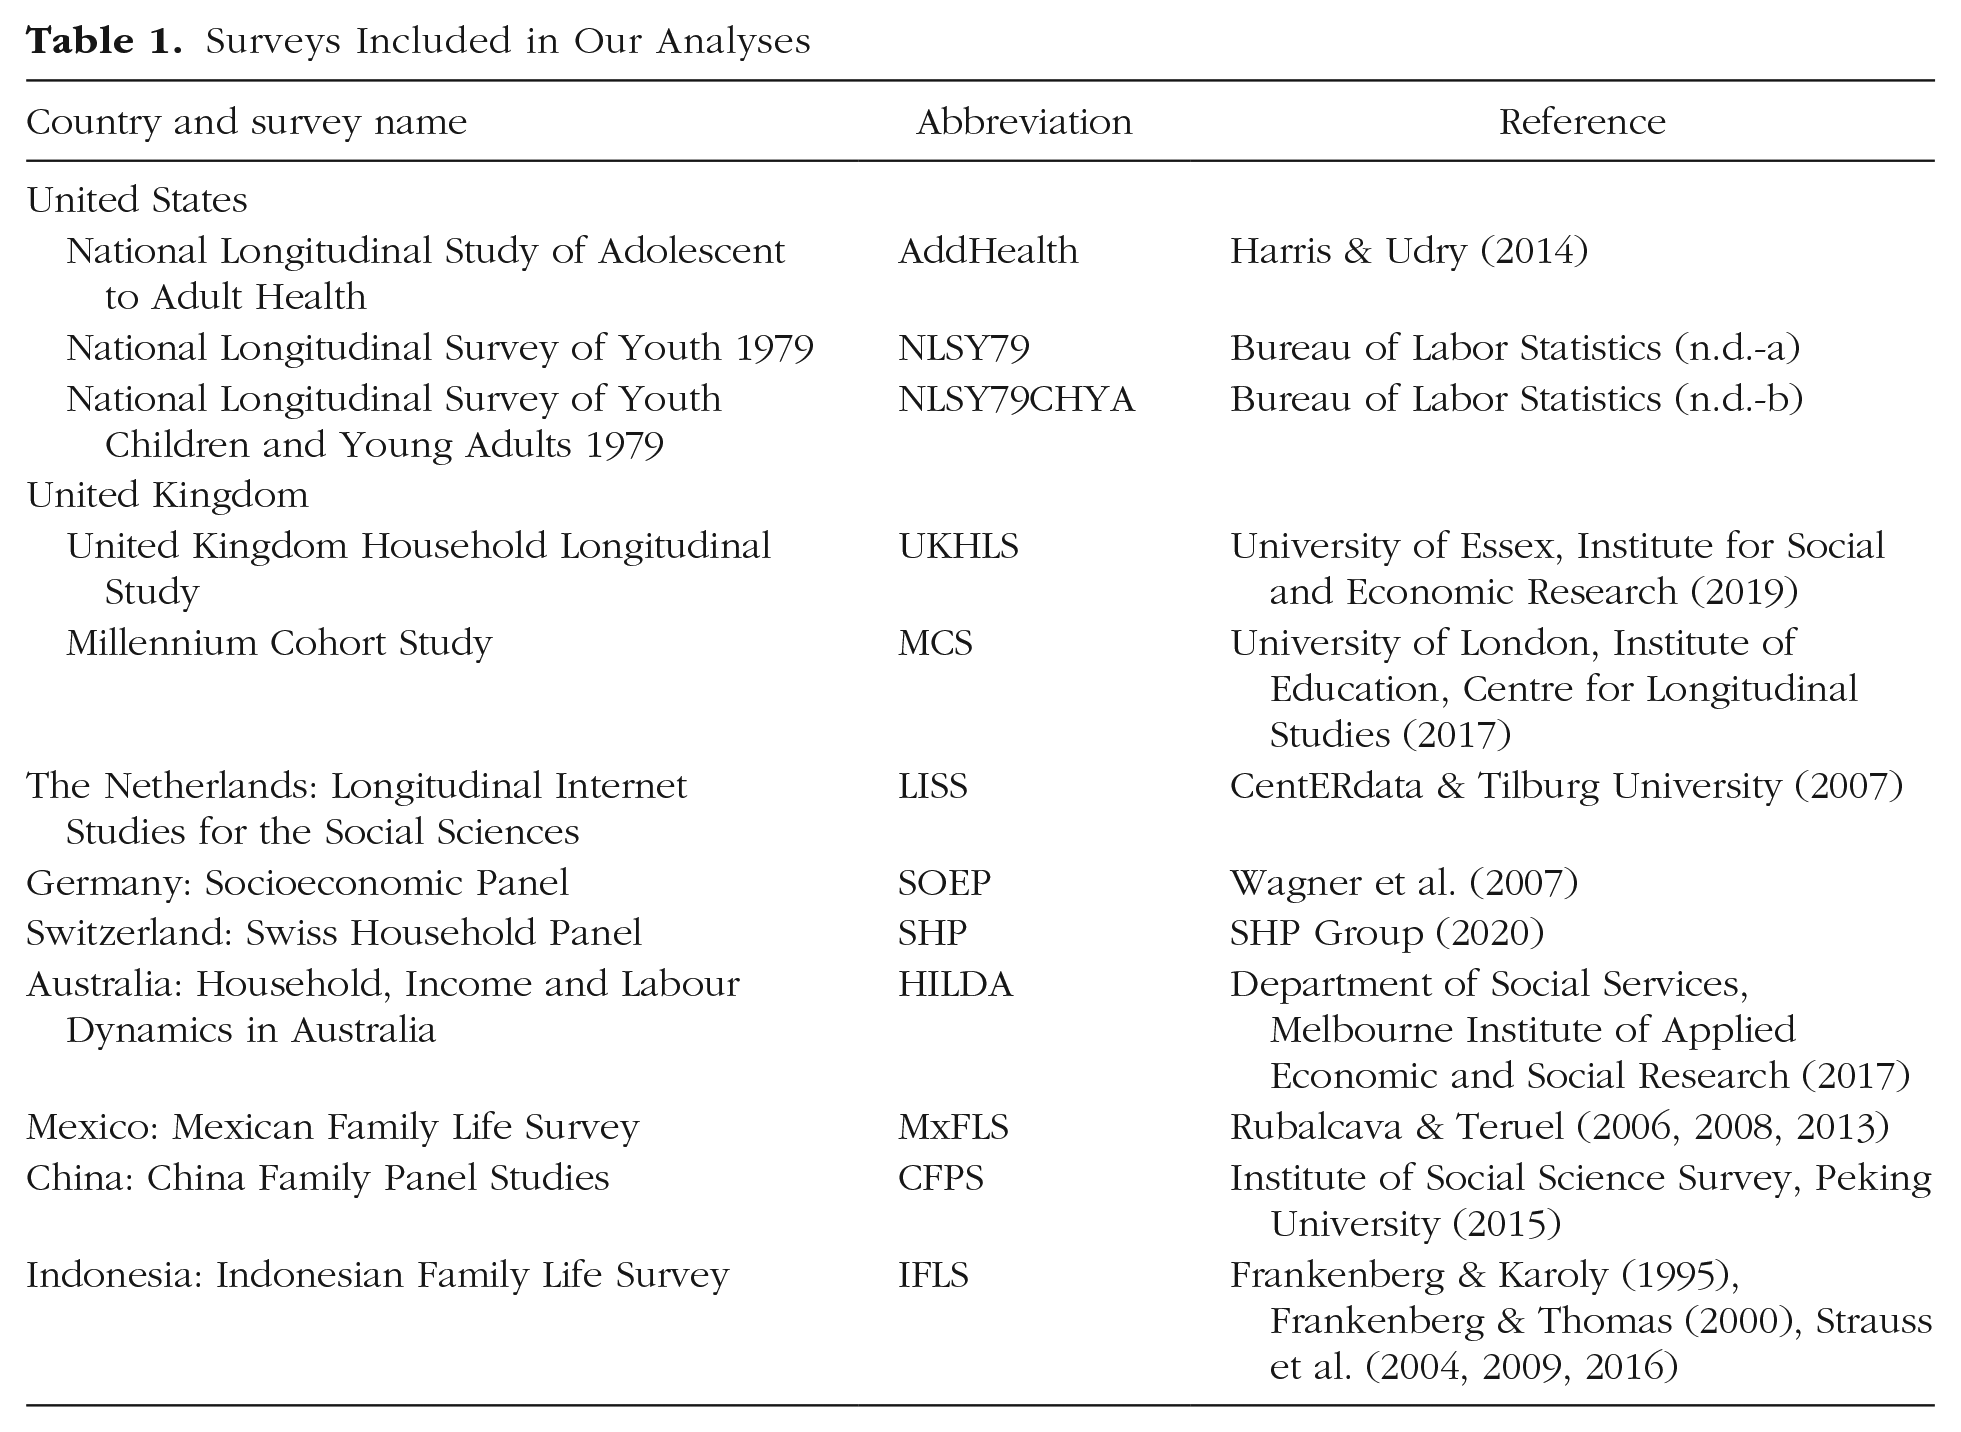
To estimate the effect of siblings’ gender on personality, we searched for representative surveys that (a) would allow us to identify the respondents’ sibling gender composition, (b) included at least two of the personality measures we considered, and (c) had large sample sizes. On the basis of these criteria, we compiled a data set including data from 12 surveys (see Table 1). Our final sample consisted of 85,887 people; 55,203 of them have a younger sibling, 50,909 have an older sibling, and 20,225 have both. The survey respondents were on average 33 years old and 52% were female. Detailed acknowledgments for each of the surveys, including the data versions and waves included in our analyses, can be found in the Supplemental Material at https://osf.io/pmhfa/.
Surveys Included in Our Analyses
Personality measures
We considered 10 personality dimensions: risk tolerance, trust, patience, the Big Five personality traits (openness to experience, conscientiousness, extraversion, agreeableness, neuroticism), locus of control, and a typical female personality (TFP) index. We generated the TFP index using five personality traits for which we observed systematic gender differences. Table S1 at https://osf.io/pmhfa/ shows the number of unique people for whom we observed each personality measure across surveys. We standardized the outcomes within each survey/year combination (M = 0, SD = 1).
Individual measures
Risk tolerance was assessed with a variety of measures ranging from single self-report items (e.g., “I like to take risks”; National Longitudinal Study of Adolescent to Adult Health; Harris & Udry, 2014) to hypothetical decisions (e.g., “Suppose that you are the only income earner in the family, and that you have to choose between two new jobs . . .”; National Longitudinal Survey of Youth 1979; Bureau of Labor Statistics, n.d.-a) to simple decision tasks (e.g., selecting a chip color for a bag of possible payments representing risky gambles of varying payments; Mexican Family Life Survey; Rubalcava & Teruel, 2006, 2008, 2013). Risk tolerance was measured in all 12 surveys (for more details, see Table S2 at https://osf.io/pmhfa/).
Trust was assessed with between one (e.g., “Generally speaking, how often can you trust other people?”; National Longitudinal Survey of Youth Children and Young Adults 1979; Bureau of Labor Statistics, n.d.-b) and four (multiple questions about their trust in their village and other people; Indonesian Family Life Survey; Frankenberg & Karoly, 1995; Frankenberg & Thomas, 2000; Strauss et al., 2004, 2009, 2016) self-report items. It was measured in 10 surveys (for more details, see Table S3 at https://osf.io/pmhfa/).
Patience was assessed through either self-reporting (e.g., “On a scale of 0-10, where 0 is never and 10 is always, how patient would you say you are?”; Millennium Cohort Study; University of London, Institute of Education, Centre for Longitudinal Studies, 2017) or the selection of different payment options (e.g., $1,000 now vs. $1,500 in a month; Mexican Family Life Survey). It was measured in four surveys (see Table S4 at https://osf.io/pmhfa/).
The Big Five personality traits were assessed with self-report questionnaires including between two and 10 items per dimension. It was measured in nine surveys (see Table S5 at https://osf.io/pmhfa/).
Locus of control was assessed with self-report questionnaires including between two and 10 items (e.g., “I have little control over the things that happen to me/in my life”). It was measured in six surveys (see Table S6 at https://osf.io/pmhfa/).
Typical female personality
Both social learning and sibling differentiation suggest effects on the gender typicality of one’s personality. However, when personality traits are considered in isolation, gender differences are often small (Del Giudice et al., 2012; Hyde, 2005)—as a consequence, chances to detect effects of siblings’ gender on gender typicality when considering any particular trait in isolation may be small as well. To provide a fairer test of the idea that siblings’ gender affects gender typicality, we constructed a summary index that maximizes personality differences between men and women.
This TFP index is based on the five traits (risk tolerance, conscientiousness, extraversion, agreeableness, and neuroticism) where we found significant and consistent gender differences across the different surveys. To identify significant gender differences, we regressed each of the five standardized traits separately on a female dummy and a cubic polynomial of the respondents’ age (i.e., age, age-squared, age-cubed). We included only traits for which the gender difference in a given survey is statistically significant at the 5% level (and points in the expected direction) in the calculation of the TFP index. Because there were no reliable differences in neuroticism in the National Longitudinal Survey of Youth Children and Young Adults 1979 (Bureau of Labor Statistics, n.d.-b) as well as the Household, Income and Labour Dynamics in Australia Survey (Department of Social Services, Melbourne Institute of Applied Economic and Social Research, 2017), we excluded neuroticism from the TFP index for these two surveys, and we additionally found no significant gender differences in the Mexican Family Life Survey (Rubalcava & Teruel, 2006, 2008, 2013), which is why this survey does not have a TFP index. Finally, we weighted the gender differences for these traits in each survey. The index was thus calculated as the gender-difference-weighted average of the observed traits per respondent within a year.
Importantly, this index is not meant to be interpreted as an underlying personality trait (“femininity”). Instead, it is simply an index with the highest weight on traits for which the largest gender differences were observed within the particular surveys. Thus, if siblings’ gender indeed leads to more or less gender-typical personalities, this index maximizes the chances of detecting these effects, taking into account that what counts as gender typical may vary by context. The gender difference on the resulting index was 0.39 standard deviations, but it varied between studies from a low of 0.16 (Millennium Cohort Study; University of London, Institute of Education, Centre for Longitudinal Studies, 2017) to a high of 0.79 (Longitudinal Internet Studies for the Social Sciences; CentERdata & Tilburg University, 2007; see Figs. S5.1 and S5.2 at https://osf.io/pmhfa/).
Data validation
Because of the large number of heterogeneous and largely brief measures, concerns about their validity naturally arise. Wolfram Ritter, a master’s student supervised by A. A. Brenøe with assistance from T. Dudek, investigated the validity of the nine primary personality dimensions (excluding the TFP index) in 11 of the 12 surveys included in our study; his thesis can be downloaded from http://www.merlin.uzh.ch/publication/show/19495 (Ritter, 2020). The National Longitudinal Survey of Youth Children and Young Adults 1979 (Bureau of Labor Statistics, n.d.-b) was added to our investigation after Ritter had finished his thesis. Ritter reviewed the literature on (a) the intercorrelations between different personality dimensions and (b) the correlations between personality and relevant socioeconomic and demographic variables and then assessed which of these correlations could be replicated across the 11 surveys. Any measure employed in a study was deemed “validated” if it replicated at least 70% of the correlations found in the literature. Using this criterion, we validated 63 out of 69 measures. Only risk tolerance in the National Longitudinal Study of Adolescent to Adult Health and National Longitudinal Survey of Youth 1979; patience in the Indonesian Family Life Survey; and trust in the Indonesian Family Life Survey, Socioeconomic Panel, and United Kingdom Household Longitudinal Study failed to replicate at least 70% of the correlations found in the literature. This criterion is rather conservative because it is, of course, possible that the associations between personality and other variables systematically vary between countries.
Sample restrictions
We limited the sample to respondents ages 10 to 60 years. The surveys generally excluded younger respondents; given the age requirements for survey participation, it is probable that they were miscoded. We excluded older respondents because their inclusion could bias estimates if siblings’ gender has effects on longevity (which may be mediated through effects on personality but also through other channels). We also excluded observations with age gaps to the relevant sibling of less than 9 months because these could result from multiple births (e.g., twins), which would result in different family dynamics. We also excluded people whose age gaps to their younger or older sibling exceeded 6 years—those siblings are potentially less likely to spend time with each other and might thus dilute any existing effects of siblings’ gender. Our exclusion criteria removed from our analyses 3,659 people over the age of 60 and 17,976 people who have sibling age gaps exceeding 6 years. We additionally ran analyses without these two restrictions and results were virtually unchanged (see Tables S7.1–S7.3 and S8.1–S8.3 at https://osf.io/pmhfa/). In short, sample restrictions did not qualitatively affect our estimates.
We applied additional survey-specific sample restrictions during data cleaning (e.g., excluding respondents reporting contradictory birth years, omitting respondents with unclear gender, excluding “siblings” who identified as being in a different relation to the sibling, such as cousins). In general, we did not identify whether siblings were biological as opposed to adopted or step-siblings, thus applying an inclusive definition of the term.
Statistical analysis
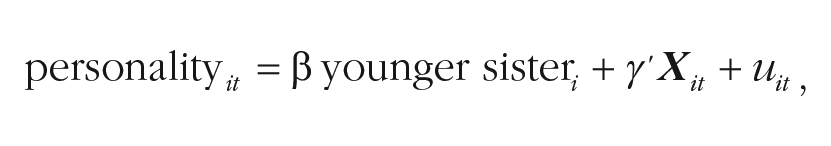
We estimated the effect of having a younger sister (as opposed to a younger brother) for respondents who had a younger sibling (between 9,205 and 23,548 people depending on the trait and the respondents’ gender; see Table S7) with the following empirical model:
where
Additionally,
Because we included personality measures of the same person in multiple years, we clustered our standard errors at the individual level (for more on this alternative to multilevel modeling, see Huang, 2016). Our parameter of interest was
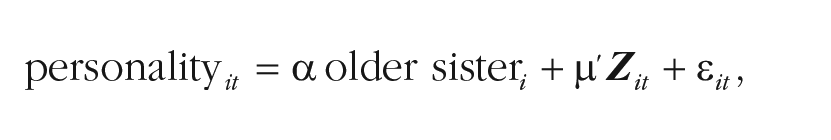
Our empirical model for estimating the relationship between older siblings’ gender and one’s personality for respondents who have an older sibling (between 8,544 and 22,065 people depending on the trait and the respondents’ gender; see Table S8) is analogous to the one estimating causal effects of siblings’ gender shown above:
where
Analyses of the effects of the gender of the next younger or next older sibling rely on certain identifying assumptions. For the effects of the gender of the next younger sibling, we have to assume that people with a younger brother and those with a younger sister do not differ systematically in variables that are determined prior to sibling gender and that may affect personality (i.e., no confounders between sibling gender and personality). Likewise, for the effects of the gender of the next older sibling, we have to assume that people with an older brother do not systematically differ from people with an older sister. These assumptions could be violated, for example, if there are differential survival rates or sex-selective abortions. To check the plausibility of our assumptions, we ran a number of balance checks, which confirmed that the compared groups (e.g., women with younger sisters vs. women with younger brothers) had similar predetermined characteristics. Detailed results are reported in the Supplemental Material at https://osf.io/pmhfa/.
Robustness checks and analysis of heterogeneity
For our central analyses of the effect of the gender of the next younger sibling, we ran a number of robustness checks and furthermore analyzed heterogeneity along a number of dimensions. Specifically, we tested whether the results changed if we did not control for any variables (see Table S11); we tested whether limiting analyses to firstborns changed the results (see Table S12 at https://osf.io/pmhfa/); we limited the sample to firstborns with exactly one younger sibling (see Table S13 at https://osf.io/pmhfa/); we included controls for the total number of siblings, which is questionable from a causal inference perspective (see Table S14 at https://osf.io/pmhfa/); we reran analyses excluding data from three surveys in which we saw small gender imbalances (United Kingdom Household Longitudinal Study; Household, Income and Labour Dynamics in Australia Survey; and Mexican Family Life Survey) or had concerns about sex-selective abortion (China Family Panel Studies; see Table S15 at https://osf.io/pmhfa/; Li et al., 2011). We also investigated whether the effects of siblings’ gender varied by year of birth, age of personality assessment, birth-order position, or birth spacing. Detailed reports can be found in the Supplemental Material.
Investigating dose-response relationships
The effects of sibling gender may “add up” across the whole sibship, in which case it may be instructive to look at the total number of sisters for people with the same total number of siblings, regardless of age. These comparisons do not necessarily identify the causal effect of having sisters (as opposed to brothers), but they help to fully describe any correlation between sibling gender and personality. For this purpose, we plotted mean personality scores against the total number of sisters separately for people with one, two, three, or four siblings in total (see Fig. S16 at https://osf.io/pmhfa/).
Results
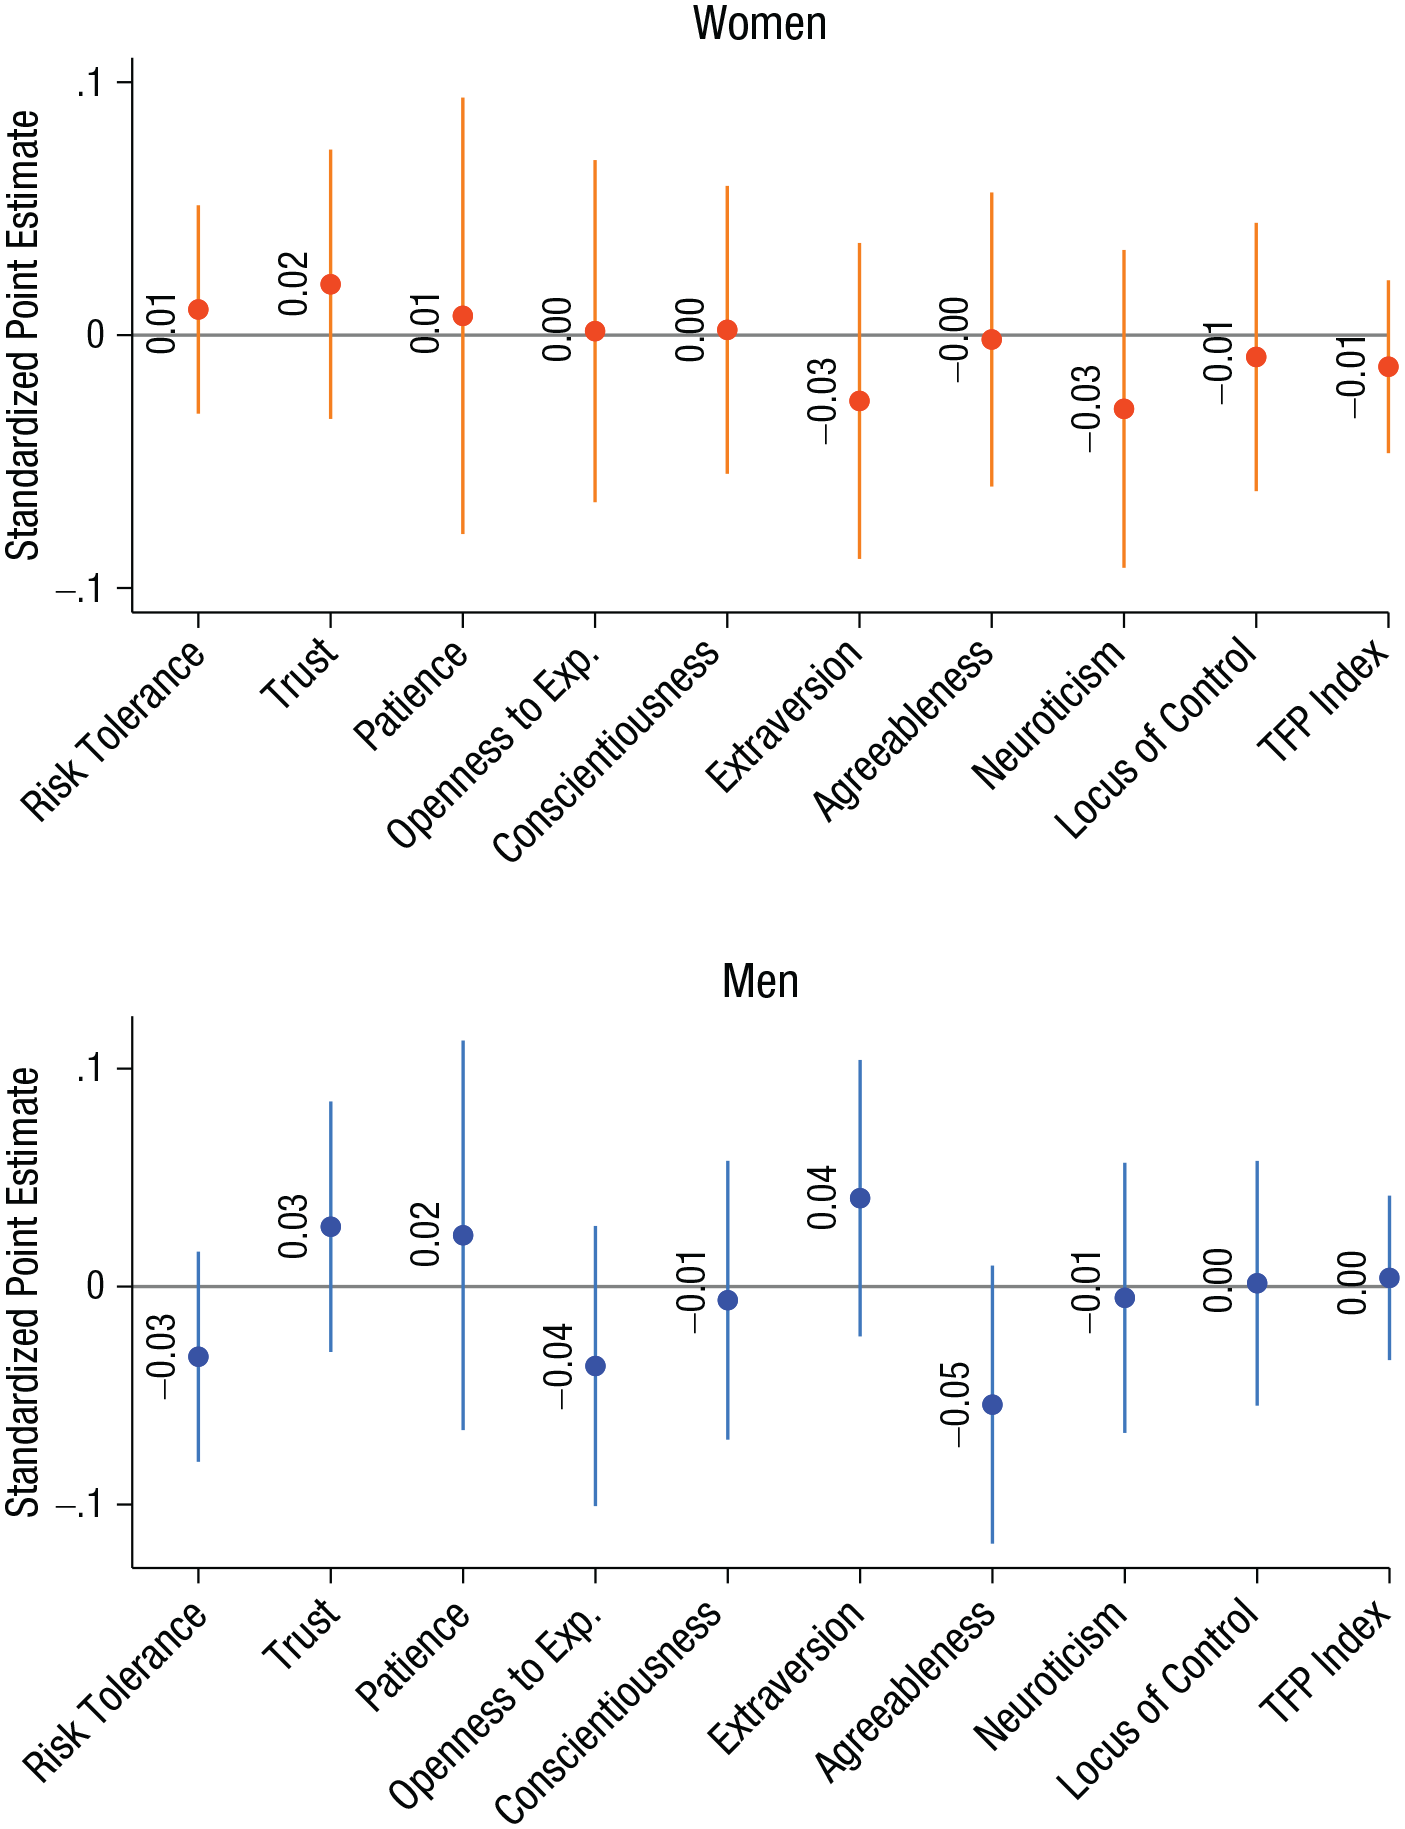
Across all surveys, we found that the gender of the next younger sibling has no meaningful effects on women’s or men’s personality (risk tolerance, trust, patience, openness to experience, conscientiousness, extraversion, agreeableness, neuroticism, locus of control, and our TFP index; see Fig. 1). All point estimates were statistically insignificant and lay within a narrow range between −0.03 and 0.02 standard deviations. Furthermore, 95% confidence intervals (CIs) allowed us to rule out effect sizes larger than 0.08 standard deviations in absolute terms. The use of our combined measure of TFP allowed us to test the two competing theoretical predictions (social learning and sibling differentiation), and we were able to rule out effects larger than 0.04 standard deviations. For comparison, studies on birth-order effects on cognitive ability in Western countries have reported declines more than twice as large in magnitude from firstborns to children born later (e.g., Rohrer et al., 2015), and these effects are conventionally interpreted as small.
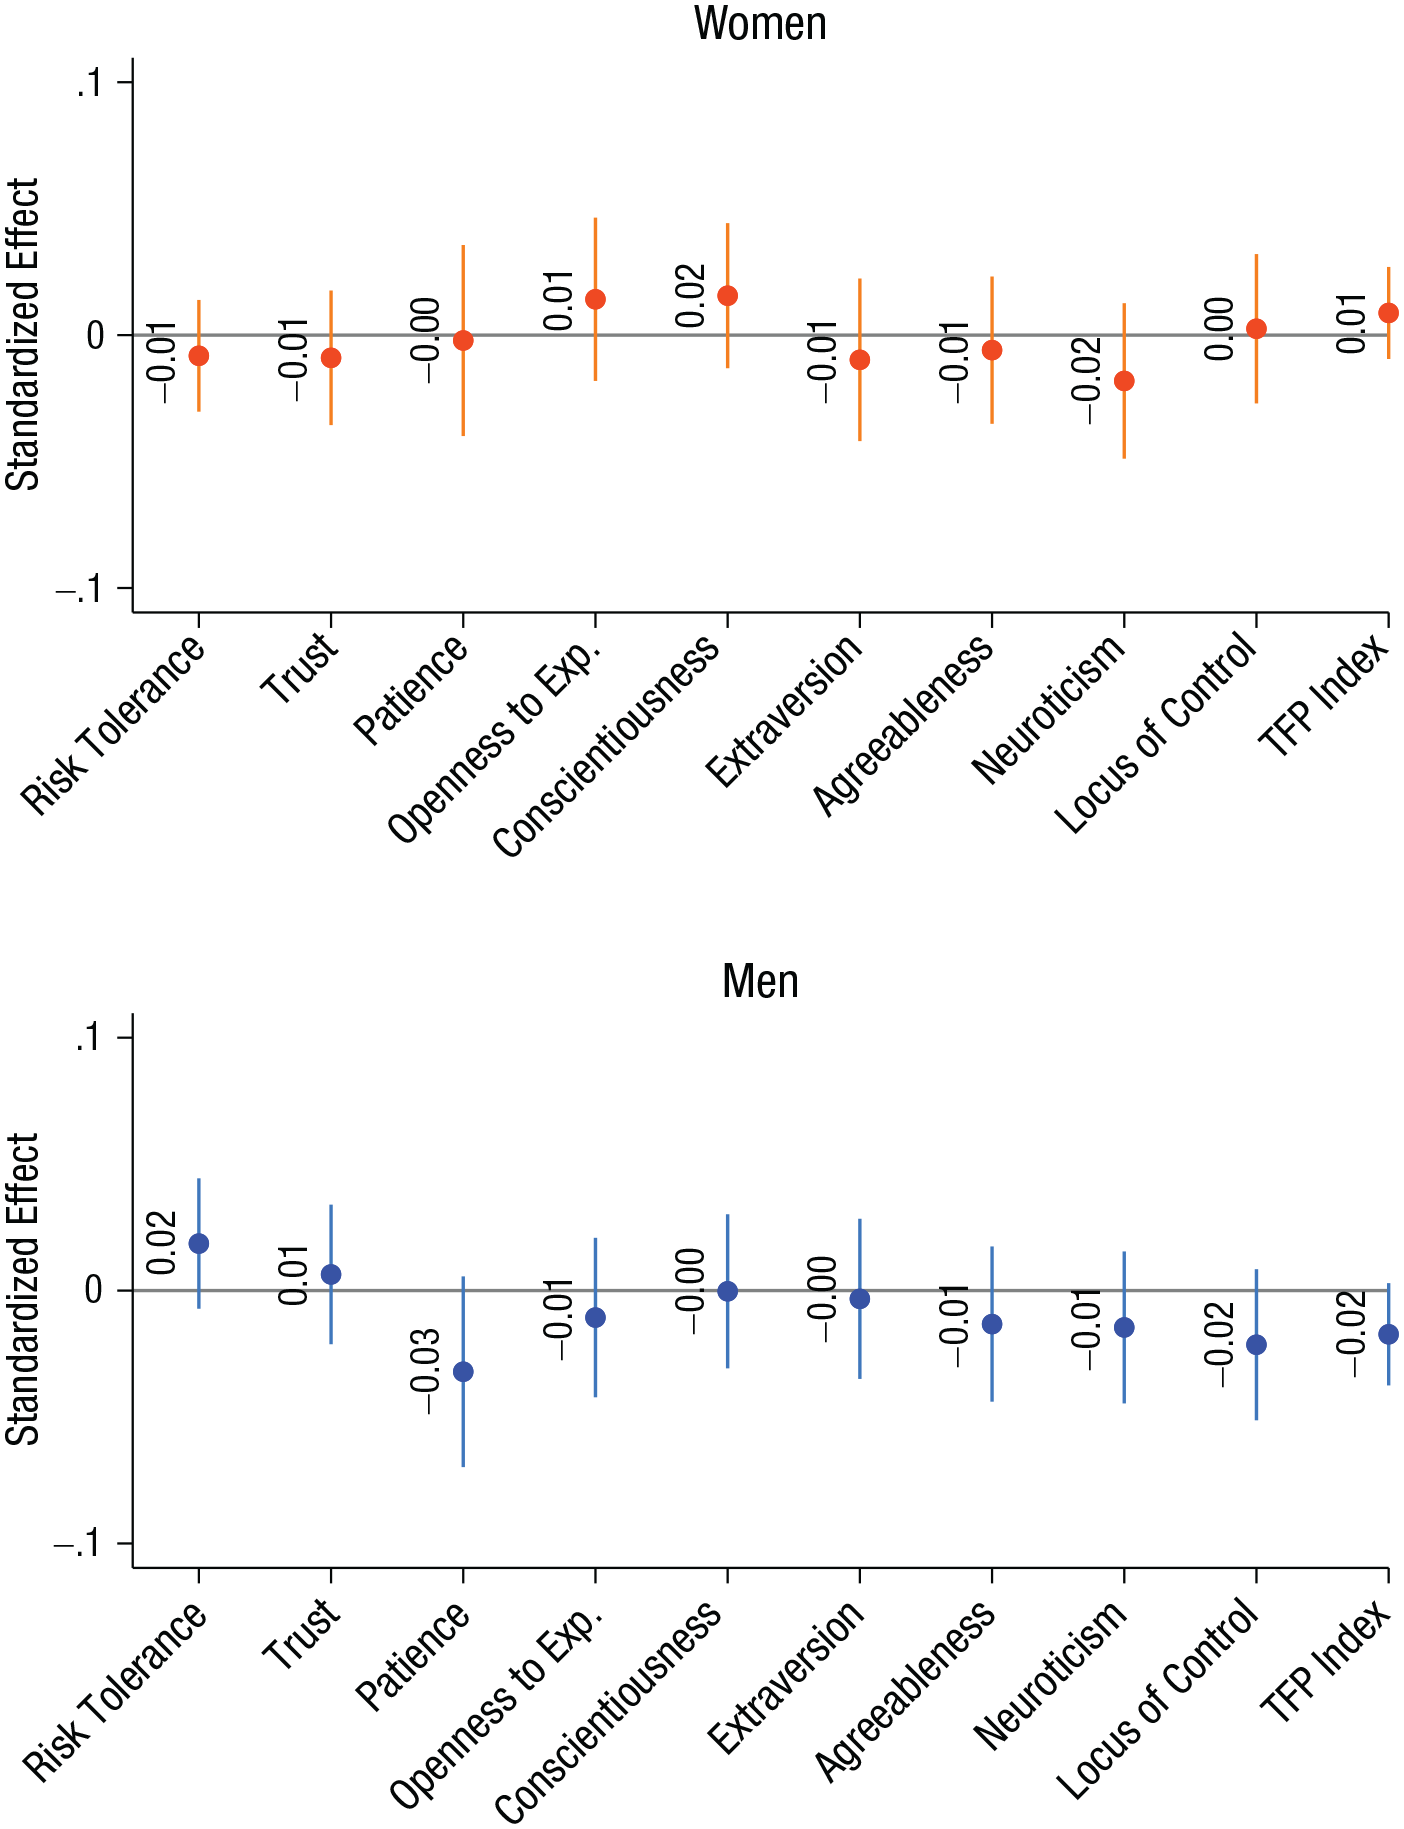
Effect of having a next younger sister (as opposed to a younger brother) on the older sibling’s personality, separately for male and female older siblings, in standard deviations. Error bars indicate 95% confidence intervals based on standard errors clustered at the individual level. For underlying regression estimates, see Table S7 at https://osf.io/pmhfa/. Exp. = experience; TFP = typical female personality.
Some simple back-of-the-envelope calculations considering potential downstream consequences may also help put the magnitude of these findings into perspective. Almlund et al. (2011) reported that an increase of 1 standard deviation in locus of control is associated with an increase of up to 6.8 percentage points in the probability of graduating from high school. If we assume that this estimate represents a causal effect and naively combine it with an effect of sibling gender on locus of control of 0.03 standard deviations for women (the upper, more extreme boundary of the 95% CI in our analyses; see Table S7), we conclude that, for women, having a younger sister (as opposed to a younger brother) leads to an increase in the probability of graduation of 0.20 percentage points mediated via locus of control. In another example in which we assume an extreme effect of personality on an outcome, Soto (2019) reported a correlation of .45 between extraversion and leadership. If we assume that this correlation can be fully attributed to a causal effect of 0.45 standard deviations in leadership per standard deviation of extraversion and combine it with an effect of sibling gender on extraversion of −0.04 standard deviations for either men or women (the lower, more extreme boundary of both corresponding 95% CIs; see Table S7), we would conclude that having a younger sister (as opposed to a younger brother) leads to a change of −0.02 standard deviations in leadership mediated via extraversion. Thus, even if we assume that personality is highly consequential, the possible effects of sibling gender on personality that our estimates suggest would have fairly small consequences.
The overall pattern survived all robustness checks, and all differences in point estimates were small. We found no meaningful heterogeneity by year of birth (see Figs. S8 and S9 at https://osf.io/pmhfa/), age (see Figs. S10 and S11 at https://osf.io/pmhfa/), birth-order position (see Figs. S12 and S13 at https://osf.io/pmhfa/), or birth spacing (see Figs. S14 and S15 at https://osf.io/pmhfa/).
Combining all 12 surveys may hide important differences between different cultural settings. We thus reran analyses separately for each survey. Figures 2 and 3 show no systematic heterogeneity across surveys. As expected by chance alone when estimating 174 separate regressions, some estimates were statistically significant when considered in isolation. However, none of these estimates reached a more stringent cutoff of p < .005, which has been recommended as a safeguard against high rates of false positive findings in the literature (Benjamin et al., 2018). We additionally checked whether any single study was statistically significant for any particular construct when accepting a false discovery rate of .05 (Benjamini & Hochberg, 1995). This was not the case (for implementation of the procedure, see https://osf.io/4zm2u/).
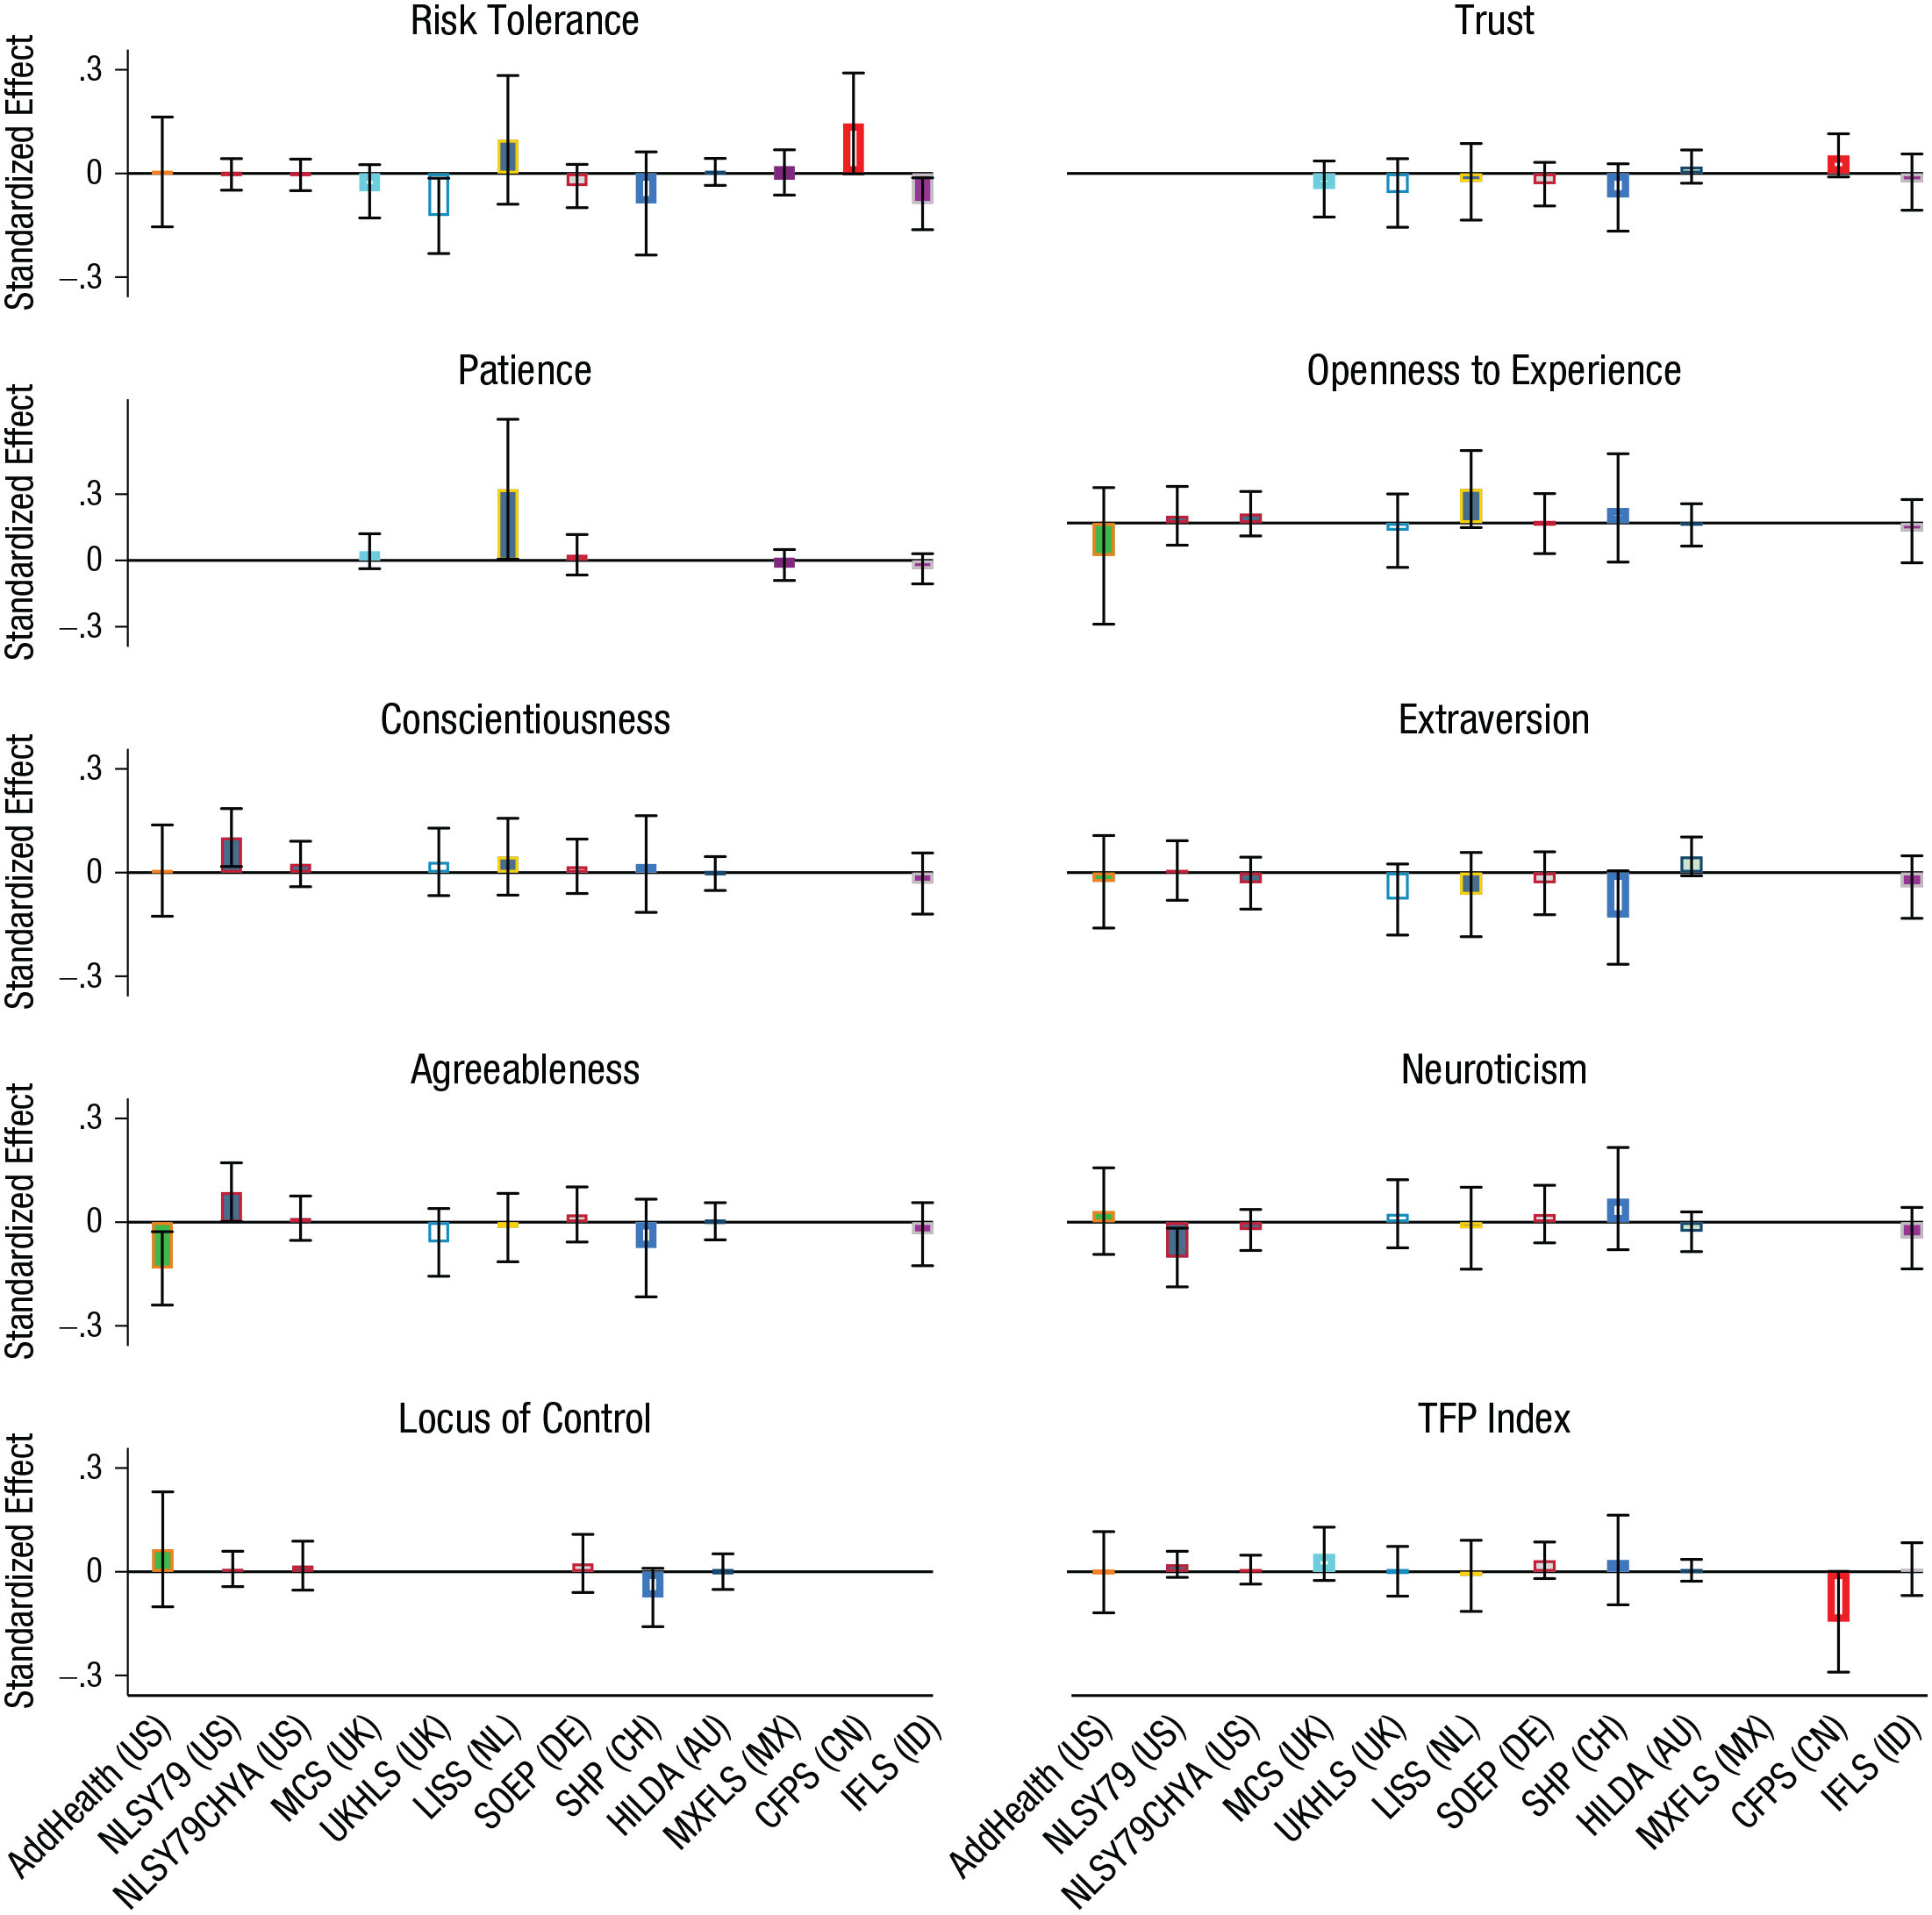
Effect of having a next younger sister on each of 10 aspects of women’s personalities, separately for each survey. Error bars indicate 95% confidence intervals based on standard errors clustered at the individual level. For underlying regression estimates, see Tables S9.01 to S9.10 at https://osf.io/pmhfa/. For explanation of study acronyms, see Table 1. TFP = typical female personality; US = United States; UK = United Kingdom; NL = The Netherlands; DE = Germany; CH = Switzerland; AU = Australia; MX = Mexico; CN = China; ID = Indonesia.
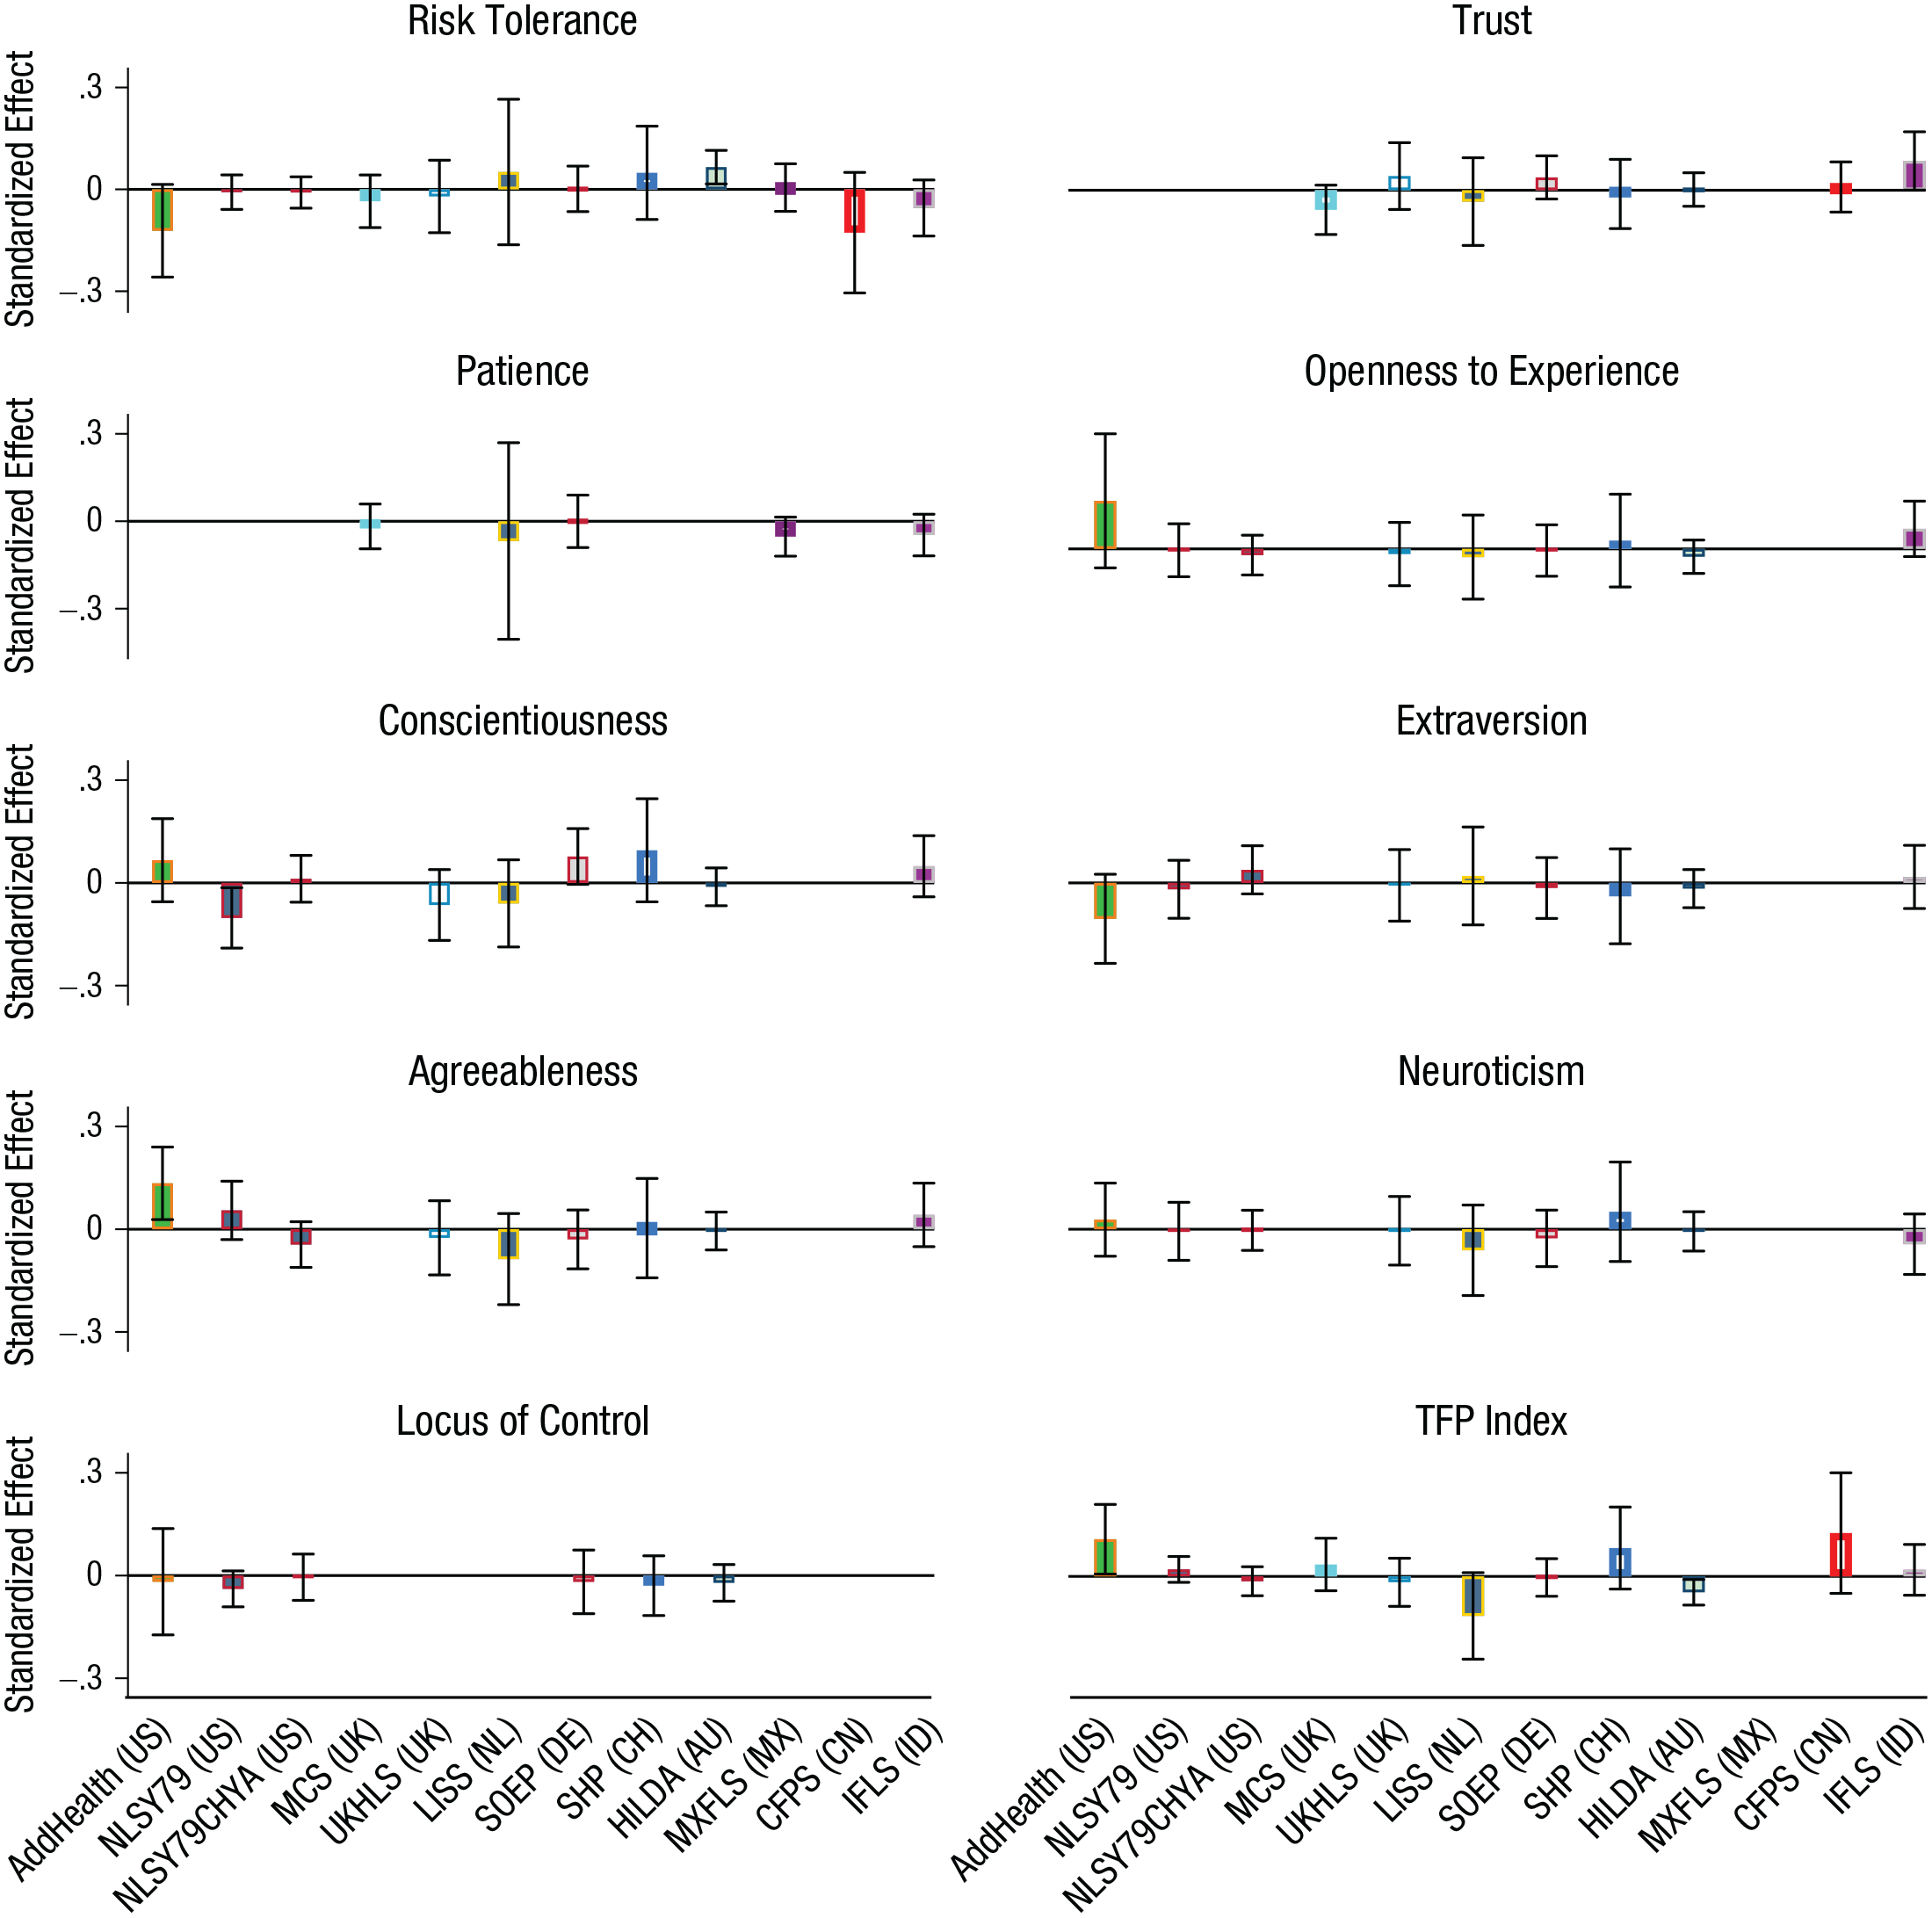
Effect of having a next younger sister on each of 10 aspects of men’s personalities, separately for each survey. Error bars indicate 95% confidence intervals based on standard errors clustered at the individual level. For underlying regression estimates, see Tables S10.01 to S10.10 at https://osf.io/pmhfa/. For explanation of study acronyms, see Table 1. TFP = typical female personality; US = United States; UK = United Kingdom; NL = The Netherlands; DE = Germany; CH = Switzerland; AU = Australia; MX = Mexico; CN = China; ID = Indonesia.
Considering the gender of the next older sibling, we found no meaningful correlations with personality (see Fig. 4). Point estimates ranged from −0.05 to +0.04 standard deviations, and none of them were statistically significant; 95% CIs allowed us to rule out effect sizes larger than 0.12 standard deviations in absolute terms. Considering the combined measure of TFP, we were able to rule out effects larger than 0.05 standard deviations in absolute terms. The absence of a meaningful correlation was not driven by offsetting correlations in different surveys (see Figs. S6 and S7 at https://osf.io/pmhfa/). Although it is possible, in principle, that these correlations might be biased in a manner that hides meaningful causal effects, it is implausible that such a bias would lead to offsetting effects that lead to the null effects for all 10 outcomes across both genders. Because we saw little evidence for selection bias, we interpret these results as evidence that the gender of one’s older sibling does not have broad and meaningful effects on personality.
Association between the next older sibling being a sister and the younger sibling’s personality, separately for male and female younger siblings. Error bars indicate 95% confidence intervals based on standard errors clustered at the individual level. For underlying regression estimates, see Table S8 at https://osf.io/pmhfa/. Exp. = experience; TFP = typical female personality.
Lastly, what if we compare people on the basis of the number of sisters in total (i.e., combining younger and older siblings)? Visual inspection of mean personality scores by the number of sisters, split by total number of siblings, also did not reveal any systematic pattern (see Fig. S16).
Discussion
Overall, we conclude that siblings’ gender does not meaningfully affect personality. Although data came from only nine countries (with a predominance on Western countries), the consistently small associations challenge the notion that any type of universal, gendered sibship dynamics affects personality. This conclusion also aligns with recent findings suggesting that one’s ordinal position among siblings does not meaningfully affect personality (Botzet et al., 2021; Damian & Roberts, 2015b; Lejarraga et al., 2019; Rohrer et al., 2015, 2017). Of course, it is possible that the effects of siblings’ gender and birth-order position are even more subtle and thus not detectable even when very large samples are investigated. This interpretation would align with recent suggestions that environmental influences, just like genetic influences, may be driven by thousands of factors, each with very small effect sizes (von Stumm & d’Apice, 2022). However, taking findings from behavioral genetics into account, it seems like these environmental causes are more likely to be found outside of the family environment (Briley & Tucker-Drob, 2014; Vukasović & Bratko, 2015).
It is also possible that the proposed mechanisms of both social-learning and sibling-differentiation theory apply in varying degrees in different families, resulting in average effects that net out at zero but that may occasionally “show up” in individual studies as significant effects. However, this account does not provide the most parsimonious explanation for discrepancies between our study and the past literature on the topic. Given inconsistent methodologies and small sample sizes, it seems reasonable that at least some of the incoherence can be attributed to publication bias (Ioannidis, 2005), which can result in a “continuous stream of conflicting results” (Damian & Roberts, 2015a). Furthermore, both social learning and sibling differentiation suggest that the effects of siblings’ gender are mediated through siblings’ personality—but the link between gender and personality is only of medium strength in the first place, even when an index designed to maximize differences is used. Thus, large effects of sibling gender may be implausible to begin with.
Lastly, sibling gender may not affect the widely used broad personality measures that we investigated, but recent economic research suggests that it does affect important life outcomes. Findings suggest that brothers decrease women’s labor earnings and that this may be partly driven by increased traditional family attitudes (Brenøe, 2022; Cools & Patacchini, 2019; Rao & Chatterjee, 2018). Investigating the specific mechanisms behind this brother-earnings penalty—whether they are psychological, sociological, or economic in nature—seems a worthwhile research endeavor. Our findings suggest that personality differences do not play a major part in this story.
Footnotes
Acknowledgements
We thank Hui Fang, Lanxin Meng, Yuting Chen, Luke Searle, Pia Arce, Apostolos Siopsis, and Antonia Selby for their research assistance. We are thankful for comments from Pietro Biroli, Lena Detlefsen, Alexandra de Gendre, Eberhard Feess, Bart Golsteyn, Nicolas Salamanca, Stefan Schmukle, Claudio Schilter, Ulf Zölitz, and seminar participants at the University of Gothenburg, Victoria University of Wellington, and University of Zurich. We thank the many institutions that collected the data underlying this work (see the Supplemental Material at ![]() ).
).
Transparency
Action Editor: Mark Brandt
Editor: Patricia J. Bauer
Author Contributions
A. A. Brenøe, J. Feld, and T. Dudek conceptualized the research. T. Dudek curated the data together with the research assistants listed in the Acknowledgments section. The methodology was developed by A. A. Brenøe, J. Feld, and T. Dudek; T. Dudek ran all analyses with additional supervision from A. A. Brenøe and J. Feld. T. Dudek and J. Feld created the visualizations. A. A. Brenøe, J. Feld, and T. Dudek wrote the manuscript. All the authors edited the manuscript further and approved the final version for submission.