
Abstract
Older age is characterized by more positive and less negative emotional experience. Recent work by Carstensen et al. (2020) demonstrated that the age advantages in emotional experience have persisted during the COVID-19 pandemic. In two studies, we replicated and extended this work. In Study 1, we conducted a large-scale test of the robustness of Carstensen and colleagues’ findings using data from 23,350 participants in 63 countries. Our results confirm that age advantages in emotions have persisted during the COVID-19 pandemic. In Study 2, we directly compared the age advantages before and during the COVID-19 pandemic in a within-participants study (N = 4,370). We found that the age advantages in emotions decreased during the pandemic. These findings are consistent with theoretical proposals that the age advantages reflect older adults’ ability to avoid situations that are likely to cause negative emotions, which is challenging under conditions of sustained unavoidable stress.
Keywords
Getting old is generally seen as unappealing, yet aging confers considerable advantages in several psychological domains (North & Fiske, 2015). In particular, older adults have an age advantage in terms of emotions, reporting more positive and less negative emotional experience than do younger people (Carstensen et al., 2011). Here, we examined whether the age advantages in emotional experience occur under conditions of prolonged unavoidable stress, such as the COVID-19 pandemic. Theoretical accounts that emphasize the avoidance of negative events as the primary driver of the age advantages in emotions predict that situations in which those strategies are unavailable would result in age advantages being attenuated or eliminated (Charles, 2010).
In a recent study, Carstensen et al. (2020) provided empirical evidence that the age advantages in emotion have persisted during the COVID-19 pandemic (see also Twenge & Joiner, 2020; Zacher & Rudolph, 2021). We built on Carstensen and colleagues’ work with two studies. In Study 1, we conducted a large-scale test of the robustness and generalizability of Carstensen and colleagues’ finding that older individuals have experienced more positive and less negative emotions during the COVID-19 pandemic. We measured positive and negative emotions along with age information in 23,350 participants in 63 countries during April and May 2020. Then, we addressed an important limitation of Carstensen and colleagues’ study. As they noted, because of a lack of a pre-pandemic comparison sample, their data could not directly speak to whether pandemic conditions may have altered the relationship between age and emotional experience. In Study 2, we compared the age advantages in emotional experience before and during the pandemic (in 2019 and 2020, respectively) using a within-participants, nationally representative data set.
Study 1: Age Advantages in Emotions Around the World During the COVID-19 Pandemic
Little research has examined whether the age advantages in emotional experience are generalizable across cultural contexts. In Study 1, we therefore tested the robustness of the age advantages in emotions reported in a U.S. sample during the COVID-19 pandemic by Carstensen and colleagues (2020). We used a large-scale cross-country data set collected during the COVID-19 pandemic (Sun et al., 2020).
Method
Data set
The full data set comprised 29,744 participants from 157 countries 1 and was collected between April 17 and May 15, 2020. The main purpose of the survey was to measure emotions and well-being across the world during the COVID-19 pandemic, and the study received ethical approval from the University of Amsterdam. The survey was translated into 50 languages by native speakers and verified by at least one additional native speaker to ensure that the translation was valid. Participants were recruited via media (e.g., newspapers), social media, personal networks, and targeted group advertisements on Facebook. A copy of the full survey and full data set are available on OSF (https://osf.io/qctkx/).
In this data set, the number of participants differs per country. We sought an empirical basis on which to establish the number of participants needed in each country for inclusion in the present analysis. We used G*Power (Version 3.1; Faul et al., 2009) to determine the sample size to ensure sufficient power. We based the power calculation on the results from the most similar study available, namely that of Carstensen et al. Specifically, our data allowed us to match Carstensen et al.’s Model 3, which estimated the effects while accounting for a number of potential confounds that were also measured in our data set. We therefore based our effect-size estimates on the coefficients in Carstensen et al.’s Model 3. To ensure that our sample size would be sufficient, we used the smallest R2 reported in Carstensen et al.’s Model 3 in Tables 3 through 6 (R2 = .18). Given an α of .05 and Npredictor of 8, a minimum of 77 participants would give us a power of .8 to detect an effect using F tests for multiple linear regression. We therefore included countries with at least 100 participants (prior to data cleaning) who had provided age information, leaving 63 countries in the analysis.
Statement of Relevance
Older age is generally characterized by more positive and less negative emotional experience, that is, age advantages in emotions. However, the COVID-19 pandemic presents a great challenge to emotional well-being, especially for older adults who are at increased risk. In two studies, we examined whether the age advantages in emotional experience would persist during the COVID-19 pandemic. We found that the age advantages were still present but less pronounced than before the pandemic. These results suggest that older adults may still be able to utilize some strategies and resources that help ameliorate even sustained stress, highlighting their resilience during the pandemic. However, the pandemic precludes the use of some strategies that usually help older people, such as avoiding negative situations.
The only data-exclusion criterion we applied was to remove participants who provided the same response to 11 or more consecutive emotion items (Curran, 2016). The data of the remaining 23,350 participants from 63 countries were entered into the statistical analyses (minimum number of participants per country = 96; 6,941 men, 16,254 women, 155 participants preferred not to report gender; age: M = 37.15 years, SD = 14.83, range = 16–101).
Measures
Emotions
We measured 10 positive emotions (admiration, calm, compassion, determination, moved, gratitude, hope, love, relief, and pleasure) and 10 negative emotions (anger, anxiety, boredom, confusion, disgust, fear, frustration, loneliness, regret, and sadness) using the following question: “In the past week, to what extent did you experience the following emotions?” Participants could indicate their response from 0 (not at all) to 6 (very much). Following the approach of Carstensen et al., we calculated positive-emotion scores by averaging ratings of the 10 positive emotions and calculated negative-emotion scores by averaging the ratings of the 10 negative emotions.
Individual-level control variables
We attempted to approximate the control variables used by Carstensen et al. as closely as possible. In total, we measured eight of the 12 control variables reported in Carstensen et al.’s Table 3 (education level, employment status, residential condition [whether an individual lived alone], and each of the Big Five personality traits) plus gender, perceived vulnerability, subjective socioeconomic status (SES), and self-rated health. We report detailed information about the control variables in Section A in our Supplemental Material available online.
Additional control variables
Given the data structure of person nested in country, we also included country-level control variables: each country’s gross domestic product (GDP), Gini index, COVID-19 policy stringency, and COVID-19-related deaths, because these variables have been found to relate to individuals’ emotional well-being during the pandemic (Sun et al., 2020). For details, see Section A in the Supplemental Material.
Results
Data analyses were conducted using R (Version 4.0.0; R Core Team, 2020) except for the zero-order correlation analyses between Level 1 variables, which were conducted using MPlus (Version 8.3; Muthén & Muthén, 2018). Following the same procedure Carstensen et al. used to report emotion frequencies in their Table 1, we calculated the mean and standard deviation of the 20 emotions across the 63 countries (see Table S1 in our Supplemental Material for detailed results). Following the procedure Carstensen et al. used for the correlations reported in their Table 2, we also calculated the correlations between age and background variables (see Table S2 in our Supplemental Material). Unlike Carstensen et al., we did not find that age correlated with perceived vulnerability to COVID-19 in our sample.
To test whether the persistence of the age advantages in emotions would generalize across countries, we ran separate multilevel regression analyses with positive and negative emotional experience as outcomes. We first established whether a multilevel approach was justified on the basis of the outcomes’ intraclass correlation coefficients (ICCs) calculated from the random-intercept-only models. The ICC represents the proportion of the total variability that is attributable to the country level. The ICCs for positive emotions and negative emotions were .058 and .059, respectively, indicating that approximately 6% of the variance in emotional experience is explained by country; multilevel analyses were thus appropriate.
We built up the models step by step in a similar manner as Carstensen et al. did. In Model 1, we added age as a predictor in the fixed-effects model and added a random intercept for country. In Model 2, we added a random slope for age. In Model 3, we added self-rated health, gender (woman coded as 1), education, subjective SES, employment situation (working coded as 1), and perceived vulnerability as fixed-effects control variables. In Model 4, gender, education, subjective SES, employment situation, self-rated health, and vulnerability were added as independent random slopes in the model. In Model 5, for those individuals who provided Big Five personality data and reported their residential condition (living alone coded as 1), we added those variables into both fixed-effects predictors and into independent random slopes. Finally, in Model 6, we added GDP per capita (logged value) and Gini index (both as Level 2 predictors) and policy stringency and deaths per million (both Level 1 predictors) as fixed-effects predictors. No further random effects were added in Model 6. In our Supplemental Material, we report the full multilevel results for negative emotions in Table S3 and for positive emotions in Table S4.
As expected, age positively predicted positive emotional experience and negatively predicted negative emotional experience, even when the models controlled for personality, demographic information, country-level socioeconomic background (including GDP and Gini index), and pandemic severity. The effects for negative emotions were larger than for positive emotions.
To test the generalizability of the patterns across countries, we calculated the estimated coefficient of age on emotions for each country by adding the fixed-effects estimates of age and the corresponding random-effects estimates for each country, based on Model 2 (see Fig. S1 in the Supplemental Material). Age negatively predicted negative emotional experience for all 63 countries in our study and positively predicted positive emotional experience for 60 of the 63 countries (the other three countries had coefficients that did not differ from zero). This suggests that the age advantages in emotions are consistent across countries, despite the many differences across the countries in our sample, including pandemic severity.
Discussion
Study 1 provides evidence of robust age advantages in emotional experience during a period of sustained stress across a wide range of cultures, languages, stages of economic development, and pandemic severity. It is worth noting that participants were recruited predominantly via the snowballing method, and the samples were thus not representative or gender balanced. Importantly, however, the consistency in findings across countries speaks against the possibility that these cross-sectional findings reflect cohort effects, that is, incidental differences between generations (Charles, 2010). Instead, these findings are consistent with the view that even during prolonged, unavoidable stress, older adults are still able to employ cognitive and behavioral strategies and skills that help them avoid negative emotional experiences and experience positive emotions (Carstensen et al., 2020).
Study 2: Age Advantages in Emotions During and Before the COVID-19 Pandemic
In Study 2, we sought to address a limitation in Carstensen and colleagues’ (2020) study: the lack of a pre-pandemic baseline condition. As the authors noted, a direct comparison would speak to the role of older adults’ capacity to regulate negative emotions by avoiding stressful situations, which is a central thesis of the strength and vulnerability integration (SAVI) model (Charles, 2010). According to this view, prolonged stress, such as occurs during a pandemic, limits older adults’ capacity to effectively regulate their negative emotions by avoiding aversive events. This would be predicted to manifest as a reduction or nullification in age-related advantages in emotions under stressful conditions. We therefore sought to test whether the age advantages in emotional experience would be diminished during the COVID-19 pandemic compared with pre-pandemic conditions.
Method
Data set
We used an existing data set, the Longitudinal Internet Studies for the Social Sciences (LISS) panel administered by Centerdata (Tilburg University, The Netherlands). The LISS panel is based on a true probability sample of households drawn from the population register by Statistics Netherlands (https://www.lissdata.nl/about-panel). In the current study, we used the LISS Personality and LISS Health data sets collected in the years 2019 and 2020. The data in 2020 were collected between May and June during the first wave of the COVID-19 pandemic in The Netherlands. Participants’ emotions were measured in the LISS Personality data sets using the Positive and Negative Affect Schedule (PANAS; Watson et al., 1988). All participants who completed the PANAS in both 2019 and 2020 were included, yielding a total of 4,370 participants (2,044 men, 2,321 women, five did not provide gender information). In 2019, participants’ age ranged between 16 and 102 years old (M = 54.17, SD = 18.03). Among the 4,370 participants, 4,230 reported subjective health in 2019, and 4,072 reported subjective health in 2020. All 4,370 participants reported their personality scores in both 2019 and 2020. The LISS Personality data sets also includes participants’ emotion data reported annually between 2008 and 2020; participants’ levels of positive and negative emotions per year between 2008 and 2020 are reported in Table S9 in our Supplemental Material.
Measures
Emotions
Participants’ momentary emotional experience were measured using the PANAS with the following instruction: “Indicate to what extent you feel this way right now, that is, at the present moment.” Participants indicated their responses with regard to each emotion on a scale from 1 (not at all) to 7 (extremely). We generated separate mean scores for the 10 positive emotions (interested, excited, strong, enthusiastic, proud, alert, inspired, determined, attentive, active) and 10 negative emotions (distressed, upset, guilty, scared, hostile, irritable, ashamed, nervous, jittery, afraid).
Control variables
Following the same procedure as in Study 1, we controlled for gender, Big Five personality score, and self-reported health, because these have been found to relate to emotional well-being during the pandemic (Carstensen et al., 2020; Sun et al., 2020). Big Five personality was measured using the International Personality Item Pool (IPIP; Goldberg, 1992). Subjective health was measured using the following question: “How would you describe your health, generally speaking?” (1 = poor, 2 = moderate, 3 = good, 4 = very good, 5 = excellent).
Results
Preliminary analyses: emotional experience in 2019 versus 2020
Participants’ positive and negative emotions before and during the pandemic are reported in Table S5 in our Supplemental Material. Participants’ levels of negative emotions were significantly higher during the pandemic (M = 2.19) than before the pandemic (M = 2.12), paired-samples t(4369) = 5.33, p < .0001, indicating that the pandemic was indeed associated with increased levels of negative emotion. In fact, the level of negative emotions in 2020 was significantly higher than in any year that was measured between 2008 and 2020, suggesting that the pandemic was indeed a stressor for the participants (for more details, see Tables S9 and S10 in our Supplemental Material), in line with recent findings (see Aknin et al., in press). Participants’ levels of positive emotions in 2020 were slightly higher (M = 4.48) than in 2019 (M = 4.45), paired-samples t(4369) = 2.29, p = .02. However, the level of positive emotions in 2020 fell within the range of positive emotions reported between 2008 and 2020 (for more details, see Tables S9 and S10). It is thus not clear that participants’ levels of positive emotions during the pandemic were higher than during pre-pandemic years in general.
Primary analyses: age advantages in 2019 versus 2020
We first ran correlation analyses between age and emotions to test for evidence of age advantages in emotions for the years 2019 and 2020 separately. We found that for both 2019 and 2020, age positively correlated with positive emotions and negatively correlated with negative emotions (see Table S6 in our Supplemental Material). This provides evidence that age advantages in emotions occurred both before and during the pandemic.
We then used multilevel analysis to test whether the age advantages in emotions were different in 2020 (during the pandemic) compared with 2019 (shortly before the pandemic). Because one year’s aging is negligible, participants’ age in 2019 was used for data analysis, and age was standardized before being entered into the model. Across models, positive and negative emotions were entered as the outcome. In Model 1, we tested the relationship between age and emotions; age was the fixed-effects predictor and participant ID was a random intercept. Model 2 tested the hypothesis with the fixed-effects predictors participant age (Level 2) and pandemic condition (Level 1; coded 0 for 2019 and 1 for 2020), along with the interaction between age and pandemic condition as a cross-level interaction term. For random effects, participant ID was entered as a random intercept, and pandemic condition was added as a random slope, allowing pandemic condition’s effect on emotions to vary across participants. In Model 3, we added gender (Level 2), subjective health (Level 1), and Big Five personality (Level 1) as fixed-effects predictors. In Model 4, to control for the potential change of relationships between the control variables (gender, subjective health, and Big Five personality) and emotions because of the pandemic, we also added the interactions between these control variables and the pandemic condition. In Models 3 and 4, participant ID was entered as a random intercept, and pandemic condition was added as a random slope.
The results from Models 1 to 4, reported in Table S7 in our Supplemental Material, indicate that age positively predicted positive emotional experience and negatively predicted negative emotional experience. We also found the expected interaction between age and pandemic condition for negative emotions; the interaction remained significant after we added control variables. This suggests that the negative relationship between age and negative emotions was weaker in 2020 (i.e., during the pandemic) than in 2019 (before the pandemic). We did not find an interaction between age and pandemic condition for positive emotions (see Fig. 1).
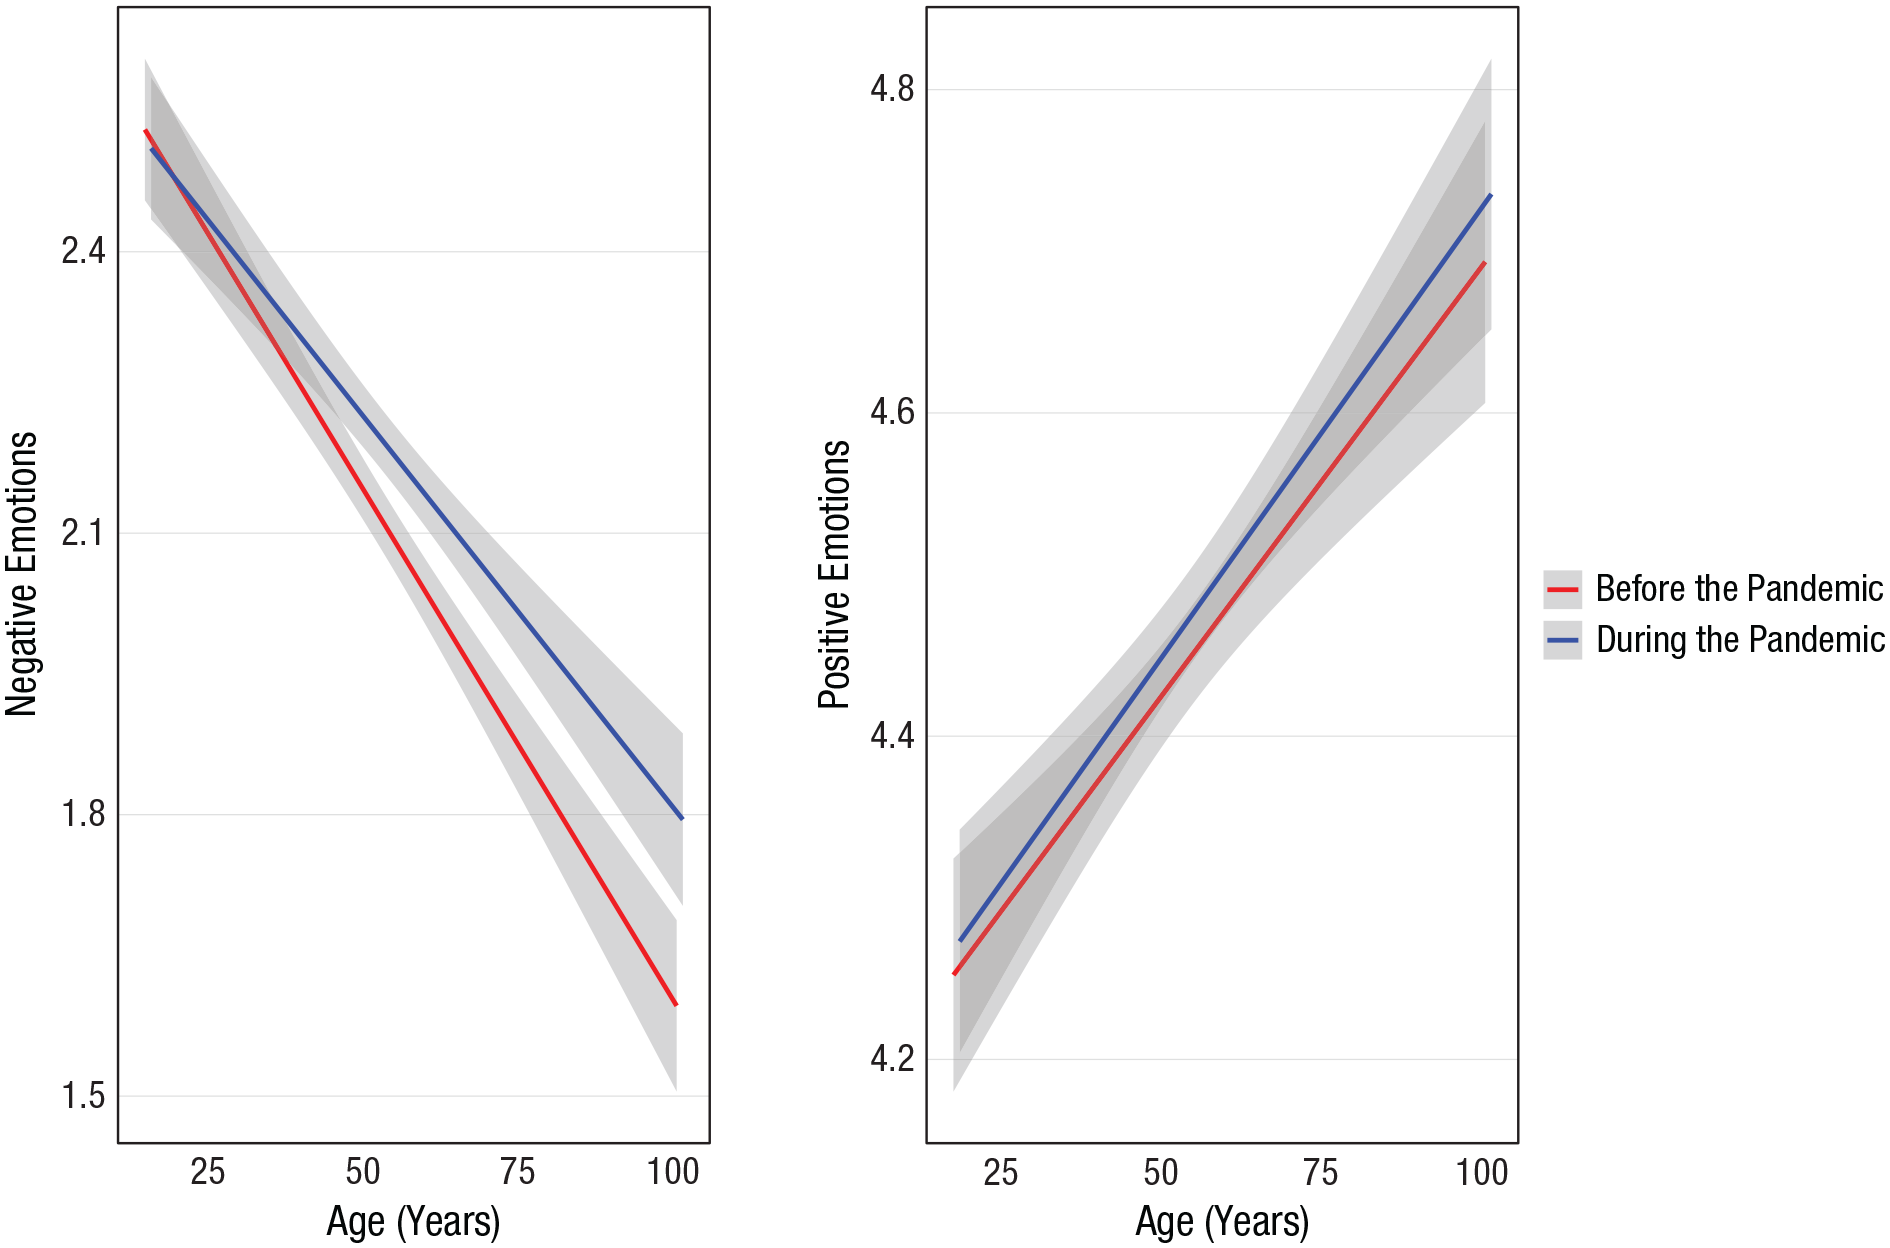
Results from Study 2: relation between age and positive and negative emotional experience before and during the pandemic (N = 4,370). Emotional experience was measured using the Positive and Negative Affect Schedule (1 = not at all, 7 = extremely), and separate averages were obtained for the 10 negative (left) and 10 positive (right) emotions. Scores were measured in the year before the pandemic (2019) and the first year of the pandemic (2020). Shaded areas represent 95% confidence intervals.
In Carstensen and colleagues’ study, participants were between 18 and 76 years old. In our comparison between 2019 and 2020, participants’ ages ranged between 16 and 102 years in 2019. To match the age range to that used by Carstensen et al., we repeated our analyses with only participants who were between 18 and 76 years old in 2019. This yielded a total of 3,928 participants (1,821 men, 2,107 women; M = 52.3 years, SD = 16.20). We reran the same analyses as reported above. The patterns of results are all consistent with those of the larger sample; the results are reported in Table S8 in our Supplemental Material.
Additional analyses
Participants’ emotional experience was repeatedly measured in the LISS Personality data set between 2008 and 2020 using PANAS. We conducted auxiliary analyses of the age advantages in emotions using these longitudinal data. We included a total of 1,629 participants (816 men, 813 women) who completed the PANAS in all measured years. For negative emotions, we found the expected interaction between pandemic condition and age, indicating that the negative relationship between age and negative emotions was weaker during the pandemic than before the pandemic. For positive emotions, we also found an interaction between pandemic condition and age, suggesting that the positive relationship between age and positive emotions was weaker during the pandemic than before the pandemic. Thus, when expanding the duration of pre-pandemic years from 2019 only to 2008 through 2019, we found a diminished age advantage during the pandemic for both negative and positive emotions. Detailed information about the data set, as well as data-analysis procedures and results, are reported in Section C in our Supplemental Material.
Discussion
Using a nationally representative, within-participants data set, Study 2 demonstrated that the age advantages for negative emotions were reduced during the COVID-19 pandemic compared with an immediate pre-pandemic baseline (the year 2019). This reduction of the age advantages in emotions under stress is consistent with theoretical proposals arguing that prolonged stress limits older adults’ capacity to effectively regulate negative emotions by avoiding stressful situations (e.g., Charles, 2010). Certainly the COVID-19 pandemic has drastically curtailed individuals’ opportunities to select situations that minimize negative emotions. It is worth noting that our findings are limited to emotional experience measured by PANAS, which omits low-arousal positive emotions that may be particularly central to older adults’ positive affective experiences.
General Discussion
The present study built on recent work demonstrating that the age advantages in emotional experience have persisted during the COVID-19 pandemic (Carstensen et al., 2020). First, we conducted a large-scale cross-country replication based on data from 23,350 participants in 63 countries. The results were highly consistent in showing that older individuals experienced less negative and more positive emotions than younger adults during the COVID-19 pandemic (see Fig. S1 in our Supplemental Material). This provides strong evidence that older adults around the world enjoy emotional gains that persist even in the face of sustained unavoidable stress.
Second, we tested the prediction that conditions that limit older adults’ ability to effectively regulate their negative emotions by avoiding stressful situations would reduce the age advantages (a prediction of the SAVI model; Charles, 2010). The COVID-19 pandemic is an inescapable, sustained stressor. Such conditions would be unethical to create experimentally but can nevertheless be informative to study when they occur (Carstensen et al., 2020). To that end, we compared the age advantages in emotions before and during the COVID-19 pandemic using a within-participants data set (N = 4,370). We found that the age advantage in negative emotional experience was attenuated during the pandemic. This finding is consistent with the proposal that the age advantages in emotions reflect older adults’ employment of strategies and skills that allow them to reduce their exposure to aversive events (Charles, 2010). Importantly, prolonged stressors, such as the COVID-19 pandemic, limit older adults’ ability to avoid situations that are likely to cause negative emotions.
In sum, our study suggests that older adults might still be able to utilize some strategies and resources that help ameliorate even sustained stress. At the same time, the pandemic precludes some strategies that usually help older people manage their emotions successfully, including the avoidance of negative situations. These findings thus point to the distinct strengths and vulnerabilities of older adults during sustained unavoidable stress.
Supplemental Material
sj-docx-1-pss-10.1177_09567976211052476 – Supplemental material for Sustained Stress Reduces the Age Advantages in Emotional Experience of Older Adults: Commentary on Carstensen et al. (2020)
Supplemental material, sj-docx-1-pss-10.1177_09567976211052476 for Sustained Stress Reduces the Age Advantages in Emotional Experience of Older Adults: Commentary on Carstensen et al. (2020) by Rui Sun and Disa Sauter in Psychological Science
Footnotes
Acknowledgements
We thank Ziyong Lin, Yang Liu, and Alisa Balabanova for their feedback and assistance on the revision of the manuscript.
Transparency
Action Editor: Patricia J. Bauer
Editor: Patricia J. Bauer
Author Contributions
Both of the authors conceived and developed the ideas for this research. R. Sun conducted the statistical analyses, and both of the authors interpreted the results. The figure was designed by R. Sun with input from D. Sauter. Both authors wrote the manuscript and approved the final version for submission.
Notes
References
Supplementary Material
Please find the following supplemental material available below.
For Open Access articles published under a Creative Commons License, all supplemental material carries the same license as the article it is associated with.
For non-Open Access articles published, all supplemental material carries a non-exclusive license, and permission requests for re-use of supplemental material or any part of supplemental material shall be sent directly to the copyright owner as specified in the copyright notice associated with the article.