
Abstract
Integration to boundary is an optimal decision algorithm that accumulates evidence until the posterior reaches a decision boundary, resulting in the fastest decisions for a target accuracy. Here, we demonstrated that this advantage incurs a cost in metacognitive accuracy (confidence), generating a cognition/metacognition trade-off. Using computational modeling, we found that integration to a fixed boundary results in less variability in evidence integration and thus reduces metacognitive accuracy, compared with a collapsing-boundary or a random-timer strategy. We examined how decision strategy affects metacognitive accuracy in three cross-domain experiments, in which 102 university students completed a free-response session (evidence terminated by the participant’s response) and an interrogation session (fixed number of evidence samples controlled by the experimenter). In both sessions, participants observed a sequence of evidence and reported their choice and confidence. As predicted, the interrogation protocol (preventing integration to boundary) enhanced metacognitive accuracy. We also found that in the free-response sessions, participants integrated evidence to a collapsing boundary—a strategy that achieves an efficient compromise between optimizing choice and metacognitive accuracy.
Keywords
Cognition refers to the set of processes via which we make judgments about the world (e.g., deciding whether a stock’s value is likely to rise on the basis of a sequence of returns), whereas metacognition refers to judgments that we make about our own cognition (e.g., how confident we are in our decision to purchase this stock). Confidence is a canonical example of such a metacognitive judgment, and previous research has demonstrated that humans can both estimate their decision confidence in a way that is reliably related to cognitive performance and rely on confidence to modulate further cognition (Bahrami et al., 2010; Balsdon et al., 2020; Carlebach & Yeung, 2020; Desender et al., 2019; Hainguerlot et al., 2018; Rollwage et al., 2020; Sanders et al., 2016; van den Berg et al., 2016). The extent to which confidence tracks variation in objective performance is known as confidence resolution or metacognitive sensitivity (Fleming & Lau, 2014).
Research in the past few decades has converged on integration to boundary as an efficient, Bayesian mechanism for evidence-based decision-making (Bogacz et al., 2006; Ratcliff et al., 2016; Teodorescu & Usher, 2013). Integration to boundary allows participants to decide not only what decision to make but also how long to keep gathering evidence before committing to a particular choice (Fig. 1b). By integrating evidence to a boundary, one improves the signal-to-noise ratio, resulting in decisions with the fastest reaction time (RT) for a given accuracy level (Bogacz et al., 2006; Wald & Wolfowitz, 1948). Moreover, integration to boundary is a key mechanism in most choice-RT models that account for key experimental data patterns, such as the shape of the RT distribution and its dependency on the strength of evidence, as well as the speed/accuracy trade-off (Ratcliff et al., 2016; Teodorescu & Usher, 2013).
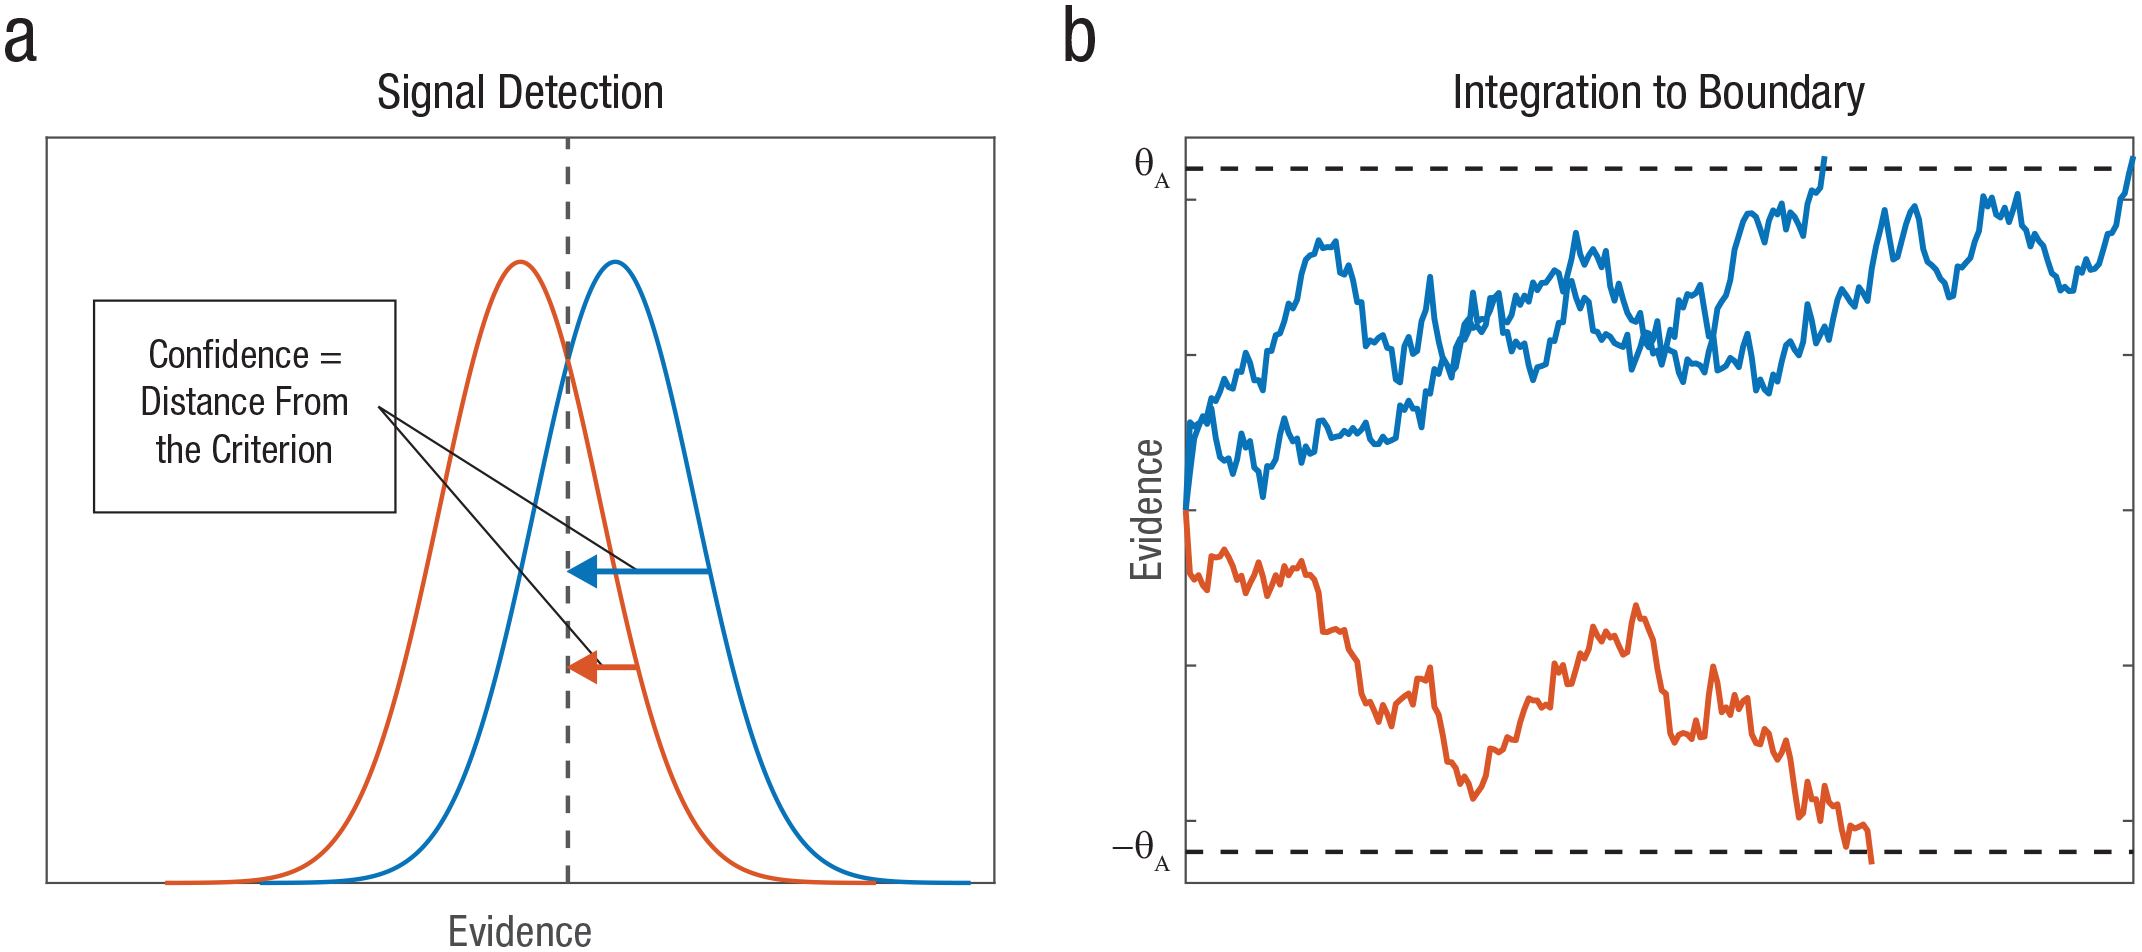
Predictions of the signal detection theory and integration-to-boundary models. Signal detection theory (a) can be used to generate decisions and confidence with a fixed number of samples. The decision is a binary comparison of evidence with a criterion (indicated by the dashed vertical line), and confidence is the distance from criterion. The blue and red curves correspond to samples from two types of stimuli, respectively, for which confidence is determined as the distance from criterion. Resolution is positive because the further one is from criterion, both confidence and expected accuracy increase in tandem. For the integration-to-boundary model (b), three example trials are shown (two with correct responses [blue] and one with errors [red]). The upper “A” boundary is the correct response. Integration is terminated when the posterior probability reaches a constant threshold; this minimizes differences between trials in confidence and therefore reduces confidence resolution. Dashed horizontal lines indicate the response boundaries.
There is less agreement on the mechanisms supporting metacognitive judgments of confidence about such decisions (Yeung & Summerfield, 2014). Although various confidence mechanisms have been proposed, they differ drastically in their nature, from Vickers’s balance of evidence, which is based on a nonnormative race model of choice (Vickers, 1979; see also De Martino et al., 2013; Merkle & Van Zandt, 2006; Reynolds et al., 2020), to the more recent two-stage, dynamic signal detection theory (SDT) model (Pleskac & Busemeyer, 2010), which is based on a normative, integration-to-boundary choice model. One problem with the latter type of models is that if evidence continues to be collected until the integrated evidence reaches a constant boundary (corresponding to the expected posterior probability; Fig. 1b), there is little variability left (between trials) that can signal variations in objective accuracy. In other words, these models suggest that confidence should be similar for decisions that terminate at the same boundary. 1 Researchers have dealt with this problem using normative confidence models, such as the two-stage, dynamic SDT model, which introduced the idea of postdecision integration (Moran et al., 2015; Pleskac & Busemeyer, 2010), according to which confidence is based on the consistency with which some extra evidence (collected after the decision is made but before the confidence is signaled) supports the decision. Other confidence models account for variations in confidence in additional ways, for example, by relying on decision time as a proxy for confidence (Zakay & Tuvia, 1998) in addition to a balance-of-evidence mechanism (Kiani et al., 2014), or by assuming that the decision itself is determined by a race between multiple confidence accumulators (Ratcliff & Starns, 2009; for a recent review and discussion of normative models, see Calder-Travis et al., 2021).
Statement of Relevance
Whereas cognition is a process of making judgments about the world, metacognition is the process of reflecting, monitoring, and controlling one’s own cognitive processes. Research in experimental psychology and neuroscience has demonstrated that humans can make metacognitive judgments about their own decisions, which reflects their decision accuracy, and has investigated the underlying mechanism. In this study, we examined a specific aspect of metacognition—decision confidence. Using a controlled experimental paradigm, we determined how the mechanism underpinning confidence formation adapts to task contingencies in order to optimize behavioral performance. In particular, we demonstrated a novel trade-off between cognitive and metacognitive performance, and we examined strategies that allow human agents to balance and optimize both performances. The results have implications for understanding the conditions under which we are able to rely on metacognition to enhance our performance (such as when we decide how much effort we should invest on various questions in an exam).
A broader consideration of such frameworks suggests that humans face a cognitive/metacognitive trade-off with regard to the normative aspects of their decisions and confidence judgments. When faced with a stream of stochastically fluctuating evidence, an observer can integrate the evidence to a decision boundary—a fixed boundary is optimal for choices with a fixed difficulty level, corresponding to the sequential probability-ratio test (Wald, 1947)—optimizing the decisions at the expense of metacognitive accuracy or confidence resolution (defined here as the difference between the confidence of correct and incorrect responses). Alternatively, observers can adopt a less normative decision strategy, which allows them enough information to achieve an improved confidence resolution. The simplest such strategy is to dispose of integration to boundary altogether in favor of taking a number of samples (either fixed or determined by a random timer that is independent of the decision) before committing to the decision. Whereas this results in less optimal decisions, it allows the observer to rely on the SDT framework, in which confidence corresponds to the distance from a criterion (Kepecs & Mainen, 2012), thus providing a robust degree of confidence resolution (Fig. 1).
We report three experiments that tested this idea. The first is a pilot experiment (N = 17), the second is a preregistered experiment (N = 35), and the third is an experiment carried out during the review of this article to rule out potential confounds (N = 50). In all experiments, participants were asked to make decisions about fluctuating evidence, followed by confidence ratings. Each participant completed two sessions. In the first session, we used a free-response protocol, in which the evidence was presented until the participant responded (this is thought to engage an integration-to-boundary strategy in most participants). In the second session, we used an interrogation protocol, in which the evidence was presented for a predetermined number of samples, and the response was requested after the evidence stream ended (Bogacz et al., 2006). Critically, each trial in the interrogation session had an equal number of frames (and the same average signal and noise) as in the corresponding trial from the free-response session. To anticipate our results, we confirmed the predicted trade-off—metacognitive accuracy was higher (and choice accuracy was lower)—in the interrogation session compared with the free-response session. We start with a brief computational section that highlights the basis for our predictions, followed by the results of the experiments, which examined how confidence was formed in the two paradigms.
Computational Methods: Predictions on Confidence Resolution
Consider a task that presents sequences of pairs of two-digit numbers, randomly sampled from two overlapping normal distributions (Fig. 2). Participants, who are unaware of the distributions, are required to choose which sequence—left or right—is generated from the higher mean distribution.
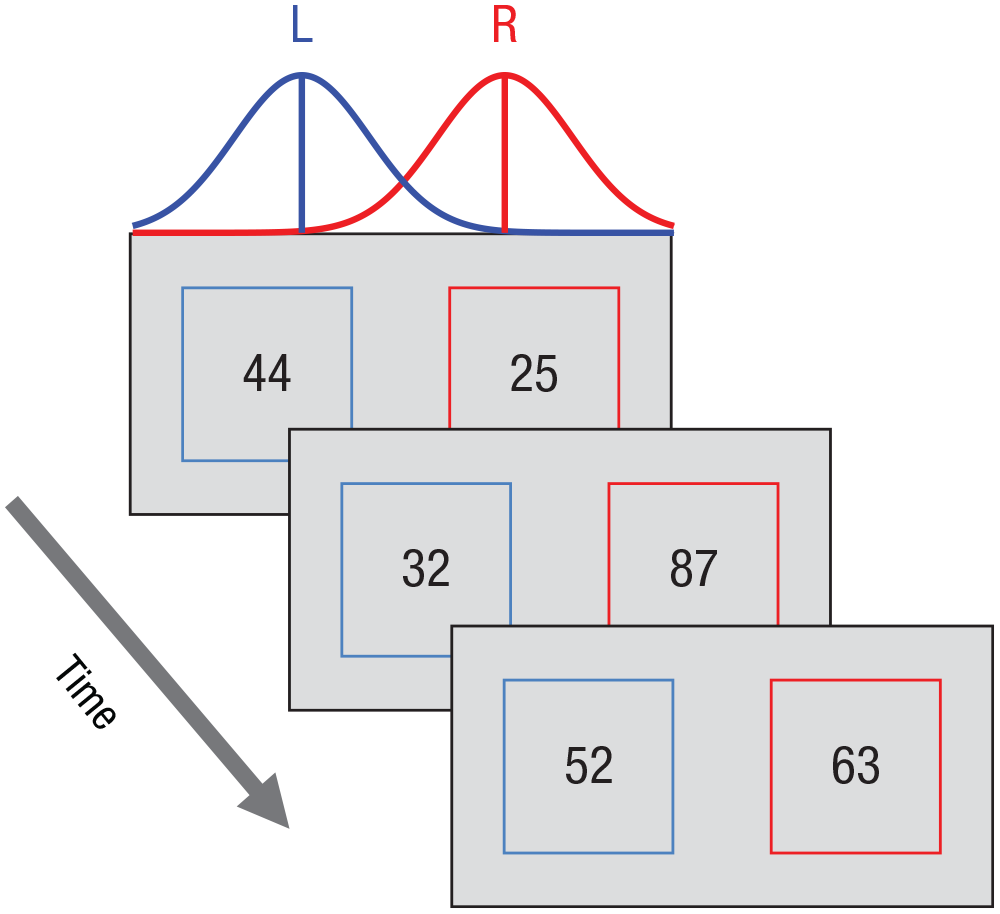
Experimental paradigm in the free-response and interrogation sessions. Sequences of two-digit numbers, selected from Gaussian distributions, were presented at a rate of two pairs per second until the participant responded (either “left” [L] or “right” [R]) to indicate which evidence stream was larger on average. In this example trial, the correct answer was “R” (because the right-hand sequence was generated from a distribution with a higher mean). The experimental paradigm in the two sessions was the same, except that in the interrogation session, the trial was terminated after a fixed number of samples.
We simulated two types of decision strategy: (a) integration to a fixed boundary (sequential probability-ratio test) and (b) integration of a fixed number of samples, chosen to produce the same accuracy as in (a). In (a), the amount of integrated evidence was by definition fixed by the constant boundary and exhibited little variability between trials (however, see Note 1 and Fig. 3a for simulation results showing that this produced very low confidence-accuracy correlations). We also considered the prominent two-stage, dynamic SDT mechanism (Pleskac & Busemeyer, 2010), which suggests that in such situations, confidence resolution can be improved by sampling postdecision evidence and examining the strength of its consistency with the decision. We implemented this in the simplest way, by taking one extra sample (following the integration-to-boundary decision). This extra sample can carry information that is consistent with the decision (leading to higher confidence) or inconsistent with it (leading to lower confidence; see Pleskac & Busemeyer, 2010, Fig. 1, reproduced as Fig. S4 in the Supplemental Material available online). 2 As shown in Figure 3b, this resulted in an increase of the correlation between confidence and accuracy.
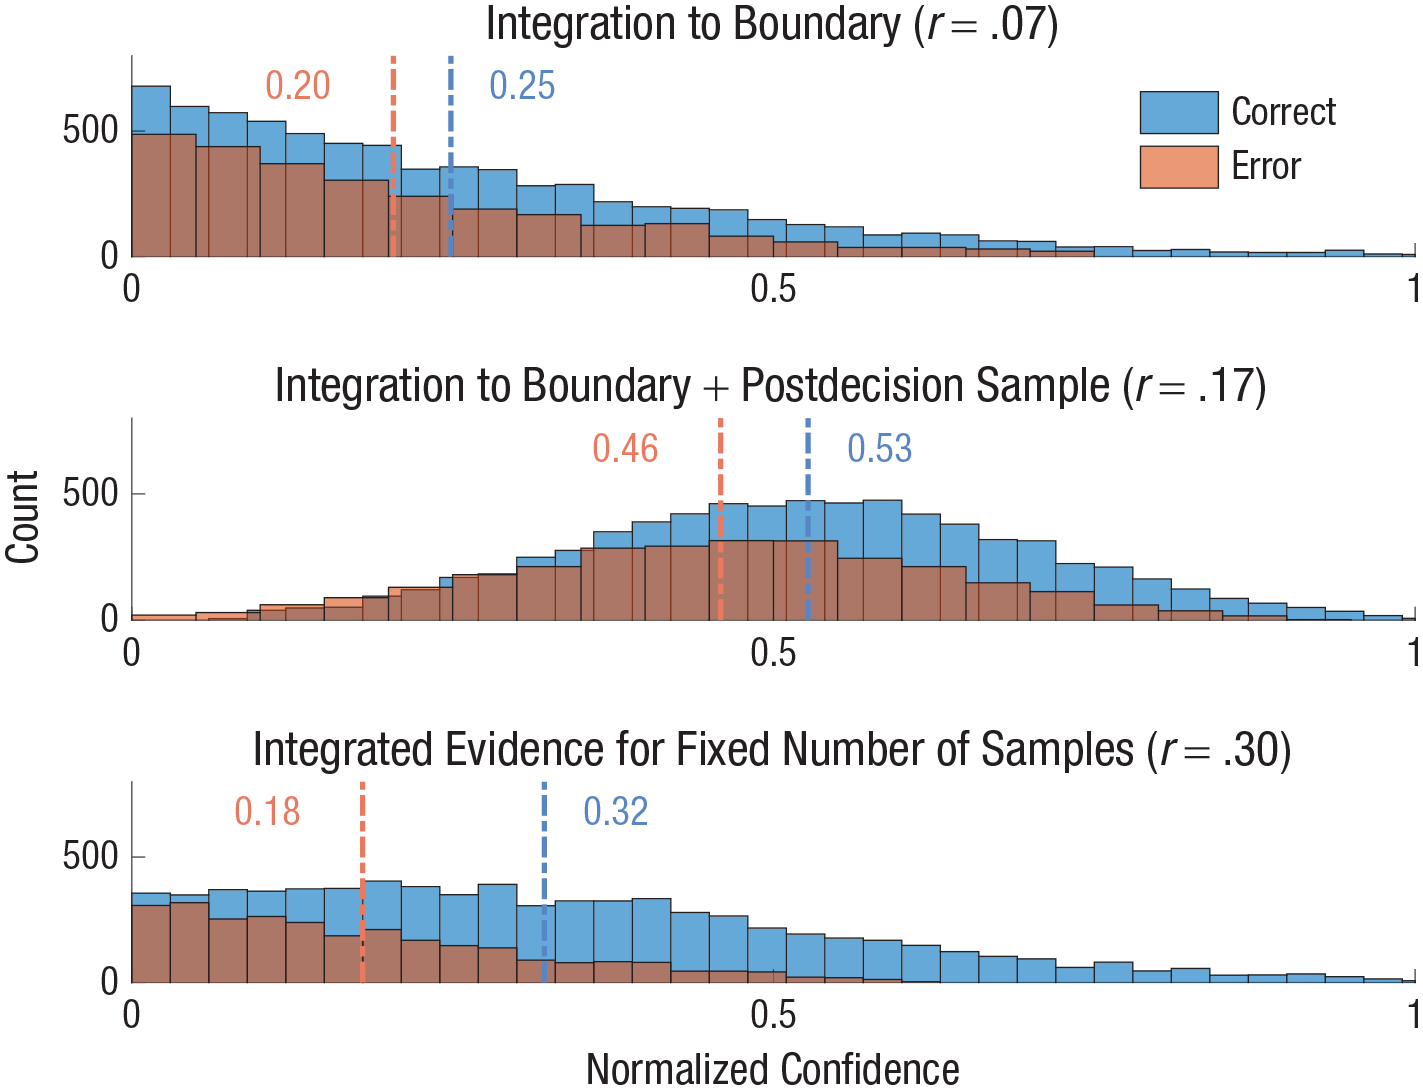
Confidence distributions for three models of choice and confidence. For each model, the distribution of normalized confidence levels is shown for correct (blue) and incorrect (red) responses (dashed lines indicate mean confidence for each condition). The correlation between confidence and choice accuracy is also shown. The models shown in the top and middle panels rely on integration to boundary to determine choice (in free-response protocols). The two panels show the effects of two different rules for how confidence is computed: integrated evidence to boundary only (top panel) or integrated evidence + postdecision evidence sample (middle panel). The bottom panel shows both choice and confidence computed by applying signal detection theory to the total evidence over a fixed number of samples that was selected to equalize accuracy levels of the free-response and interrogation protocols. Here, confidence was determined using the signal detection theory framework by calculating the absolute distance from the criterion (for details, see the Supplemental Material available online).
For the “integration over a fixed number of samples” simulation (which can be naturally applied either in an interrogation task or in a free-response task, if evidence termination is based on a random timer), we determined confidence from all the evidence available in the trial and not from the last frame only. Here, there are two distributions for the total evidence—one for trials in which the rightward evidence stream has a greater mean and one for trials in which the leftward evidence stream has a greater mean (where the x-axis corresponds to left-to-right evidence). We therefore relied on standard SDT approaches (e.g., Kepecs & Mainen, 2012) to compute choice (as the sign of the sample relative to the decision criterion) and confidence as the normalized distance (minimum–maximum normalization) from the decision criterion (i.e., the y-axis that corresponds to 0 confidence; Fig. 1a; for details, see the Supplemental Material). In Figure 3, we plot example distributions of the normalized confidence obtained from simulations of the three decision rules: (a) integration to boundary only (top panel), (b) integration to boundary followed by one postdecision sample for confidence (middle panel), and (c) a decision based on a fixed number of samples (using SDT; bottom panel). In all cases, we show this separately for correct responses (blue) and incorrect responses (red) and report the correlation between confidence and choice accuracy. Note that we present the results only for the case in which the left distribution had a higher mean than the right one (left trials), as the other case (right > left) is symmetrical (for further details, see the Supplemental Material). As shown in Figure 3, the interrogation protocol resulted in enhanced confidence resolution, as indicated by a higher correlation between confidence and accuracy (r = .30 compared with r = .17) and by a larger difference in (normalized) confidence of correct and incorrect responses. This result is an expected outcome of the fact that the total evidence has more relevant information about the likelihood of a decision being correct than a single (postdecision) evidence frame. Note that in the absence of any postdecision evidence, the integrated evidence became similar in all trials (but see Note 1), and the confidence–accuracy correlation was even lower (r = .07; Fig. 3, top panel).
As we show in the Supplemental Material, adopting a collapsing (rather than a fixed) boundary (Evans et al., 2020; Glickman et al., in press; Glickman & Usher, 2019; Malhotra et al., 2017; Palestro et al., 2018) in the free-response protocol allowed agents to obtain a confidence resolution that was higher than that based on the last sample but still lower than what could be obtained based on the total evidence (assuming that the same number of evidence samples from the same distributions was used in the two cases).
General Method
Each experiment presented participants with sequences of fluctuating evidence (pairs of numbers or lines sampled from overlapping Gaussian distributions) at a rate of about two pairs per second (Fig. 2) and required them to decide which sequence originated from the higher of the two Gaussian distributions. All participants carried out two sessions: a free-response session and an interrogation session. In the free-response session, the evidence continued until response (or a deadline of 15 frames). In the interrogation session, the evidence was presented for a fixed number of frames, which was equated (for each participant) to that of the free-response session. This was done either on a trial-by-trial basis (Experiments 1 and 2) or on average (Experiment 3). For example, in Experiments 1 and 2, if a participant responded in Session 1 after five frames in Trial 1 and after nine frames in Trial 2, then in the second session, that participant was presented with five frames in Trial 1 and nine frames in Trial 2 (for additional methods, see the Supplemental Material).
A total of 102 undergraduates from Tel Aviv University (68 female; age: M = 25 years, range = 21–35 years) participated in the three experiments. The participants received course credit in exchange for taking part. The experiments were approved by the ethics committee at Tel Aviv University. The number of participants in the first experiment (the pilot) was determined on the basis of previous similar confidence studies (e.g., Pleskac & Busemeyer, 2010). In Experiment 2 (N = 35) and Experiment 3 (N = 50), the number of participants was determined through power analysis based on our effect sizes in Experiments 1 and 2, respectively (we used higher power in Experiment 3, as this included a few changes to the design; see the Method section for Experiment 3).
Experiments 1 and 2
Method
Experiments 1 and 2 used the same paradigms (Fig. 2). Each trial began with a fixation point followed by two rapidly changing (2 Hz) sequences of numerical values. Participants were instructed to indicate which sequence was drawn from a distribution with a higher mean. Critically, in the first session, we used a free-response paradigm in which the participant’s decision terminated the trial, and in the second session, we used an interrogation paradigm in which participants had to wait until the sequences ended and only then make a decision. The two session types were manipulated within participants, and the free-response session was always presented first. The number of samples in each trial in the interrogation session was determined according to the number of samples that the participant used in the free-response session at the corresponding trial. A small difference between Experiment 1 and Experiment 2 was that in Experiment 1, the number of samples in each trial for the interrogation session was always equal to the corresponding trial from the free-response session. In Experiment 2, the number of samples in the interrogation session was either equal or equal minus 1 (n or n – 1) depending on the RT within the last sample (RT ≥ 250 ms = n, RT > 250 ms = n – 1). This change was made because of our assumption that trials in which participants responded faster than 250 ms were those in which the last sample was not used to guide the decision but could be used to inform confidence. The stimuli were sampled from overlapping Gaussian distributions with s of 10. In the free-response sessions, all participants started with the same means of the two Gaussian distributions (μ1 = 52 vs. μ2 = 46). To keep general performance between 70% and 90% correct for all participants, we increased μ2 in steps of 1 following blocks of 30 trials with performance higher than 90% accuracy and decreased μ2 in steps of 1 following blocks with performance lower than 70% accuracy. Each session consisted of five blocks of 30 trials each, and the stimulus difficulty for each block of the interrogation session was equated to the corresponding block of the free-response session.
Results
Experiment 1
Choice accuracy in each session and three measures of confidence resolution are reported in Table 1 as averages across participants. For the free-response session, accuracy corresponds to the fraction of trials in which participants selected the stream generated from the higher Gaussian distribution. Thus, if a participant responded after a single frame by selecting the larger of the two numbers presented, this counted as an error if this higher sample happened to come from the lower Gaussian distribution. If the number of samples exceeded 15, the presentation of the numerical values stopped, and the response of the participant was randomly chosen. Note that in the preregistration, we considered those trials as errors. This difference accounts for the small discrepancy between the accuracy level in the free-response condition (Table 1) and the accuracy level in the preregistration. In the interrogation session, accuracy corresponds to the selection of the alternative that received higher evidence in that trial because selecting on the basis of this is the best strategy that a participant can adopt.
Average Choice Accuracy and Measures of Confidence Resolution in Experiment 1
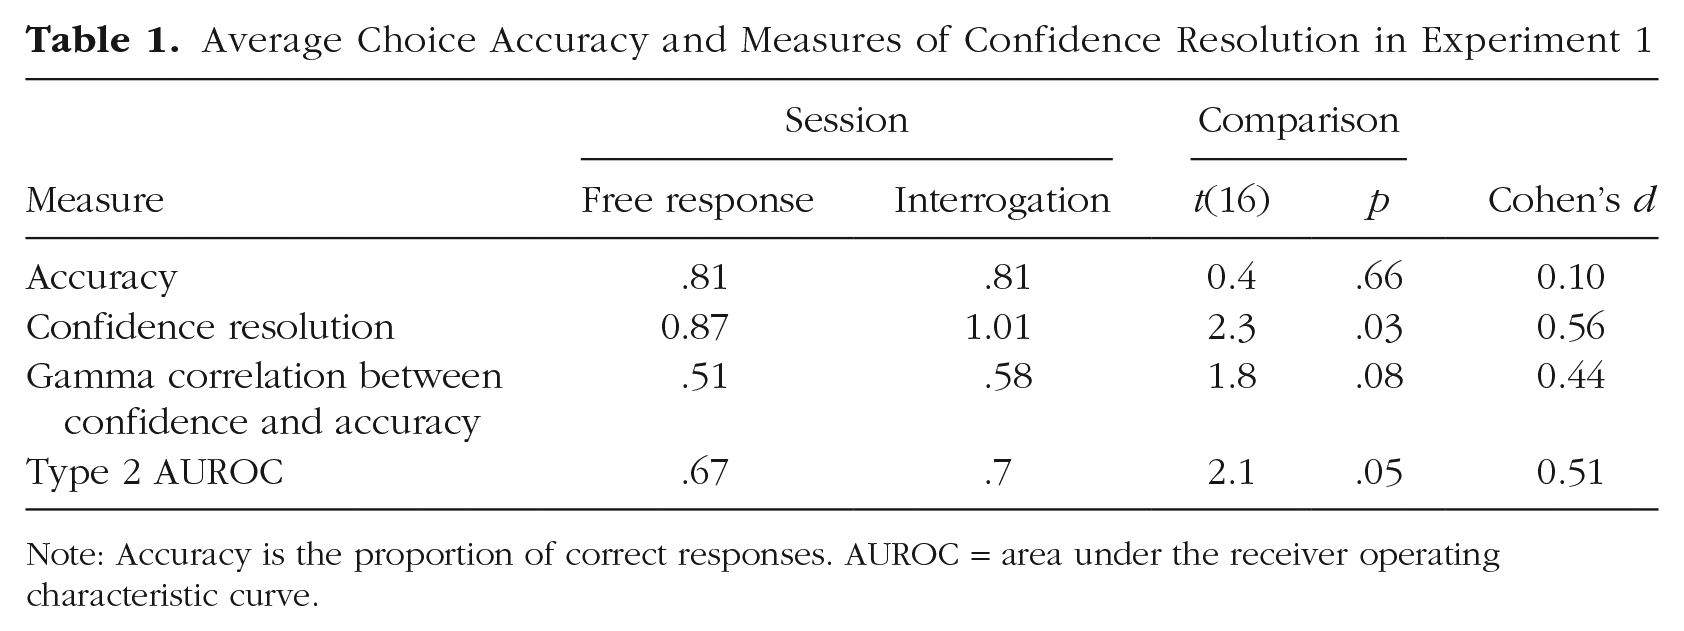
Note: Accuracy is the proportion of correct responses. AUROC = area under the receiver operating characteristic curve.
Three measures of confidence resolution were computed: (a) the difference between the confidence of correct and error responses, (b) the trial-by-trial gamma correlation between confidence and accuracy (Nelson, 1984), and (c) the Type 2 area under the receiver operating characteristic (AUROC) measure of metacognitive performance (Clarke et al., 1959; Fleming & Lau, 2014).
Choice accuracy was highly similar in the two sessions (note, however, that participants had the advantage of practice in Session 2, and also the criterion was adjusted to the overall evidence, which is what participants could judge). In contrast, all three measures of confidence resolution show improved metacognitive performance in the interrogation session. This reached statistical significance for two of the measures and was marginal for the third one. Finally, in Figure 4, we show the correlation between confidence and RT in the two sessions.
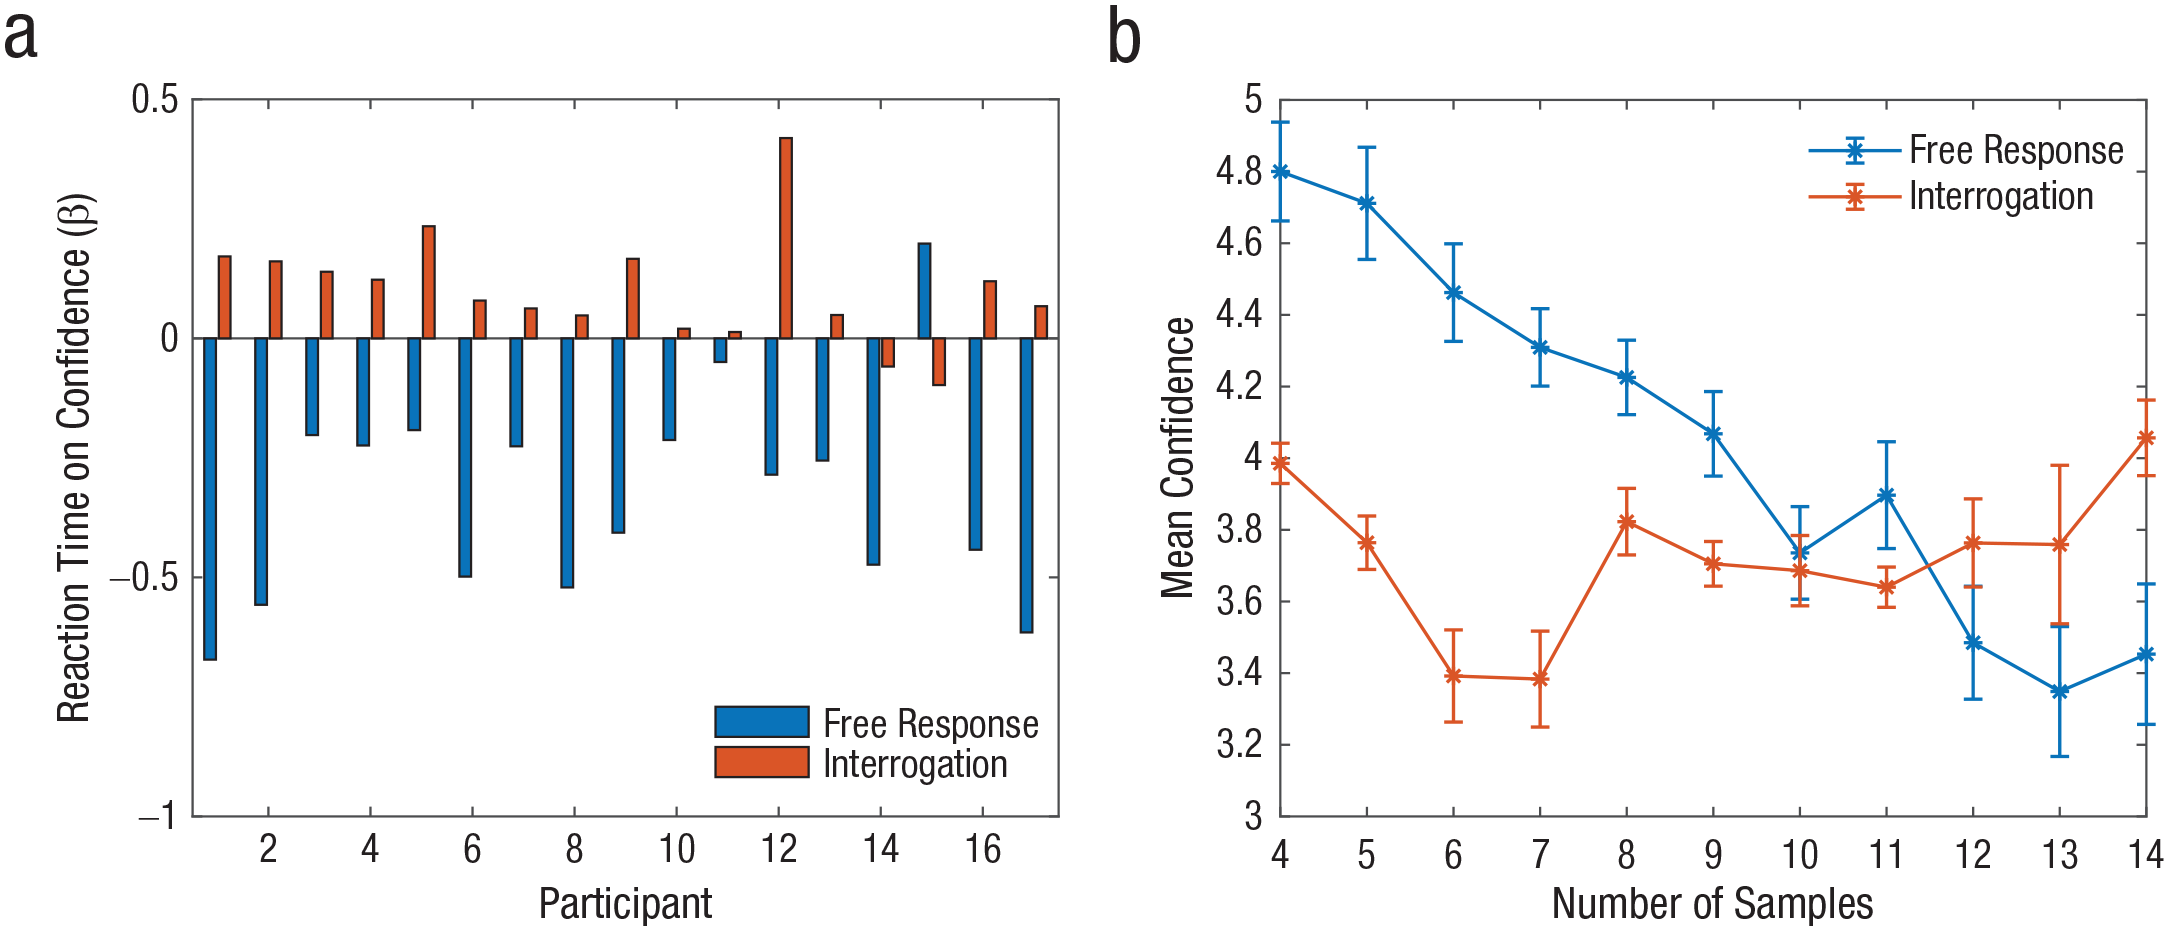
Confidence in Experiment 1. Beta weights for the effect of reaction time on confidence (a) are shown for each participant in the free-response and interrogation sessions. Group-mean confidence is shown (b) as a function of reaction time (number of samples before responding) in the two sessions. Error bars represent within-subjects standard errors (Cousineau, 2005).
The typical negative correlation between confidence and RT was found only in the free-response session (mean β = −0.34, SD = 0.19). This indicates that in free-response situations, participants used the number of samples they examined as a proxy for the task difficulty and thus for confidence (Kiani et al., 2014; Zakay & Tuvia, 1998). Alternatively, participants could rely on a collapsing boundary to form their choice (Evans et al., 2020; Glickman & Usher, 2019; Malhotra et al., 2017; Palestro et al., 2018) and then use this time as a proxy for the level of the boundary reached at decision time. In the interrogation session, on the other hand, the correlation between confidence and accuracy was positive (mean r = .1, SD = .1). These dissociations between confidence and RT (as a result of the self-termination vs. controlled decision time) are consistent with findings in the previous literature (see Benchmarks 4 and 5 in Table 2 of Pleskac and Busemeyer, 2010, and additional references there). We defer an explanation of this difference to the Supplemental Material.
Average Choice Accuracy and Measures of Confidence Resolution in Experiment 2
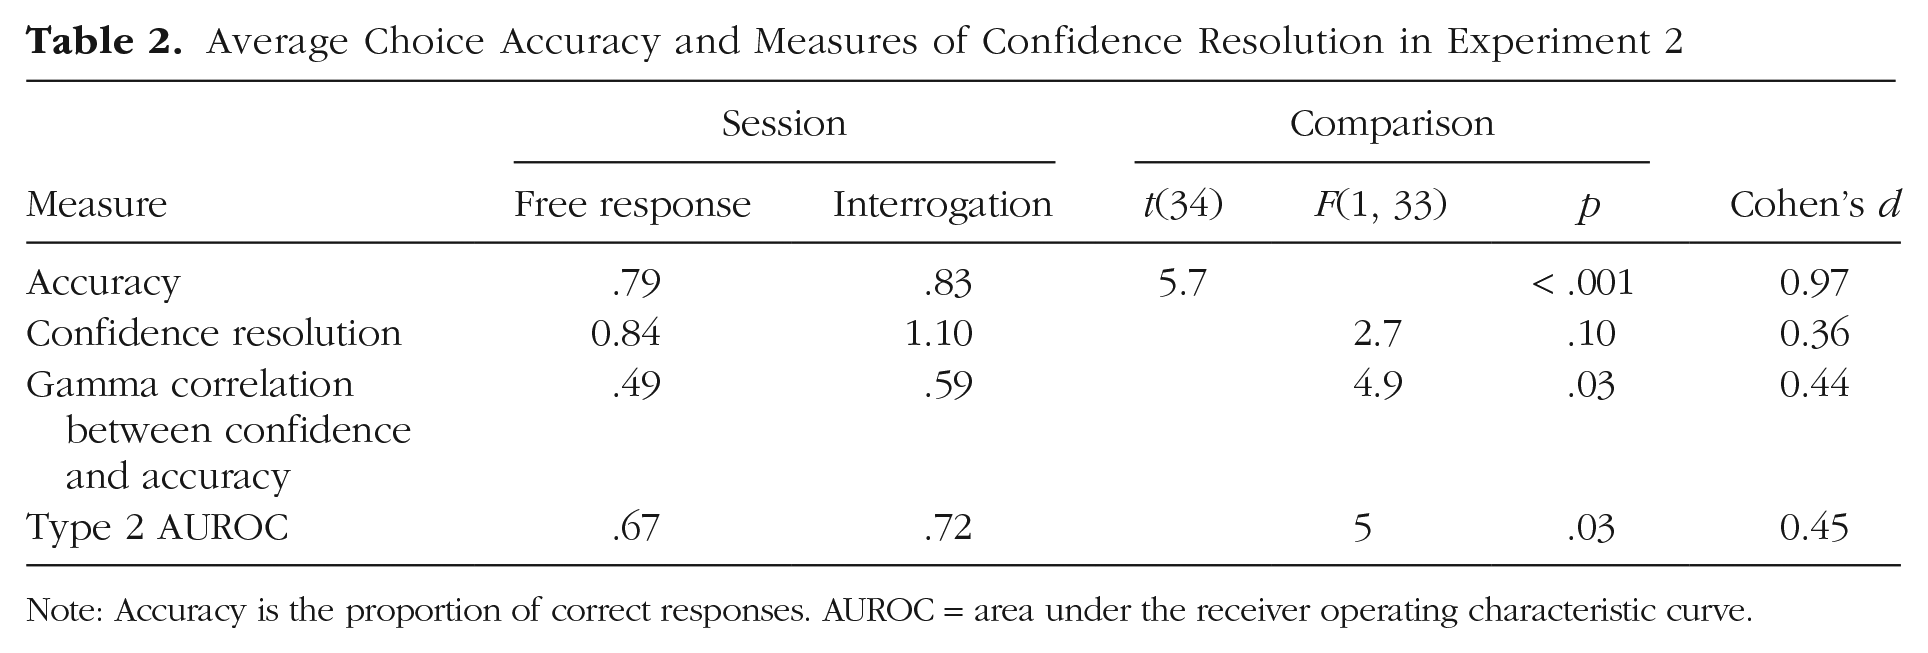
Note: Accuracy is the proportion of correct responses. AUROC = area under the receiver operating characteristic curve.
Experiment 2
On the basis of the above results, we carried out a preregistered experiment (https://osf.io/gt2qz/) on a larger cohort of participants (N = 35). This sample size was selected on the basis of an a priori power analysis that tested the difference between confidence resolution in Session 1 and Session 2 of Experiment 1 (using a two-tailed paired-samples t test with an α of .01). This analysis showed that 35 participants were required to achieve a power of .80.
In Table 2, we report the same measures of choice accuracy and metacognitive performance as used in the analysis of Experiment 1. Choice accuracy was significantly higher in the second session (again, this includes benefits from practice). All three measures of metacognition were higher in the interrogation session. To establish that such differences were not simply due to differences in task accuracy, we carried out an analysis of covariance (ANCOVA), which compared the metacognitive performance measures while controlling for differences in accuracy. Note that an alternative approach here would be to use a model-based estimate of metacognitive efficiency (i.e., metacognitive performance controlling for task performance) such as meta-d′/d′ (Maniscalco & Lau, 2012). However, because of the meta-d′ framework assuming an underlying SDT model for confidence, which we anticipated would not hold for the free-response session, we instead focused on model-free estimates of metacognitive performance and controlled for task-performance differences after data collection. After controlling for performance, we continued to obtain higher metacognitive performance in the interrogation compared with the free-response task, as predicted, and we found significant differences in two of the measures and a trend in the third one. We note that the Type 2 AUROC, which unlike gamma is unaffected by biases in overall confidence level (Fleming & Lau, 2014), was consistently higher in the interrogation session in both Experiments 1 and 2. Finally, we examined whether the improvement in metacognition was correlated with the improvement in choice accuracy. There was no correlation between these measures (r = –.02), further suggesting that the metacognitive improvement was not due to differences in task performance.
To better understand differences between the mechanisms of confidence formation in the free-response and interrogation sessions, we first examined the correlation between confidence and RT (in the two sessions). Replicating the findings of Experiment 1, analyses showed that the correlation between confidence and RT was negative in the free-response session but not in the interrogation session (Fig. 5).
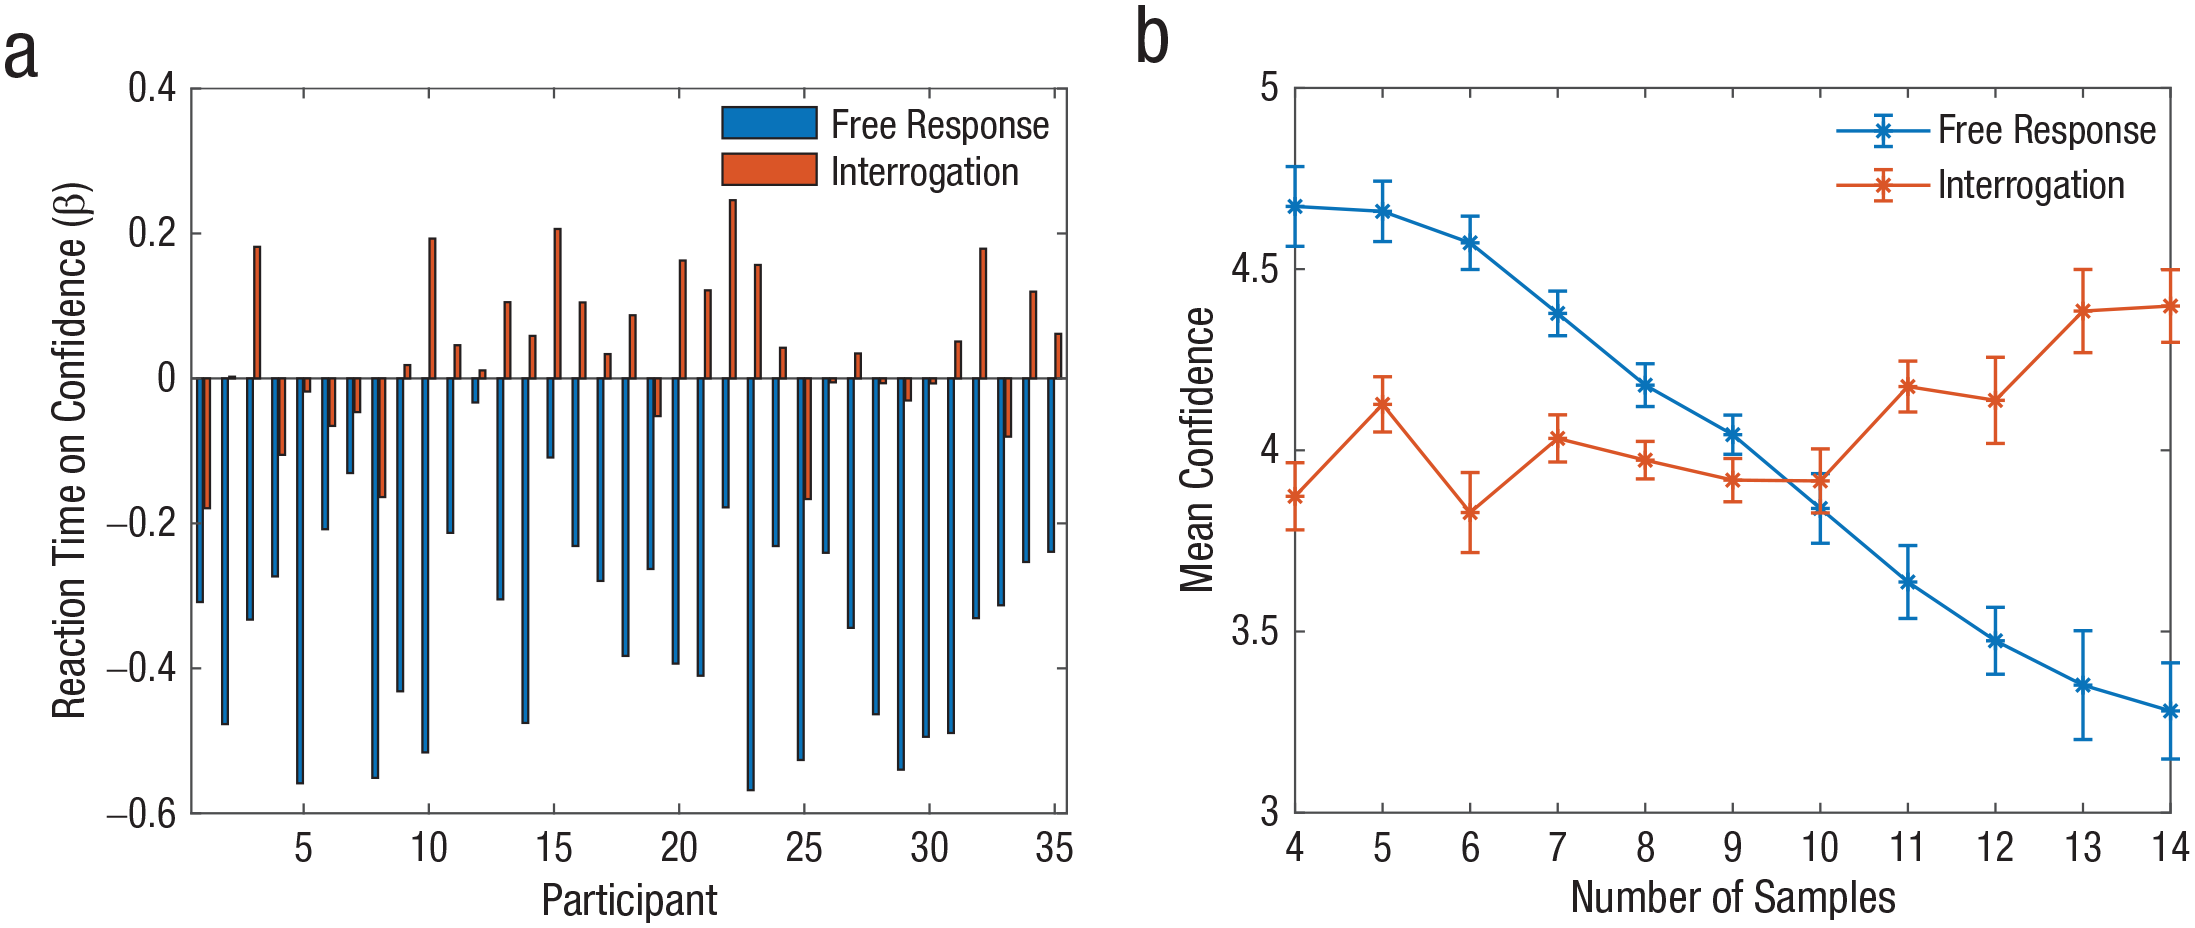
Confidence in Experiment 2. Beta weights for the effect of reaction time on confidence (a) are shown for each participant in the free-response and interrogation sessions. Group-mean confidence is shown (b) as a function of reaction time (number of samples prior to reaching a decision) in the two sessions. Error bars represent within-subjects standard errors (Cousineau, 2005).
Second, as indicated by the fits of alternative computational models (for details, see the Supplemental Material), we found that in the free-response sessions, participants’ choices were best described by an integration to a collapsing boundary model (Balsdon et al., 2020; Evans et al., 2020; Glickman & Usher, 2019; Malhotra et al., 2017; Palestro et al., 2018), which is optimal under conditions that mix difficulty levels (Malhotra et al., 2017). In turn, confidence in the free-response session was best accounted for by three predictors: (a) the evidence from the last item in the sequence, (b) the remainder of the evidence, and (c) RT (consistent with a robust negative correlation observed between confidence and RT; Figs. 4 and 5). In the interrogation session, on the other hand, we found that choices were well accounted for by the SDT model based on integrated evidence (for reverse correlation analysis ruling out an implicit boundary for evidence integration, see Fig. S5 in the Supplemental Material; Kiani et al., 2008). For confidence, we found that the best predictors were the total accumulated evidence or a leaky integration of the evidence with an average leak factor of .88 per frame (i.e., .88 of the integrated evidence was maintained at every time frame while the rest leaked; Teodorescu & Usher, 2013; for model description and parameters, see the Supplemental Material). 3 Importantly, as illustrated in Figures 4 and 5, unlike in the free-response task, the trial length (number of frames) was positively correlated with confidence. Further analysis indicated that this was because of the association between time and amount of evidence in this task: The correlation became null after the total evidence was partialed out (see Fig. S4).
Discussion
In the first two experiments, we found support for the idea that the adopted decision strategy (free response or interrogation) affects metacognitive performance. In particular, when participants were allowed to freely choose when to respond (i.e., when they integrated evidence to an internal decision boundary), their metacognitive performance was lower than when they made a decision on the basis of an exogenously determined number of samples. However, it can be argued that these results were caused by a confound related to how accuracy was measured in the two tasks. In the free-response task, a correct choice was defined according to the generating distributions (the nominal evidence)—which is how the task was presented to participants (they needed to decide which evidence stream, left or right, corresponded to the higher payoff distribution; Fig. 2). In contrast, in the interrogation task, the correct choice was defined by the actual stream that was presented to the participant (the actual evidence). Note that in the interrogation condition, deciding about the actual evidence was more natural to the participants because they had no way to obtain additional evidence to dissociate between actual accuracy (what they saw) and nominal accuracy (i.e., the generating distribution). Moreover, in a fraction of “conflict” trials (on average, 13% for the interrogation session and 5% for the free-response session), these two accuracy criteria (actual/nominal) differed. For example, one may have had a trial in which the higher evidence-generating stream was on the left, but at the time of response, the right sequence had delivered a higher amount of observed evidence. The fraction of such conflict trials was higher in the interrogation session because in this session, the evidence was sampled afresh, independently of the number of evidence samples. By contrast in the free-response task, there was a dependency between the evidence and the number of samples, so that short evidence trials were easier (resulting in faster integration to boundary). Consequently, if the participant responded in such a conflict trial on the basis of the actual evidence, this counted as a mistake in the free-response task (where the task was to decide on the generating distribution, and it was the participant’s fault for deciding too soon), but it counted as a correct response in the interrogation session (where the participant did not have any way to determine that the actual evidence was contrary to the nominal evidence). Although this is consistent with the task instructions, it may lead, in principle, to a performance bias favoring the interrogation session and thus could provide an explanation for the improved metacognitive performance in this session.
One way to partially address this concern would be to use (contrary to task instructions) the same criterion of “correctness” in the two tasks when analyzing metacognitive performance. We reanalyzed the results of Experiment 2 using the “actual” evidence criterion (the accuracy defined by what participants had observed prior to responding) in both sessions. Whereas participants were instructed to decide on the basis of nominal evidence in the free-response session, one may reason that if a participant responded too fast and encountered evidence that was in conflict with the generating distribution, the participant may still have judged confidence on the basis of the actual evidence (this is not strictly correct, and we will address it in Experiment 3 below). When we scored metacognitive performance on the basis of this actual evidence criterion in both the free-response and interrogation sessions, we still found that the metacognitive performance remained significantly higher in the interrogation session (Type 2 AUROC for free response = .68, Type 2 AUROC for interrogation = .72), t(34) = 2.13, p = .04.
A better way to address the accuracy-criterion concern is to score performance on the basis of nominal criteria in both sessions. This is because we aimed for the interrogation session to be a simulation of the performance that would be achieved in a free-response task in which the participants used no integration to determine the length of evidence (e.g., they deployed a random-timer strategy; Glickman & Usher, 2019). Thus, scoring both sessions on the basis of nominal accuracy criteria is more consistent with this rationale. The problem with using nominal criteria in both sessions is that in the interrogation session, there was a higher fraction of conflict trials (short trials in which the actual evidence went against the generating distributions), and participants were told to respond on the basis of the evidence they saw at the end of the sequence. To deal with this, we carried out a third experiment, which presented the instructions based on nominal criteria in both sessions 4 and in which we also aimed to reduce the fraction of conflict trials by design.
Experiment 3
In this experiment, we emphasized nominal choice accuracy (i.e., the requirement to indicate the sequence generated from the higher mean distribution) for both choice and confidence in both sessions, and we attempted to minimize the fraction of conflict trials (where nominal and actual accuracy conflicted) that participants encountered in the interrogation session (~13% in Experiments 1 and 2). To do this, instead of equalizing the number of samples in the two sessions trial by trial, as in Experiments 1 and 2, we equalized the number of samples in Experiment 3 for each participant on average, across trials in a session. For example, in the first free-response session, if a participant made decisions that integrated between three and 12 evidence frames (with an average of seven frames), then the participant received seven evidence frames on all trials in the second interrogation session (with evidence streams being newly sampled from the same generating distributions as in the free-response session). This reduced the fraction of ambiguous conflict trials in the second session (which were typically the very short trials), for which participants had little resources to distinguish between actual and nominal accuracy criteria. Thus, this procedure allowed us to compare the integration-to-boundary strategy, which the participant could deploy in the first session, with the fixed-number-of-samples strategy required in the second session, when task performance was calculated using the same nominal criterion for accuracy in both cases. On the basis of computational considerations, we predicted that even under these carefully matched conditions, choice accuracy and metacognitive performance would continue to show a trade-off—choice accuracy would be higher in the free-response session (as predicted by the theory of the sequential probability-ratio test; Wald, 1947), whereas metacognitive performance would be higher in the interrogation session. To increase the generality of the task, we also modified the stimuli from sequences of numbers to sequences of lines (Vickers et al., 1985).
Method
Participants
Fifty undergraduates from Tel Aviv University (34 female; age: M = 23 years, range = 21–28 years) participated in the experiment. Participants received course credit in exchange for taking part. The experiment was approved by the ethics committee at Tel Aviv University. The sample size was selected on the basis of a power analysis for the confidence-resolution effect in Experiment 2, which showed that 50 participants were required to achieve a power of .90 for an α of .05.
Procedure and design
The task was similar to that in the previous experiments, with a few exceptions. First, we altered how stimulus evidence was generated, as described in detail above. Second, instead of numbers, participants were presented with sequences of vertical lines with different lengths (pairs of vertical lines with lengths sampled from the same overlapping Gaussian distributions). Third, the sequence rate was changed to 0.6 s per item (the 0.6 s consisted of 0.3 s where the stimuli were presented and 0.3 s of a blank screen to separate distinct presentations of the bar stimuli). Fourth, each session consisted of two blocks with 40 trials each. The rest of the procedure was identical to that in the previous experiments.
Results
In Table 3, we report measures of choice accuracy and metacognitive performance, all based on nominal evidence. As predicted, we found that the choice accuracy was significantly higher in the free-response session (as expected from measuring the nominal distributions in both tasks). In contrast, and again in line with our predictions, the confidence resolution in all three measures of metacognition was higher in the interrogation session compared with the free-response session, and there were significant differences in two of the measures and a trend in the third one (Fig. 6). Notably, the bias-free Type 2 AUROC metric of metacognitive sensitivity revealed significantly increased confidence resolution in the interrogation condition despite first-order performance being lower in this condition. Seeing as choice accuracy is itself known to positively affect Type 2 AUROC estimates (Fleming & Lau, 2014), this double dissociation is very strong evidence of a metacognitive advantage in the interrogation condition.
Average Choice Accuracy and Measures of Confidence Resolution in Experiment 3
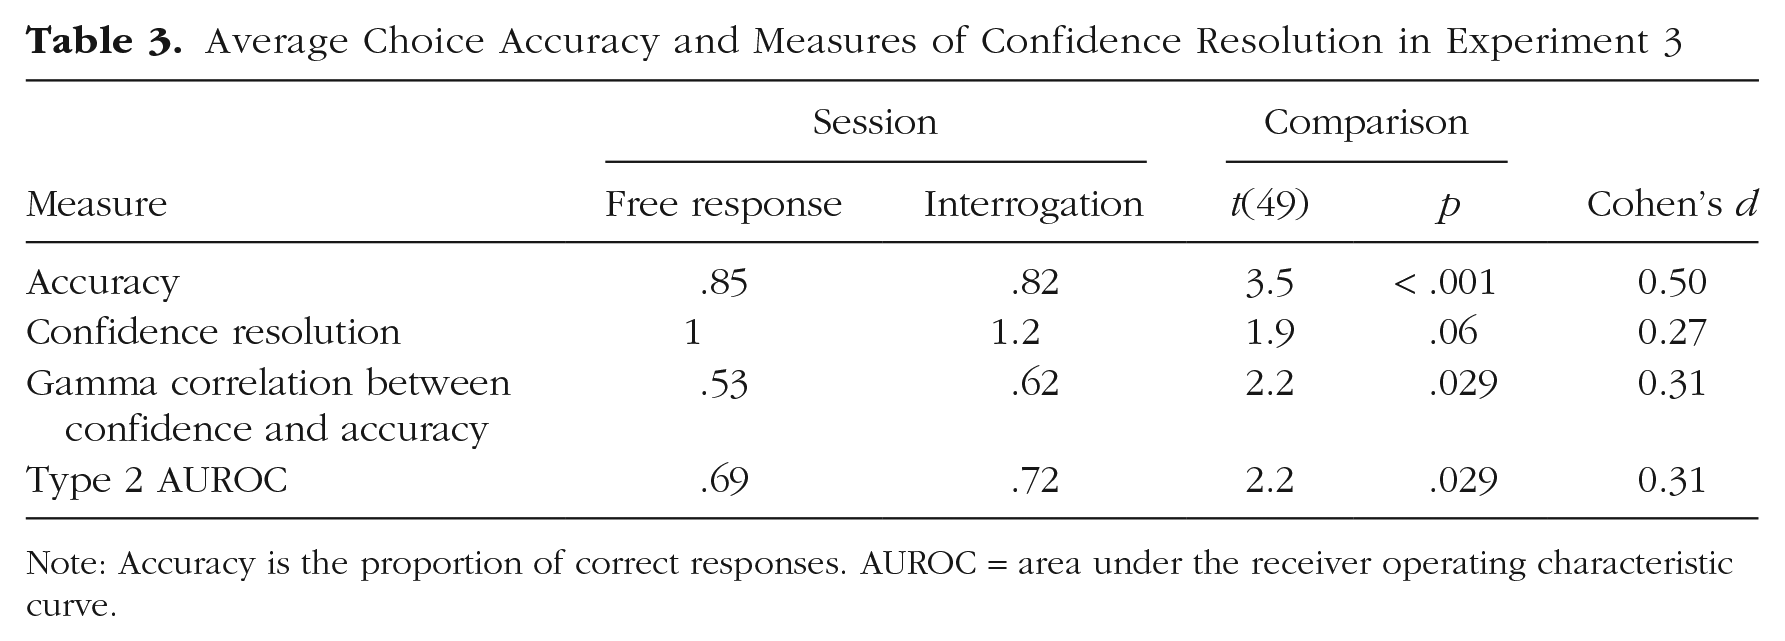
Note: Accuracy is the proportion of correct responses. AUROC = area under the receiver operating characteristic curve.
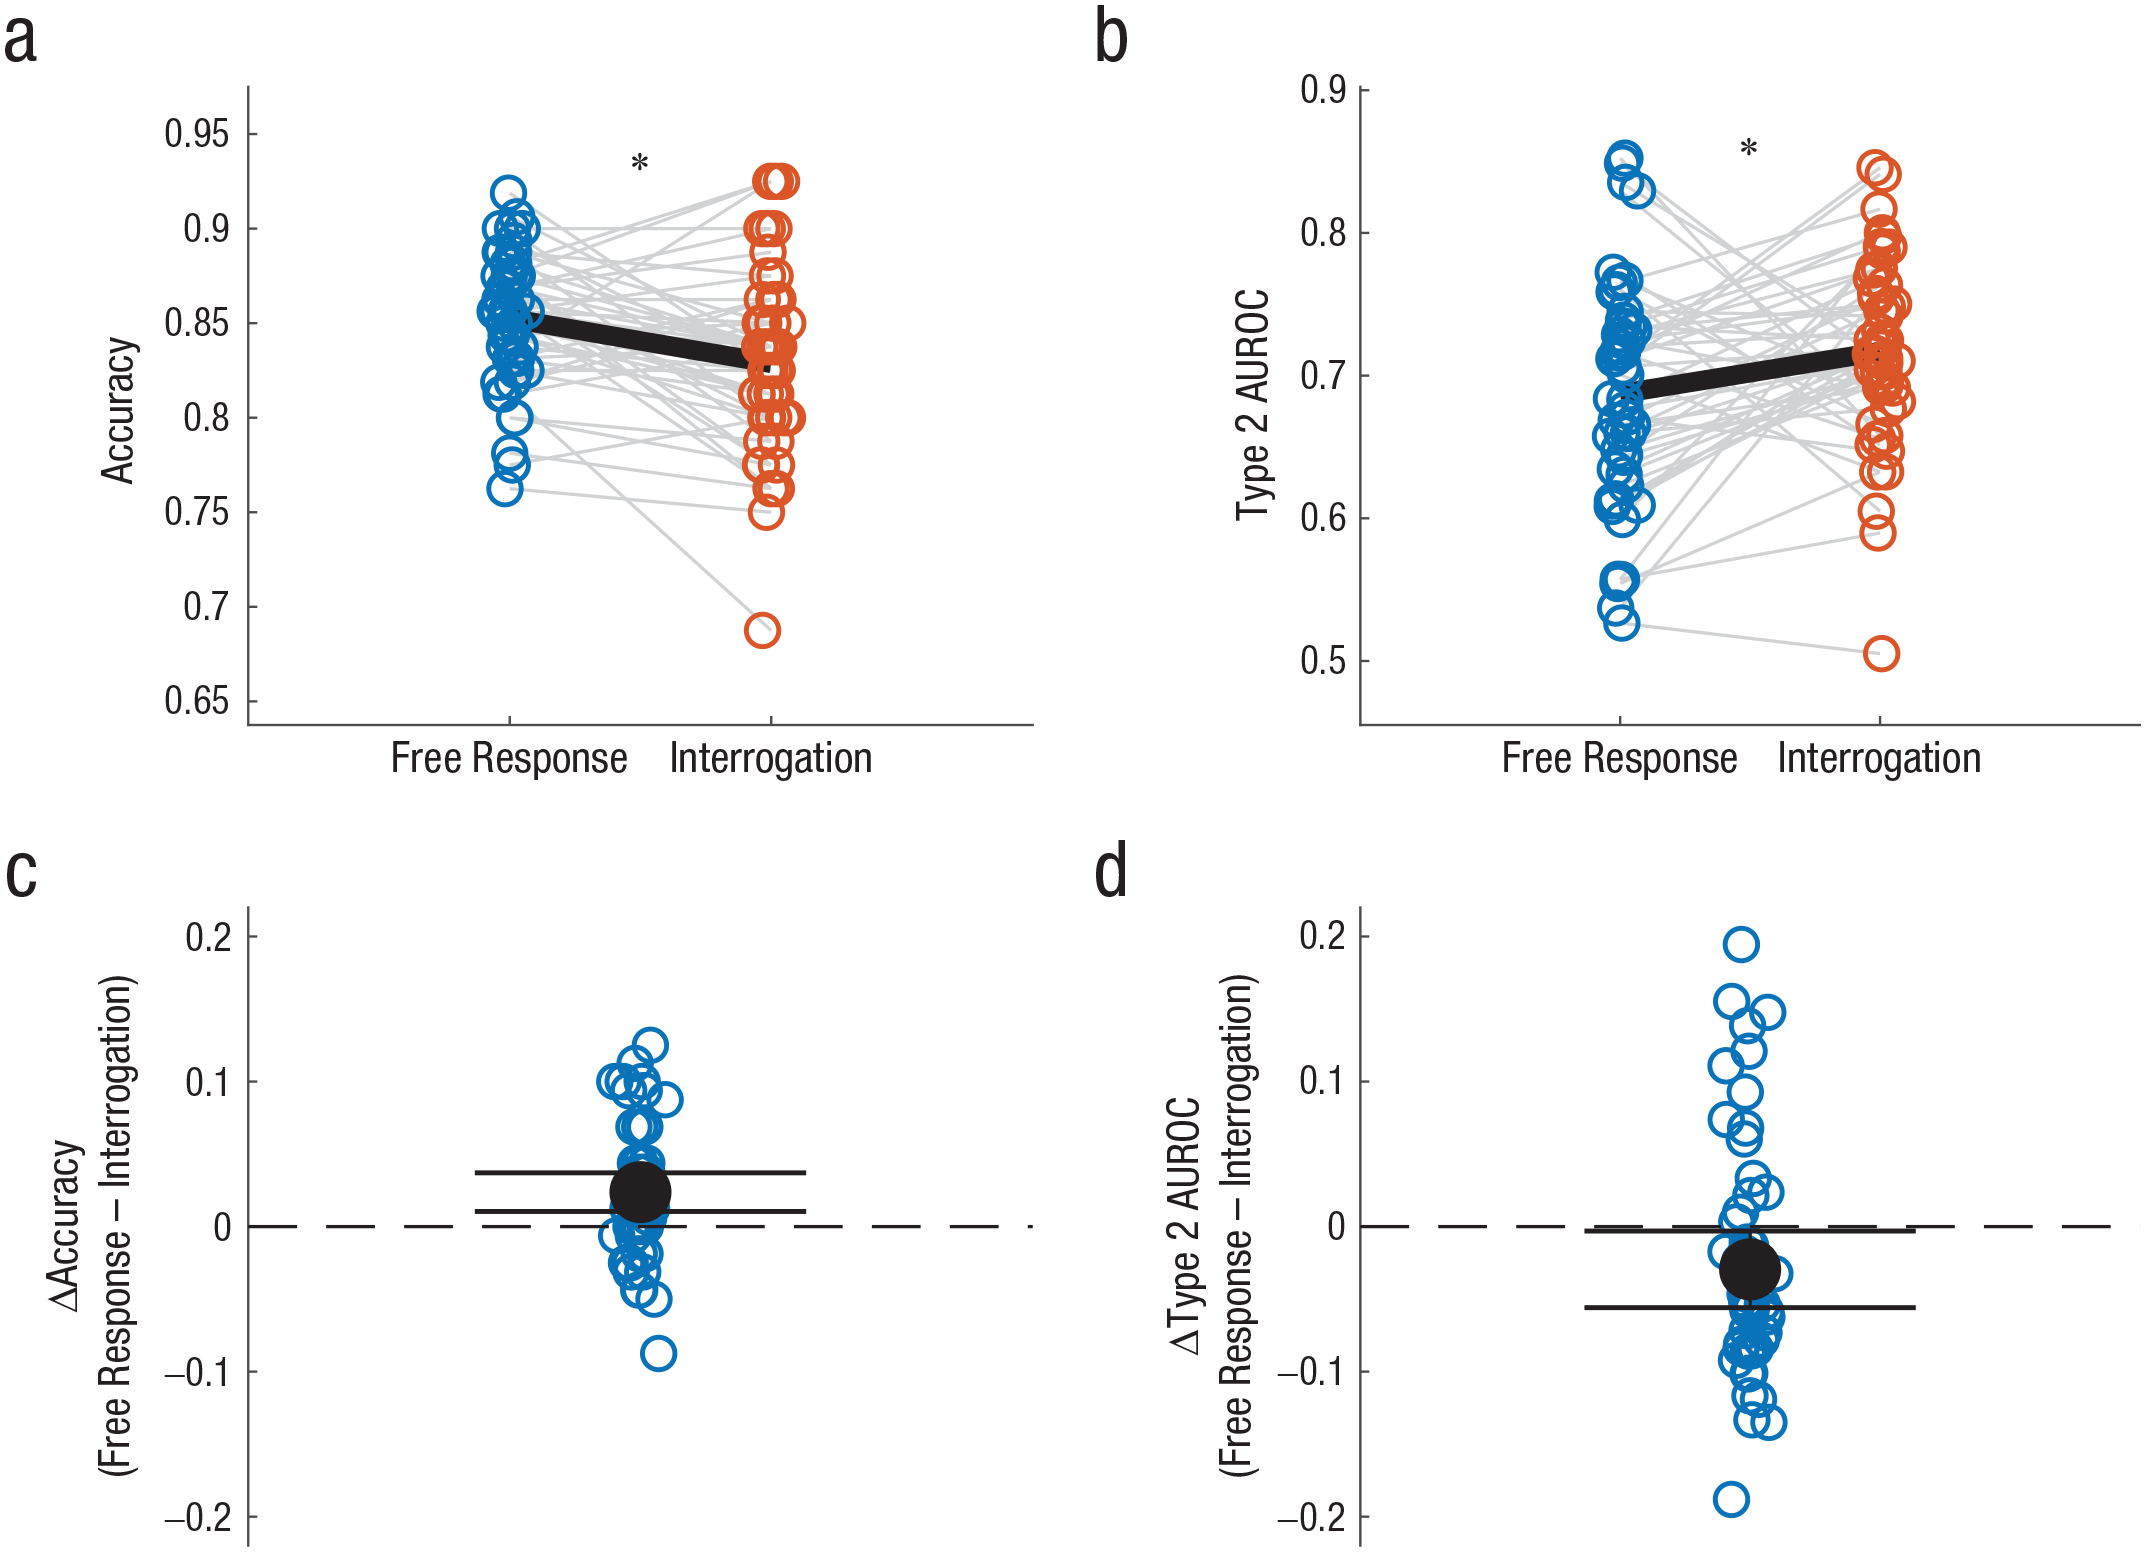
Choice accuracy and metacognitive performance (quantified as Type 2 area under the receiver operating characteristic [AUROC] curve) in Experiment 3. The top row shows (a) first-order choice accuracy and (b) metacognitive performance in the free-response and interrogation sessions. Blue and red circles correspond to the free-response and interrogation sessions, respectively. Gray lines connect performance of individual participants in the two sessions. Black lines indicate the average score in each session. The asterisk indicates a significant difference between the averages for each session (p < .05). The bottom row shows (c) the difference in accuracy between the free-response and interrogation sessions for each participant and (d) the difference in metacognitive performance between the free-response and interrogation sessions for each participant. Black dots indicate the average score. Error bars correspond to 95% confidence intervals.
General Discussion
Across three experiments, we found that the integration-to-boundary strategy, which allows participants to make endogenous decisions on streams of evidence, has a cost in metacognitive performance relative to a fixed-number-of-samples strategy in which the evidence is exogenously presented to the participant. Critically, this was the case even when the amount of evidence presented in the two cases was identical (either matched trial by trial in Experiments 1 and 2 or, on average, across trials in Experiment 3) and when any performance differences between the two task variants were controlled for (no accuracy difference in Experiment 1 and an ANCOVA in Experiment 2). Moreover, in Experiment 3, we obtained a striking double dissociation between cognitive and metacognitive performance (Fig. 6). As predicted by theoretical models of evidence accumulation, the integration-to-boundary strategy resulted in higher choice accuracy but in lower metacognitive performance when the number of samples was the same, on average, as an equivalent evidence stream that cannot be interrupted. This double dissociation rules out accounts of these findings in terms of practice effects (as choice accuracy was lower in Session 2 than Session 1) or in terms of first-order performance itself affecting metrics of metacognition—as the change in metacognition is opposite in sign to the change in first-order performance. This result also supports the idea that although integration to boundary is optimal for maximizing choice accuracy, it is less optimal for metacognition because it leaves less variability in evidence (which was not already used in the decision) to signal confidence.
One limitation of the study is that all participants were young adult students. Future experiments should test different populations for generalizability. A second limitation of the study is that the interrogation session was always presented second. This procedure was devised because we wanted to equalize the amount of evidence that participants sampled to the free-response session, and because the latter was under the participant’s control, this had to be measured first. However, this procedure could, potentially, result in a practice confound—the improved metacognitive performance in the interrogation session could be due to increased familiarity with the task. Although this improvement was consistently observed only in metacognitive, and not in choice, performance, one could reason that the latter was masked by the fact that choice performance was predicted to be lower in the interrogation protocol (Wald, 1947). We believe, however, that such a practice account is unlikely for our results. First, our participants received no (trial by trial) accuracy feedback, so they had little input to guide them in calibrating their confidence responses to objective reality (Carpenter et al., 2019). Second, we carried out two additional analyses to rule out explanations in terms of a practice confound. In a first analysis, we compared metacognitive performance in Experiment 3 in the first half and second half of each session. This analysis did not reveal any significant effect of session half (first half: mean Type 2 AUROC = .66; second half: mean Type 2 AUROC = .67), t(49) = 0.4, p = .68. One may still argue that the practice needed to obtain improvement in our task requires a full session to emerge (80 rather than 40 trials). To rule out this possibility, we ran a control version of our Experiment 3 (N = 35), in which participants completed two consecutive 80-trial blocks of the free-response task (for details, see the Supplemental Material). As expected (on the basis of lack of accuracy feedback), there was no improvement in metacognitive performance between blocks (first block: mean Type 2 AUROC = .66; second block: mean Type 2 AUROC = .67), t(34) = 0.49, p = .62. Together with the double dissociation between choice and metacognitive performance observed in Experiment 3 (Fig. 6), the results of this control experiment make it unlikely that a practice effect could account for our key findings. Rather, we believe that these additional analyses support our conclusion that integration to boundary is beneficial for choice performance but has a cost in metacognitive performance.
Interestingly, previous studies of perceptual metacognition have often relied on tasks in which the number of evidence samples is exogenously determined, allowing for enhanced confidence resolution. In addition, model-based measures of metacognitive efficiency such as meta-d′ implicitly assume an underlying SDT generative model of confidence, which may be suitable only for interrogation-like cases but not for more naturalistic free-response settings in which the decision to terminate information search is under the participant’s control (Yeung & Summerfield, 2012). Future work should contrast these two decision strategies—integration to boundary and deciding from a fixed number of samples—in tasks such as wagering (Persaud et al., 2007), which combine choice and confidence into a unified performance measure, and explore alternative model-based metrics of metacognitive performance that incorporate decision time.
In addition to these differences in metacognitive performance, we also found that the way in which participants generated their choice and confidence estimates differed in the two experimental sessions. In the free-response task, the best-fitting choice model used integration to a collapsing boundary, whereas the confidence was based on both RT (which for this model was associated with the boundary level at response) and the last piece of evidence, which was likely to involve postdecision integration (Moran et al., 2015; Pleskac & Busemeyer, 2010). Both of these factors could contribute to a nonzero level of confidence resolution in the free-response task. Indeed, because RTs tend to be faster for correct (compared with incorrect) responses (see Fig. S3 in the Supplemental Material), RT itself provides distinctive information on choice accuracy. An impact of postdecisional evidence integration on confidence resolution in the free-response task is also supported by a median split of the confidence resolution between trials in which the response was entered before or after the median RT on the last frame before stimulus termination (Fig. 7). We reasoned that for faster RTs (measured from the last presented frame), there is a higher chance that the decision was based on evidence presented before the last frame, and thus this extra frame could serve as postdecision evidence. Consistent with postintegration models (Pleskac & Busemeyer, 2010), results showed that metacognitive performance (Type 2 AUROC) was higher when such postdecision evidence was available, t(34) = 2.12, p < .05.
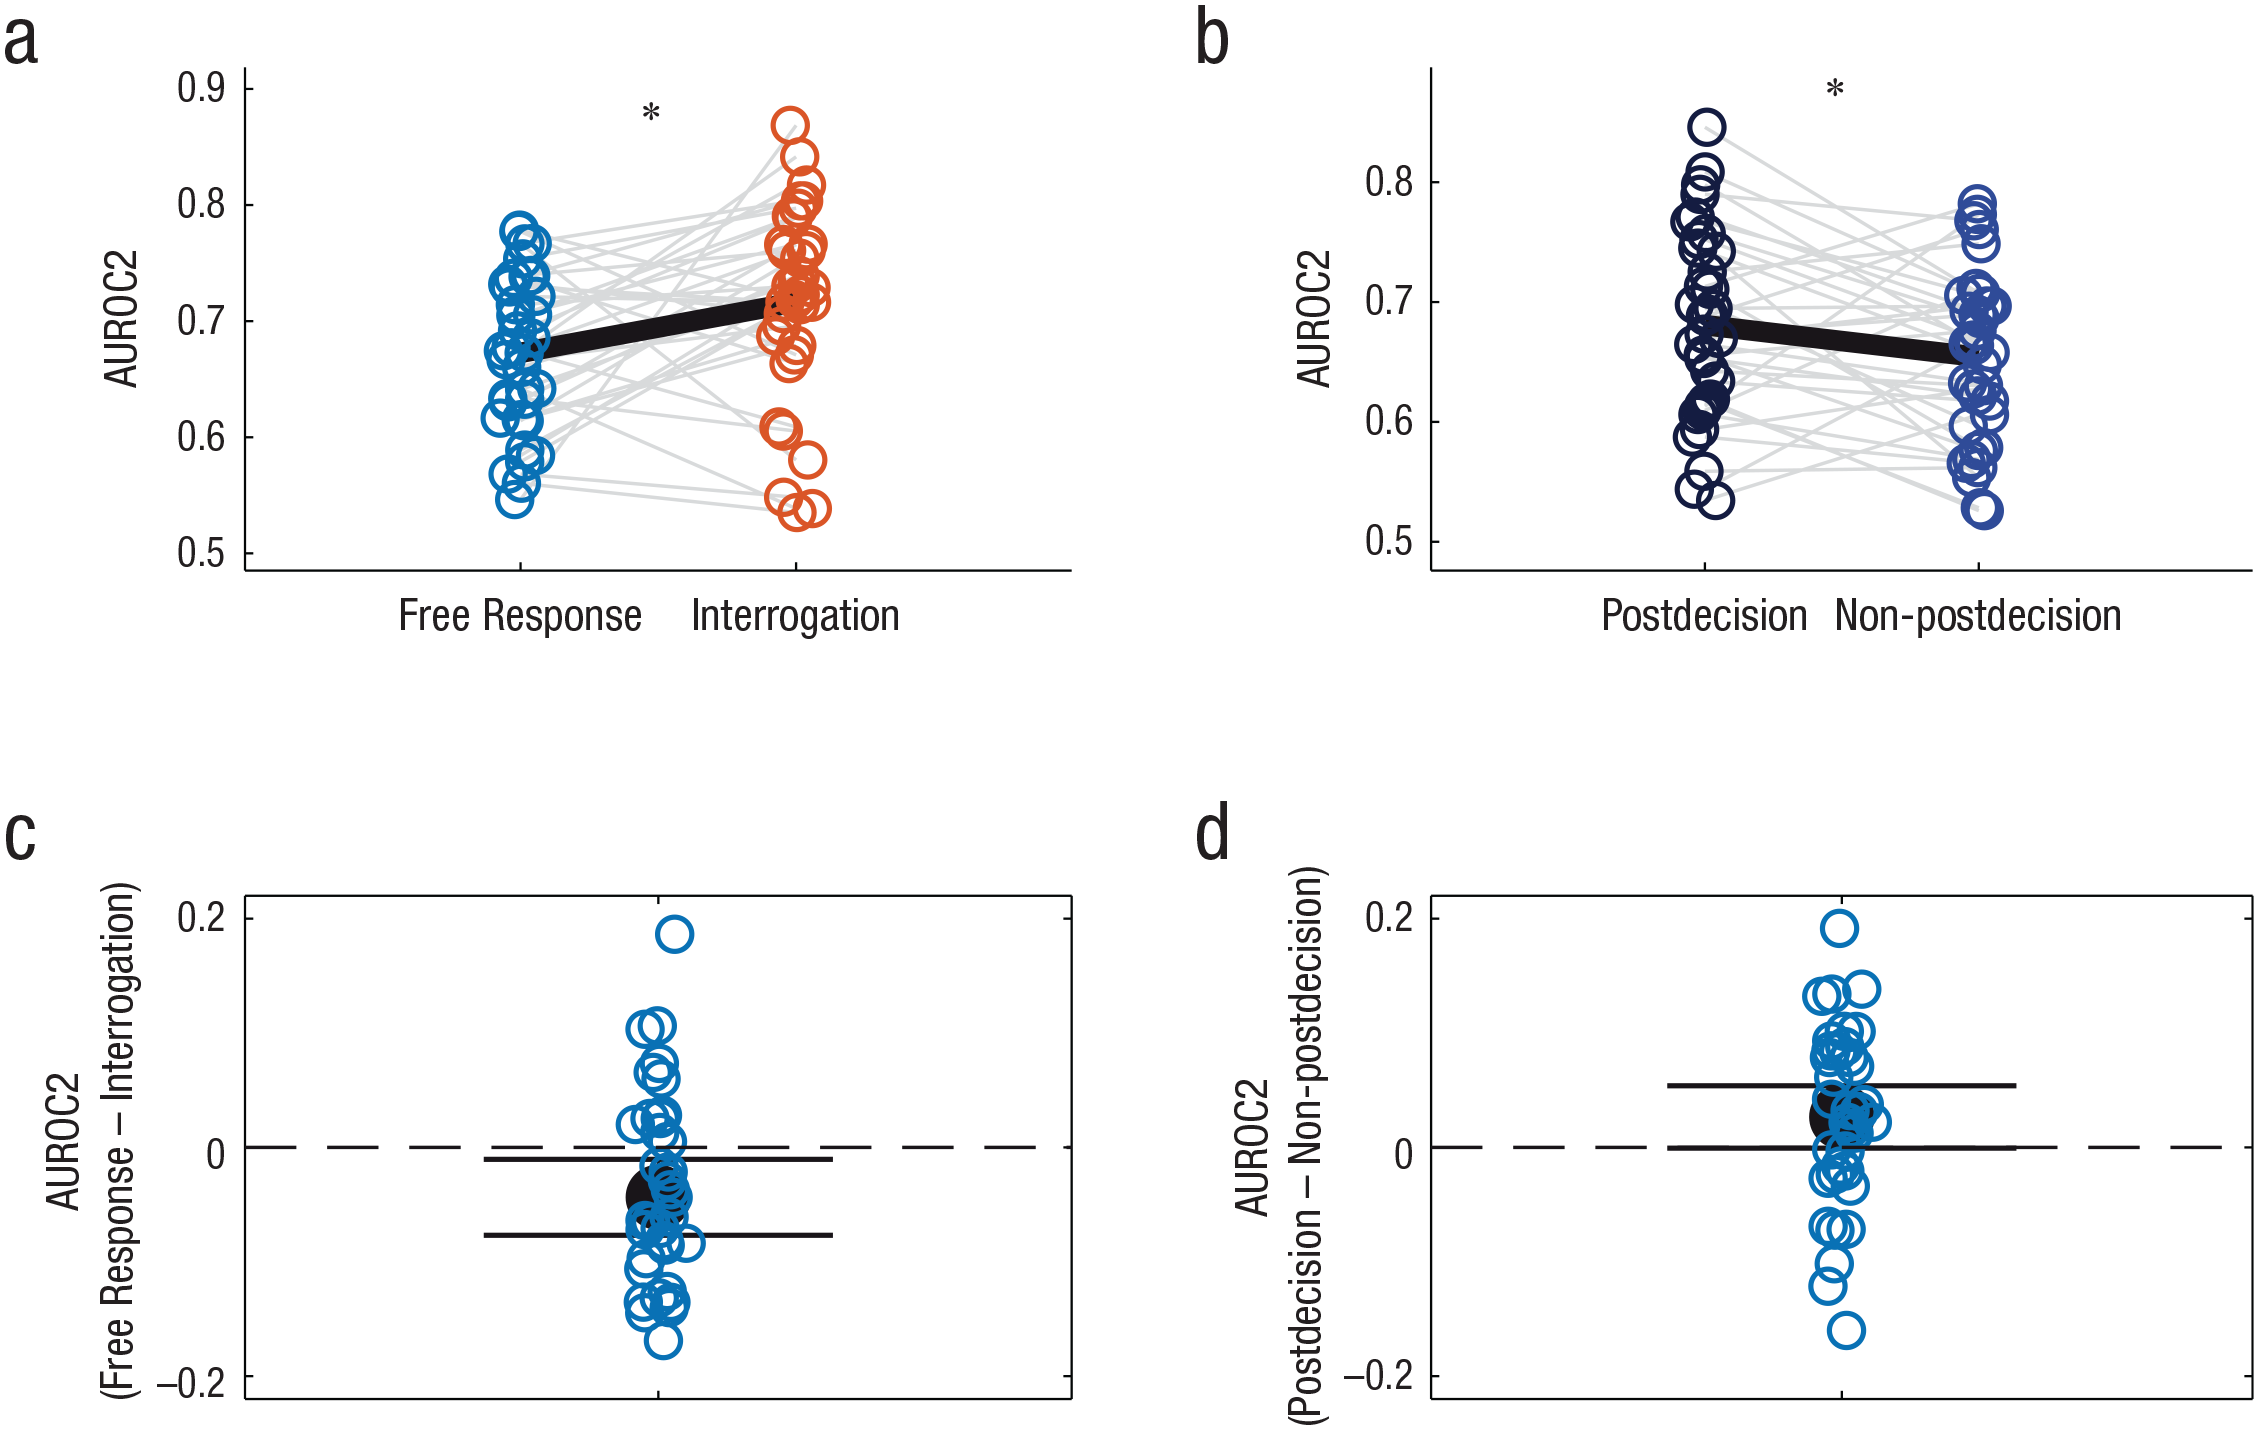
Metacognitive performance (Type 2 area under the receiver operating characteristic [AUROC2] curve) and contribution of postdecision evidence to confidence in Experiment 2. The top row shows metacognitive performance (a) separately for each participant in the free-response and interrogation sessions and (b) for each participant in the free-response session, separated into trials with fast responses (dark blue) and slow responses (light blue) on the basis of a median split of reaction time to the final sample (as a proxy for a contribution of postdecision evidence to confidence). Gray lines connect performance of individual participants in the two sessions. Black lines indicate the average score in each session. The asterisk indicates a significant difference between the averages for each session (p < .05). The bottom row shows the difference in metacognitive performance (c) separately for each participant between the free-response and interrogation sessions and (d) for each participant between the fast (postdecision) and slow (non-postdecision) trials in the free-response session. Black dots indicate the average score. Error bars correspond to 95% confidence intervals.
In the interrogation session, on the other hand, we found that choices were well accounted for by a signal detection model applied to the whole evidence stream. For confidence, we found that the best predictors were simply the total accumulated evidence or a leaky integration of the evidence. This supports the signal detection model of confidence (Figs. 1 and 3b), according to which, when evidence is exogenously presented (as in interrogation), the same information—the integrated evidence—is used to guide both choices and confidence. This is also consistent with the fact that in the interrogation condition, the trial length (number of frames) was positively correlated with confidence. Further analysis indicates that this was because of the association between time and the amount of evidence in this task: The correlation between confidence and time became null after the total evidence was partialed out (see Fig. S4).
To conclude, although a reliance on RT and postdecision integration allowed participants to obtain positive confidence resolution in the free-response task (following integration to a collapsing boundary), this did not facilitate the same level of metacognitive performance as that obtained when confidence was based on the total evidence encountered, as was possible in the interrogation task (see also Fig. S2 in the Supplemental Material). Instead, our results indicate that participants adapted the confidence mechanism they deployed depending on the task contingencies and adopted different strategies to extract some form of metacognitive performance even in an integration-to-boundary setting in which confidence resolution was likely to be compromised. In particular, they relied on total evidence when the termination of the evidence stream was independent of their choice, as is normatively supported by signal detection models. However, when faced with a self-terminated task, participants used integration to a collapsing boundary to provide an efficient compromise between optimizing choice accuracy (Malhotra et al., 2017; Tajima et al., 2016) and confidence resolution (see Fig. S3). In this setting, they could also rely on cues from both RT and postdecision evidence to further boost their metacognitive performance (see Fig. S6 in the Supplemental Material; see Persaud et al., 2007, for a simulation showing that the collapsing boundary model provides the most efficient balance of choice accuracy and metacognition in the context of a wagering task, in which confidence resolution also contributes to the magnitude of reward received). How such additional cues to performance are integrated with the available stimulus evidence remains a topic for future work. One possibility is that higher order mechanisms supporting metacognition have access to parallel streams of information, including one’s own actions and RT, allowing more efficient inference on self-performance (Fleming & Daw, 2017).
Conclusions
The fidelity of metacognition is instrumental to enhancing performance in a variety of contexts, such as when confidence is being used to guide subsequent decisions (Persaud et al., 2007; van den Berg et al., 2016) or when one is deciding whether or not to seek new information (Schulz et al., 2021). For example, in an exam context, participants can use feelings of confidence to decide whether their work is ready to be submitted for grading or whether to continue working on it. Crucially, such decisions require a high degree of metacognitive competence (confidence resolution)—we would not want to have high feelings of confidence in the context of low accuracy. Previous studies have focused on how metacognitive competence is affected by various factors, such as task domain and mental health, and were intended to unveil the neural correlates of confidence formation (Hoven et al., 2019). However, the impact of different strategies for decision-making—which might vary within the same individual from context to context—on metacognition has remained unexplored. Here, by using carefully controlled evidence-accumulation paradigms informed by computational modeling, we found that (a) a strategy of integrating to a fixed boundary, although theoretically optimal for choice accuracy, has a cost in confidence resolution and that (b) participants sought to adapt the way that they formed their confidence in such settings in order to retain some degree of metacognitive competence (Figs. 4 and 5; see the “Model-Selection” section in the Supplemental Material). Interestingly, a strategy of integrating to a collapsing boundary appears to be a good compromise for optimizing both choice accuracy and metacognition. These results further imply that human observers meta-optimize metacognition itself—altering how confidence is formed depending on the task context at hand. The mechanisms of such metacognitive optimization remain a rich topic for future investigation.
Supplemental Material
sj-pdf-1-pss-10.1177_09567976211043428 – Supplemental material for The Cognition/Metacognition Trade-Off
Supplemental material, sj-pdf-1-pss-10.1177_09567976211043428 for The Cognition/Metacognition Trade-Off by David Rosenbaum, Moshe Glickman, Stephen M. Fleming and Marius Usher in Psychological Science
Footnotes
Acknowledgements
We wish to thank Rani Moran, Romi Shimoni Finkel, and Neomi Rosenbaum for critical reading of the manuscript and helpful comments.
Transparency
Action Editor: Sachiko Kinoshita
Editor: Patricia J. Bauer
Author Contributions
D. Rosenbaum and M. Usher developed the study concept. All the authors contributed to the study design. D. Rosenbaum conducted testing and data collection. D. Rosenbaum and M. Glickman analyzed and interpreted the data under the supervision of M. Usher and S. M. Fleming. D. Rosenbaum and M. Usher drafted the manuscript, and M. Glickman and S. M. Fleming provided critical revisions. All the authors approved the final manuscript for submission.
Open Practices
The design and analysis plan for Experiment 2 were preregistered on OSF and can be accessed at https://osf.io/gt2qz/. Experiments 1 and 3 were not preregistered. Data and materials for this study have not been made publicly available. This article has received the badge for Preregistration. More information about the Open Practices badges can be found at ![]() .
.
Notes
References
Supplementary Material
Please find the following supplemental material available below.
For Open Access articles published under a Creative Commons License, all supplemental material carries the same license as the article it is associated with.
For non-Open Access articles published, all supplemental material carries a non-exclusive license, and permission requests for re-use of supplemental material or any part of supplemental material shall be sent directly to the copyright owner as specified in the copyright notice associated with the article.