
Abstract
Efforts to infer personality from digital footprints have focused on behavioral stability at the trait level without considering situational dependency. We repeated a classic study of intraindividual consistency with secondary data (five data sets) containing 28,692 days of smartphone usage from 780 people. Using per-app measures of pickup frequency and usage duration, we found that profiles of daily smartphone usage were significantly more consistent when taken from the same user than from different users (d > 1.46). Random-forest models trained on 6 days of behavior identified each of the 780 users in test data with 35.8% accuracy for pickup frequency and 38.5% accuracy for duration frequency. This increased to 73.5% and 75.3%, respectively, when success was taken as the user appearing in the top 10 predictions (i.e., top 1%). Thus, situation-dependent stability in behavior is present in our digital lives, and its uniqueness provides both opportunities and risks to privacy.
In searching for the locus of personality, psychologists theorize that people behave consistently in situations perceived as psychologically equivalent (Mischel, 2004). This “interactionist” account may be expressed using if-then statements. If a person is in situation X, then they perform behavior A, but if a person is in situation Y, then they perform behavior B (Shoda et al., 1994). Behavioral consistency was originally studied in face-to-face interactions through field observations (Shoda et al., 1993) and experimental tests (Furr & Funder, 2004), but more recent evidence of behavioral consistency has come from studies of our digital lives. Harari et al. (2020) found high consistency in individuals’ use of calls, text messages, and social media across days, and the use of social applications (apps) was the most consistent. Aledavood et al. (2015) analyzed the call patterns of 24 individuals over an 18-month period and found that the frequency of calls at each hour of the day was distinct and persistent within an individual.
To date, studies of the consistency of digital behavior have focused on stability in general usage (e.g., calls vs. text messages) or stability within a specific app (e.g., phone calls). There has been no consideration of patterns of behavior across apps. Yet apps extend our social environment in different ways depending on their features and extrinsic factors (Shaw et al., 2018). Users’ self-identities have amalgamated with the technology they use because self-expression can be enacted digitally from avatars to social media (Belk, 2013). Therefore, each app represents a nominal situation to its user because it comprises a unique interface (i.e., setting) and distinguishing features (i.e., activities; Davidson & Joinson, 2021; Mischel & Shoda, 2010). It can also elicit mood states (Alvarez-Lozano et al., 2014) and often presents psychological features that are characteristic of “active ingredients” (e.g., peer adoration on Twitter, paper rejection on email). Qualitative analysis shows that these active ingredients differ not only when apps serve distinct functions (e.g., productivity vs. social) but also when they offer similar functionality such as communication (Nouwens et al., 2017). Quantitative analysis confirms that daily interactions with apps are unique, even for apps that share identical, high-level categorizations including “social media” (see the supplemental material available at https://osf.io/6x3fs/). Collectively, this suggests that smartphone apps are psychologically distinct situations.
Thus, if intraindividual stability exists within digital behavior, we should find that users show different levels of engagement (a behavior) with each situation (the apps) but that this pattern of situation-level engagement will remain stable across time (i.e., their personality signature). We tested this notion with a preregistered hypothesis that daily profiles of usage behavior across smartphone apps will show higher intraindividual consistency than interindividual consistency. We used naturally occurring large-sample data as a complement to prior observational and experimental studies.
Method
User data
We combined five preexisting data sets that recorded foreground app use for 1,119 smartphone users. These usage data comprised time-stamped actions that showed what app was on a user’s screen, on what day, and for how long (for details on data collection, see the supplemental material at https://osf.io/6x3fs/). Age self-reports were available for 913 users and revealed a wide range of ages (in years): 18 to 24 (n = 131), 25 to 34 (n = 214), 35 to 44 (n = 245), 45 to 54 (n = 190), and 55 and older (n = 133). Of the 909 users who reported their gender, 426 were women and 483 were men.
We standardized, cleaned, and combined the data sets (for all procedures, see the supplemental material at https://osf.io/6x3fs/). To ensure that we could examine behavior across multiple days, we excluded users whose record contained fewer than 9 days of data. We then removed the first day and last day of data for each user because data from these days reflected only a partial day of use depending on when the logging app was installed and uninstalled. This left 824 users in the sample, each of whom had 7 or more days of usage data.
Some apps were used by very few users. Including these apps in our analyses could artificially increase our consistency measure because “no use” would appear across many days and many users. Accordingly, we included only apps used by more than 25% of the sample (> 206 people) that were not system apps (e.g., Android system). This left 21 apps in our analysis: Calculator, Calendar, Camera, Clock, Contacts, Facebook, Gallery, Gmail, Google Play Store, Google Search, Instagram, Internet, Maps, Messaging, Messenger, Phone (native phone-call app), Photos, Settings, Twitter, WhatsApp, and YouTube.
Statement of Relevance
Whenever people use technology, they leave behind a digital trace that documents their behavior. We used these data to study—at scale—the question of whether people behave consistently in their digital lives but in a way that is context dependent. By analyzing 28,692 days of smartphone app usage across 780 individuals, we found that it is possible to profile a person’s day-to-day use of different apps and showed that this profile remains consistent over time. We found that a single day of data from an anonymous user can be matched to the correct originating user’s profile with greater than 70% accuracy when success is taken as the user appearing in the first 10 (top 1%) of all candidates. Thus, people show distinctive patterns of digital behavior even when compared with hundreds of other individuals. This has implications for security and privacy in the digital age.
Assessing consistency
As outlined by Ellis et al. (2019), smartphone behaviors may be examined at different levels of specificity. One fundamental behavior is positive engagement, the extent that a person acts rather than avoids the situation presented by the app. Although such a measure ignores more qualitative aspects in how a person engages (e.g., liking or commenting), the variation in engagement behaviors is itself a consequence of cognitions and affects about the stimuli presented by the app (Shaw et al., 2018). For example, one person may read and respond enthusiastically every time they receive a message in a messenger app, whereas another may ignore the message and glance only briefly at the end of the day. One metric of engagement is the number of daily app pickups (henceforth, pickups), which measures the number of times a participant engages. A second useful metric is the daily time spent on the app (henceforth, duration), which is the equivalent of measuring the magnitude of the engagement. By assessing these variables, we can examine if-then patterns of behavior of the form, given situation X (app), this person will show Y amount of engagement. Although some research suggests that daily pickups will be more consistent than daily duration behavior (Wilcockson et al., 2018), we tested both frequency and magnitude to reflect different aspects of our behavioral tendency.
We calculated pickups and duration for each app across all of the days of data available for each user. We removed days of data where none of the 21 apps were used, which may reflect a technical issue with the logging. This process left 44 users without 7 full days of smartphone data, so we removed them, leaving 780 users with full pickup and duration data. On average, users had 36.80 days of data (total = 28,692 days), with a minimum of 7 and a maximum of 377 (skewness = 4.61). Pickups were the number of times a user accessed each of the 21 apps per day; durations were how long in seconds each user spent on each of the 21 apps per day.
Our assessment of consistency followed Shoda et al.’s (1994) approach of comparing profiles of behavior across the 21 apps. We first calculated, for each app, the daily mean and standard deviation of pickups and duration (separately); this represented a normative profile of the sample’s behavior. We then calculated how each of the 28,692 daily cases deviated from this norm by computing standardized scores (specifically, z scores). For each day’s data, for each app’s score, we subtracted the sample mean and divided it by the sample standard deviation. The resulting 21 standardized values made up a user’s behavioral profile of app use for that day. If a particular app had a score above zero in the behavioral profile, this meant that app was used for longer or more times than the sample norm on that day. Because every user had at least 7 days of usage data, we created multiple profiles for each user, allowing us to examine the consistency of profiles over time.
Finally, to ascertain whether apps should be analyzed individually or grouped together into types of apps with similar purposes (e.g., social media apps), we analyzed the structure of the daily behavior profiles using exploratory factor analysis (see the supplemental material at https://osf.io/6x3fs/). When we used an eight-factor solution, findings showed that the variance explained by the factors was low (pickups = .32, durations = .19) and indicated no clear way to group the apps together. We thus treated the apps as psychologically distinct situations, with unique daily engagement levels, and analyzed them separately (for the full procedures, see the supplemental material at https://osf.io/6x3fs/).
This research received ethical approval from the Faculty of Science and Technology Research Ethics Committee (FST19002) and the Security Research Ethics Committee. Our analysis plan was preregistered at https://osf.io/u6hsc/, and the methods and processed data (distributions of coefficients) are available at https://osf.io/xvd6s/.
Results
Assessing similarities in daily profiles
Following the approach of Shoda et al. (1994), we assessed the similarity of users’ daily profiles using ipsative correlations (i.e., we calculated Pearson correlations on rank-ordered profile scores). We did this for two daily profiles randomly selected from the same user (within-user pairs) and two daily profiles randomly selected from different users (between-user pairs). There were 411,601,086 unique comparisons in the data, that is, n(n – 1)/2. We calculated ipsative correlations for 10 million randomly selected within-user pairs and 10 million randomly selected between-user pairs (10 million was our computational limit). We repeated these calculations a further 44 times to obtain bootstrapped confidence intervals (CIs) and effect sizes. See our data visualization website (https://behaviouralanalytics.shinyapps.io/AppUseProfiles/) for examples of daily profiles alongside a demonstration of how between-subject and within-subject profiles were compared to create distributions.
Figure 1 presents the distribution of observed correlations for within- and between-user groups for pickups (right panel) and duration (left panel). Confirmatory t tests supported our prediction that pickups would be higher in within-user pairs (M = .73, 95% CI = [.73, .73], SD = .19) compared with between-user pairs (M = .30, 95% CI = [.30, .30], SD = .30), Welsh’s t(17004202) = 3,797.93, p < .001, d = 1.70, 95% CI = [1.70, 1.70], and that duration would be higher in within-user pairs (M = .81, 95% CI = [.81, .81], SD = .16) compared with between-user pairs (M = .49, 95% CI = [.49, .49], SD = .27), Welsh’s t(16010722) = 3,274.61, p < .001, d = 1.46, 95% CI = [1.46, 1.47].
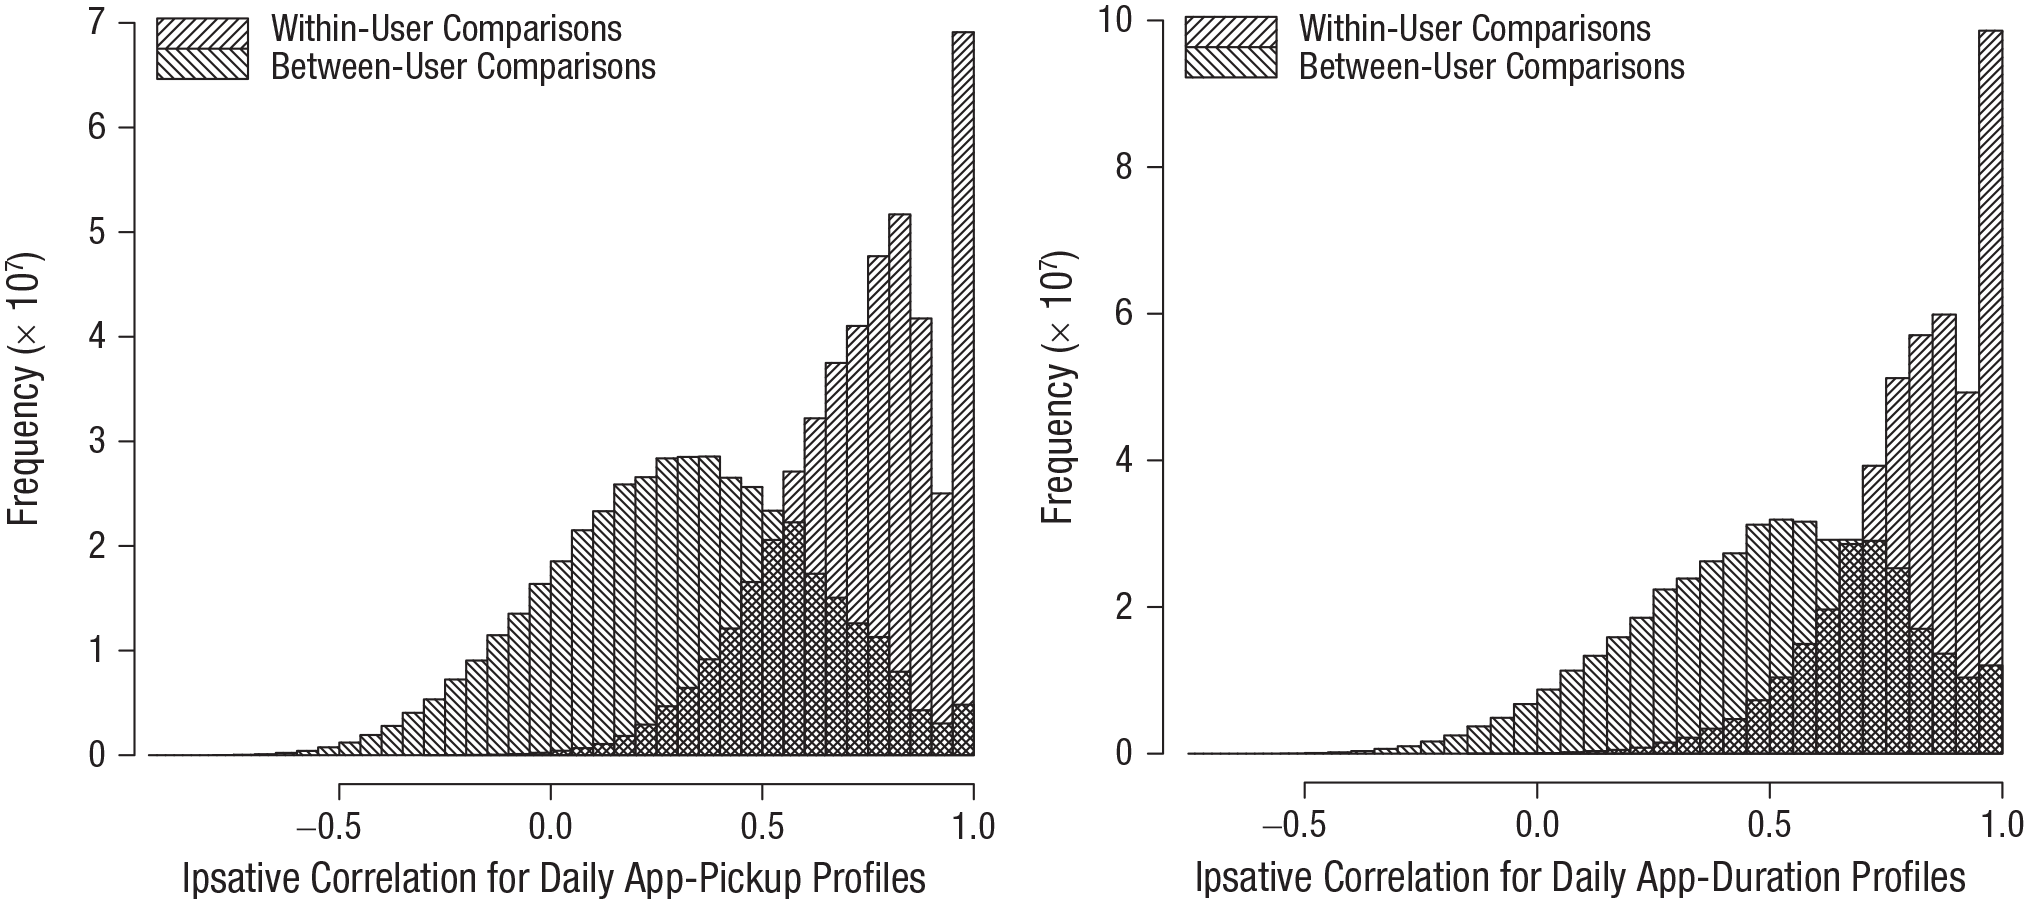
Distribution of ipsative correlation coefficients as a function of within-user comparisons and between-user comparisons for daily app pickups (left panel) and daily app durations of use (right panel). A higher coefficient represents greater similarity in the profile of behavior across the comparison pair. The graph style is a tribute to the work of Shoda et al. (1993).
To assess the robustness of our analysis, we ran two complementary tests. First, because both within-user and between-user distributions deviated from normality, we ran a nonparametric comparison using Wilcoxon rank-sum test (W) and Vargha and Delaney’s A effect size (VD.A). 1 These analyses replicated our finding that within-user comparisons were significantly more consistent than between-user comparisons for pickups (W = 88,324,600,000,000, p < .001, VD.A = 0.12) and for duration (W = 85,210,000,000,000, p < .001, VD.A = 0.15). Second, we reanalyzed the data using a split-half comparison, creating an average behavioral profile for the first half and second half of a user’s data and then comparing them (for a within-user comparison) or comparing one half with another user’s half (for a between-user comparison). This split-half approach removed the unbalanced influence that users with more behavioral profiles had in the day pair comparisons because all users had only two data points. As before, pickups were significantly higher in within-user comparisons (M = .89, 95% CI = [.88, .90], SD = .10) than between-user comparisons (M = .23, 95% CI = [.21, .26], SD = .30), t(942.70) = 57.13, p < .001, d = 2.89, 95% CI = [2.75, 3.03], and durations were significantly higher in within-user comparisons (M = .91, 95% CI = [.91, .92], SD = .09) than between-user comparisons (M = .39, 95% CI = [.37, .41], SD = .32), t(905.43) = 43.46, p < .001, d = 2.20, 95% CI = [2.07, 2.33].
Identifying individuals from app use
Given the intraindividual stability in daily app use, one practical question is to what extent a user can be identified within a crowd of data on the basis of historic information. This has important security and privacy applications, such as identifying people across multiple devices (e.g., burner phones). Classification algorithms were used to explore this question of profile uniqueness. To do this, we made each user a class in a categorical variable, which had 780 classes (users). Therefore, the aim of this analysis was to build models that could predict which user was associated with each daily profile.
Random-forest models were our classification algorithm of choice. This was because building models with a high number of classes is computationally intensive, and algorithms such as neural networks could not be trained on our high-end cluster. However, random-forest models are alternatively very efficient, and previous literature has shown that they have competitive accuracy in comparison with many other classification models (Fernándes-Delgado et al., 2014). Consequently, we trained a random-forest model for pickups and duration (separately) using the rpart package (Version 4.1.15; Therneau et al., 2019) in R (Version 4.0.1; R Core Team, 2020). The data entered into the models were the behavioral profiles, which contained the 21 normalized app-usage scores per day, per user. Because each behavior profile in the data was paired with a user and a day (e.g., Person 10, Day 2), we used this information to both train and test the models. Specifically, because all 780 users had at least 7 days of data, we used the first 6 days of users’ profiles to train the models and their 7th-day profile as test data. Therefore, training data consisted of 126 data points per person (21 apps and 6 days), and test data consisted of 21 data points per person (21 apps and 1 day).
Both random forests contained 3,120 trees (4 × n), each taking a bootstrapped sample of the data and selecting only four variables to be assessed per split (mtry = √ 21) 2 when building individual trees. No pruning took place, and trees were grown to full size. When we assessed confusion matrices, the pickup random-forest model classified users from their seventh behavioral profile with 35.76% accuracy (95% CI = [32.4%, 29.25%], no-information rate [NIR] = .0013, p < .001); the duration random-forest model classified users with 38.46% accuracy (95% CI = [35.03%, 41.98%], NIR = .0013, p < .001). See the supplemental material for performance measures for each class (user) including sensitivity (M = .36), specificity (M = 1), and recall (M = .36). 3
Probabilities that a behavior profile belongs to each user could be exported from the random-forest models. Each user could then be ranked for each behavior profile, from the least to the most probable user. As a result, it was possible to assess the classification accuracy of both random-forest models when investigating whether the correct user appeared in the top 10 most probable users. This assessment showed that the accuracy rates of our random-forest models on test data increased to 73.46% for pickups and 75.25% for duration when success was counted as the user appearing in the highest 10 (approximately the top 1%) of probabilities. Therefore, our models show the potential to narrow down a subject pool of 10 individuals from their daily app-use data with a three in four success rate.
Discussion
It has been almost five decades since Mischel (1973) outlined an interactionist conception of behavioral dispositions, yet most evidence for the theory comes from observations of off-line interactions. Here, we considered consistency in digital behaviors, through studying the variation of engagement (a behavior) across several nominal situations (apps), collected unobtrusively every second across several days. We found that smartphone users have unique patterns of behaviors for 21 different apps and the cues they present to the user. These usage profiles showed a degree of intraindividual consistency over repeated daily observations that was far greater than equivalent interindividual comparisons (e.g., a person consistently uses Facebook the most and Calculator the least every day). This was true for the daily duration of app use but also the simpler measure of daily app pickups—how many times you open each app per day. It was also true for profiles derived from individual days and profiles aggregated across multiple days. Therefore, by adopting an interactionist approach in personality research, we can predict a person’s future behavior from digital traces while mapping the unique characteristics of a particular individual. Research indicates that people spend on average 4 hr per day on their smartphone and pick up their smartphone on average 85 times per day (Ellis et al., 2019). It is important that theories can adapt to the way people behave presently in digital environments.
It may be considered a limitation that when examining if-then statements, we did not examine within-app behaviors (e.g., posts and comments) that result from experiencing the active ingredients of a particular digital situation. In future studies, researchers may wish to explore data that can be retrieved from different apps that share similar behaviors (e.g., posts across different social media sites). Instead, we examined the cross-situational engagement (a behavior) with each app (situation), which is a comparatively simple digital trace that can be collected easily and unobtrusively, to demonstrate that this alone has within-user consistency.
Consequently, the extent to which our daily smartphone use could act as a digital fingerprint, sufficient to betray our privacy in anonymized data or across devices (e.g., personal phone vs. work phone), is an increasing ethical concern. Our study adds value to the existing literature by illustrating how engagement with apps alone shows within-user consistency that can identify an individual. We modeled users’ unique behaviors by training random forests and then used their exported predictions to assign them to a top-10 candidate pool in separate data with 75.25% accuracy. Thus, an app that is granted access to a smartphone’s standard activity logging could render a reasonable prediction about a user’s identity even when they are logged out of their account. Similarly, if an app receives usage data from several third-party apps, our findings show that this can be used to profile a user and provide a signature that is separate from the device ID or username. So, for example, a law enforcement investigation to identify a criminal’s new phone from knowledge of their historic phone use could reduce a candidate pool of approximately 1,000 phones to 10 phones, with a 25% risk of missing them.
Pertinently, this identification is possible with no monitoring of the conversations or behaviors within the apps themselves and without triangulation of other data, such as geo-location. Perhaps this should come as no surprise. It is consistent with other research that shows how simple metadata can be used to make inferences about a particular user, such as assessing their personality from the smartphone operating system used (Shaw et al., 2016) and determining their home location from sparse call logs (Mayer et al., 2016), as well as identifying a particular user from installed apps (Tu et al., 2018). Given that many websites and apps collect these metadata from their users, it is important to acknowledge that usage alone can be sufficient to identify a user. It underscores the need for researchers collecting digital-trace data to ensure that usage profiles cannot be reverse engineered to determine participants’ identities, particularly if data are to be shared widely. Thus, context-dependent intraindividual stability in behavior extends into our digital lives, and its uniqueness affords both opportunities and risks.
Supplemental Material
sj-docx-1-pss-10.1177_09567976211040491 – Supplemental material for Behavioral Consistency in the Digital Age
Supplemental material, sj-docx-1-pss-10.1177_09567976211040491 for Behavioral Consistency in the Digital Age by Heather Shaw, Paul J. Taylor, David A. Ellis and Stacey M. Conchie in Psychological Science
Footnotes
Acknowledgements
We thank the many authors who provided access to their data and our colleagues in the Social Processes Research Group for feedback.
Transparency
Action Editor: Kate Ratliff
Editor: Patricia J. Bauer
Author Contributions
All the authors developed the study concept. H. Shaw obtained the data from external sources. P. J. Taylor and H. Shaw preregistered the study. H. Shaw analyzed and interpreted the data under the supervision of P. J. Taylor. The first draft of the manuscript was written by H. Shaw, and P. J. Taylor, D. A. Ellis, and S. M. Conchie provided critical revisions. All the authors approved the final manuscript for submission.
Notes
References
Supplementary Material
Please find the following supplemental material available below.
For Open Access articles published under a Creative Commons License, all supplemental material carries the same license as the article it is associated with.
For non-Open Access articles published, all supplemental material carries a non-exclusive license, and permission requests for re-use of supplemental material or any part of supplemental material shall be sent directly to the copyright owner as specified in the copyright notice associated with the article.