
Abstract
Some leaders display high levels of narcissism. Does the link between narcissism levels and leadership exist in childhood? We conducted, to our knowledge, the first study of the relationship between narcissism levels and various aspects of leadership in children (N = 332, ages 7–14 years). We assessed narcissism levels using the Childhood Narcissism Scale and assessed leadership emergence in classrooms using peer nominations. Children then performed a group task in which one child was randomly assigned as leader. We assessed perceived and actual leadership functioning. Children with higher narcissism levels more often emerged as leaders in classrooms. When given a leadership role in the task, children with higher narcissism levels perceived themselves as better leaders, but their actual leadership functioning did not differ significantly from that of other leaders. Specification-curve analyses corroborated these findings. Thus, children with relatively high narcissism levels tend to emerge as leaders, even though they may not excel as leaders.
Some leaders display high levels of narcissism (Sedikides & Campbell, 2017). Despite their charisma, such leaders may tend to hurt their groups by stifling collaboration (Nevicka, Ten Velden, De Hoogh, & Van Vianen, 2011), derogating other people (Grapsas, Brummelman, Back, & Denissen, 2020), and behaving unethically (O’Reilly, Doerr, & Chatman, 2018; Watts et al., 2013). Unfortunately, it is unknown how narcissism levels are related to leadership in childhood. Here, we report, to our knowledge, the first randomized study of the relationship between narcissism levels and various aspects of leadership in childhood.
Narcissism and Leadership in Adults
Narcissism is a personality trait characterized by a sense of being more important and more entitled than other people (Krizan & Herlache, 2018). Narcissism can manifest in behavior (e.g., bragging) but also in private thoughts and feelings (e.g., grandiose fantasies). Narcissism is not something that individuals have or do not have; rather, it is a continuum along which individuals vary (Back & Morf, 2018), with no apparent shift from “nonnarcissist” to “narcissist” (Foster & Campbell, 2007).
Research in adults shows that individuals with relatively high narcissism levels often gravitate toward leadership roles (Grijalva, Harms, Newman, Gaddis, & Fraley, 2015; Sedikides & Campbell, 2017). To those around them, these individuals may seem well suited for such roles, because they match people’s implicit theories of what a leader should be like (Lord, Foti, & De Vader, 1984). Many people believe that a leader should be charming, charismatic, and self-confident (Judge, Bono, Ilies, & Gerhardt, 2002). Individuals with relatively high narcissism levels are often seen as charming, charismatic, and self-confident, as they tend to behave in self-assured and expressive ways (Leckelt, Küfner, Nestler, & Back, 2015), espouse bold visions (Galvin, Waldman, & Balthazard, 2010), and express firm confidence in their abilities (Nevicka, Ten Velden, et al., 2011). Consequently, these individuals are often likely to emerge as leaders in groups (Grijalva et al., 2015).
However, once they occupy leadership roles, individuals with relatively high narcissism levels may not benefit their group. Although these individuals often perceive themselves as effective leaders (Brunell et al., 2008; Judge, LePine, & Rich, 2006), they may behave in a dominant way and disregard the contributions of other people (Kausel, Culbertson, Leiva, Slaughter, & Jackson, 2015). For example, in collaborative tasks, leaders with relatively high narcissism levels tend to inhibit information exchange among group members, thereby harming group performance (Nevicka, Ten Velden, et al., 2011; also see Judge et al., 2006).
In sum, adults with relatively high narcissism levels tend to emerge as leaders and have positive views of their own leadership functioning. However, when given a leadership role, they may harm their group’s performance in collaborative contexts.
Narcissism and Leadership in Children
When in development does the link between narcissism and leadership arise? Resource-control theory (Hawley, 1999) suggests that leadership develops in childhood. Children who give orders and make decisions are thought to emerge as leaders and to use their leadership role to access scarce resources (e.g., visibility, popularity, and influence). Yet research on childhood leadership (Murphy & Johnson, 2011) and its underlying personality traits (Tackett, 2019) is scarce.
The period of late childhood to early adolescence appears critical for leadership development (Murphy & Johnson, 2011). At that age, children spend over 75% of their free time at school in groups of three or more peers (Coplan, Ooi, & Rose-Krasnor, 2015), and those groups need leaders to coordinate their collective efforts (Murphy & Johnson, 2011). Thus, children this age have ample opportunity to adopt leadership roles. In addition, they have acquired an adultlike ability to recognize leadership behaviors in others (Gülgöz & Gelman, 2017). Unsurprisingly, some children emerge as leaders (Coie & Dodge, 1983; Schneider, Ehrhart, & Ehrhart, 2002).
Children with higher narcissism levels may be more likely to emerge as leaders. Narcissism develops around the age of 7, when children acquire the ability to see themselves as superior to others (Thomaes & Brummelman, 2016). Children with relatively high narcissism levels tend to brag, show off, and capture people’s attention (Grapsas et al., 2020). In peer groups, these children often present themselves as role models (Thomaes, Stegge, Bushman, Olthof, & Denissen, 2008) and behave dominantly (Reijntjes et al., 2016). Peers may recognize these behaviors as reflecting leadership (Schneider et al., 2002). Consequently, these children may achieve visibility, popularity, and influence among their peers (Poorthuis, Slagt, van Aken, Denissen, & Thomaes, 2021; Reijntjes et al., 2016).
Statement of Relevance
Many people in leadership positions display a high level of a personality trait known as narcissism—a trait characterized by a sense of superiority and entitlement. Yet despite their charisma, these individuals do not always excel as leaders and may sometimes even harm their groups or society at large. The question we addressed in this research was whether we see these leadership dynamics even in childhood. We found that 7- to 14-year-old children who scored higher on a self-report measure of narcissism more often emerged as leaders in their classrooms. We also found that when these children were given a formal leadership role, they perceived themselves as better leaders. However, as we sometimes see in adults, they did not excel as leaders. These findings may inspire interventions to cultivate effective leadership from a young age, perhaps especially among children who score higher on narcissism, given that these children often emerge as leaders.
Once they find themselves in a leadership role, how do children with relatively high narcissism levels affect their group? One possibility is that these children, like their adult counterparts, tend to harm their group’s performance. They may behave dominantly (Reijntjes et al., 2016) and disregard or even suppress the views of others. Even among 7-year-olds, such disruption of information exchange can harm group performance (Gummerum, Leman, & Hollins, 2014). Another possibility is that children with relatively high narcissism levels, unlike their adult counterparts, tend to not harm their group’s performance. Children are generally less socially dominant than adults (Roberts, Walton, & Viechtbauer, 2006) and may therefore be less likely to act in ways that harm their group. For example, whereas adults with relatively high narcissism levels often quickly lose popularity among peers (Leckelt et al., 2015), children with relatively high narcissism levels are generally able to maintain their popularity over time (Poorthuis et al., 2021).
The Present Study
Our study examined the association between narcissism and various aspects of leadership in children (ages 7–14 years). We assessed narcissism as a continuous personality trait using the Childhood Narcissism Scale (Thomaes et al., 2008) and assessed leadership emergence (i.e., to what extent children were viewed as leaders by their classmates; Judge et al., 2002) using peer nominations. We then randomly assigned children to three-person groups to perform a collaborative task. Within each group, we randomly assigned one child to adopt a leadership role (i.e., the responsibility to guide the group discussion). We measured leaders’ perceived and actual leadership functioning (i.e., the ability to guide the activities of their group toward achievement of its goals; Judge et al., 2002).
We hypothesized that children with higher narcissism levels would more often emerge as leaders in classrooms and have more positive views of their own leadership functioning, but when given a leadership role, would not show better leadership functioning (either as perceived by their followers or as reflected in their leadership behavior or their group’s performance). Our hypotheses were not preregistered. We examined the robustness of our results through specification-curve analyses (Simonsohn, Simmons, & Nelson, 2019).
Method
Participants
We report how we determined our sample size, all data exclusions (if any), all manipulations, and all measures in the study. Participants were 332 children (46% boys, 97% of Dutch origin) between the ages of 7 and 14 years (M = 11.59, SD = 1.98) recruited from elementary and secondary schools in The Netherlands for the Childhood Leadership Study. The study data and materials, including a full study protocol and codebook, are available on OSF at https://osf.io/euvwt. All children received active informed parental consent and provided their assent. The study was approved by the Ethics Review Board of the University of Amsterdam Faculty of Social and Behavioral Sciences.
Children first completed questionnaires in their regular classrooms (including questionnaires that were unrelated to our research questions and are therefore not reported here). One child did not complete the narcissism questionnaire. Several days later, children were randomly assigned, within their classrooms, to three-person groups. Because 11 children were unavailable at that time, there were a total of 107 groups comprising a total of 321 children (46% boys, 96% of Dutch origin) between the ages of 7 and 14 years (M = 11.58, SD = 1.97). If the number of participating children within a classroom could not be divided by three, the remaining children were combined with children of other classrooms, which happened in nine groups. Each group completed a group task in a quiet room at their school, supervised by one of two experimenters, and one child was randomly assigned to the leadership role. One group quit the task before reaching a final decision.
We conducted power analyses (available on OSF) for each of our confirmatory analyses, with an α of .05, two-tailed. Power was .86 for detecting a medium-sized association between narcissism levels and leadership emergence (incidence-rate ratio [IRR] = 1.30, estimated from Poorthuis et al., 2021, and adjusted for overdispersion; N = 331 children). Power was .88 for detecting a medium-sized association between leader narcissism levels and self-perceived leadership functioning (r = .30, estimated from Brunell et al., 2008, Study 2; N = 107 groups). Power was .80 for detecting a medium-sized association between leader narcissism levels and objective leadership functioning (operationalized in terms of group performance, b = 0.57, odds ratio [OR] = 1.76, and adjusted for a group success rate of 36%, estimated from Nevicka, Ten Velden, et al., 2011; N = 107 groups).
Classroom assessment
Narcissism
Narcissism levels were assessed using the 10-item Childhood Narcissism Scale (Thomaes et al., 2008), a standard method for assessing narcissism as a unified, continuous, and normally distributed personality trait in children (Thomaes & Brummelman, 2016). Sample items are, “I am a very special person,” “Kids like me deserve something extra,” and “I love showing all the things I can do” (0 = not at all true, 3 = completely true). Responses were averaged across items (Cronbach’s α = .79; M = 1.29, SD = 0.51), resulting in a normal distribution (skewness = 0.08, SE = 0.13; kurtosis = 0.92, SE = 0.27; Shapiro-Wilk: W = .99, p = .156). The scale has been validated extensively in prior research, demonstrating good test-retest reliability (rs = .76 and .69 across 2 and 6 months, respectively), convergent validity (e.g., positive correlations with a sense of superiority), discriminant validity (e.g., weak correlations with self-esteem), concurrent validity (e.g., positive correlations with provoked aggression), and predictive validity (e.g., predicting peer-group popularity and bullying over time; Poorthuis et al., 2021; Reijntjes et al., 2016; Thomaes et al., 2008). Following past research (Thomaes & Brummelman, 2016), we analyzed narcissism levels as a continuum, rather than classifying children as narcissistic or nonnarcissistic.
Leadership emergence
Leadership emergence was assessed through peer nominations. Peer nominations have been shown to provide reliable and stable estimates of leadership emergence (Coie & Dodge, 1983; Schneider et al., 2002). Children nominated classmates whom they perceived as true leaders: “Which classmate is a true leader? A leader is someone who decides what a group does, someone who’s the boss. You may nominate as many classmates as you like.” Children were not asked to sort their nominations, so the order in which leaders were named was ignored. Of all participants, 73.2% received at least one nomination (range = 0–19 nominations received; M = 3.38, SD = 3.73).
Group task
The experiment proper focused on the association between leader narcissism levels and leadership functioning. In three-person groups, children performed a hidden-profile task (Gummerum et al., 2014), a collaborative task in which information was distributed among group members so that the optimal decision remained hidden unless group members pooled their unshared knowledge. Given that larger groups tend to perform worse (Lu, Yuan, & McLeod, 2012), a three-person group ensured sufficient variance in group performance. In each group, one child was randomly assigned to be the leader; others were followers. The leader was responsible for guiding the discussion, which included making the final group decision.
Groups formed a committee to select the best police officer from three candidates (Candidates 1, 2, and 3). Each child received a profile of each candidate. Children first read the profiles by themselves and then discussed them in their groups. Although each candidate had a total of nine attributes, the profiles provided to children included only five attributes per candidate; each group member received different sets of information. Some information was available to all group members (shared information); other information was available to only one group member (unshared information; Table 1).
Distribution of Information About Each Candidate for Group Discussion
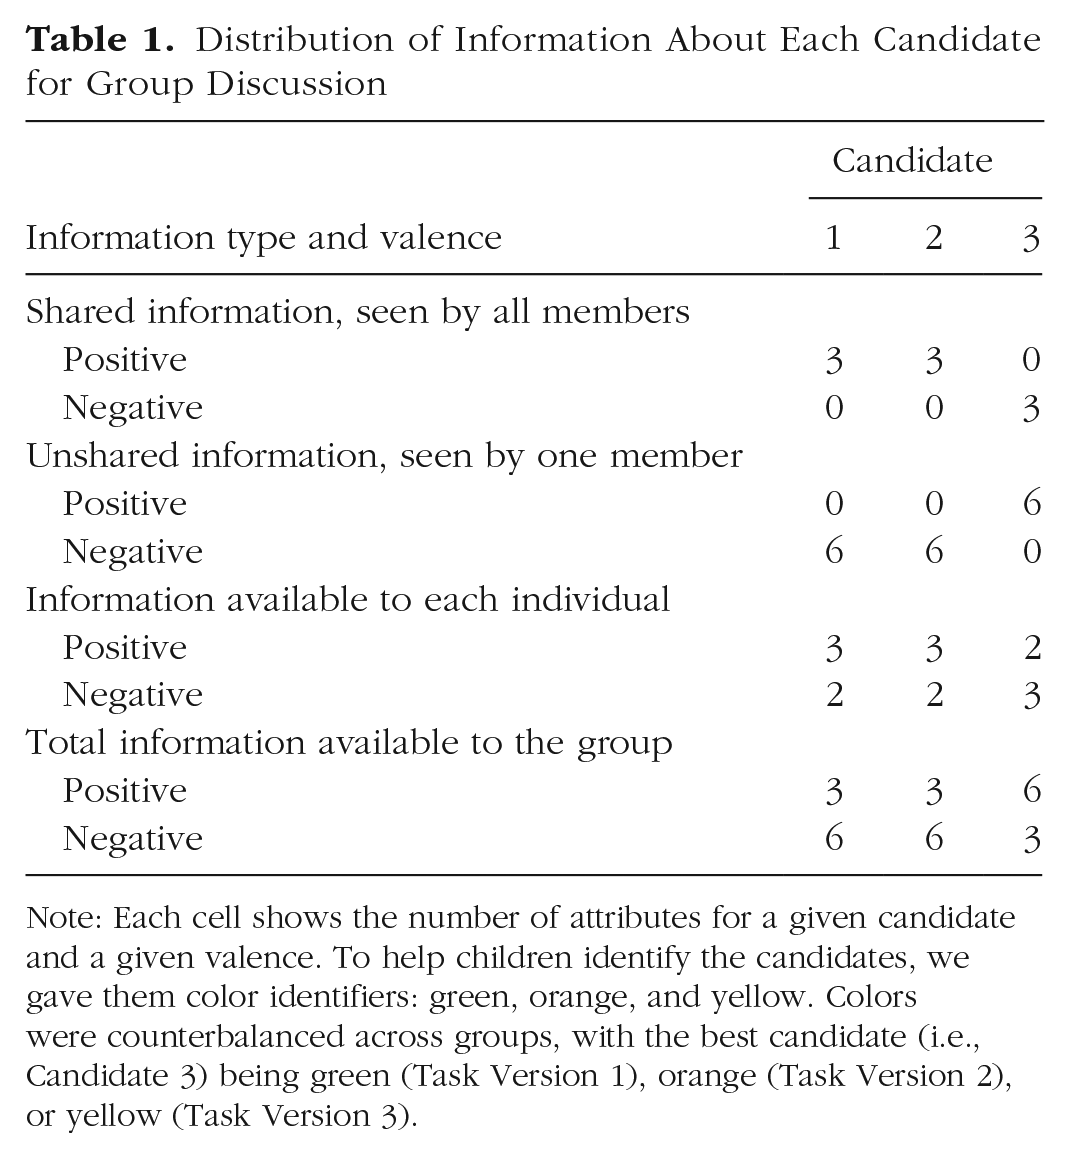
Note: Each cell shows the number of attributes for a given candidate and a given valence. To help children identify the candidates, we gave them color identifiers: green, orange, and yellow. Colors were counterbalanced across groups, with the best candidate (i.e., Candidate 3) being green (Task Version 1), orange (Task Version 2), or yellow (Task Version 3).
Exchanging unshared information was critical for identifying the best candidate. If groups discussed only shared information, Candidates 1 and 2 seemed the best (with three positive and two negative attributes each), and Candidate 3 seemed the worst (with two positive and three negative attributes). However, if group members pooled both shared and unshared information, they would have discovered that actually Candidate 3 was the best (with six positive and three negative attributes), and Candidates 1 and 2 were the worst (with three positive and six negative attributes each). On average, it took groups 5.79 min (SD = 3.45) to make a final decision.
We validated the task in two pilot studies (see the Supplemental Material available online), demonstrating that (a) children rated the positive attributes as unambiguously positive and the negative attributes as unambiguously negative; (b) after reading the individual profiles (which contained incomplete information about the three candidates), children failed to select the best candidate; (c) after reading the pooled information (which contained complete information about the three candidates), children did select the best candidate; and (d) children found the task sufficiently complex. Data and materials for both pilot studies are available on OSF.
Perceived leadership functioning
Perceived leader authority
Perceived leader authority was assessed using four items (Nevicka, Ten Velden, et al., 2011) adapted for use with children (sample item: “The leader took the lead”; 0 = not at all true, 3 = completely true). Followers rated their leader (Cronbach’s α = .61, M = 1.98, SD = 0.58) and leaders rated themselves (sample item: “I took the lead”; Cronbach’s α = .57, M = 2.25, SD = 0.47).
Perceived leader effectiveness
Perceived leader effectiveness was assessed using four items (De Hoogh, Den Hartog, & Koopman, 2005), adapted for use with children (sample item: “The leader performed well as a leader”; 0 = not at all true, 3 = completely true). Followers rated their leader (Cronbach’s α = .87; M = 2.03, SD = 0.73), and leaders rated themselves (sample item: “I performed well as a leader”; Cronbach’s α = .88; M = 2.13, SD = 0.63).
Future leader preference
Future leader preference was assessed using a ranking score (Nevicka, De Hoogh, Van Vianen, Beersma, & McIlwain, 2011). Children were asked, “Imagine that you will do another group task in the future. Who would you prefer to have as a leader?” Children ranked their group members, including themselves. Higher scores indicated higher preference for that group member as a future leader.
Actual leadership functioning
Coded leadership behavior and overall leadership functioning
Using video recordings of the group task, two observers (graduate students in child development) independently coded leadership behaviors displayed by group members. The observers were provided with a coding protocol (available on OSF) and were trained by the first and second author. Observers coded how often group members (a) asked about someone else’s preferred candidate, (b) asked about a candidate’s traits, (c) indicated his or her own preferred candidate, (d) shared content of their own candidate descriptions, (e) spoke, (f) divided tasks among group members, and (g) drew conclusions for the group. These ratings capture initiating-structure aspects of leadership, such as providing direction, planning, organizing, problem solving, informing, and monitoring (Yukl, Gordon, & Taber, 2002). To establish interrater reliability, the observers first coded the same 20% of the groups. Because both interrater reliability and agreement were high for each rating—all intraclass correlation coefficients, or ICCs(A,1) > .90, ps < .001 (LeBreton & Senter, 2008)—the main observer continued to code the remaining 80%. Ratings were aggregated across behaviors to form an overall index of leadership behavior (leaders: Cronbach’s α = .70; M = 9.43, SD = 5.56; followers: Cronbach’s α = .66; M = 8.05, SD = 5.05).
Afterward, observers provided a global rating of each group member’s overall leadership functioning: “How much did the child guide the group discussion?” (0 = to a small extent, 3 = to a great extent), ICC(A,1) = .92, p < .001 (leaders: M = 1.52, SD = 0.87; followers: M = 1.10, SD = 0.90). Coded leadership behavior and coded overall leadership functioning were correlated highly, r = .67, p < .001, which attests to their validity.
Leader information exchange
An observer counted how often leaders exchanged shared information (M = 9.98 times, SD = 6.97) and unshared information (M = 9.36 times, SD = 6.04) about the candidates with their followers.
Group performance
Group performance was indexed by assessing whether the group made the correct decision, that is, chose the best candidate. Of all groups, 26% chose the best candidate. This aligns with prior work showing that only a minority of groups choose the best candidate in a hidden-profile task (Gummerum et al., 2014).
Data analysis
All data and code are available on OSF. We analyzed leadership emergence for each individual (N = 331 children) and leadership functioning for each child assigned as the leader of each group (N = 107 groups). We standardized narcissism levels (M = 0, SD = 1) across all children in the sample so that all regression coefficients estimated how much the outcome increased if narcissism levels increased by 1 standard deviation relative to the full sample. In all analyses, no single case unduly influenced the results (Cook’s distances < 1). The significance level was set at .05, two-tailed.
Leadership emergence
To examine whether narcissism levels predicted leadership emergence, we conducted multilevel linear negative binomial regression (Hilbe, 2011), using the R package glmmTMB (Version 1.0.0; Brooks et al., 2017). The number of leadership nominations each child received was entered as the outcome, and narcissism levels were entered as a continuous fixed effect. Because children were nested within classrooms, we included classroom-level random intercept and slope terms, which we allowed to covary. To control for variation in classroom size, we included a fixed parameter for the log of the number of participating classmates, with its coefficient fixed to 1. This functioned as an offset that converted the model to estimate nomination rates rather than raw counts, helping to ensure accurate parameter estimation (Hilbe, 2011).
Negative binomial regression estimates relationships between predictors and count outcomes while controlling for overdispersion in regression residuals. Residual overdispersion is common when modeling real-world count data, and it can inflate false-positive rates if left uncontrolled (Hilbe, 2011). Postfitting examination of residuals using the R package DHARMa (Version 0.2.7; Hartig, 2020) indicated that residual overdispersion had been accounted for (dispersion ratio = 1.00, one-tailed p = .413) and that residuals were distributed normally (Kolmogorov-Smirnov normality test = .05, p = .299).
Leadership functioning
To examine whether leader narcissism levels predicted leadership functioning, we conducted standard linear regression for the outcomes of perceived leader authority, perceived leader effectiveness, future leader preference, coded leadership behavior, coded overall leadership functioning, and coded leader information exchange. In addition, we conducted logistic regression for group performance (1 = correct decision, 0 = incorrect decision). In these analyses, the narcissism level of each child who was randomly assigned as a leader served as a continuous predictor.
We aggregated follower-rated leadership outcomes at the group level (so that each group had one overall score) because ICCs and mean within-group agreements (rwgs) were sufficiently high (LeBreton & Senter, 2008): ICC(1) = .34, ICC(K) = .51, p < .001, and rwg = .90 for perceived leader authority; ICC(1) = .18, ICC(K) = .31, p = .030, and rwg = .82 for perceived leader effectiveness; and ICC(1) = .27, ICC(K) = .43, p = .002, and rwg = .75 for future leadership preference.
Specification-curve analyses
We examined the robustness of our main results through specification-curve analysis (Simonsohn et al., 2019; also see Bryan, Yeager, & O’Brien, 2019). The technique is based on the idea that many data-analytic choices can be simultaneously defensible and arbitrary, which means that two equally competent researchers might make different choices, reflecting researcher degrees of freedom. Specification-curve analysis is a tool for considering the evidentiary strength for research hypotheses across all reasonable model specifications—that is, across all nonredundant combinations of data-analytic choices that are conceptually and statistically valid. Thus, rather than reporting only a handful of analyses, we report all results of all defensible analyses (for a detailed analysis plan, see the Supplemental Material).
Results
Preliminary analyses
Narcissism levels, leadership emergence, age, and gender did not differ significantly between leaders and followers, ps > .561, indicating successful random assignment to leader and follower roles. Table S3 in the Supplemental Material displays zero-order correlations.
Supporting the validity of the role assignment, results showed that leaders displayed more leadership behavior than did followers—coded leadership behavior: t(319) = 2.23, p = .026, d = 0.25 (leaders: M = 9.43, SD = 5.56; followers: M = 8.05, SD = 5.05); coded overall leadership functioning: t(319) = 3.98, p < .001, d = 0.45 (leaders: M = 1.52, SD = 0.87; followers: M = 1.10, SD = 0.90). Supporting the validity of the group task, results showed that groups performed better (i.e., were more likely to select the best candidate) when their leader displayed more coded leadership behavior, OR = 1.13, b = 0.12, p = .005, and when their leader exchanged more unshared information, OR = 1.19, b = 0.17, p < .001. There was a positive but nonsignificant association between group performance and coded overall leadership functioning, OR = 1.65, b = 0.50, p = .065. Even though groups were not informed whether they had selected the best candidate, leaders were rated as more effective by their followers in groups that chose the best candidate (M = 2.25, SD = 0.47) than in groups that did not (M = 1.96, SD = 0.56), t(104) = 2.42, p = .017, d = 0.47.
Confirmatory analyses
Leadership emergence
Narcissism levels were positively related to leadership emergence, b = 0.25, 95% confidence interval (CI) = [0.10, 0.41], IRR = 1.29, p = .001, indicating that children with higher narcissism levels were more likely to emerge as leaders in their classrooms. The strength of this association differed between classrooms—narcissism level τ2 = 0.06, compared with a random-intercept-only model, χ2(2) = 12.5, p = .002—but the association was positive in 22 out of 23 classrooms (96%). A 1-standard-deviation increase in narcissism level corresponded with a 29% increase in leadership nominations received.
Perceived leadership functioning
Leader narcissism levels were positively related to self-perceived leader authority, b = 0.11, 95% CI = [0.03, 0.19], β = 0.25, p = .010, and effectiveness, b = 0.11, 95% CI = [0.01, 0.44], β = 0.20, p = .042. By contrast, leader narcissism levels were not significantly related to follower-perceived leader authority, b = 0.04, 95% CI = [−0.04, 0.13], β = 0.10, p = .304, and effectiveness, b = 0.04, 95% CI = [−0.06, 0.14], β = 0.08, p = .398. Thus, in a leadership role, children with higher narcissism levels perceived themselves as more authoritarian and more effective leaders, but their followers were not significantly inclined to perceive them as such.
Leader narcissism levels were not significantly related to future leader preference, either from the leader’s perspective, b = 0.07, 95% CI = [−0.07, 0.22], β = 0.10, p = .317, or from the followers’ perspective, b = 0.01, 95% CI = [−0.10, 0.13], β = 0.02, p = .812.
Actual leadership functioning
Leader narcissism levels were not significantly related to coded leadership behavior, b = 0.34, 95% CI = [−0.64, 1.33], β = 0.07, p = .492; coded overall leadership functioning, b = 0.02, 95% CI = [−0.14, 0.17], β = 0.02, p = .832; leader exchange of shared information, b = 0.44, 95% CI = [−0.80, 1.68], β = 0.07, p = .479; or leader exchange of unshared information, b = 0.35, 95% CI = [−0.72, 1.43], β = 0.06, p = .519. 1 Leader narcissism levels also did not significantly predict the odds that a group would arrive at the correct decision, OR = 1.03, b = 0.03, 95% CI = [−0.38, 0.44], p = .898. Thus, in a leadership role, children with higher narcissism levels did not differ significantly from other leaders in how much leadership behavior they displayed or how their group performed.
Specification-curve analyses
For each confirmatory analysis, specification-curve analysis demonstrated that results were highly robust to alternative model specifications (for detailed results, see the Supplemental Material).
Exploratory analyses
Research in adults suggests that the associations of narcissism levels with leadership emergence and functioning may be driven by agentic traits (e.g., self-confidence; Grijalva et al., 2015; Leckelt et al., 2015; Watts et al., 2013). We explored this possibility. As part of the classroom questionnaire, children rated themselves on agentic traits (smart, popular, good-looking, funny, self-confident) and communal traits (honest, caring, trustworthy, loyal). Replicating prior work in adults (Campbell, Rudich, & Sedikides, 2002), our results showed that narcissism levels were positively related to agentic traits, r(329) = .58, p < .001, but were not significantly related to communal traits, r(329) = .08, p = .141. We then examined whether agentic traits mediated the associations of narcissism levels with leadership emergence and functioning (see the Supplemental Material). Although agentic traits did not significantly mediate the positive association between narcissism levels and leadership emergence, they fully mediated the positive associations of leader narcissism levels with self-perceived leader authority and effectiveness.
Discussion
Our randomized study examined the relationship between narcissism levels and various aspects of leadership in childhood. Narcissism was assessed as a continuous personality trait using the Childhood Narcissism Scale (Thomaes et al., 2008). Children with higher narcissism levels more often emerged as leaders in their classrooms and had more positive views of their own leadership functioning. Yet when they actually had to lead a group, their leadership functioning did not differ significantly from that of other leaders. Indeed, as leaders, children with higher narcissism levels did not differ significantly from other leaders in how much leadership behavior they displayed, how positively they were perceived by their followers, or how their group performed. Specification-curve analyses demonstrated the robustness of our findings.
Theoretical implications
Children with relatively high narcissism levels tended to emerge as leaders in their classrooms, even though they did not actually excel as leaders. How is that possible? According to evolutionary theories of self-deception (von Hippel & Trivers, 2011), self-deception has evolved to facilitate interpersonal deception. Because children with relatively high narcissism levels truly believe they make amazing leaders, they may confidently convince others of their leadership skills without having to suppress or hide any self-doubt. These children may thus acquire leadership positions and other social resources.
What is unique about narcissism and leadership in childhood? Like their adult counterparts (Grijalva et al., 2015), children with relatively high levels of narcissism tend to emerge as leaders. Yet unlike their adult counterparts (Nevicka, Ten Velden, et al., 2011), children with relatively high narcissism levels in leadership roles do not tend to significantly harm their group’s performance. Narcissism may have fewer interpersonal costs in childhood than in adulthood (Poorthuis et al., 2021), perhaps because children are generally less socially dominant than adults (Roberts et al., 2006), making them less inclined to act against their group’s interests.
Research in adults suggests that narcissism levels are underpinned by agentic and antagonistic traits (Back & Morf, 2018; Krizan & Herlache, 2018). The association between narcissism levels and leadership may be driven, in part, by agentic traits (e.g., self-confidence; Grijalva et al., 2015; Watts et al., 2013). For example, when adults with relatively high narcissism levels enter a new peer group, their agentic traits predict initial increases in popularity (Leckelt et al., 2015). In our study, agentic traits did not significantly mediate the association between narcissism levels and leadership emergence. Agentic traits did, however, fully mediate the association between narcissism levels and self-perceived leadership functioning. Thus, agentic traits helped explain why children with higher narcissism levels perceived themselves more favorably as leaders—an important step toward developing a leadership identity (Murphy & Johnson, 2011).
Strengths, limitations, and future directions
Strengths of our study include its developmental focus, its experimental design, and its multimethod and multisource assessments of leadership functioning. Our study also has limitations. First, our study was not preregistered. Although specification-curve analyses demonstrate the robustness of our findings, we call for well-powered replications. Second, the nature of childhood leadership is understudied. We captured leadership emergence using peer nominations and captured leadership functioning using a collaborative task (Gummerum et al., 2014). Supporting the task’s validity, results showed that leaders displayed more leadership behavior than did their followers, and the more leadership behavior they displayed, the better their group performed. Also, followers rated leaders in better-performing groups as more effective. We call for more research on the construct validity of childhood leadership. For example, are more popular children also more likely to emerge as leaders? And does children’s leadership functioning vary across contexts (e.g., high vs. low intergroup competition)?
Our research also points to new research directions. An exciting direction will be to examine leadership as it emerges naturally in groups and develops across the life span. In our study, we randomly assigned one child to be the leader. Would children with relatively high narcissism levels perform better as leaders and would they be more valued by their followers when they have truly earned their leadership roles? If so, would they be more likely to become successful leaders in adulthood? And would their success be driven by their agentic or antagonistic traits (Leckelt et al., 2015)? Research has begun to examine how adults with relatively high narcissism levels attain career success, and how success, in turn, shapes them (Wille, Hofmans, Lievens, Back, & De Fruyt, 2019). Addressing these issues will elucidate how narcissism levels and leadership intersect across the life span.
Conclusion
Freud (1931/1961) believed that individuals with relatively high narcissism levels “impress others as ‘personalities’; they are especially suited to act as a support for others, to take on the role of leaders and to give a fresh stimulus to cultural development or to damage the established state of affairs” (p. 218). Our research shows that children with relatively high narcissism levels tend to impress their classmates as leaders, even though they may not excel when they actually have to lead a group.
Supplemental Material
sj-docx-1-pss-10.1177_0956797620965536 – Supplemental material for Narcissism and Leadership in Children
Supplemental material, sj-docx-1-pss-10.1177_0956797620965536 for Narcissism and Leadership in Children by Eddie Brummelman, Barbara Nevicka and Joseph M. O’Brien in Psychological Science
Footnotes
Acknowledgements
We thank Floor Hoff and Mariëlle van Loenen for help with data collection. The findings reported here were presented at the 2019 Society for Research in Child Development Biennial Meeting in Baltimore, Maryland.
Transparency
Action Editor: D. Stephen Lindsay
Editor: D. Stephen Lindsay
Author Contributions
E. Brummelman and B. Nevicka developed the study concept, designed the research, and coordinated data collection. J. M. O’Brien analyzed the data with input from E. Brummelman and B. Nevicka. E. Brummelman drafted the manuscript, and B. Nevicka and J. M. O’Brien provided critical revisions. All authors approved the final version of the manuscript for submission.
Notes
References
Supplementary Material
Please find the following supplemental material available below.
For Open Access articles published under a Creative Commons License, all supplemental material carries the same license as the article it is associated with.
For non-Open Access articles published, all supplemental material carries a non-exclusive license, and permission requests for re-use of supplemental material or any part of supplemental material shall be sent directly to the copyright owner as specified in the copyright notice associated with the article.