
Abstract
The stop-signal paradigm is a popular method for examining response inhibition and impulse control in psychology, cognitive neuroscience, and clinical domains because it allows the estimation of the covert latency of the stop process: the stop-signal reaction time (SSRT). In three sets of simulations, we examined to what extent SSRTs that were estimated with the popular mean and integration methods were influenced by the skew of the reaction time distribution and the gradual slowing of the response latencies. We found that the mean method consistently overestimated SSRT. The integration method tended to underestimate SSRT when response latencies gradually increased. This underestimation bias was absent when SSRTs were estimated with the integration method for smaller blocks of trials. Thus, skewing and response slowing can lead to spurious inhibitory differences. We recommend that the mean method of estimating SSRT be abandoned in favor of the integration method.
The ability to inhibit planned or ongoing actions is a cornerstone of flexible human behavior (Verbruggen & Logan, 2008). The stop-signal paradigm (Fig. 1a) is currently one of the most popular tasks for examining response inhibition in the laboratory. The last decade has witnessed an exponential rise in stop-signal studies in various research domains (see Fig. S1 in the Supplemental Material available online). The paradigm is popular because it allows researchers to estimate the covert latency of the stop process: the stop-signal reaction time (SSRT). SSRT has been used to explore the cognitive and neural mechanisms of response inhibition, the development and decline of inhibitory capacities across the life span, and correlations between individual differences in stopping and behaviors such as substance abuse, pathological gambling, risk taking, and more generally, control of impulses and urges (Chambers, Garavan, & Bellgrove, 2009; Logan, 1994; Verbruggen & Logan, 2008).
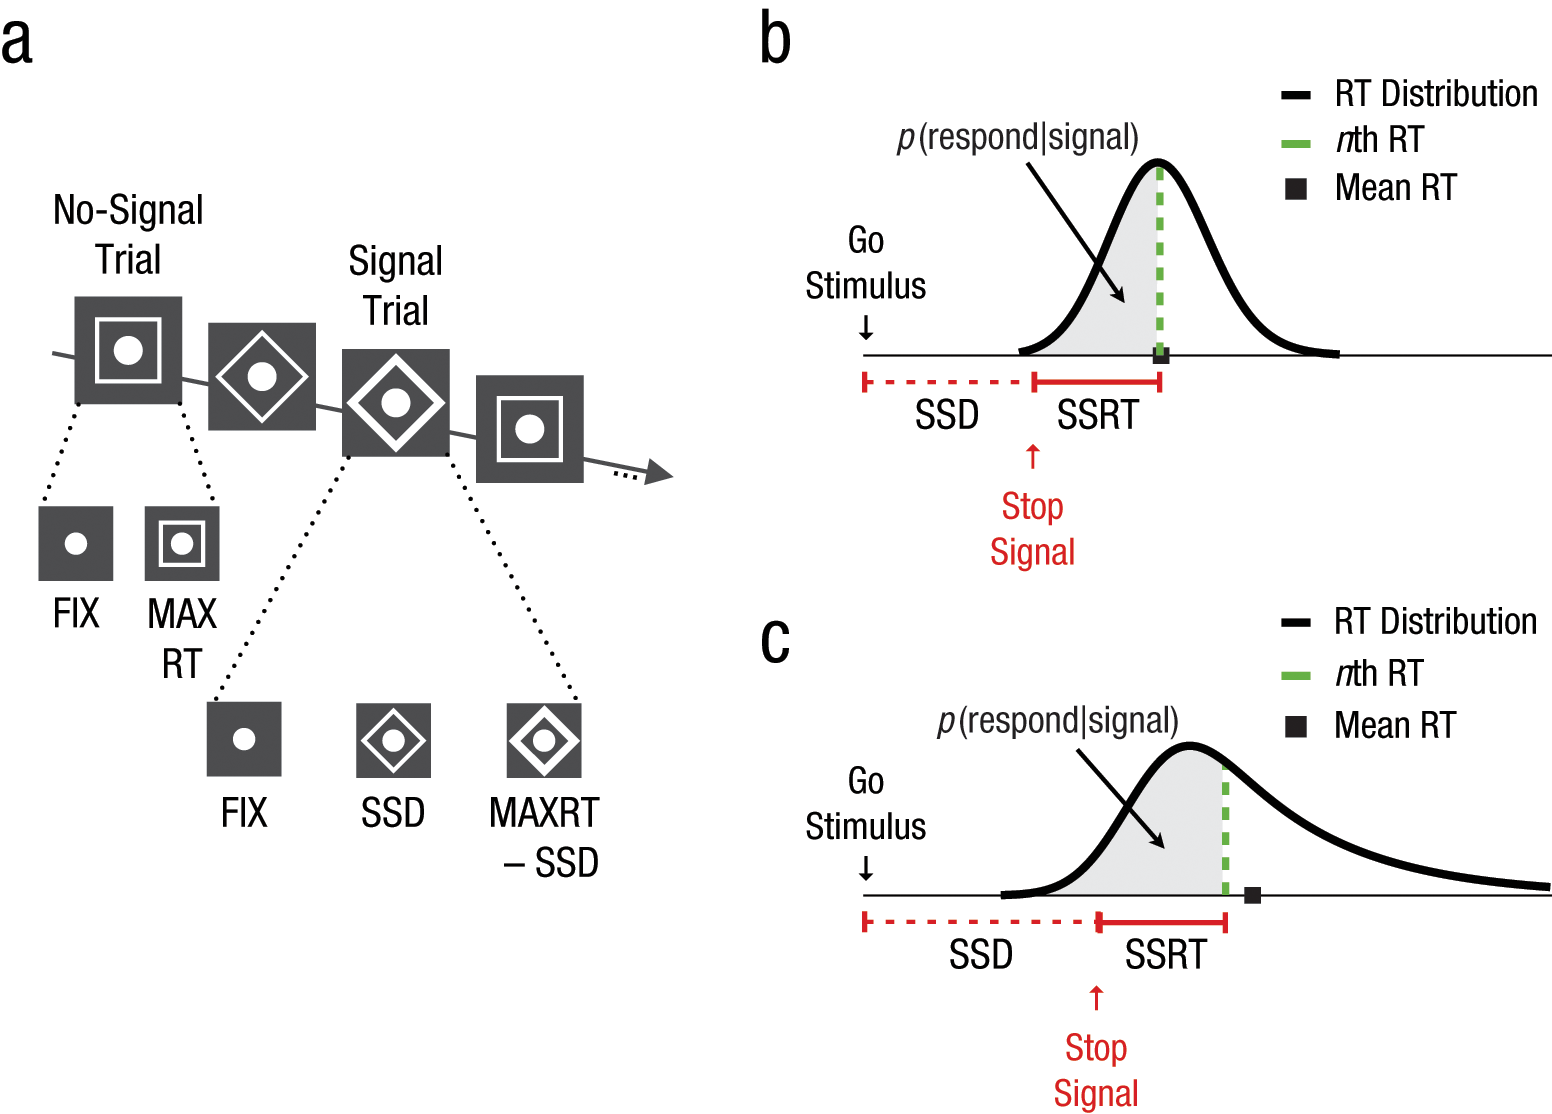
Experimental paradigm. In the stop-signal task (a), participants perform a go task (e.g., responding to the shape of a go stimulus). On a minority of the trials, the go stimulus is followed by a stop signal (e.g., the outline of the shape turning bold) after a variable stop-signal delay (SSD); this stop signal instructs the subject to withhold the planned response. FIX = presentation duration of the fixation sign; MAXRT = response deadline. A graphic representation of the assumptions of the independent-horse-race model of Logan and Cowan (1984; b) indicates how the probability of responding, p(respond|signal), depends on the distribution of go reaction time, SSD, and stop-signal reaction time (SSRT). In this example, p(respond|signal) = .50. The dashed line corresponds to the nth percentile, with n equal to p(respond|signal) multiplied by 100. When the distribution is skewed to the right, as in (c), there is a substantial difference between the mean and the nth RT; this may influence the SSRT estimations.
In the present study, we used simulations to test the reliability and accuracy of SSRT estimates. Previous simulations of Band, van der Molen, and Logan (2003) showed that commonly used SSRT-estimation methods were not influenced much by variability in go reaction time (RT) or in SSRT, or by dependency between the go and stop processes. However, we will show that estimates are strongly biased by positive skew and by gradual slowing of RTs. Because skew and slowing are important characteristics of RT distributions in most stop- signal experiments, our simulations suggest that some of the previously reported differences in stopping may be spurious.
SSRT is estimated according to the independent-race model (Logan, 1994; Logan & Cowan, 1984; Verbruggen & Logan, 2009a): Performance in the stop task can be modeled as a race between a go process, which is triggered by the presentation of the go stimulus, and a stop process, which is triggered by the presentation of a stop signal (Fig. 1b). The stop signal occurs after a variable interval, the stop-signal delay (SSD). If the go process finishes before the stop process (i.e., when RT < (SSRT + SSD)), then response inhibition is unsuccessful and a response is executed; if the stop process finishes before the go process (i.e., when RT > (SSRT + SSD)), then the response is correctly withheld. The race model provides two common methods for estimating SSRT: the integration method and the mean method (Logan & Cowan, 1984). In the integration method, the point at which the stop process finishes is estimated by integrating the RT distribution and finding the point at which the integral equals the probability of responding, p(respond|signal), for a specific delay. SSRT is then calculated by subtracting SSD from the finishing time. In the mean method, the mean of the inhibition function (a plot of the probability of responding given a stop signal against SSD; see Logan & Cowan, 1984; Verbruggen & Logan, 2009a) is subtracted from the mean of the RT distribution.
In recent years, the majority of stop-signal studies have used a dynamic tracking procedure to determine an SSD at which subjects inhibit their responses 50% of the time. At the beginning of the experiment, SSD is set to a specific value (e.g., 250 ms) and is then constantly adjusted after stop-signal trials depending on the outcome of the race: When inhibition is successful, SSD increases (e.g., by 50 ms); when inhibition is unsuccessful, SSD decreases (e.g., by 50 ms). This one-up/ one-down tracking procedure typically results in a p(respond| signal) of approximately .50, which means that the race between the stop process and the go process is tied. Then SSRT is usually estimated with the mean method or the integration method (see Fig. S1 in the Supplemental Material). 1 The mean method uses the mean of the inhibition function, which corresponds to the average SSD obtained with the tracking procedure when p(respond|signal) = .50. In other words, the mean method assumes that the mean RT equals SSRT plus the mean SSD, so SSRT can be estimated easily by subtracting the mean SSD from the mean RT (e.g., Logan & Cowan, 1984; Logan, Schachar, & Tannock, 1997). The integration method assumes that the finishing time of the stop process corresponds to the nth RT, with n equal to the number of RTs in the RT distribution multiplied by the overall p(respond|signal) (Logan, 1981); SSRT can then be estimated by subtracting the mean SSD from the nth RT (e.g., Ridderinkhof, Band, & Logan, 1999; Verbruggen, Liefooghe, & Vandierendonck, 2004).
Simulations and reliability tests 2 suggest that when the tracking procedure is used, the mean and integration estimates are both reliable (Band et al., 2003; Congdon et al., 2012; Logan et al., 1997; Williams, Ponesse, Schachar, Logan, & Tannock, 1999). However, a recent empirical study reported numerical differences between the two (Boehler, Appelbaum, Krebs, Hopf, & Woldorff, 2012). We propose that such discrepancies are mainly due to two factors, namely, the skewness of the RT distribution and the degree of proactive response slowing in anticipation of stop signals. Indeed, the simulations of Band et al. (2003), and the comparison of the mean and integration methods by Boehler et al. (2012), suggest that skew and slowing might have an effect on estimations. However, these factors have not been systematically explored in the simulations or reliability tests so far. There are often large individual or group differences in the shape of the RT distribution and the degree of response slowing, so it is important to know the extent to which these differences influence SSRT estimates.
In our first set of simulations, we examined the effect of positively skewed RT distributions on SSRT estimates. It is well known that the mean is strongly influenced by extreme scores in the tails of the distribution; the median is less affected by the tails. In the stop-signal task, the median corresponds to the nth RT when p(respond|signal) is exactly .50. Because RT distributions are usually positively skewed (Ratcliff, 1993), the right tail of the distribution might explain discrepancies between the mean and integration estimates. As Figure 1c shows, the mean method would overestimate the finishing time of the stop process (and, therefore, the SSRT) when the RT distribution is skewed, whereas the integration method might provide a more accurate estimate. We tested this in the first set of simulations.
In a second and third set of simulations, we explored the effect of response slowing on SSRT estimates. Recent studies have shown that subjects slow responses either proactively when they expect that stop signals might occur or reactively when they fail to inhibit their responses (e.g., Aron, 2011; Bissett & Logan, 2011; Leotti & Wager, 2010; Verbruggen & Logan, 2009b; Verbruggen, Logan, Liefooghe, & Vandierendonck, 2008; Zandbelt, Bloemendaal, Neggers, Kahn, & Vink, 2012). Indeed, subjects sometimes slow their RTs over the course of the experiment to try to beat the tracking algorithm (see e.g., Leotti & Wager, 2010, for some extreme examples). These shifts in the RT distribution could result in overestimates of SSRT in the mean method because slowing would primarily influence the right tail of the distribution; however, in the integration method, these shifts could result in underestimates in SSRT because the tracking is a step behind when subjects continuously slow down. We tested the effect of slowing in the second and third sets of simulations.
Method
Race-model simulations
In this study, performance in the stop-signal task was simulated according to the independent-race model (Logan & Cowan, 1984): On stop-signal trials, a response was deemed to be withheld (signal-inhibit trial) when the RT was larger than the sum of the SSRT and the SSD; a response was deemed to be erroneously executed (signal-respond trial) when RT was smaller than the sum of the SSRT and SSD.
All simulations were done using R (R Development Core Team, 2008). RTs were sampled from an ex-Gaussian distribution using the rexGaus function (http://gamlss.org). The ex-Gaussian distribution is often used by psychologists to describe RT data (Ratcliff & Murdock, 1976); it has a positively skewed unimodal shape and results from a convolution of a normal (Gaussian) distribution and an exponential distribution. It is characterized by three parameters: µ (mean of the Gaussian component), σ (standard deviation of the Gaussian component), and τ (both the mean and the standard deviation of the exponential component; Fig. S2 in the Supplemental Material shows how changes in these three parameters influence the distribution). Sigma approximately represents the rise in the left tail of the ex-Gaussian distribution, and τ approximately represents the fall in the right tail of the ex-Gaussian distribution, whose mean is equal to the sum of µ plus τ and whose variance is equal to the sum of τ2 plus σ2 (Ratcliff, 1979). Band et al. (2003) also used an ex-Gaussian distribution to model RTs in their simulations.
In the first set of simulations, σ for the RTs in the go task (RT σ) was 50, 100, or 150, and τ for the RTs in the go task (RT τ) was 50, 150, 250 (see, e.g., Schmiedek, Oberauer, Wilhelm, Süss, & Wittmann, 2007, for a series of choice-RT tasks with τs in this range). Empirically, σ is usually not more than one fourth of τ (Ratcliff, 1993); however, we included a wider range of σ because variability is often increased in clinical populations (e.g., Klein, Wendling, Huettner, Ruder, & Peper, 2006; Leth-Steensen, King Elbaz, & Douglas, 2000). For each combination of RT σ and RT τ, we simulated the data of 100 subjects. Mu was different for each subject, µ(subject); it was sampled from a normal distribution with a mean of 400 (i.e., the population mean; SD = 25), with the restriction that it was larger than 300.
SSRTs were also sampled from an ex-Gaussian distribution. For all subjects, both SSRT σ and SSRT τ were 10. Mu(subject) was derived from a normal distribution with a mean of 200 (population mean; SD = 10), with the restriction that µ(subject) was larger than 150. Note that we also ran simulations in which SSRT σ and SSRT τ were varied; the results are reported in the Supplemental Material (Table S7). SSRT σ and SSRT τ did not influence the estimates much and did not interact with the effects of RT τ and response slowing. Therefore, we used only one value for SSRT σ and SSRT τ in the main simulations reported here.
For each simulated subject, there were four blocks of 60 trials; signals randomly occurred on 25% of the trials, which resulted in 15 stop-signal trials per block. The delay between the start of the go process and the start of the stop process (SSD) was initially set at 150 plus RT τ (e.g., when RT τ was 250, the initial SSD was 400) and subsequently adjusted: After a signal-inhibit trial, SSD increased by 50; after a signal-respond trial, SSD decreased by 50. The start value was chosen in such a way that the race between go and stop would be close, but with a small initial head start for the stop process (the finishing time of the go process had a mean RT of 400 plus RT τ; the finishing time of the stop process was equal to SSD + mean SSRT = 150 + RT τ + 200 + SSRT τ). Because µ was not manipulated across conditions, we only used τ to determine start SSD.
In the second set of simulations, we examined the effect of gradual slowing of RTs. RTs were again derived from an ex-Gaussian distribution, but RT µ increased linearly over trials. The start value of RT µ was again derived from a normal distribution with µ equal to 400 (SD = 25). The slope of the increase depended on a slowing factor, which could be 1, 1.5, or 2.5; these values were roughly based on the degree of slowing for individual subjects in one of our previous studies (Verbruggen & Logan, 2009b). The slope of the increase was calculated as follows: (y2 − y1)/(x2 − x1), with y2 = RT µ(start) × slowing factor, and y1 = RT µ(start), x2 = 240 (the trial number of the last trial), and x1 = 1 (trial number of the first trial). When the slowing factor was 1, the slope was 0 (i.e., y2 = y1, so no slowing). When the slowing factor was 1.5 or 2.5, the slope was positive, and RT µ increased. For example, with only six trials and the slowing factor equal to 1.5, RT µs would be µ(start) on the first trial, µ(start) × 1.1 on the second trial, µ(start) × 1.2 on the third trial, µ(start) × 1.3 on the fourth trial, µ(start) × 1.4 on the fifth trial, and µ(start) × 1.5 on the sixth trial. In this second set of simulations, RT σ was 50 or 150, and RT τ was 50 or 250.
Finally, in the third set of simulations, the slowing factor was different for each subject to allow for individual differences in slowing. For each simulated subject, the slowing factor was derived from a uniform distribution with a minimum of 1 and a maximum of 3.
Estimation and analyses
For the first set of simulations, we estimated SSRT over all blocks using the mean method (SSRT = mean RT – mean SSD) and the integration method (SSRT = nth RT – mean SSD). For the second and third set, we also estimated SSRT for each block separately using the integration method and then took the average of these four block estimates. 3 Trials with an RT higher than 2,000 were considered to be missed responses (in real experiments, there is always a response deadline around this value). These missed trials were excluded when we estimated SSRT using the mean method; for the integration methods, RT for missed responses was set to 2,000. 4
For each estimation method, we calculated the difference between the estimated SSRT and the actual SSRT; positive values indicated that SSRT was overestimated, whereas negative values indicated that SSRT was underestimated. Table 1 reports the mean difference scores, confidence intervals, and results of t tests that explored whether the SSRT difference was reliably different from zero. Using mixed analyses of variance (ANOVAs; see Tables S2, S4, and S6 in the Supplemental Material for overviews), we then tested whether the difference scores were influenced by estimation method, RT σ, RT τ, and slowing (second set of simulations).
Results of Analyses of the Difference Scores in the Three Simulations
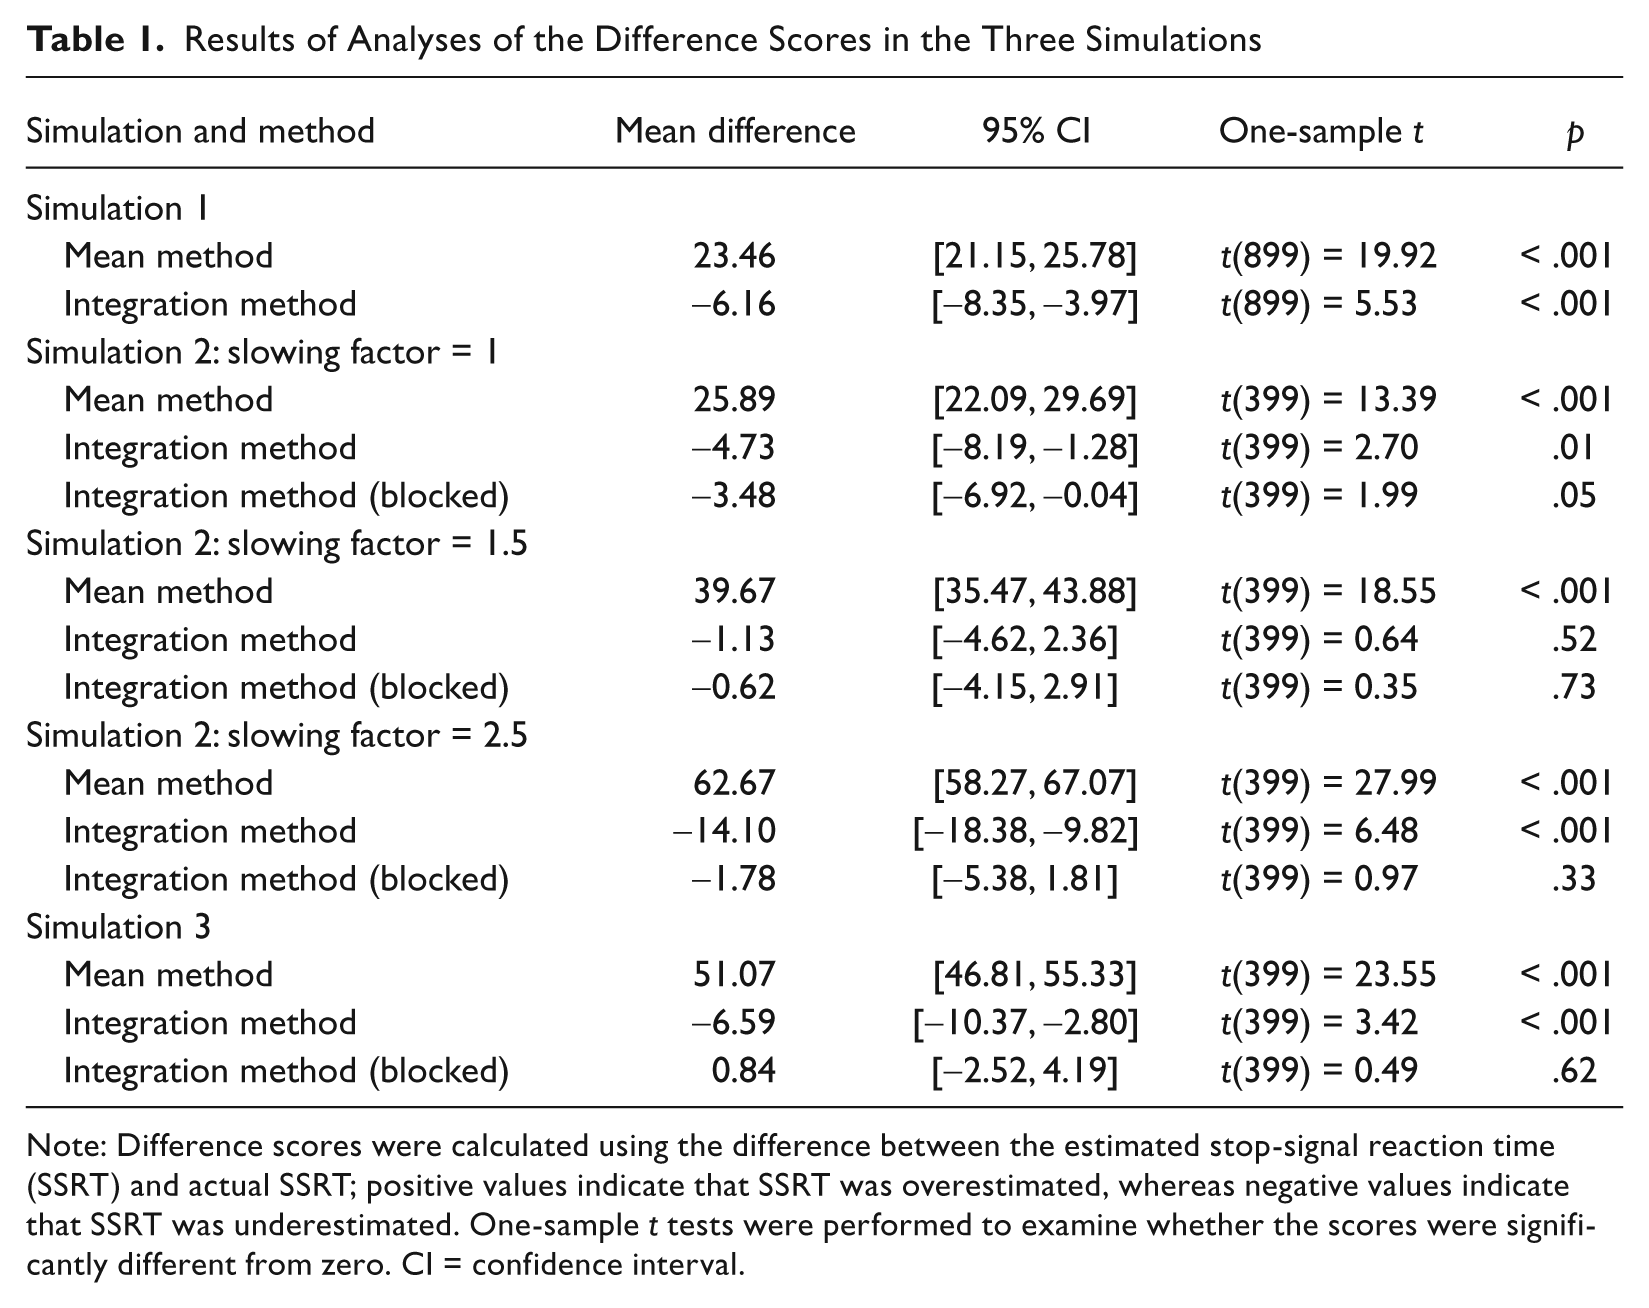
Note: Difference scores were calculated using the difference between the estimated stop-signal reaction time (SSRT) and actual SSRT; positive values indicate that SSRT was overestimated, whereas negative values indicate that SSRT was underestimated. One-sample t tests were performed to examine whether the scores were significantly different from zero. CI = confidence interval.
Results and Discussion
In the first set of simulations, the tracking procedure worked well and p(respond|signal) was close to .50 for all RT σ and RT τ combinations (see Table S1 in the Supplemental Material). When we collapsed across all values of RT σ and RT τ, we found that the mean method overestimated SSRT; by contrast, the integration method tended to slightly underestimate SSRT.
We used box plots of difference scores to examine the accuracy of SSRT estimates and to explore the estimation bias: a leftward shift of a box indicated underestimation; a rightward shift indicated overestimation. The plots (Fig. 2) demonstrated that when RT σ and RT τ were small, the difference between the estimated and actual SSRTs was small for most subjects. An increase in RT σ led to more noisy estimates but did not induce a systematic bias (i.e., the box widened but was still centered around zero). Changes in RT τ, which influenced the right tail (positive skew) of the RT distribution, had a more pronounced effect on SSRT estimations. A comparison of the bottom- and top-row box plots shows that when RT τ increased, estimates became noisier and, more important, became biased. For the mean method, the rightward shift of the top-row boxes indicates that SSRT was overestimated when RT τ increased. The integration method had a small tendency to underestimate SSRT when RT τ increased, but this effect was less pronounced. Thus, the integration method seemed more robust and less biased than did the mean method. These conclusions are supported by significant main effects of estimation method and RT τ, and by an interaction between estimation method and RT τ (see Table S2 in the Supplemental Material).
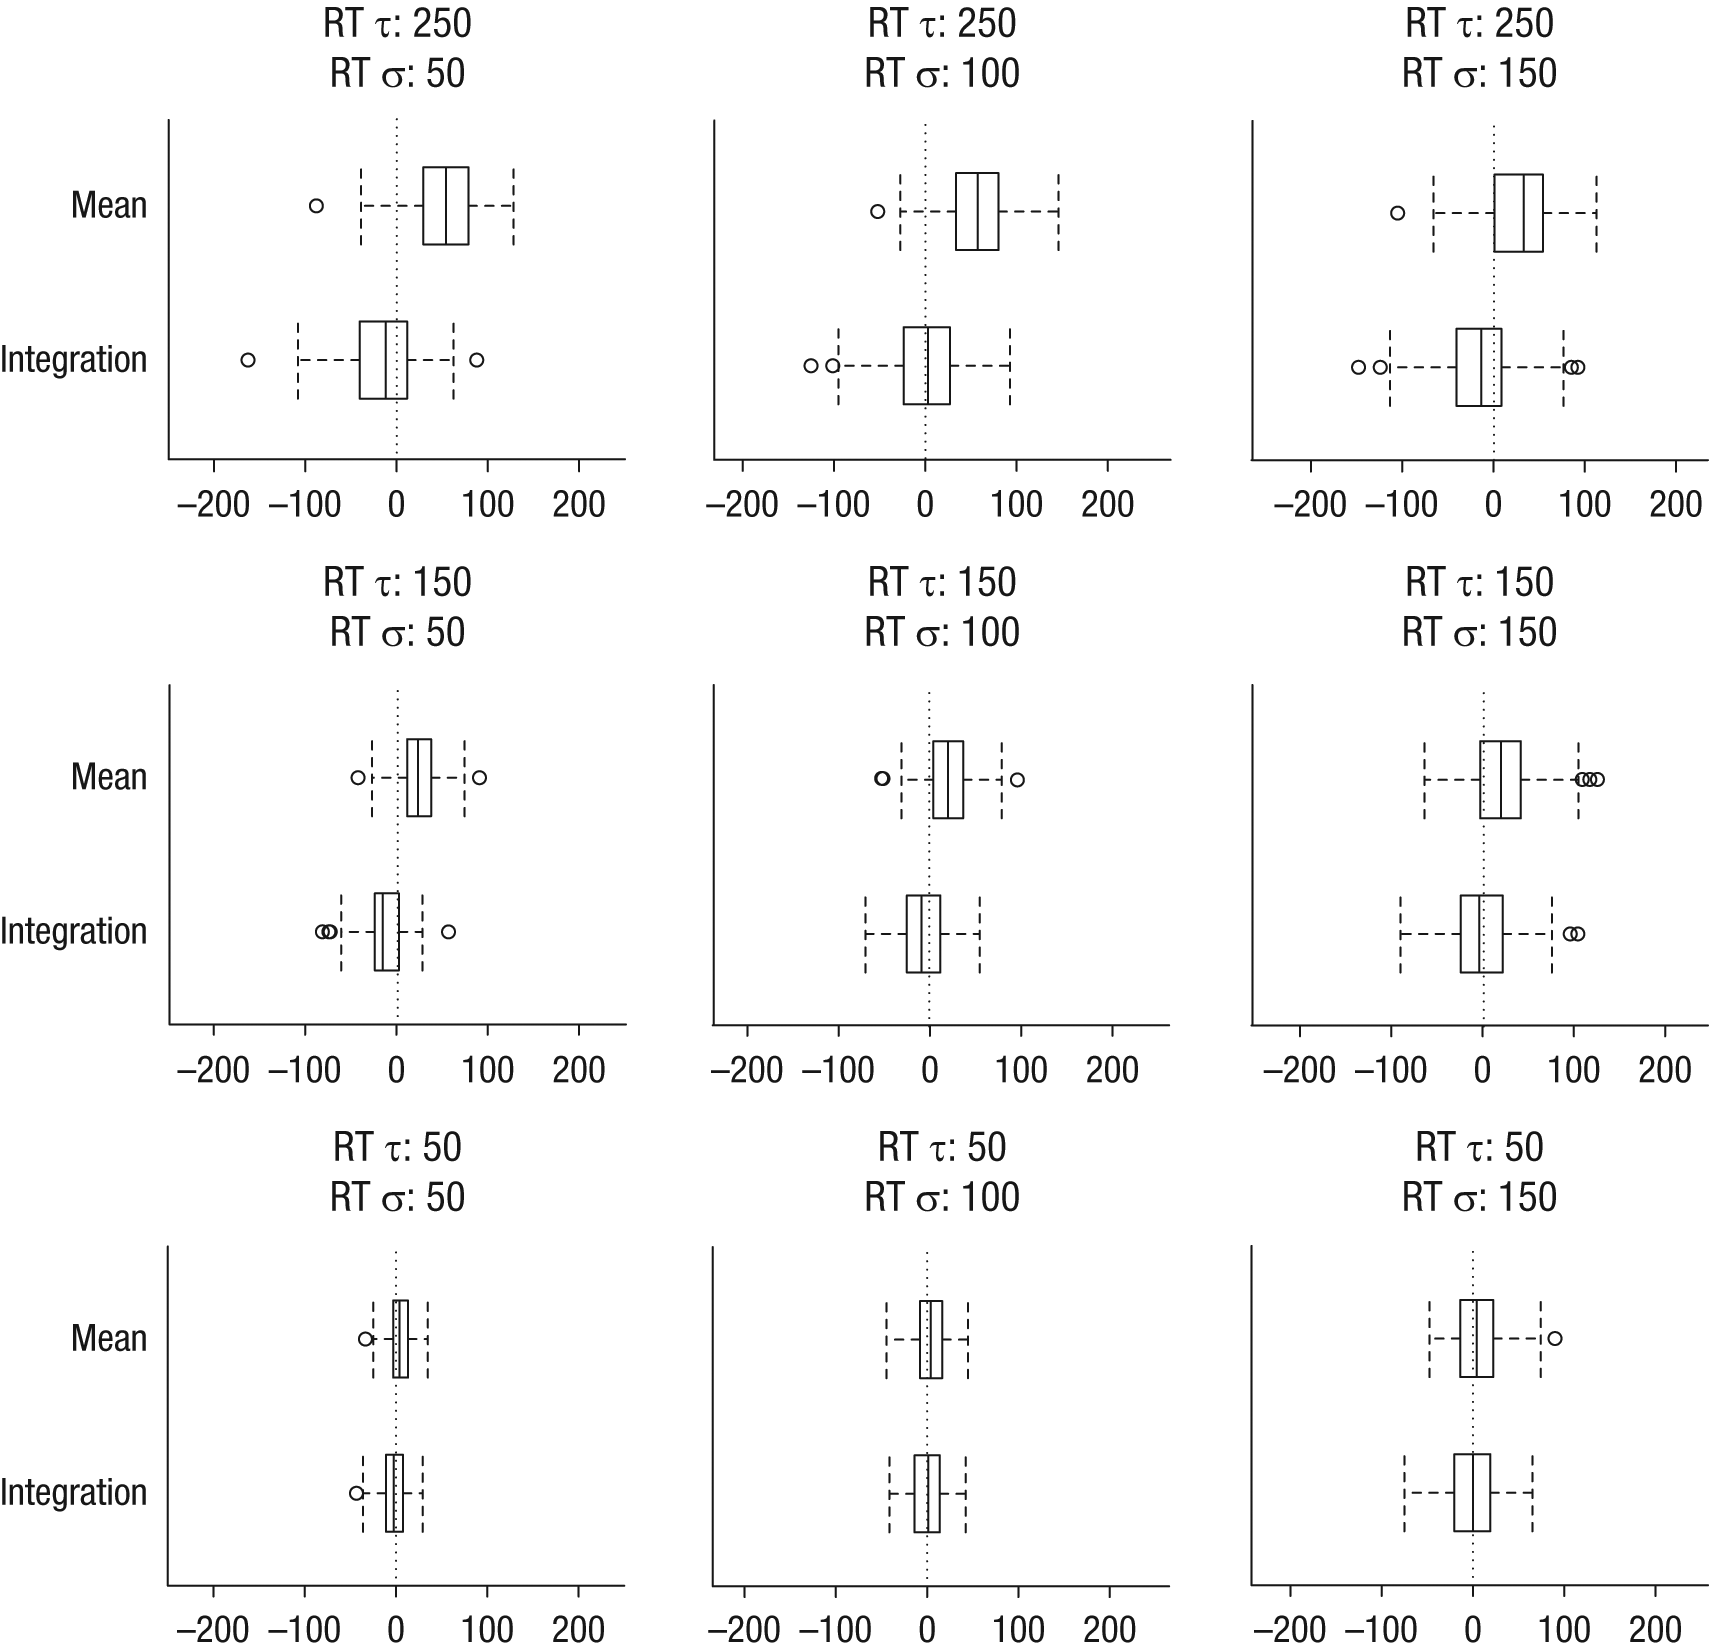
Box plots showing the difference between the estimated stop latency and the true stop latency in the first set of simulations. For each combination of reaction time (RT) σ and RT τ, the difference is shown for estimates based on the mean model and estimates based on the integration model. Negative values indicate that the estimated value is an underestimation of the true stop-signal reaction time (SSRT); positive values indicate that the estimated SSRT is longer than the actual stop latency. In each box, the solid lines show the medians, and the left and right edges mark the lowest and highest quartiles, respectively. The dashed lines with the whiskers at their respective end points capture the location of extreme values. Outliers exceeding the interquartile distance (from one end of the box to the other) by more than 1.5 are represented by circles.
The overestimation bias for large RT τs is problematic when SSRTs of different groups or conditions are compared. Often, RT distributions differ between groups or conditions. For example, a recent study showed that RT τ was approximately 251 ms for children with attention-deficit/hyperactivity disorder (ADHD) and 162 ms for children without ADHD (Tiftein et al., 2011). Such RT τ group differences could influence the SSRT estimates. We further tested this by randomly selecting 20 subjects in the condition in which RT σ was equal to 100 and RT τ was equal to150 and 20 subjects in the condition in which RT σ was equal to 100 and RT τ was equal to 250. As expected, there was no difference between the true stop latencies in both conditions (208 vs. 206, respectively), F(1, 38) = 0.11, p = .750. However, there was a significant 31-ms difference between the estimated SSRTs (RT τ = 150: 229 ms, RT τ = 250: 260 ms), F(1, 38) = 6.60, p = .014. Thus, when there are differences in RT τ, the mean method may lead to incorrect conclusions about group differences in SSRTs. Note that there was no difference between the SSRTs estimated using the integration method (RT τ = 150: 200 vs. RT τ = 250: 204), F(1, 38) = 0.07, p = .798.
In the second set of simulations, we tested how gradual slowing of RTs over trials influenced the SSRT estimates. Here, we used two variants of the integration method: (a) the variant that we used in the first set of simulations and that uses all trials to obtain a single SSRT estimate (henceforth, the experiment-wide integration method) and (b) a block-based integration method that estimated SSRT for each block separately (there were 60 trials per block, 15 of which were signal trials) and then took the average of these four estimates.
The box plots in Figure 3 show that the mean method overestimates SSRT when RT τ increases or when mean RT gradually increases over trials (see also Table 1). By contrast, the experiment-wide integration method tended to underestimate SSRT, especially when the slowing factor increased (see Fig. 3 and Table 1). The block-based integration method did not show such a consistent bias. These conclusions were supported by the ANOVAs reported in Table S4 of the Supplemental Material.
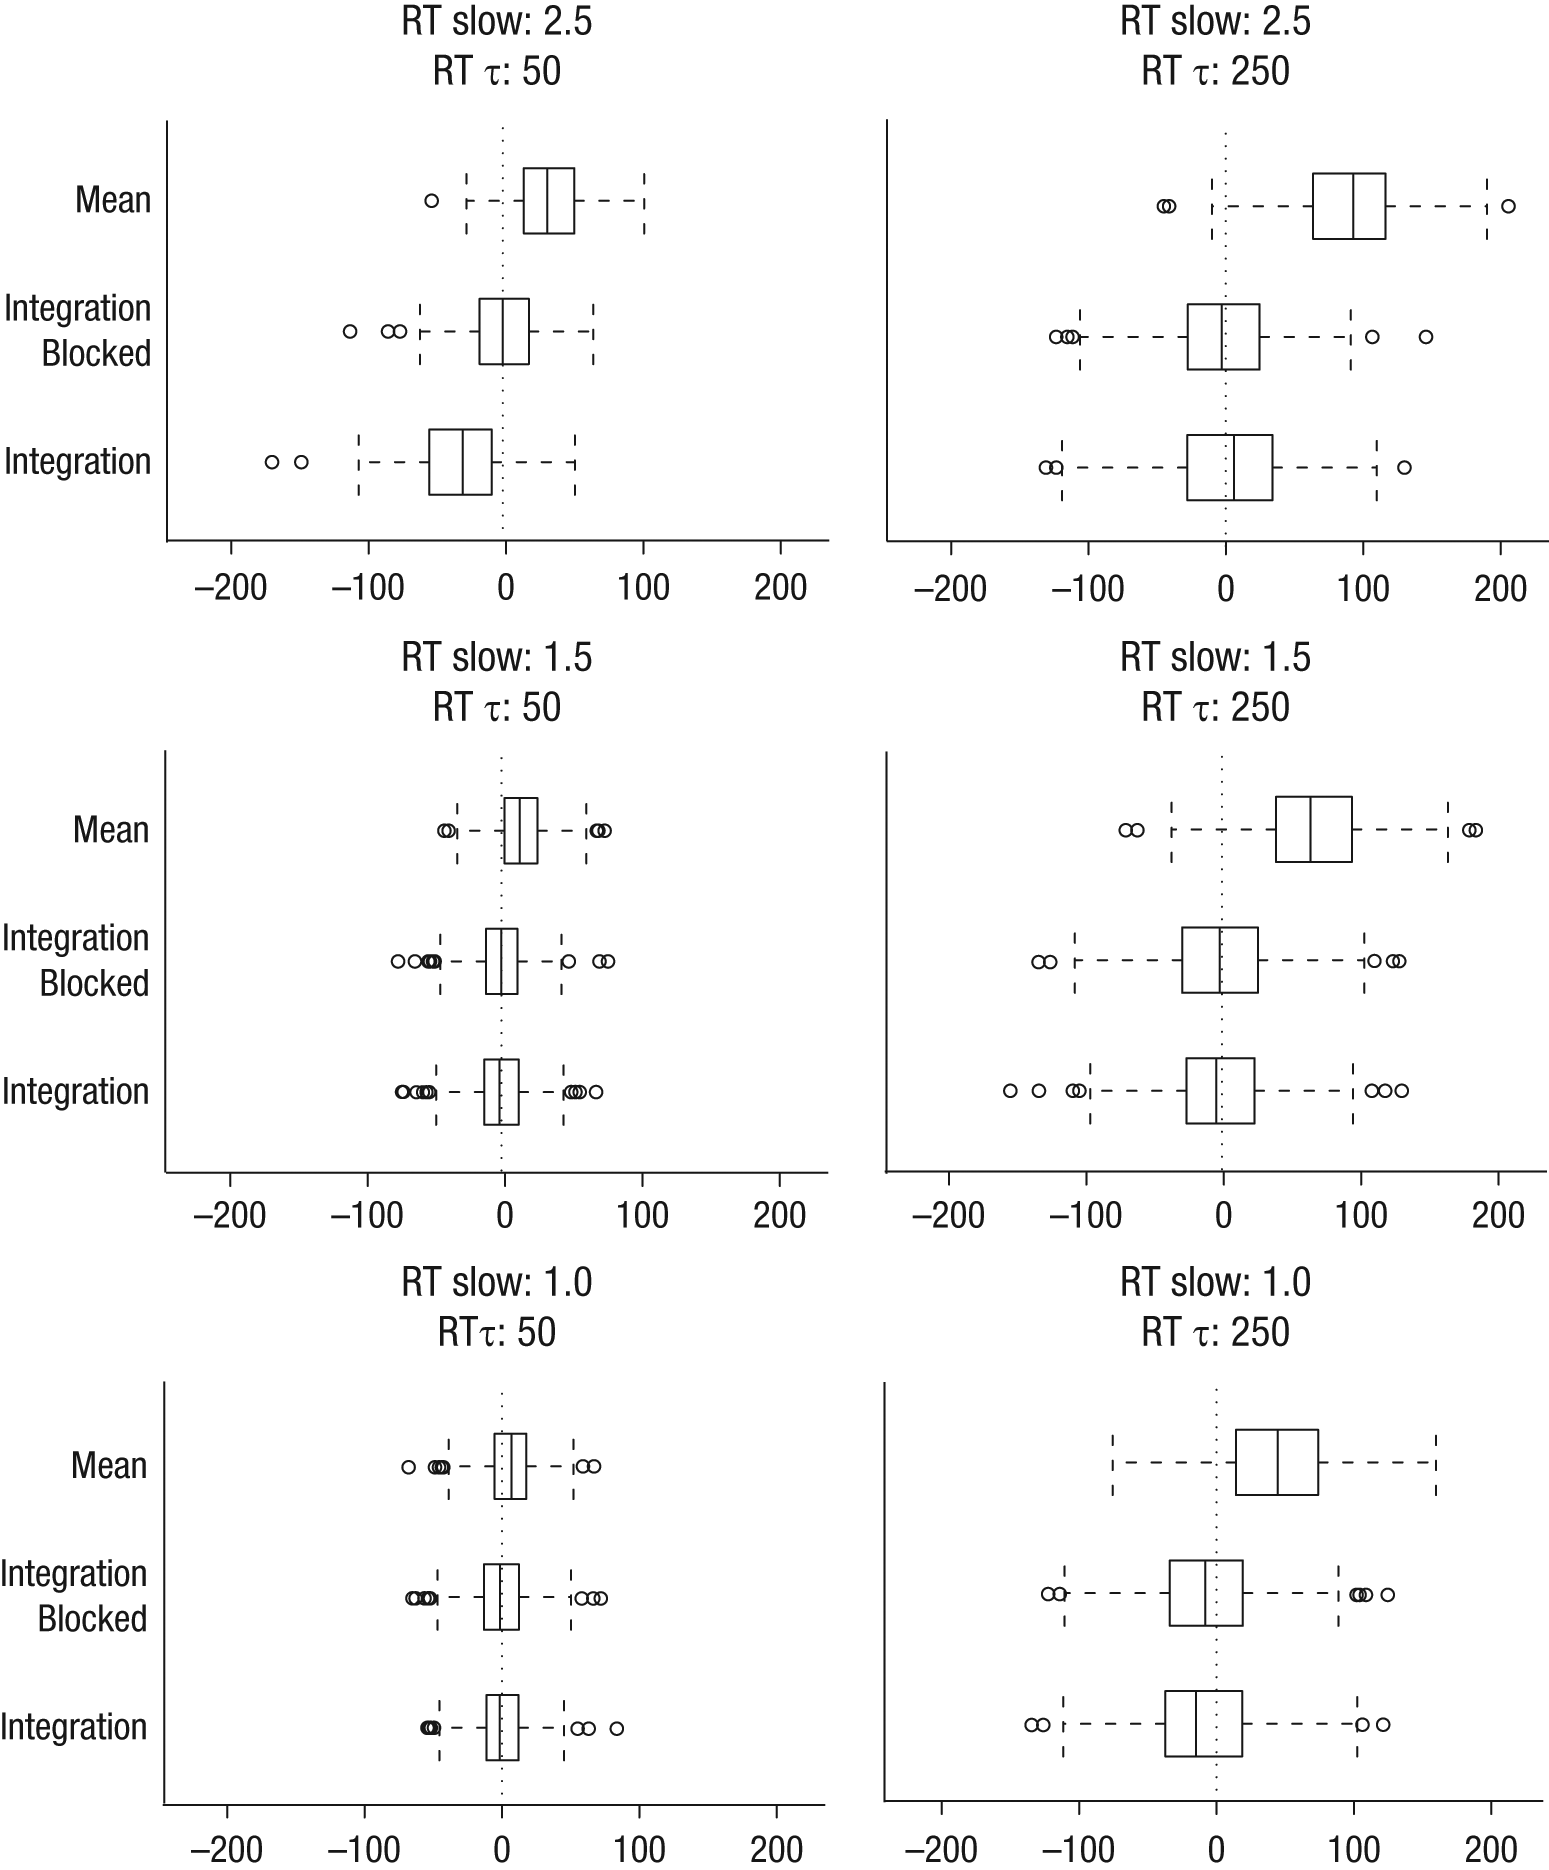
Box plots showing the difference between the estimated stop latency and the true stop latency in the second set of simulations. For each combination of reaction time (RT) τ and response slowing, estimates are shown for estimates based on the mean, integration blocked, and integration models. Negative values indicate that the estimated value is an underestimation of the true stop-signal reaction time (SSRT); positive values indicate that the estimated SSRT is longer than the actual stop latency. In each box, the solid lines show the medians, and the left and right edges mark the lowest and highest quartiles, respectively. The dashed lines with the whiskers at their respective end points capture the location of extreme values. Outliers exceeding the interquartile distance (from one end of the box to the other) by more than 1.5 are represented by circles.
We found that the mean method was strongly influenced by response slowing. One possible explanation for this finding is that the mean method assumes that the probability of responding approximates .50. However, we found that when the slowing factor increased, p(respond|signal) tended to decrease: When the slowing factor was large, the tracking procedure could not keep up with the changes in RT, so p(respond|signal) would be lower than .50 (see Table S3 in the Supplemental Material). Therefore, we reestimated SSRT using only those simulated subjects for which .40 < p(respond|signal) < .60; these values are based on the criterion discussed in Verbruggen, Logan, and Stevens (2008). We found that the RT τ and slowing biases were still present, even when only the central estimates were included (see Figs. S3 and S4 in the Supplemental Material).
The second set of simulations demonstrated that the mean method and experiment-wide integration method were influenced by response slowing. In a third set of simulations, we used a random slowing factor for each simulated subject to explore the correlation between slowing and the degree of over- or underestimation. Figure 4 shows that when RT τ was low and the experiment-wide integration method was used, the estimated SSRT correlated negatively with the degree of slowing. 5,6 Researchers have argued that such negative correlations could be due to proactive suppression of motor output or changes in task priorities (e.g., Jahfari, Stinear, Claffey, Verbruggen, & Aron, 2010; Leotti & Wager, 2010). Our simulations suggest that this negative correlation could be due to a bias in SSRT estimation. This bias was not observed when SSRT was estimated for each block separately (Fig. 4). As expected based on the previous sets of simulations, we found a positive correlation between response slowing and degree of overestimation for the mean method.
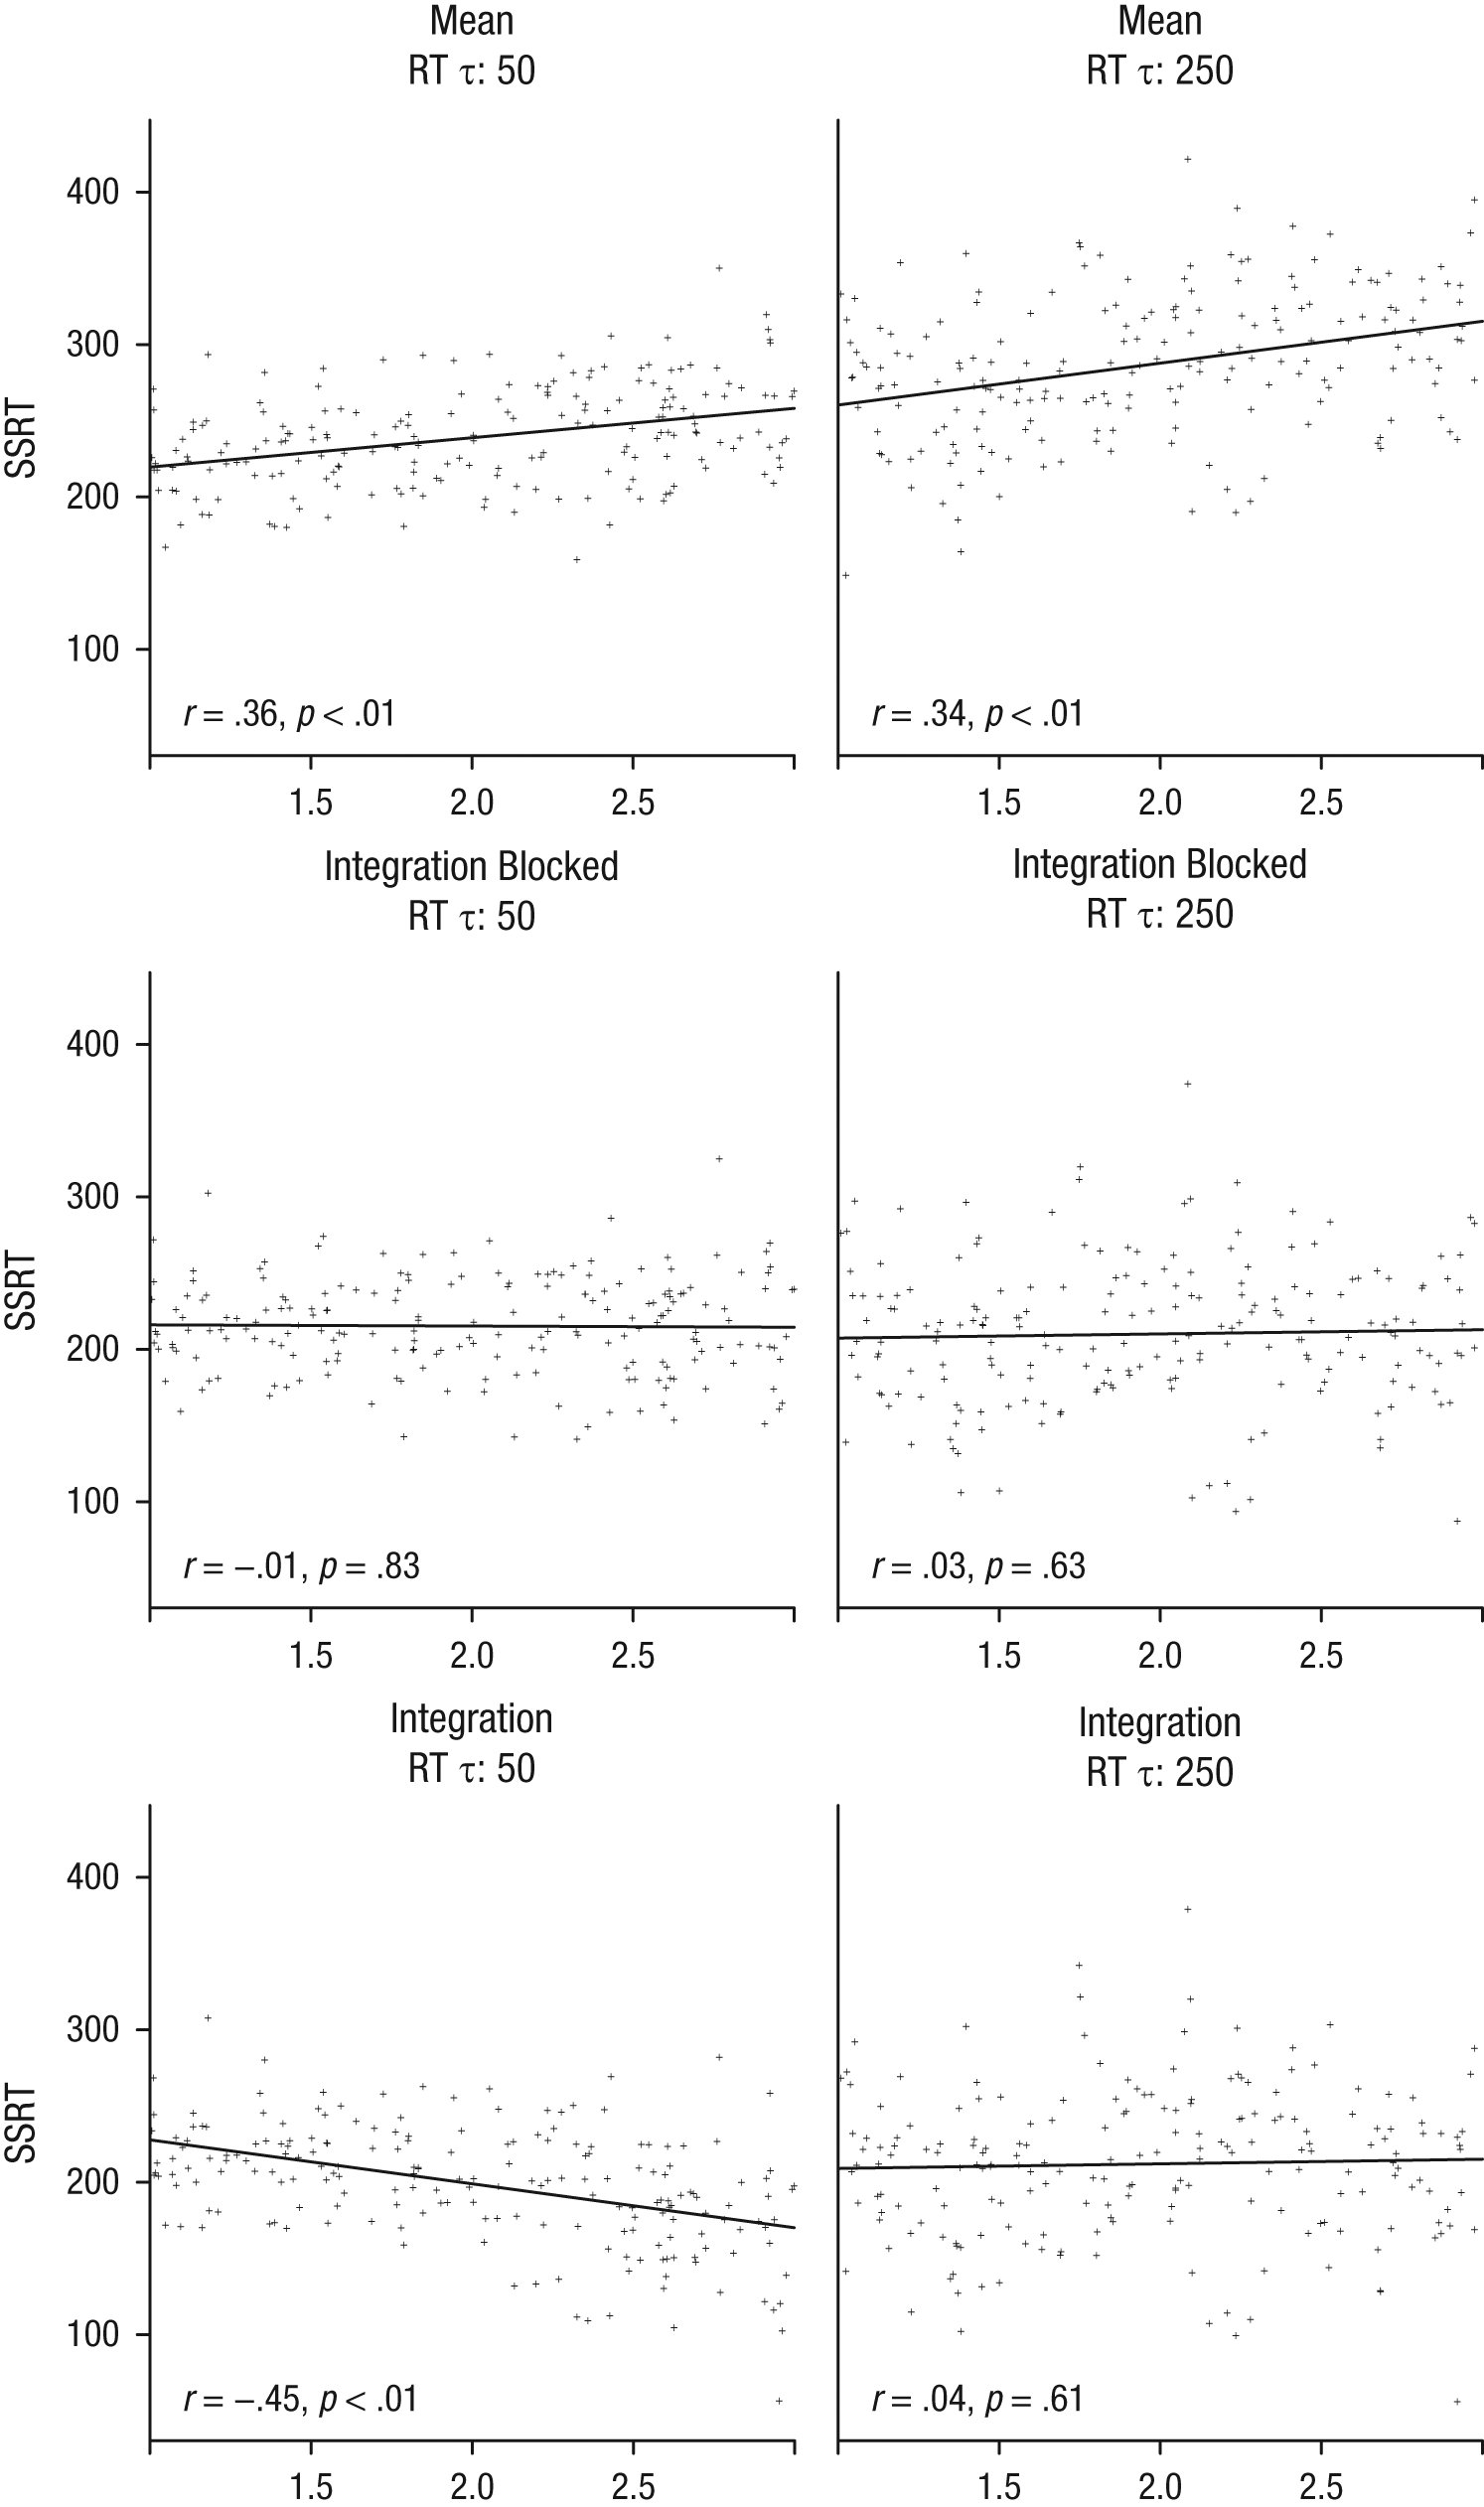
Scatter plots (with best-fitting regression lines) illustrating the correlation between the estimated stop-signal reaction time (SSRT) and the slowing factor. The graphs on the left illustrate correlations when reaction time (RT) τ was equal to 50 for estimates derived using the mean, integration blocked, and integration models. The graphs on the right illustrate correlations when RT τ was equal to 250 for estimates derived using the mean, integration blocked, and integration models.
Conclusions and Practical Guidelines
In the present study, we explored to what extent the skew of the RT distribution and gradual slowing of response latencies influences the mean and integration SSRT estimates. The mean method is often used because it is very easy: SSRT can be estimated simply by subtracting the mean SSD from the mean RT. However, our simulations show that this approach overestimates SSRT when the RT distribution is skewed to the right (i.e., when RT τ is large) or when RTs increase gradually over the course of the experiment. We demonstrated that individual or group differences in RT skew or response slowing could result in spurious inhibitory differences. Unfortunately, such RT differences may occur frequently. For example, studies have shown that SSRT is longer for children with ADHD than for children without ADHD (Lijffijt, Kenemans, Verbaten, & van Engeland, 2005; Oosterlaan & Sergeant, 1998; Schachar & Logan, 1990). However, a recent study estimated that τ was much higher in children with ADHD than in children without ADHD (Tiftein et al., 2011). Thus, the mean method will overestimate SSRT differences between ADHD children and children without ADHD and possibly produce spurious differences. Thus, we argue that the mean method should be abandoned because it is overly susceptible to the shape of the RT distribution.
The integration method fared better in the first set of simulations: There was a trend to underestimate SSRT slightly (approximately 4 ms), but there were no obvious group differences caused by changes in the shape of the RT distribution. This is consistent with a recent reliability analysis that used split-half reliability measures (Congdon et al., 2012). However, the second and third set of simulations showed that the small underestimation bias for the integration method became more pronounced when there is gradual slowing of RTs across blocks. This underestimation bias may explain the previously observed negative correlations between SSRT and response slowing (e.g., Jahfari et al., 2010; Leotti & Wager, 2010). Thus, we have demonstrated that the experiment-wide integration method results in reliable and unbiased estimates unless subjects slow their RT gradually.
The gradual slowing of RTs may be reduced by clear advance instructions (e.g., by stressing speed in the go task and explaining the staircase-tracking procedure) and by providing feedback after every trial (e.g., Ridderinkhof et al., 1999; Verbruggen et al., 2004) or after every block (e.g., Verbruggen, Logan, & Stevens, 2008). Thus, we argue that in standard stop tasks, researchers should provide clear instructions and implement feedback procedures to discourage excessive strategic slowing.
Even when feedback is provided, slowing may still be observed in certain subjects (e.g., Verbruggen et al., 2004; Verbruggen, Logan, et al., 2008). Researchers can exclude those subjects who slow their responses substantially; our simulations suggest that the underestimation bias appeared when the mean of the normal part of the distribution doubled. 7 However, this may result in the exclusion of a large number of subjects in some experiments, which could induce an exclusion bias. Also, researchers may be specifically interested in the correlation between slowing and SSRT. Recently, several authors have argued that strategy adjustments may be an important aspect of successful stop performance and, more generally, impulse control in everyday life (e.g., Aron, 2011; Bissett & Logan, 2011; Leotti & Wager, 2010; Verbruggen & Logan, 2009b). Feedback about slowing may not be provided when such strategic adjustments are examined. Furthermore, excluding subjects who slow substantially is not appropriate in such studies. The second and third set of simulations show that a block-based version of the integration method is less susceptible to bias from response slowing. When SSRT was estimated for each block separately (number of no-signal trials per block = 45; number of signal trials per block = 15) and then averaged, we obtained a reliable and unbiased SSRT even when there was substantial response slowing. Additional analyses (Figs. S5–S6 in the Supplemental Material) suggest that approximately 40 to 80 trials are required per block (25% of which are signal trials). If there are fewer trials, the estimates become too noisy; if there are more trials, the underestimation bias starts to emerge. We recommend that there are at least 50 signals in total. Thus, we feel that researchers should estimate SSRT for each block separately when strategic slowing is observed and subjects cannot be excluded.
It should be noted that slowing could be interpreted as a violation of the context independence and the stochastic independence assumptions of the race model (Logan & Cowan, 1984). Context independence (also referred to as signal independence) refers to the assumption that the RT distribution is the same for no-signal trials and stop-signal trials. Stochastic independence refers to the assumption that trial-by-trial variability in RT is unrelated to trial-by-trial variability in SSRT. Gradual slowing of RT does not necessarily violate these assumptions: Because subjects cannot predict whether a stop signal will occur in the standard version of a stop task, they are expected to slow down on all trials (including no-signal trials). In other words, the assumptions of the race model hold as long as slowing occurs to a similar degree on both signal and no-signal trials. Note also that the race model does not make assumptions about the shape of the finishing-time distributions. Thus, skew should not influence the SSRT estimations. The results of the first set of simulations demonstrated that this was the case for the integration method.
To conclude, our results demonstrate that the central SSRT estimates, which were previously thought to be most reliable, are strongly influenced by the right tail of the RT distribution and gradual slowing of RTs. Therefore, we recommend that researchers abandon the mean method to estimate SSRT and instead use the experiment-wide or block-based integration method to reliably estimate the latency of response inhibition.
Footnotes
Acknowledgements
Declaration of Conflicting Interests
The authors declared that they had no conflicts of interest with respect to their authorship or the publication of this article.
Funding
Verbruggen and Chambers are supported by a grant from the Economic and Social Research Council (ES/J00815X/1). Logan is supported by Grant BCS-0957074 from the National Science Foundation. Verbruggen is supported by a starting grant from the European Research Council (ERC) under the European Union’s Seventh Framework Programme (FP7/2007-2013)/ERC Grant Agreement No. 312445.
Notes
References
Supplementary Material
Please find the following supplemental material available below.
For Open Access articles published under a Creative Commons License, all supplemental material carries the same license as the article it is associated with.
For non-Open Access articles published, all supplemental material carries a non-exclusive license, and permission requests for re-use of supplemental material or any part of supplemental material shall be sent directly to the copyright owner as specified in the copyright notice associated with the article.