
Abstract
This research investigates a South Korean land value capture experience in peri-urban development. With the growing demand for urban land, rent gaps grew. A South Korean public development scheme, the Housing Site Development Promotion Act (HSDPA), enabled a public development agency to financialize and recoup the rent gaps by allowing for land acquisition at agricultural value. Hence, these peri-urban projects were self-funded in providing infrastructure at “no cost” to the government. A case study – of Yongin-Jukjeon on the periphery of Seoul – reveals that the rent gap between pre-development and post-development was over fivefold, and the public development agency achieved an internal rate of return of 262 per cent after paying for decent-quality infrastructure facilities by the national standard. Despite the size of this return, the rent gap was also shared among and reallocated to other key actors including original landowners, construction companies and end-users.
I. Introduction
Urban areas have accommodated more than half of the world’s population since the late 2000s, up from 30 per cent in 1950.(1) The trend is expected to accelerate in most of the world, with an additional 2.5 billion residents in urban areas by 2050.(2) Peri-urban expansion is one key spatial outcome. European cities experienced their own rapid expansion from the late nineteenth to the early twentieth centuries, causing serious problems such as pollution, poor sanitation, overcrowding and poverty.(3) In response to the influx of rural-to-urban migrants and the associated problems, various planning solutions were proposed. Among them, Ebenezer Howard’s garden city idea,(4) involving the creation of self-sufficient, low-density “new towns”, has been influential internationally.
Despite its significance, however, the way new urban development, more specifically new infrastructure, is funded in peri-urban areas has been largely under-researched. From the perspective of infrastructure funding, this research investigates South Korean experiences of greenfield development centred on land value capture (LVC). LVC refers to a public policy to recoup land value increases that are generated by public actions.(5) The case study discussed here is on the southern periphery of Seoul, where large-scale government-led greenfield development projects have been carried out since the 1980s to accommodate a rapidly growing population. Those projects in peri-urban areas were self-funded at no cost to the government through a value capture mechanism that recouped a portion of land value uplift generated from a combination of land use conversion, master planning, new infrastructure installation and population increase. Drawing on the case study, this paper articulates the institutional foundation, development processes and allocation of land value uplift in South Korean peri-urban greenfield development, providing evidence of the significant volume of LVC for new infrastructure.
In this paper a distinction is made between the terms “greenfield development” and “new towns”. While they could be applied to the same projects, South Korean urban policy has used the term “new town” in a particular way, referring to different generations of specific “new town” programmes and Seoul’s urban redevelopment scheme.(6) The case detailed here is not part of these programmes, although some of them were based on the same institutional foundation.
Section II reviews the dynamics of land value changes in greenfield residential development, outlining a theoretical framework for the research – the rent gap in peri-urban areas. Section III details data sources and provides an overview of the case study area – Yongin-Jukjeon on the peripheries of Seoul. Section IV presents land value curves, comparing pre- and post-development at a regional scale. Section V analyses the allocation of land value uplift at project scale, with an emphasis on infrastructure funding by a public development agency. Section VI concludes the paper.
II. The dynamics of land value in greenfield development
The most important figure in the discourse on LVC is Henry George, who advocated a single tax on unimproved land value.(7) In practice, both recurrent land-based taxes and event-based levies (usually one-off payments when transactions or development approvals are made such as stamp duty and impact fees) are widely employed approaches to recoup betterments and/or planning gains.(8) Recurrent land-based taxes, including land tax and property tax (or rates), have been significant fiscal sources for local governments. However, given the substantial and sudden effect of greenfield development on land values, this research focuses on the event-based approach for value capture.
There are two major rationales for LVC. First, betterments are generated not by private actions but by public decisions on land use (de-)regulation.(9) When landowners monopolize these betterments, there is a transfer of benefits from the public to a select few, causing equity problems. Fainstein(10) has hence asserted that LVC is an important instrument for urban justice, enhancing the “right to the city”.(11) Second, some LVC levies are designed to fund infrastructure based on a user-pays principle and/or impact mitigation principles such as impact fees and developer exactions.(12) These levies are based on residual land values in developers’ feasibility analyses.(13)
a. A conceptual framework: rent gap and greenfield development
Smith(14) proposed a theory of gentrification, arguing it is more likely to occur in areas with a larger rent gap “between the potential ground rent level and the actual ground rent capitalised under the present land use”.(15) This idea has been widely discussed to elaborate on redevelopment, displacement and transformation in inner-city neighbourhoods.(16) While the rent gap theory has shed light primarily on deteriorated inner-city areas,(17) a rent gap is also generated in peri-urban areas, reinforced by land use regulations, as manifested in the implementation of urban growth boundaries (UGBs).(18) Restrictions on new urban development outside the UGB pushes up demand for land within that boundary, while controlling land value at agricultural value outside.(19) Hence, the deregulation of the UGBs attracts rent-seeking behaviour on the part of those desiring planning gains.(20) This effect is also felt in the land use conversion of formerly agricultural peri-urban areas by zoning regulations on a regional scale (Figure 1). Actual capitalized ground rent is based on the present use – agriculture. However, potential ground rent, based on such uses as housing and retail serviced by new infrastructure, reaches the level of that in surrounding developed areas, or even higher, depending on the volume of capital investment, the type of new zoning and externalities. Cities experiencing rapid population increase see a growing rent gap between urban zones and agricultural zones when land use regulations such as UGBs are in place.(21) The total aggregate volume of the rent gap in areas newly zoned as urban land equates to the volume of the planning gains as shaded in Figure 1.(22)
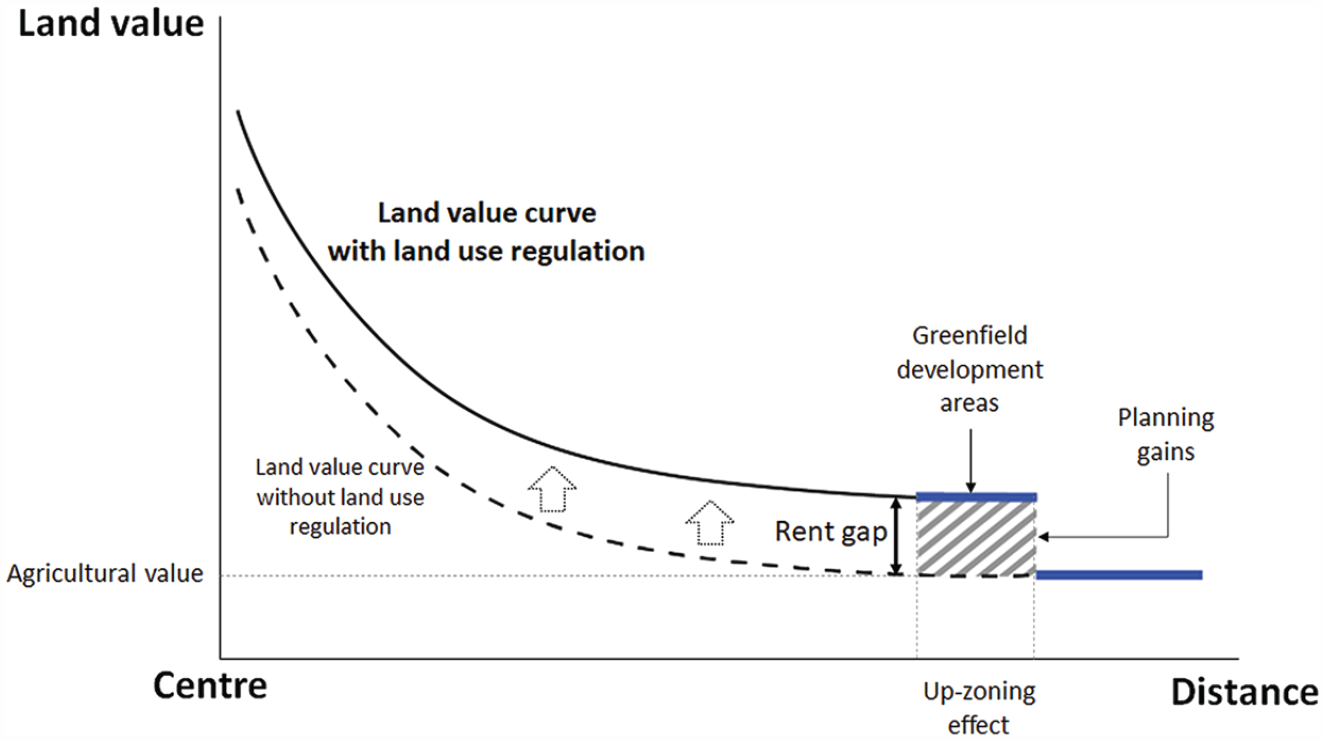
Land value curves and rent gap in peri-urban areas
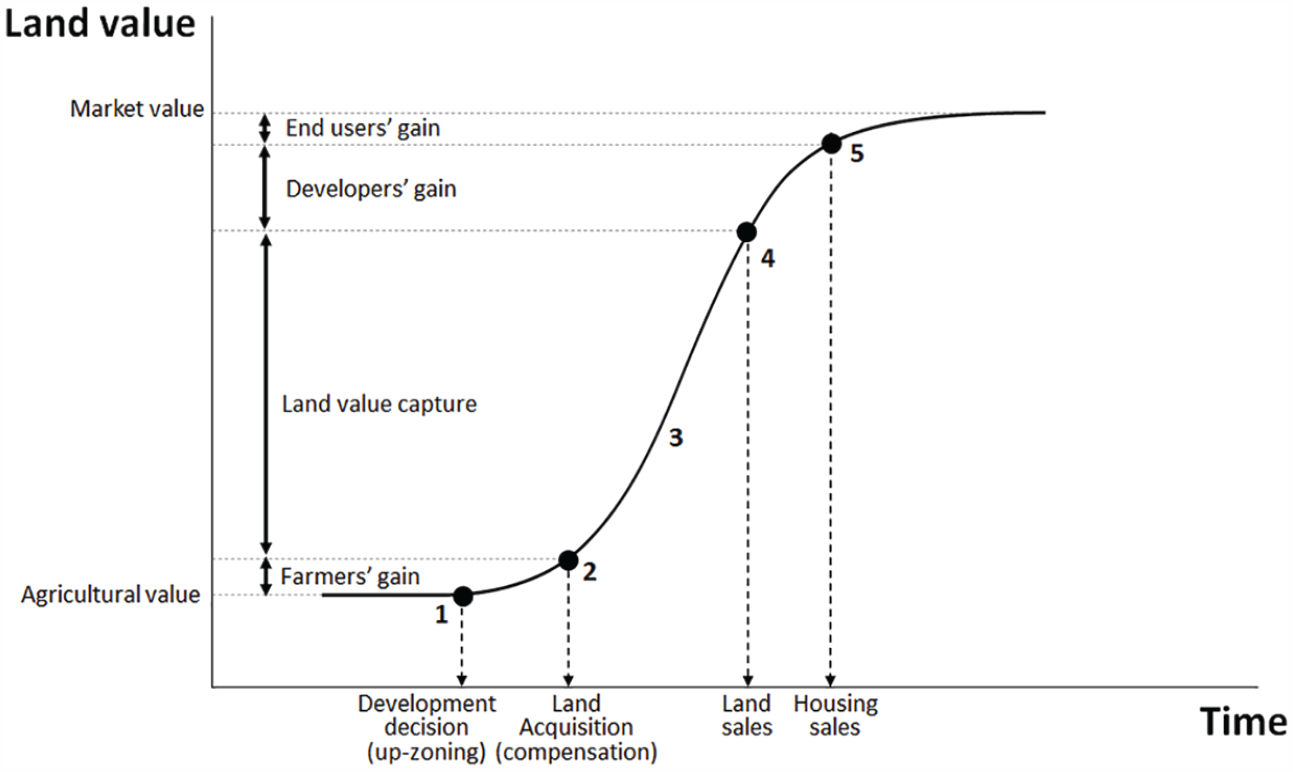
With a larger rent gap, “land becomes gold” as Gururani (2018) noted,(23) and the development site turns into a rent-seeking battlefield. In the South Korean context, there are four key actors in the allocation of planning gains at the scale of the development site (Figure 2): (1) original landowners (or landed farmers); (2) the government body undertaking up-zoning and land acquisition; (3) developers (or construction companies); and (4) end-users/buyers of developed properties. The portion of planning gains taken by these players depends on the policy setting.
Distribution of planning gains in greenfield development
Despite significant variations in different countries, greenfield developments, in general, go through five processes: (1) a development decision; (2) land acquisition; (3) infrastructure installation; (4) land sales; and (5) property sales. Master planning and infrastructure installation should go hand in hand in these processes. This case study is based on the scenario, under a freehold title, where a government agency leads land development while private developers carry out housing construction for sale. South Korean greenfield developments follow these five steps. When the government agency undertakes land acquisition for greenfield development projects, the gap between the initial cost and the sales price of new urban land defines the volume of LVC that can fund (a portion of) infrastructure costs.
1. Development decision
Along with the development decision, master planning and the formal conversion of land use via up-zoning are conducted. Up-zoning generates lump-sum planning gains in high-demand areas. Often, a simple development announcement results in land value changes.(24) However, this kind of land value uplift is not always guaranteed, for instance in sites with low rent gaps.
2. Land acquisition and compensation
If land is acquired at agricultural value with no future development prospects, the government secures an advantageous position for LVC. However, this approach frequently angers property-owning farmers. Their contribution to land value uplift is minimal, but they may not be able to afford new properties in the area. A low level of compensation may thus lead to forced displacement.(25) In fact, the farmers are the financial victims of land use regulations when the value of their land is kept low by government actions. Lobbying and protests for higher compensation rates are typical reactions.(26)
3. Land development and infrastructure installation
With amalgamated landownership, the government can proceed confidently with a development project and provide infrastructure and civil engineering works, creating betterments. Infrastructure installation before land acquisition results in higher compensation costs for the land.
4. Land sales
The transfer of land at market value maximizes the volume of LVC. However, there are uncertainties about the new market value. Private developers bear development risks that depend on macroeconomic and demographic conditions. Hence, they strive to acquire land at a lower price than the market value. Also, private developers are not the only actors at this stage. Land sales also take place between government departments, often at subsidized prices.
5. Construction and property sales
Developers carry out construction on the land they purchased and sell their properties to end-users (generally households). If property sales are regulated, for instance with a price ceiling, end-users (or households) will benefit from the vested subsidy.
With this case study of peripheral development in Seoul, this paper addresses three research questions concerning the rent gap (Figure 1) and land value escalation (Figure 2): (1) How was the rent gap generated on a regional scale? (2) To what extent can LVC fund infrastructure in greenfield development? And (3) how has land value uplift been allocated among stakeholders on the site scale? By exploring this experience, this research provides evidence that the volume of land value uplift can be significant enough to cover the cost of all required local-scale infrastructure in peri-urban greenfield development projects in Korea.
b. Garden cities and international experience
Ebenezer Howard’s seminal 1902 book Garden Cities of To-morrow was an outstanding milestone in planning history and provides an important point of reference for the present study. His solutions in the face of worsening urban conditions attracted attention and provided momentum for prototypes of British new towns after the Second World War. His second garden city, Welwyn Garden City, commenced in 1920, became one of the first generation of new towns to acknowledge his legacy.(27) Garden cities and British new towns were intended to curb over-population in large cities by diverting population flow into peri-urban locations. The new town idea spread internationally, as shown by Forsyth,(28) who identified 533 new towns constructed in the twentieth century. Planning professionals usually stress the planning and design principles of garden cities, including peri-urban locations distant from large cities but connected by rail, ample green space, surrounding greenbelts, self-sufficiency with (manufacturing) jobs and low residential density.(29) However, land issues have not been a primary focus in most of the relevant literature, although shared land ownership was fundamental to the initial garden city concept. In fact, Howard dedicated four chapters to explaining the garden city financial model, detailing revenue and expenditure. Influenced by Henry George,(30) he suggested that collective landownership offered “the average citizen the opportunity of becoming a landlord and of appropriating the land values”.(31) He proposed sharing land value escalation through shared landownership, with a semi-municipal enterprise managing the revenue and expenditures for the garden city and its residents.(32) By purchasing land at agricultural value, the enterprise could raise revenue through sales and leases to new residents, who would contribute collectively to the escalation of land value. This revenue would be spent on infrastructure that could sustain and further escalate land values. In this regard, the garden city was a self-financing urban development model. When Howard’s ideas were institutionalized, two legal bases played a pivotal role.(33) First, the New Towns Act 1946 was enacted to form public development corporations for new town development and management.(34) Second, the Town and Country Planning Act 1947 allowed compulsory land acquisition to be carried out by these development corporations at agricultural value without concern for the effect of land use conversion and new infrastructure.(35) Although the public corporation approach was abolished along with the neoliberal “a right to buy” initiative in the 1980s,(36) these two legal institutions did seem to establish a financially sound structure for greenfield development, enabling the inclusion of social housing in new towns. In the 1960s, the new town programme encouraged a social housing goal of 50 per cent(37) and on average social housing accounted for 47 per cent of the total UK new town housing stock in the 1980s.(38) Peiser and Chang,(39) however, questioned the financial feasibility of the UK’s largest new town project, Milton Keynes, finding a financial loss caused primarily by the central government’s fixed interest rate and the sales of assets during an economic downturn.
Planning gains and betterments are universally observed in peri-urban development involving land use conversion, the installation of new urban infrastructure and/or up-zoning.(40) In planning and development practices, (a portion of) these gains are recouped for public purposes. Social housing and local infrastructure are the two marked items funded by event-based value capture. In the UK, a portion of planning gains is captured by charging for planning permits, as detailed in Section 106 of the Town and Country Planning Act 1990.(41) In Australia, developers/landowners are required to make one-off payments to fund infrastructure, as exemplified in Victoria’s Infrastructure Contributions Plan and the Growth Area Infrastructure Contribution.(42) In the United States, large-scale up-zoning developments involve a negotiation process for value capture.(43) In India, peripheral land becomes “gold” when new development takes place, although institutions for LVC are limited.(44) In China, the financialization of land has been used to fund urban development and public services.(45) In Vietnam, the transfer of land use rights requires developers to contribute to infrastructure, called “land for infrastructure”.(46) In Singapore, its flagship Land Acquisition Act – a legal foundation for land acquisition at values without future development prospects – was implemented for the supply of public housing and the installation of infrastructure.(47)
c. The institutional context of South Korea
South Korea’s authoritarian government has followed a developmental state model(48) that has affected the way urban development has proceeded.(49) Since the beginning of rapid urbanization, the government has taken the lead in supplying urban land and providing infrastructure.(50) Post-war reconstruction relied on the land readjustment (LR) scheme, with local government acting as a planning and development agency. LR was implemented extensively, transforming un-serviced land into serviced urban land.(51) Original farmers and landowners could continue their ownership, but were required to surrender 30–40 per cent of their net land.(52) The LR scheme dominated peri-urban land use conversion in the 1960s and 1970s. Some projects were undertaken at a large scale, up to 26 square kilometres (km2), as seen in Yeongdong.(53) A more powerful scheme, based on eminent domain or compulsory land acquisition, was introduced in the 1980s to accelerate the supply of urban land for housing.(54) The Korean approach was influenced by the British model establishing development corporations and enabling land acquisition at an agricultural value.(55) These two distinctive features were enabled in Korea by the legal foundation of the 1980 Housing Site Development Promotion Act (HSDPA), which, first of all, allowed compulsory land acquisition based on agricultural value. The Land Acquisition Act, further, prescribed that compensation for land acquisition should be made without considering the possible future land value uplift that would be generated by the proposed urban development project. This was confirmed by the constitutional court in 1990.(56)
The HSDPA also stipulated that only government or government agencies – specifically the state, local government, the Korea Land Development Corporation (LDC) and the Korea National Housing Corporation (KNHC) – could carry out these residential development projects. The latter two government agencies merged to establish a gigantic public planning and development agency, the Land and Housing Corporation (LH), in 2009.(57) Despite multiple revisions, the HSDPA has, to date, maintained this approach, influencing the overall pattern of Korean land development. Other land development acts, such as the Industrial Site and Development Act in 1990, which guides the development of industrial parks, have imitated the HSDPA’s approaches. The HSDPA was employed to construct first-generation (1989–1992) and second-generation (2001–2016) new towns,(58) some of which were built on long-established greenbelt areas by carrying out land use conversion (or up-zoning).(59)
The literature on Korean urban development has focused on spatial structure including work on suburbanization,(60) leap-frog development causing long-distance commuting,(61) mechanisms of housing supply(62) and land development procedures.(63) However, little attention has been paid to how infrastructure has been funded in greenfield development processes.
III. Research methods
This section first provides an overview of housing development implemented via the focal HSDPA scheme as context for the case study selection. Then, it details data sources and analysis methods.
a. Geographical and contextual backgrounds
The HSDPA has been important in two ways: (1) the volume of its housing production and (2) the spatial outcomes. First, the scale of the greenfield urban development via the HSDPA is significant, having supplied 3.3 million dwellings nationwide by 2019 (see Table 1), accommodating 10.6 million people nationwide, or 21 per cent of the Korean population. Gyeonggi Province, a surrounding region of Seoul, has been especially noticeable in terms of the scale of housing production. In this province alone, the HSDPA provided homes for 4 million residents (or 30 per cent of the total population) and in Seoul, for 1.2 million residents (or 12 per cent of the total population). More specifically, 44 per cent of the increased population in Gyeonggi Province between 1983 and 2019 was accommodated by these HSDPA homes, signifying the role of this scheme in housing production.(64) The total land area developed under the HSDPA reached 450 km2 in Korea and 195 km2 in Gyeonggi Province, formalizing the development sites and eliminating space for informal settlements. The average project area in Gyeonggi Province was 1.3 km2.
A summary of development projects based on the Housing Site Development Promotion Act, 1983–2019
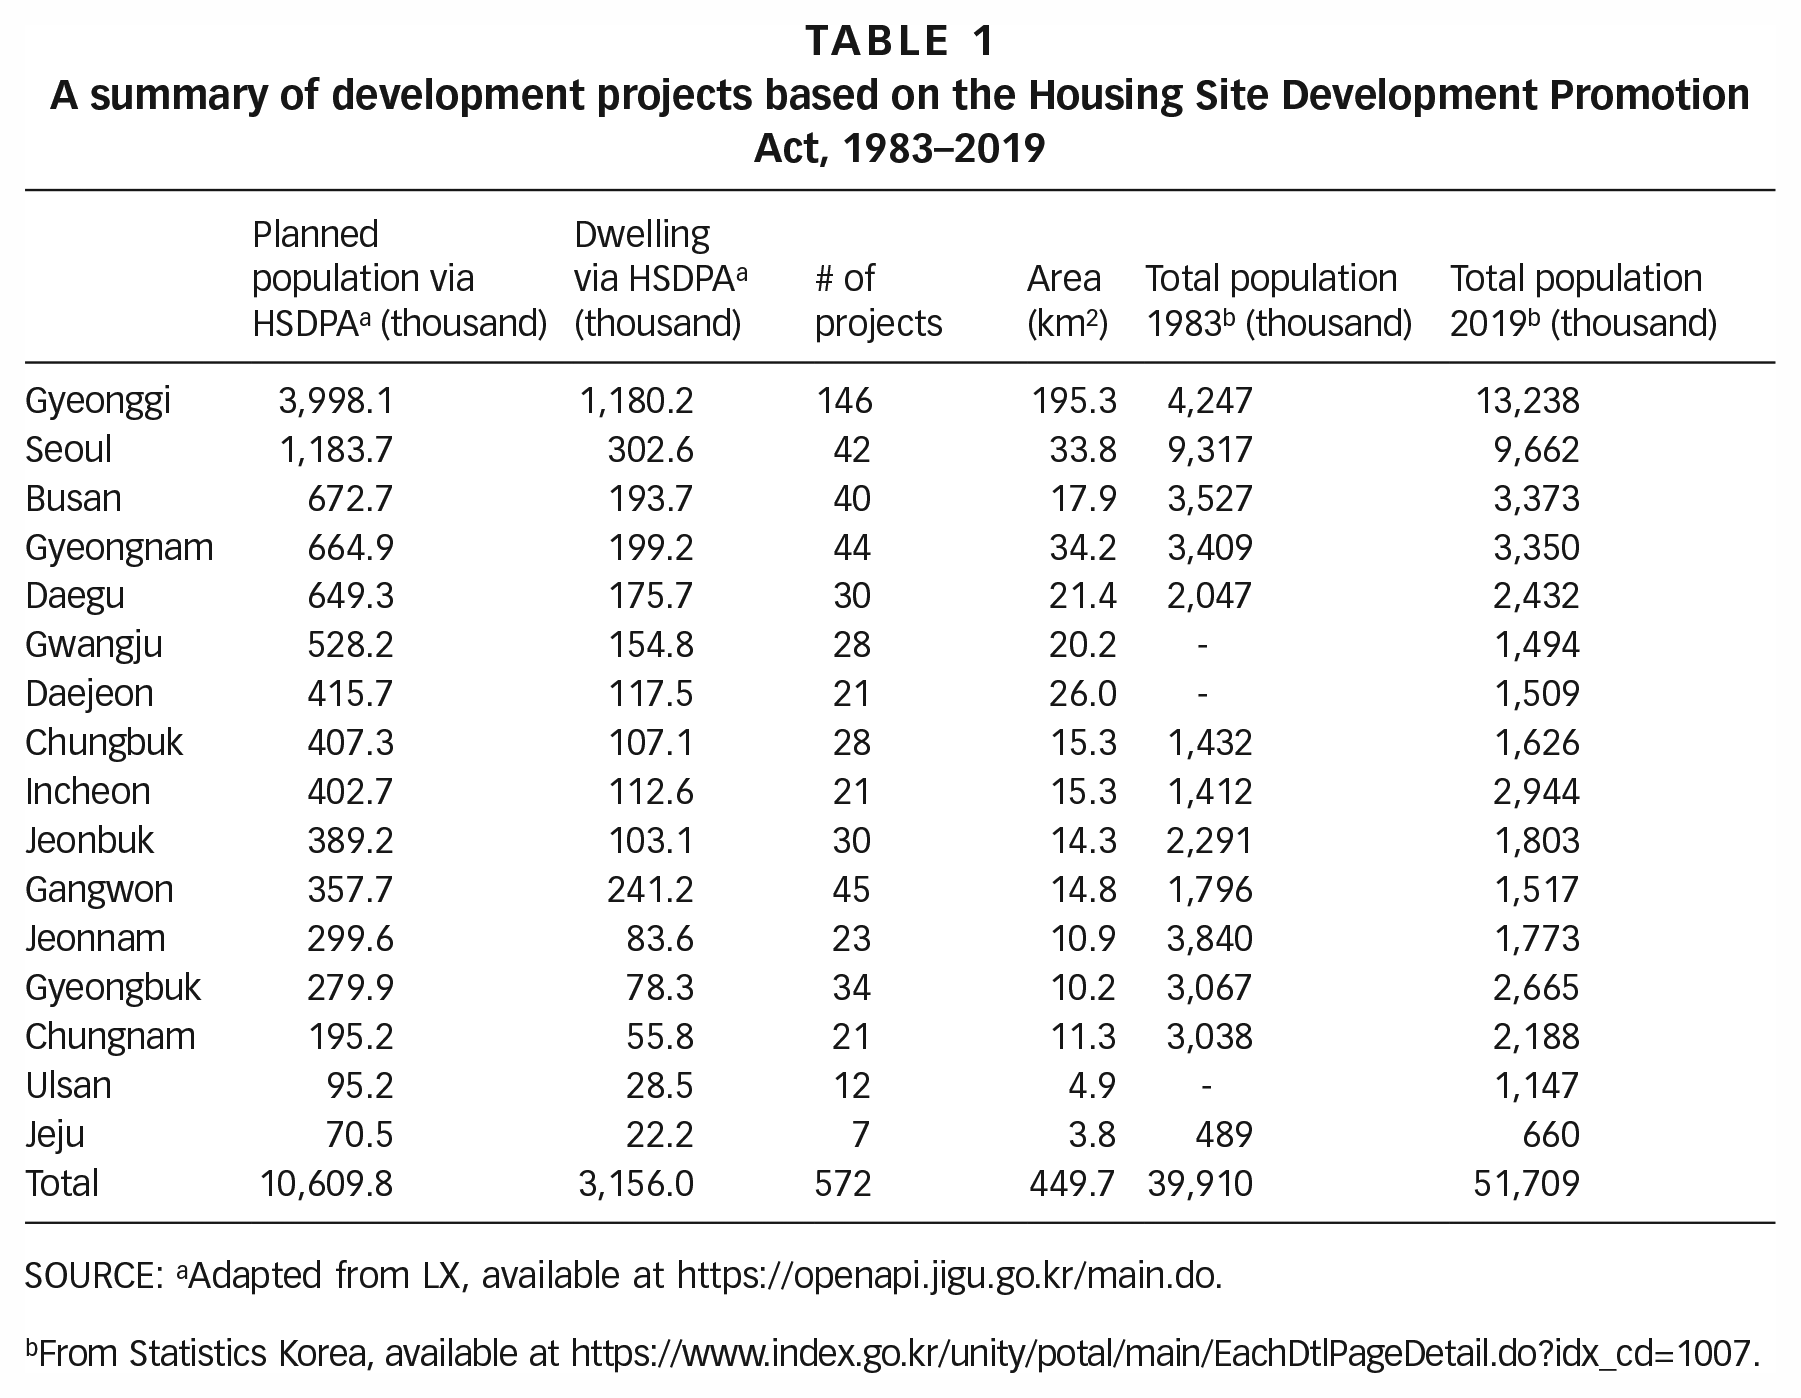
SOURCE: aAdapted from LX, available at https://openapi.jigu.go.kr/main.do.
From Statistics Korea, available at https://www.index.go.kr/unity/potal/main/EachDtlPageDetail.do?idx_cd=1007.
Second, with regard to spatial outcomes, the HSDPA has created high-density residential environments across the country. Average population density within project sites in 2019 was 25,000 persons/km2 country-wide, with Seoul at 35,000 persons/km2 and Gyeonggi Province at 20,500 persons/km2. By contrast, residential density in existing urban areas was 16,000 persons/km2 in Seoul and 1,300 persons/km2 in Gyeonggi Province in 2019.(65) Density produced by the HSDPA was also high by international standards – compared, for instance, with 8,400 persons/km2 in Singapore and 7,100 persons/km2 in Hong Kong. High population density meant intensive land use in the new development areas, mitigating the pressure of land use conversion from agricultural land elsewhere. However, homogeneously designed high-rise apartments have prevailed, without strong local character. The rapid pace of the transformation to high-rise apartments in peri-urban locations, accelerated by the HSDPA, has led to population densities in peri-urban areas higher than those in inner-city areas – a distinctive density gradient at the city–region scale. One of the problems in this mass housing production has been the lack of sufficient employment opportunities – a job–housing spatial mismatch,(66) requiring long-distance commutes (although this is not a focus of this research).
b. The selection of a case study
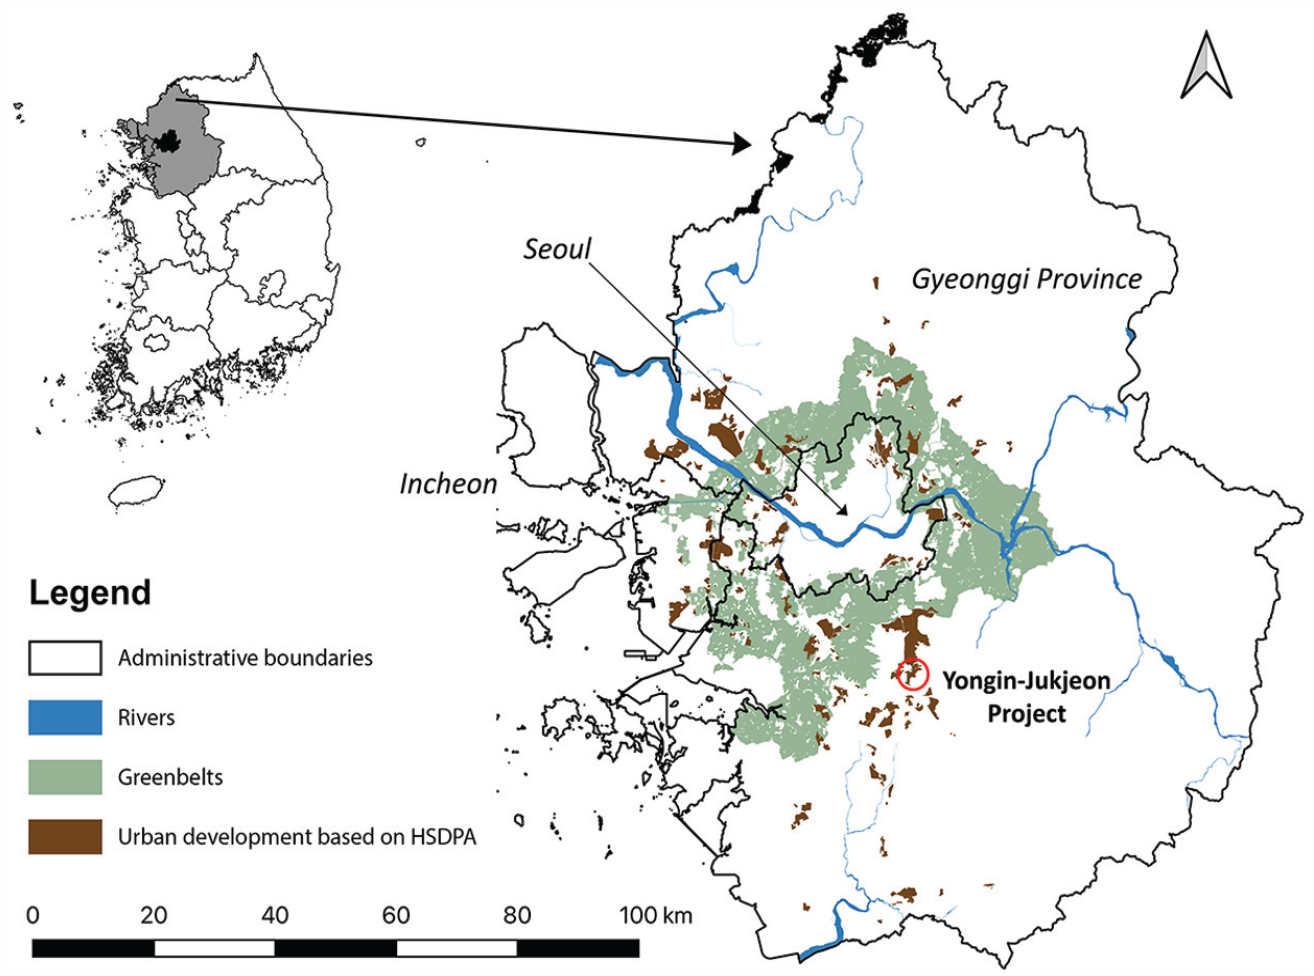
Figure 3 shows the locations of HSDPA greenfield developments within Seoul’s Capital Region including Seoul, Incheon and Gyeonggi Province. These development sites are located in peripheral Seoul and outside (or within former) greenbelts that have been in place since the 1970s.(67) While residential developments have appeared in all directions, a southern development corridor is the most outstanding. North Korea lies to the north of Seoul, the Yellow Sea to the west and reserves for water protection to the east. The case study site, Yongin-Jukjeon, was selected because:
It is located along the southern corridor.
Unlike earlier developments before 1997, suitable data were available (see Section IIIc).
It was carried out in a period with no economic recession (after the Asian Financial Crisis 1997/8 and before the Global Financial Crisis in 2007/8) and, therefore, the analysis is not skewed by unusual economic circumstances.
Project details, such as compensation and land sales, are publicly available.(68)
This project was carried out by the LDC between 1999 and 2006. The LDC had released The White Book of Residential Land Development Projects, which detailed its development projects from 1976 up to 2009, the point at which it was merged with a government agency for public housing, the KNHC, to form the largest public development agency in South Korea, LH. The total asset value of LH (KRW 170 trillion or approximately US$ 170 billion) was as large as the largest Korean conglomerate, Samsung Electronics, in 2015,(69) signifying the national significance of public-led urban development.
Case study area in peripheral Seoul: Yongin-Jukjeon
The project area, located 20 km from Gangnam (one of Seoul’s districts) and 30 km from Seoul’s Central Business District (CBD), was named after the local government, Yongin, and the administrative unit, Jukjeon. Gangnam, a centre for start-ups, advanced producer services and ICT companies, is the most expensive residential area in South Korea.(70) The profile of the Yongin-Jukjeon project is as follows:(71)
Project area: 3.4 km2.
Project period: 1999–2006.
Total planned population and dwellings: 56,994 persons and 18,384 dwellings
Land use before development: predominantly forest (54.8 per cent) and agriculture (32.2 per cent).
Land use after development: residential (43.4 per cent), commercial (5.1 per cent), public facilities (51.5 per cent, including 7.9 per cent for green space and 16.6 per cent for roads) (see Figure 4).
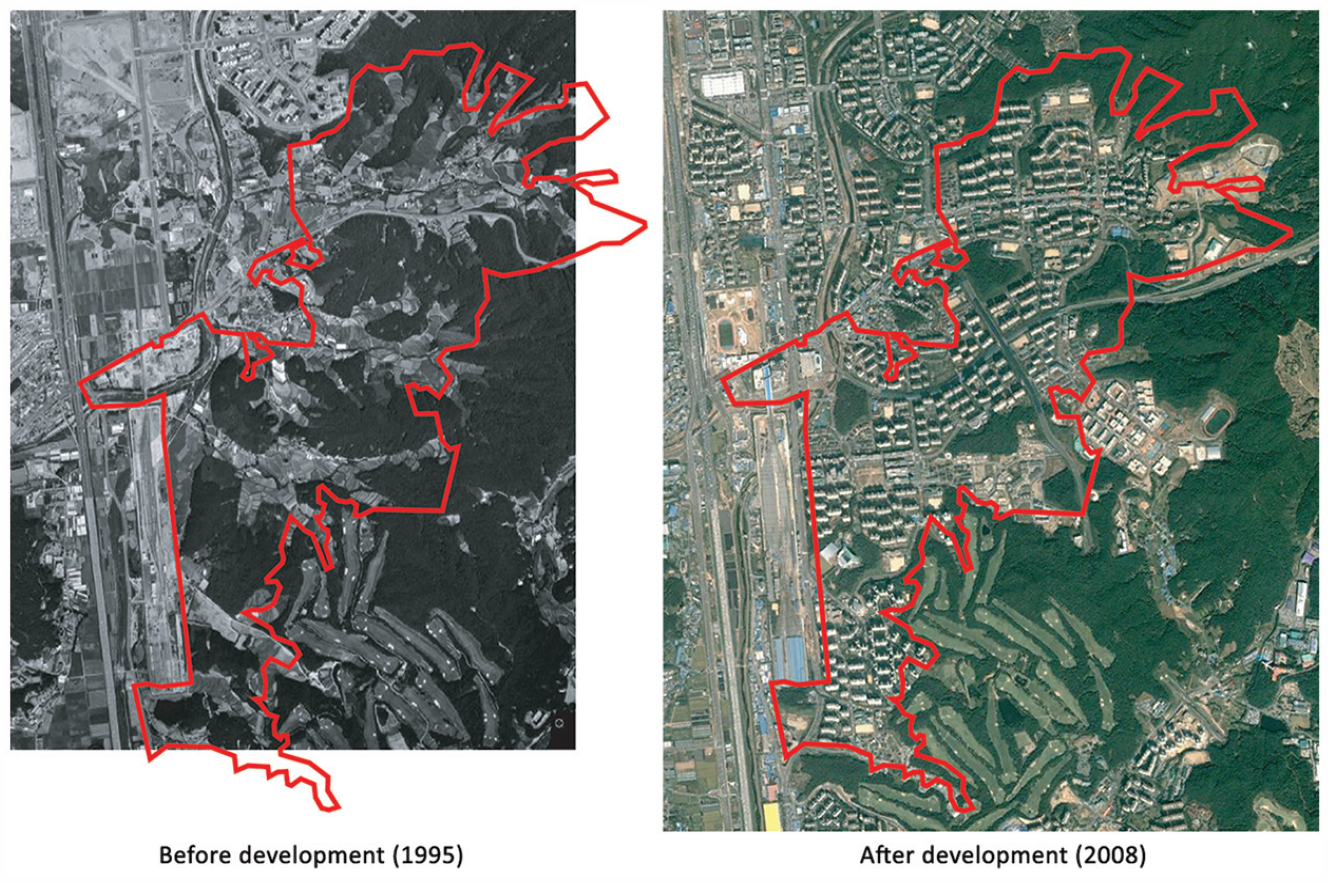
The Yongin-Jukjeon project site: before and after development
c. Data sources
This research draws on land value data across the region and within the case study site for two sets of analyses. To discover the rent gap generation on a regional scale and the changes in land value within the project site, data about the assessed land value of sample plots (or Pyojunji Gongsijiga) were collected. Assessed land value is given by the government agency, Korea Real Estate Board (REB) (previously, the Korea Appraisal Board), and is recognized to be approximately 70–80 per cent of market value.(72) Although the land value dataset does not perfectly reflect market value, it has advantages – it is released annually, with the details of the sample plots, including address, land area, land use and zoning code, and it is managed by a single institution, allowing for consistency across different regions. The REB selects approximately 2 per cent of land parcels, called sample plots (or Pyojunji) for valuation by professional valuers.(73) Those samples, through a hedonic approach,(74) are used to mathematically valuate entire land parcels for tax purposes. This research uses the sample plots rather than mass valuation to avoid errors from statistical estimation. The land value data has been available since 1997 from each dong (or small neighbourhood administrative level), via the online system managed by the REB.(75) The land value data were geocoded on a map after aggregating the sample plots within the dong. The local currency, Korean Won (KRW), was used to eliminate any possible bias from the fluctuation of foreign exchange rates. The amounts were expressed in thousand KRW (tKRW) unless specified. However, by applying the approximate exchange rate of 1,000 KRW/US$, one tKRW could be read as one US$. The annual average of the foreign exchange rates ranged from 804 KRW/US$ to 1,401 KWR/US$ in the period 1996–2007.(76)
For a regional scale analysis, the land value data were combined with spatial data measuring distance to Seoul’s CBD. The city hall was selected to represent the CBD’s central point, following Kim et al.(77) Then, land value gradients were established to investigate the rent gap. To specifically identify geographical areas between the CBD and the case study project site, a 3 km buffer was applied from the line linking the city centre to the end of Gyeonggi Province through the geographic centre of the Yongin-Jukjeon site. To build the land value curves, the dongs whose geographical centres are located within this 3 km-width band were selected; this analysis was carried out on spatial analysis software – QGIS. This method allowed for the cross-section of land value in the same direction. In total, 77 dongs were identified, but the last one, located at a 67 km distance, was removed for the sake of the graph’s legibility. The assessed land value of sample plots included different zoning codes. However, no adjustment was made because this research analysed the effect of land value changes created by public actions, including development decisions, planning and (re-)zoning. The average land value, aggregated by dong, was graphed along with the kilometre distance from the city hall of Seoul. Two land value curves were created to compare the land value curve of pre-development (1999) with that of post-development (2008).
For analysis at the project site scale, the mean land value of the sample plots, with a 95 per cent confidence level, was graphed each year in the analysis period. The Yongin-Jukjeon site sits within two dongs – Jukjeon-dong (previously Jukjeon-li) and Bojung-dong (previously Bojung-li). The sample plots within these two units were combined year by year, covering the periods of pre-development (1997–1998), land development (1999–2006) and post-development (2007–2010). By reviewing the land value change, how land value uplift was allocated among the four major stakeholders – original landowners, the public agency (LDC), developers (home builders) and end-users – was analysed. Essential information about compensation, infrastructure installation and land sales was acquired from the LDC (2007).(78)
IV. Rent gap generation: regional scale land value curves
The land value gradient depicts spatial structure with growing distance from the CBD. Dynamic non-linear changes in land value were observed with at least four outstanding spikes, demonstrating polycentric urban structure. Figure 5 shows the two land value gradients for pre-development (1999) and post-development (2008). In the 2008 gradient, these four spikes are more visually apparent than in the 1999 gradient. The highest land value was found at the locations situated 500–700 metres away from the Seoul city hall, regarded as encompassing the most expensive commercial areas, including Chungmuro and Myeongdong. The second spike was seen in Gangnam, where large-scale development projects took place from the late 1960s, and which became a sub-centre by the 1980s.(79) After this spike, with the presence of a greenbelt, the land value dropped significantly, and beyond the greenbelt, one more spike was found on the fringe of Gangnam. The firm establishment of the greenbelt suppressed land values for 8–9 kilometres. Finally, the fourth spike was found in the Bundang new town, the largest project among the five first-generation new towns (1989–1996) developed under the HSDPA. As Jun and Hur(80) have critically observed, leap-frog development appeared once the greenbelt ended, causing extended commutes to Seoul. Yongin-Jukjeon adjoins the southern edge of the Bundang new town.
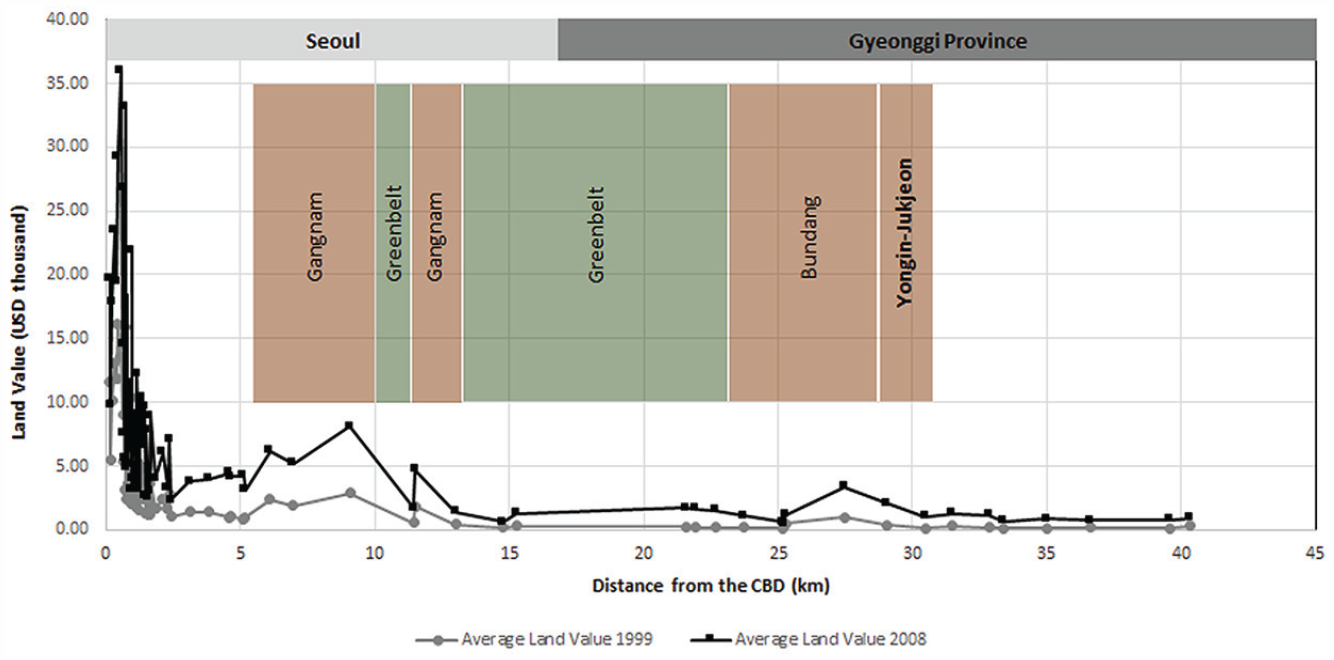
Land value curves of Seoul towards a southern direction: 1999 and 2008
The Yongin-Jukjeon project site saw a radical increase in land value between the two points in time. The 2008 gradient flattened beyond the Yongin-Jukjeon project, suggesting that urban development was regulated by zoning, hence keeping the land value at non-urban levels. The radical change in the land value gradient around the fourth spike at the Yongin-Jukjeon area near the Bundang new town shows the generation and growth of the rent gap. Hannah et al.(81) and Kim(82) also pointed out that Korean zoning limited the release of residential land, resulting in the price escalation of residential land. In fact, so-called “reckless development” (known as nangaebal in Korean) had been reported in Yongin in the 1990s after development potential was strengthened by Bundang’s construction, with new infrastructure installed. Yongin, next to Bundang, underwent rapid population growth, enlarging the rent gap between non-urban land and urban land. Private developers saw a growing demand hastening what Jung referred to as “small-sized, scattered, and unplanned” development.(83) They exploited the public infrastructure facilities provided in nearby new town areas without contributing to new infrastructure, intending to maximize their profit. This caused traffic congestion, degraded natural environments and resulted in low-quality infrastructure.(84) In this context, the public development scheme enabled funding and the provision of infrastructure both within and surrounding the project site.
V. The allocation of land value uplift: site scale analysis
This section details land value changes within the project site and analyses how land value uplift has been distributed among the four major actors. Figure 6 shows the rent gap on the project site, outlining the progress of the project and the changes in land value. During the project period – seven years from site selection to completion – the average land value had increased more than five times, from tKRW 265.5 in 1999 to tKRW 1,333.1 in 2006, an annual rate of increase of 25.9 per cent on geometric average. This contrasts with 4.2 per cent in major cities during the corresponding period.(85) The land value increase also occurred in surrounding areas because land market movements are subject to macroeconomic changes. To single out the effect of public actions, a comparison was made on land value changes between the case study area and the surrounding area (i.e. Jung-ja dong in Bundang) in the same southern direction from Seoul. In the period 1999–2006, the annual land value increase was 25.9 per cent on geometric average, while it was 15.8 per cent in the surrounding areas. The rapid land value increase within the case study area demonstrates the effect of public actions, including up-zoning, new urban infrastructure and land improvements, and indicates the rent gap. While the pre-development land value in Yongin depicts Smith’s “actual ground rent capitalised under the present land use”, the post-development land value shows “the potential ground rent level”.(86)
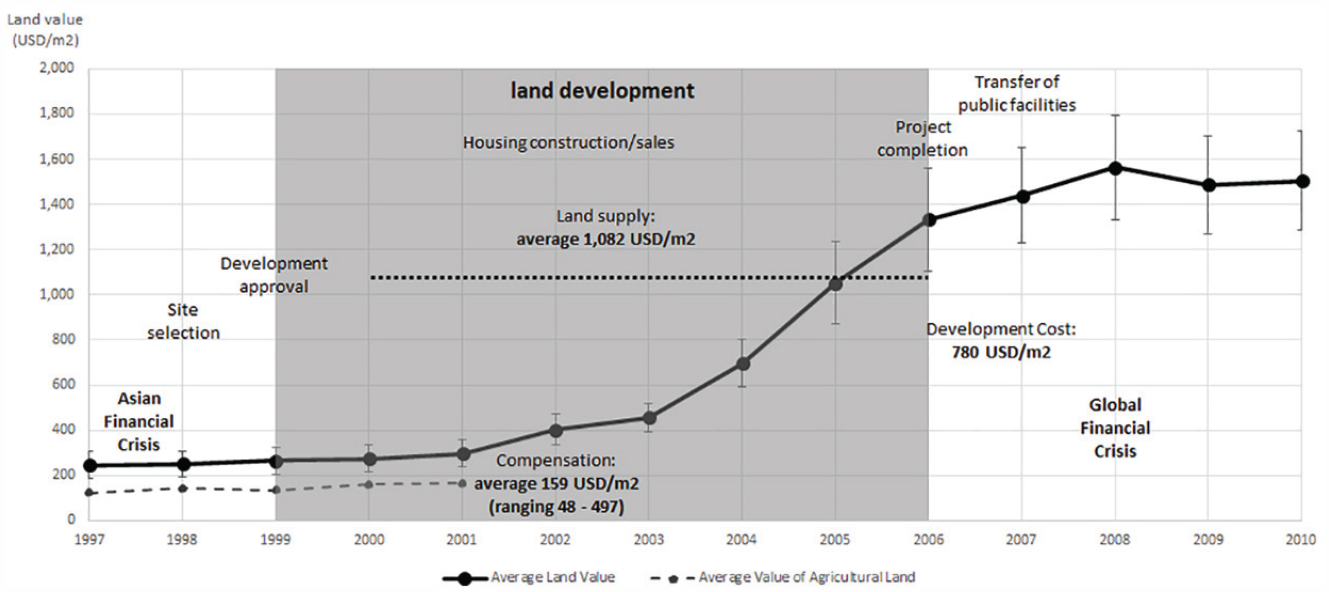
The change in land value in the Yongin-Jukjeon project area
A portion of the rent gap was recouped through public development. Different prices were applied in the process of land reallocation. The fundamental approach was a “land development cost” (joseong-wonga), estimated by the total cost including land acquisition, land improvements and infrastructure without any profit margin. By dividing the total “land development cost” by saleable urban land, the per unit land development cost was computed for land supply. This approach yielded the lowest cost relative to other approaches, such as valuation and auction. The land was given to other public institutions at the “land development cost” while higher prices were charged for private commercial developers. The selection of the land price was crucial for all stakeholders, as analysed below.
a. Original landowners
Within the project site, there were 1,000 private landowners, who owned 90.2 per cent of the project land area (or 3.2 km2) when the development decision was made.(87) A compensation office was established in 1998, a survey for land acquisition was conducted in 1999 and compensation commenced in 2000. The total amount paid was KRW 560 billion (approximately US$ 560 million), of which 92 per cent was spent on land acquisition and 8 per cent on buildings (468 houses, 29 factories, 176 greenhouses and 1,420 business facilities) and other purposes such as relocation. Compensation was based on a valuation, reflecting the existing land use without consideration of future development potential, which meant almost zero gain for these original landowners. The highest value, tKRW 553 per m2 on average, was applied to land for buildings, while much lower compensation was provided for irrigation canals (tKRW 49 per m2) and forests (tKRW 116 per m2). Figure 6 shows that average compensation across the project site was as low as the then-assessed value of agricultural land in 2000. However, the owners’ financial gains were realised by the new urban land they were offered to compensate for their residential and/or business rights after land development was completed. LDC reported that:(88)
97 original residents were provided with new residential land for single-detached housing at the “land development cost”.
39 original residents were provided with new housing at a subsidized price.
295 original landowners were provided with commercial land, some plots as large as 26.4 m2, at a valuation price (presumably lower than the market value) for their business rights.(89)
The original landowners benefited from these exchanges. For instance, residential land was given to them at tKRW 734 per m2 – or 21 per cent lower than the cost for non-original residents in land sales. In addition, the land value had further increased after the decision on the transfer of the new urban land. For example, between 2005 and 2007, land value increased by 37 per cent (Figure 6), meaning additional windfall gains for these original landowners, although these gains were not guaranteed at the time of compensation. For those original owners who could afford the option for new urban land, their gains reached more than 50 per cent. More than half, however, did not (or could not) exercise the option.
b. A public development agency
The financial gains for the LDC were outstanding in their scale. The land acquisition authority paid for land at an agricultural value, 159 tKRW/m2 on average, and sold the developable urban land at market value, 1,082 tKRW/m2, or 6.8 times higher than the level of compensation (Figure 6). (There was also the possibility, as noted, of a discount for selected groups such as government bodies and original landowners.) There were two major expenses: compensation for land acquisition and the cost of land development, including the installation of infrastructure. Between 1999 and 2008, the aggregated expense was KRW 1,362.7 billion (approximately US$ 1,362.7 million) – land acquisition amounted to KRW 612.8 billion (approximately US$ 612.8 million) (or 45 per cent) and land development, KRW 749.9 billion (approximately US$ 749.9 million) (55 per cent) (Table 2). The aggregate revenue from land sales reached KRW 1,905.0 billion (approximately US$ 1,905 million). Undiscounted net income was KRW 542.2 billion (approximately US$ 542.2 million) and the net present total value, estimated by a 10 per cent discount rate,(90) was KRW 390.6 billion (approximately US$ 390.6 million) after all local-scale infrastructure costs were paid (Table 2). The internal rate of return (IRR) was 262 per cent. By all financial evaluation measurements, this project was extremely profitable for the public development agency.(91)
Yongin-Jukjeon project cash flow (million KRW)
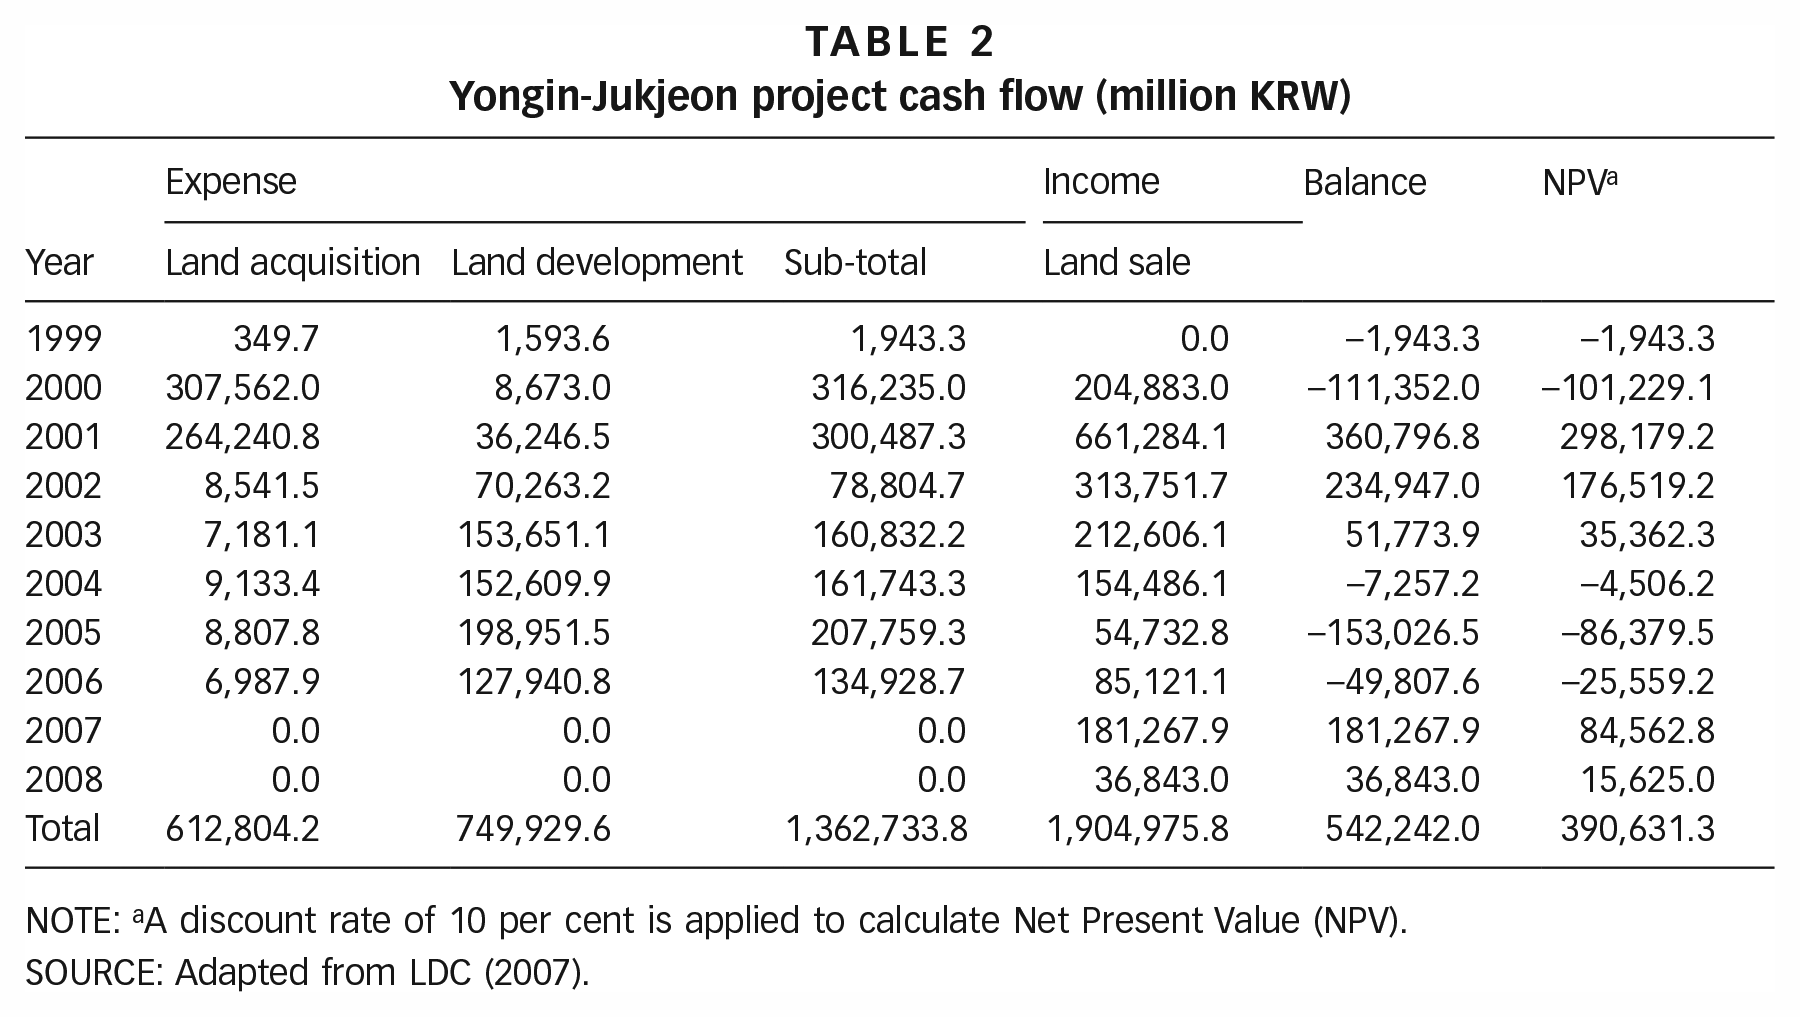
NOTE: aA discount rate of 10 per cent is applied to calculate Net Present Value (NPV).
SOURCE: Adapted from LDC (2007).
This project achieved full funding for local-scale infrastructure facilities and secured public land, which accounted for 51.5 per cent of the post-development land. Infrastructure facilities that this project funded included:(92)
A total length of 36,815 m of roads (including arterial regional roads outside the project site, local roads, alleys and footpaths).
Nine parks, 372,649 m2 in total, and 19 playgrounds, 46,373 m2 in total.
267,361.5 m2 of green space.
31,513m of water supply pipes and 63,603m of sewerage.
One library, 6,490 m2.
Power supply and power facilities.
Sites for 13 schools and two kindergartens were also reserved. The school sites were provided to the corresponding government education departments at the “land development cost” – tKRW 730 per m2 – while the two kindergarten sites were sold to private operators at auction (or market value) – tKRW 1,457 per m2. After the land transfer was made, the relevant departments constructed schools with their own funds. The quality of infrastructure facilities was consistent with the national standard because the project was carried out by the national development agency based on guidelines from the District Unit Plan and with reference to the long-term strategic plan of Yongin. While most regional road construction was internally funded by the project, some infrastructure facilities were co-funded by Gyeonggi Province and the central government.
c. Construction companies
Decisions regarding the allocation of the developed urban land were dependent upon government strategies. The same price was not always applied. High-density residential land tracts were categorized into three groups: (1) land for small apartments under 60 m2, (2) medium-sized apartments between 60 m2 and 85 m2 and (3) large apartments more than 85 m2. The first was sold to private housing developers at 70 per cent of the “land development cost” or tKRW 619 per m2 – 38 per cent and 45 per cent lower than the second and third categories of residential land respectively – with a requirement to provide affordable housing. These small dwellings accounted for a quarter of the total. By supplying land for small apartments at a below-market price, the government intended to provide affordable (rental) housing through a process centred on national housing policies including the Public Rental Housing Programme and the Housing Subscription Savings Scheme.(93)
The second and third categories of residential land were sold at the valuation price, or tKRW 1,004 and tKRW 1,121 per m2, on average, respectively. Once the contract for the transfer of these tracts was signed, housing construction took place without delay. In the three exemplary housing projects analysed by Jung et al.,(94) the land sales contract was signed in 2000–2001 and housing sales took place in 2001–2003. Most apartment complexes were completed in 2004.(95) Given the time required to build, the gains of those private developers from land value uplift in the period 2000–2004 are not apparent in Figure 6. However, their gains were achieved by securing large tracts of land for new developments, which might not be available elsewhere, and selling new apartments at market value in the housing market.(96) The private developers could kick off construction immediately based on unified landownership offered by the public development agency. Also, the land supply was made at the valuation rather than auction price, which might be favoured by private developers who wanted to hedge risks and benefit from the possible discount.(97) Jung et al. estimated that construction companies achieved a rate of return ranging from 21 per cent to 62 per cent (or KRW 44 million –KRW 155 million per dwelling) in the three exemplary apartment projects in Yongin-Jukjeon.(98)
d. End users
Once homes were sold, they followed the market trend. Jung et al. observed substantial gains for home buyers in the project site although their experience varied due to subsidies.(99) Sales prices were determined by the prospects of construction companies. High prices would aggravate risks for marketing, while low prices would result in a low rate of return. Buyers (or end-users) also compared prices to the market trends in surrounding areas. In their investigation of three apartment projects, Jung et al. estimated there were immediate gains after their purchases due to the gap between the sales prices and the then market values, 3.7 per cent, 4.3 per cent and 29.8 per cent, respectively.(100) The 29.8 per cent rate of return was generated by the low sales price compared with the other two projects.
In addition, a total of 3,391 affordable rental houses were provided by both private developers and a public agency, the KNHC.(101) The former provided 2,041 affordable homes and the latter, 1,350 affordable homes. The required duration for the private providers to continue operating the affordable rental homes was short-term. Only after 2.5–5 years could they be sold at market value. The first tenants had a priority option to purchase the short-term rental apartments at below-market prices, and could then realise a gain by selling their former rental apartment at a market value. However, the KNHC continued the operation of public rental housing without selling off its public rental housing.(102)
VI. Conclusions
This research shows that land use regulation enlarges the rent gap in peri-urban greenfield areas of the rapidly growing metropolitan region. A high rent gap in peri-urban areas invigorates sudden changes in the function and morphology of an area or peri-urban gentrification. The deregulation through up-zoning releases the rent gap in the form of windfall gains. The Yongin-Jukjeon project illustrates a radical change in built form from predominantly farmland and forests to high-density residences based on a powerful housing development scheme, the HSDPA. In the case study project site of peripheral Seoul, the average land value increased fivefold over seven years. To monopolize the gains, the South Korean housing development scheme restricted the freedom of landowners and private developers. Instead, it took advantage of eminent domain to acquire land at the current land use value prior to development. Hence, the post-development land sales could be as much as 6.8 times higher than the compensation paid to owners for land acquisition. Through this gain, the public development agency secured funds for new infrastructure as well as for land acquisition. Conceptually, what the public development corporation recouped was the increased residual land value arising from up-zoning and land improvements by public actions. The project produced decent quality infrastructure by the national standard and ample public space, up to 51.5 per cent of the total area by capturing land value uplift. Even then, the IRR of the project was 262 per cent.
However, the findings reveal that the project was not a “winner-takes-all” situation for the public development agency. Other actors also benefited. Although the level of compensation to the original landowners did not initially represent a gain, they were offered housing subsidies that did finally allow financial gains. The losers were the original landowners who could not afford new urban land, and hence experienced displacement. Construction companies achieved substantial gains by virtue of land supplied at lower prices than the market value and business opportunities on amalgamated large-size land tracts. The buyers of the apartments also achieved house price increases immediately after their purchases. All these gains for other key actors indicate that the public development agency did not realise 100 per cent of LVC although the value uplift was generated by public actions. Instead, the high volume of the rent gap was shared and reallocated among the key actors, possibly mitigating complaints against the authoritarian government. In fact, the use of the profits from the public development projects, after costs are paid, has not been transparently disclosed, but it is known that LDC’s gains have cross-subsidized the loss-making public rental housing agency (KNHC) by merging these two public institutions.
As illustrated in this research, the public development approach is a powerful tool for LVC in peri-urban development. LVC can also be implemented by other means, such as infrastructure levies and in-kind contributions for infrastructure, if a clear plan is established. However, the Korean experience of government-led peri-urban development reveals the accelerated pace of land acquisition, land improvement and infrastructure installation that can result in mass housing production within a short span of time without governments having to take on out-of-pocket expenses.
Footnotes
Acknowledgements and funding
This research was supported by the Korea Foundation and the Laboratory Program for Korean Studies of the Ministry of Education of the Republic of Korea and the Korean Studies Promotion Service at the Academy of Korean Studies (AKS-2022-LAB-2230001). I would like to express my appreciation for the constructive comments from two external reviewers. I would also like to express my gratitude to Ms Minkyung Kim (Jade) for her valuable assistance in data collection and spatial analysis. I give thanks to Dr Anthony Kent for his edits. Any remaining errors are the responsibility of the author.
5.
22.
Two price-based instruments, traffic congestion charges and development impact fees, can be employed to mitigate urban sprawl (Brueckner, 2011, chapter 4), but these tax approaches are not included in this conceptual framework in order to simplify and stress the focus of this research.
27.
32.
Howard established such enterprises for his two garden city projects: Garden City Limited for Letchworth and Welwyn Garden City Limited (Ward, 1992).
35.
41.
45.
Wu (2022); ![]() .
.
52.
57.
63.
Lim (2021); ![]() .
.
69.
74.
The hedonic approach is a statistical regression model to estimate the contribution of attributes, such as size, distance to the business centre, to the value of properties.
78.
All the numbers in this research are presented in the nominal term, not incorporating price escalation effects over time, which may exaggerate the extent of land value increases and the gains shared by each stakeholder.
82.
90.
In South Korean public projects such as road construction, 5.5 per cent of the social discount rate is employed for pre-feasibility studies. Before the pre-feasibility study was institutionalized in 1999, the discount rate of 10 per cent was usually used (Lee, J J et al., 2016). The 10 per cent discount rate was selected for the simplicity of the analysis.
91.
Such high IRRs might not be found in other public development projects. The analysis result from this single case study, therefore, needs careful interpretation.
93.
See Ronald and Jin (2010) and ![]() for more details.
for more details.
96.
New apartments developed by public development agencies based on the HSDPA are usually sold to qualified homebuyers at regulated prices below market prices, but this price ceiling policy was not implemented when Yongin-Jukjeon was developed.
97.
One of the instruments to mitigate risks was pre-sales before the completion of housing construction. Once end-users committed to their purchase, they were required to deposit a portion of the sales price in advance that could be used when the developers financed the construction costs. However, this financing system had little to do with land value uplift, hence, no further details are provided here (see La Grange and Jung, 2004 for further details).