
Abstract
Climate change is putting low-lying coastal zones at increased risk, through higher sea levels and changes in the weather. Deltas are subsiding, compounding such risks. Confirming past research, we find roughly 10 per cent of the world’s population and an even higher share of its urban population are located in coastal areas under 10 metres in elevation (LECZ10), with Asia dominating these statistics. However, according to our estimates for 2015, the deltaic LECZ10 is 2.6 times as densely populated and 1.7 times as built-up as the non-deltaic LECZ10. The deltaic LECZ10 accounts for only 0.35 per cent of the world’s land, but over 10 times the population share (279 million people). Population and built-up area growth rates remain higher in the deltaic LECZ10, and especially its cities. Indeed, for 1990–2015 the urbanization rate of the deltaic LECZ10 is double that in the non-deltaic LECZ10. Given the path dependency of urbanization, this risks locking in maladaptive settlement patterns.
I. Introduction
This paper focuses on settlement in the low-elevation areas of 42 of the world’s major deltas, and particularly on the growth there of “Urban Centres”. Urban Centres are here defined primarily by their population density and size (more detail below) and are roughly comparable to what are commonly called cities; they do not include the smaller Urban Clusters estimated to account for about a third of the world’s urban population, broadly defined. This paper is concerned with the implications of urbanization in deltas for climate change vulnerability, recognising that – independently of climate change – deltas are subject to environmental degradation and exposure to environmental hazards likely to amplify climate-related risks. While measures can be taken to reduce vulnerability to emerging climate hazards, such as human-made or nature-based defences against flooding and storm surges, there are hard and soft limits to adaptation.(1) Moreover, defensive measures are likely to stimulate further development in temporarily protected areas, in some cases potentially putting more people and property at risk in the long run.
A delta can be defined as land formed from sediment brought down by a river to the sea.(2) The rich and overlapping ecologies that characterize deltas enabled the formation of some of the earliest known urban agglomerations, and the rich soil provided by deltaic river flooding provided the basis for the grain production that was central to some of the earliest (city) states.(3) Urban development in deltas, with their access to both sea and riverways, also accompanied the spread of trade and empires. As a result, deltas have long been, on average, more heavily settled and built-up than either higher and more inland areas or other low-elevation coastal areas, and this still holds today.(4) Indeed, the size and dynamism of deltaic cities is continuing to attract further development.
Unfortunately, deltas are also hotspots of environmental degradation and risk, including key risks associated with climate change. Being at the intersection of saltwater, freshwater and terrestrial ecosystems, deltaic ecosystems are particularly dynamic and valuable. These ecologies are threatened by growing populations, expanding built-up land cover, and related human activities.(5) Meanwhile, deltas tend to be riparian and coastal areas of low elevation, prone to environmental hazards such as sea-storm surges,(6) river surges from upstream storms and related flooding. With climate change, such hazards are becoming more severe and frequent while new ones are emerging.(7) The obvious example is the heightened likelihood of floods brought on by sea level rise and the possibility of more extreme weather events both upstream and at sea. Such hazards are amplified by delta subsidence, itself an important source of relative sea level rise(8) and a process accelerated by urbanization. Looking to the future, understanding current urbanization trends in deltas and avoiding lock-in to maladaptive settlement patterns will be critical to global climate change adaptation.
Despite the probable scale and undoubted significance of urbanization in the major deltas, there is no global database on the size of human populations, the extent of built-up areas and the levels of urbanization in these ecologically rich and fragile areas. There are further evidence gaps around how these characteristics vary among regions and change over time. This paper seeks to fill these gaps. While such global assessments are no substitute for granular information to guide local decision-making, they provide a useful indication of where concentrations of people and built structures may be particularly exposed to environmental hazards (including those induced and exacerbated by climate change), as well as where human settlement patterns may be degrading important environments.
The following section (II) provides background on the history of urban development in deltas and its path-dependent tendencies. Section III summarises the approach and methodology. This is followed by two results sections. Section IV reviews population and built-up areas in 2015, and their 1990–2015 growth rates, in and out of deltas and Low Elevation Coastal Zones (LECZs). Section V turns to urbanization, focusing on the particularly high shares of land and population in Urban Centres in deltaic LECZs, and how very rapidly the population in these areas urbanized between 1990 and 2015, particularly in East Asia. Each results section focuses primarily on LECZs less than 10 metres elevation (LECZ10), but also gives some consideration to those less than 5 metres (LECZ05), where the results are more uncertain, but hazards are more prevalent. The article ends with a brief discussion and conclusions section (VI).
II. Background
a. A brief history of urbanization and deltas
The history of deltas and urbanization has long been intertwined, and will likely remain so. Though the major deltas only account for about 0.5 per cent of the world’s land area (see Table 2 in Supplementary Materials), settlements in these deltas have long been an important part of human history as evidenced by the outsized role of Alexandria in the Nile delta, New Orleans in the Mississippi River delta, Rotterdam in the Rhine delta or Shanghai in the Yangtze delta.
The world’s current deltas began to form seven to eight millennia ago, at the start of a period of comparatively stable global sea levels, following a glacial retreat.(9) This stability allowed river sediments to accumulate at the mouths of many of the world’s rivers, creating low-elevation sub-aerial deltas (i.e. areas above sea level) expanding out into the sea, in a myriad of forms.(10) Having been laid after a glacial retreat, deltaic sediment is not prone to the post-glacial (or isostatic) rebound of many other coastal areas. Rather, in the absence of further sediment accretion, deltas typically experience compaction and subsidence.
Deltas have long attracted people, but there has been a shift from the early stages of settlement when the attractions arose from the natural features of deltas, to recent times when the attractions arise primarily from the pre-existing settlements themselves, and related trading and employment opportunities. The richness and diversity of so many deltaic ecosystems, at the boundary of aquatic, marine and terrestrial habitats, attracted hunter-gatherer groups. The flat topography, fertile and regularly replenished soils, and the availability of freshwater in deltas, enabled the creation and early expansion of agricultural states and societies. Their access both to the sea and to inland waterways attracted traders and colonizers, especially as water-borne trade expanded along with the global economy. And in contemporary market economies, the pre-existence of cities in deltas is itself attracting capital and workers to deltas through what are known as external economies of scale, or more generally agglomeration economies.(11) In effect, the scale of urban development already in many deltas today makes them attractive to those seeking further investment or employment opportunities, even when their natural advantages are no longer salient.
While the natural abundance and productivity of deltas enabled sedentism and help to explain why urban development first emerged in deltas and other riverine wetlands, capitalist urbanization created a temporary break in the regional geography of urbanization. Many of the world’s first known urban settlements were formed in early deltas, including those of the Tigris and Euphrates, the Nile, the Yangtze and the Huang, the Indus and the Grijalva. Early deltaic cities such as Eridu, Ur and Uruk have been linked to a regimentation of agriculture in tandem with the rise of the state.(12) However, cities rarely reached a million residents until the era of industrialization when London, New York and other European and North American cities broke the records in urban growth rates and population sizes. The story of Western industrial urbanization in the nineteenth and early twentieth century was not one of deltas in particular, and our findings demonstrate that the share of European and North American urban populations and built-up areas in low-elevation deltaic areas continues to be well below global averages.
In the past century, however, Asia has again become home to the majority of the world’s urban population, and this has involved far higher rates of deltaic settlement. These patterns of urban development have been driven in part by export-led economic growth, reflecting both market forces and political choices amplifying these market forces. For example, China’s strategy of incrementally opening up selected coastal locations, and giving export-oriented development in these locations preferential treatment, amplified market forces already favouring coastal locations.(13) Starting in 1980, China opened up Special Economic Zones in four coastal locations and then built on the most successful examples to open up more and more coastal cities. By the time cities in other parts of China were encouraged to adopt similar development strategies, the coastal cities (some founded in rural areas at the start of the export push) had secured agglomeration economies that maintained their dominance. China’s policies amplifying the inherent market advantages of coastal locations help explain the results showing an outsized share of people and built-up areas in Eastern Asia’s deltas today.
These examples illustrate that contemporary urbanization is not just a demographic transformation, but also a techno-institutional process inherent to market-led economic development. The concentration of built-up land and movement of people from agricultural areas is intertwined with trade and the growth of industry, commerce and services. Investment in and migration to cities create agglomeration economies that provide further investment and employment opportunities: in other words, urbanization has path-dependent tendencies. It is for this reason that many of the early deltaic cities mentioned above persist today. Uruk may now have faded, but it endured for 5,000 years. (Its decline has been partially attributed to the changing path of the Euphrates, in an era when high agricultural productivity and riparian/maritime transportation were still critical to the survival of cities.) Urban path dependencies are manifest in the physical environment as well as urban economies and societies: land use and infrastructure decisions have shaped urban form and function for centuries, with profound implications for both climate change mitigation and adaptation. Moreover, where urban development is allowed to breach local ecological thresholds, it can become extremely difficult, if not impossible, to reverse major shifts.
b. Urbanization, path dependencies and climate change
Urbanization’s path dependence is central to the “new economic geography” that emerged in the 1990s.(14) The agglomeration of people in cities allows firms to benefit from proximity to suppliers, workers, customers and competitors. Economic concentration, therefore, allows firms to better match their needs at lower cost, thanks to larger markets with more competition and specialization. It enables firms to share more productive infrastructure and services, including transport networks, ICT (information and communications technology) connections and professional services such as legal, financial and technological know-how. And it enables firms to learn from each other through comparison, open competition and collaboration.(15) These agglomeration economies can attract more people and firms, fuelling the growth of urban populations and expansion of built-up land, which can in turn further increase agglomeration economies (as well as diseconomies, including local environmental degradation).
Physical factors contribute to agglomeration economies and can also amplify locational inertia. The durability and relative immovability of buildings and other infrastructure make relocation more costly. The networks formed while taking advantage of agglomeration economies are also difficult to relocate. The formal creation of administrative bodies and municipal and plot boundaries, or the informal emergence of values and norms rooted in a local identity, create the political dynamics that sustain, but also spatially restrain, cities. People can move far more easily than communities, and companies can move more easily than interdependent networks.
The path dependence of urbanization, and the potential for lock-in, has parallels in efforts to mitigate climate change more generally. The term “carbon lock-in” was first proposed by Unruh,(16) and is now widely used to describe how path-dependent processes can entrench technologies, institutions and behaviours that emit greenhouse gases.(17) There is research on how this may play out in an urban context, particularly how spatial planning and transport infrastructure investments can lock in lower-density urban development that requires more energy, land and materials and therefore corresponds to higher emissions.(18)
More recently, there has been attention to the way that path dependencies can lock in vulnerability to climate change, increasing exposure and sensitivity to risks or precluding adaptation options. Historical decisions shape urban adaptation options and preferences in a number of ways, from governance arrangements, to economic composition, to infrastructure stock.(19) Of particular concern to this study is the need to recognise and overcome locational path dependence that draws capital and people into increasingly urban coastal areas, ignoring the rising risks. Eventually people may be driven to migrate out of urban areas in hazardous locations, allowing cities in more suitable locations, as the title of Kahn’s 2010 book puts it, to “thrive in the hotter future”.(20) However, precautionary migration as a local form of climate adaptation is the exception rather than the rule, and unplanned migration forced by environmental disaster or degradation can be very costly, not least for the migrants. Kocornik-Mina et al.(21) have undertaken an empirical analysis of rebuilding after large city floods in different parts of the world, and conclude that “cities and parts of cities that are built in flood-prone areas may be locking in exposure to flood risk for a long time”.(22)
The future extent of coastal damage attributable to climate change through increasing flooding via sea level rise, sea-storm surges and river surges due to heavy rainfall upstream remains very uncertain.(23) However, the impacts of climate change are already apparent in many coastal settlements and the continued rise in average global temperatures will likely inflict still more severe and recurring damage. Coastal and estuarial flooding is already an important category of disaster, and the latest report by Working Group II of the Intergovernmental Panel on Climate Change (IPCC) concludes that, “Risks to coastal cities and settlements are projected to increase by at least one order of magnitude by 2100 without significant adaptation and mitigation action (high confidence).”(24) The nature and scale of climate-related hazards will vary among coastal regions, but already include more frequent and severe coastal and estuarial flooding. Defences against flooding have long been part of delta development, but even in affluent countries these defences can fail in the face of new or extreme events, as the case of Hurricane Katrina and New Orleans demonstrates.
Sea level rise is expected to gather pace over the coming decades, and to continue for centuries as the ocean absorbs heat and large parts of the Antarctic and Greenland ice sheets melt and ultimately disappear. The extent of sea level rise depends on the extent of the average global temperature increase: in 2,000 years, it is forecast to be about 2–6 metres at 2°C, 4–10 metres at 3°C and 12–16 metres at 4°C.(25) While this is well beyond a human lifespan, deltaic cities such as Alexandria and Guangzhou are over two millennia old – and today there are many more such cities than at the birth of Christ. These ominous projections mean that climate change poses an existential risk for many deltaic settlements.
Moreover, long before sea levels began to rise because of human-induced climate change, deltas were experiencing compaction, which in the absence of continued sediment deposition leads to land subsidence, and what has been termed “relative sea level rise”.(26) Along with this “delta effect”, subsidence can result from a “city effect”: urban development and other human activities contribute to subsidence, as when human activities draw down underground aquifers.(27) The effects of subsidence on relative sea levels are small if averaged across all coastlines globally, but averaging across coastal dwellers (and probably across coastal property values) the effects have been substantial. Specifically, Nicholls et al.(28) estimate that between 1993 and 2015 the average relative sea level rise along the world’s coasts was only 2.6 mm a year, but the average sea level rise experienced by a coastal resident was between 7.8 and 9.9 mm a year. More of this relative sea level rise for coastal residents was due to subsidence than to absolute sea level rise.(29) But local effects can vary widely. A recent modelling study by Minderhoud and colleagues(30) predicts that if current rates of groundwater extraction associated with urbanization and agricultural intensification continue, considerable parts of the Mekong delta will fall below sea level this century. Stressing this confluence of factors, the IPCC’s Sixth Assessment continues to emphasize prior findings that “the erosion of the major deltas of Asia may take place through a rise in sea levels, an increased frequency of extreme weather events and the excessive withdrawal of groundwater”.(31)
Although the terms “path dependence” and “lock-in” are not widely used in ecology, the concepts are implicit in much ecosystem thinking, and in the long-standing concept of the balance of nature.(32) Ecosystems are perceived to achieve comparatively stable states across large scales, which persist in the absence of significant external or internally generated disruptions – such as a change to physical conditions or the loss of a keystone species. Such disruptions can lead an ecosystem to shift towards a new stable state, which may involve a major loss in ecosystem services. The urbanization of deltas can affect ecosystem dynamics enough to lead to ecosystem transitions. Likely contributors include subsidence, freshwater aquifer depletion, surface impermeabilization, pollution, saline intrusion, the loss of fertile land to urban purposes or of aquatic/marine ecosystems to land reclamation. Such degradation may lead to a more ecologically rooted form of lock-in, wherein key species living in, or ecosystem services provided by, deltas have been lost. It is then difficult and costly, if not impossible, to return to earlier ecological states that are more conducive to environmental and human well-being.(33)
Understanding patterns of human settlement along the coasts, and particularly in deltas where climate hazards will intersect with other biogeophysical challenges, will be important for assessing and mitigating risk. Generally, the combination of path-dependent processes in urban development and degraded deltaic ecologies does not bode well for climate change adaptation. Averting or breaking lock-in will be a challenge for market actors, politicians, planners and urban residents.
III. Approach And Methodology
The concerns that inform this paper are that: (1) several very serious hazards, most notably flooding, are prevalent in low-elevation coastal areas and especially deltas; (2) people and economic capital are also more concentrated in these areas, and this concentration may be increasing; (3) global climate change and environmentally harmful development are increasing the severity and extent of these hazards, placing people, property and environmental resources in these areas at still greater risk; (4) the path dependence of urbanization will constrain efforts to shift coastal settlement patterns and adapt to rising climate risks.
We examine these concerns by combining internationally comparable data sets available at multiple points in time, which locate: (1) the global extent of two low-elevation zones contiguous to the coast, one bounded by an upper elevation of 10 metres (LECZ10), and the other by an upper elevation of 5 metres (LECZ05); (2) the extent of the world’s major deltas; (3) the distribution of people and built-up area around the world; and (4) the extents of Urban Centres around the world. The different data sets are layered spatially, along with political and land/water boundaries, allowing the densities and quantities of population and built-up area, as well as levels of urbanization (defined here as the share of population living in Urban Centres, and not those in Urban Clusters) to be estimated for any country or region, both inside and outside the LECZs and deltas, and at two points in time (1990 and 2015).
This approach builds on and extends McGranahan et al.’s paper on the risks of climate change and human settlement in low-elevation coastal zones,(34) using the core data sets presented in MacManus et al.,(35) as well as a data set on the world’s major deltas. The sources for the data sets are provided in Box 1. MacManus et al.(36) provide more detailed descriptions of all the data sets excepting that on delta extents, as well as comparisons with alternative data sets on elevation, population distributions and urban extents.(37) The basic approach to constructing estimates of population or built-up area exposures is to transform all layers into a common map projection, World Geodetic System (WGS) 1984, and common geographic resolution (nominally, 250 metres or 9 arc seconds), and then to construct zonal statistics. Brief summaries of how these empirical constructs and data sets relate to the concerns outlined at the start of this section are provided below.
Sources, spatial and temporal resolution, and format of spatial data sets used
Data related to Urban Clusters and Rural settlement are included along with Urban Centre statistics in the Supplementary Materials. Note that criteria used to produce the Degree of Urbanisation (DoU) data are not the same in each release (Maffenini et al., 2020). Small modifications reflect the production team’s effort to best capture their evolving understanding of the urban–rural continuum; other releases refer to the rural class as “rural and sparsely settled areas”.
a. Low Elevation Coastal Zones
LECZs have been chosen for close attention because they are internationally identifiable areas believed to be both densely settled and particularly exposed to climate-related coastal hazards. These hazards are likely to become more severe as sea levels rise and especially if extreme weather events become more frequent and severe. The term Low Elevation Coastal Zone (LECZ) was coined in McGranahan et al. (2007), the first publication to present global estimates of land areas and urban and total populations in LECZs.(38) The authors applied a cut-off elevation of 10 metres above sea level, contiguous to the sea coast.(39) MacManus et al.(40) used and compared several more up-to-date elevation data sets to designate both LECZ10 and LECZ05, including the one used in this article (the methods used in different data sets and sensitivity of results to data choices are discussed there).
The concentration of settlement in LECZs is analysed as part of our quantitative analysis, but the severity and distribution of the hazards and risks are not. As noted in the background section, there is much evidence on the importance of coastal hazards. Even for flood risks, however, elevation is only one factor among many influencing their severity for humans and their settlements. Coastal and estuarial floods typically result from a combination of factors including not only low elevations and high sea levels, but also especially high tides, storm surges from the sea and/or increased river flows from upstream. Changes in natural and human-made barriers, channels and sinks, along with accompanying estuarine geomorphological evolution, alter the extent and location of flooding. Development is often accompanied by construction of flood control structures designed to protect certain areas, but can also change water flows in destructive ways, including by damaging natural ecosystems that mitigate flooding (e.g. mangrove forests).
In any case, low-elevation coastal zones are inherently heterogeneous, including in their elevation, and future sea level rise and the prevalence and severity of coastal storms will also differ across regions. Sea level rise is likely to be slow, but of long duration. Thus, the LECZ05 may be considered more relevant to short-term risks, and LECZ10 to longer-term risks. However, for reasons summarized by MacManus et al.,(41) delineations of wider LECZs and estimations of their population and built-up densities are more robust. For this reason, while people and property in LECZ05 (or even lower elevation zones) are likely to face higher and more immediate risks, this paper focuses predominantly on LECZ10, referring to LECZ05 largely in a secondary way.
b. Delta extents
For any given elevation within an LECZ, deltaic land is likely to be more heavily settled and more prone to coastal hazards (on average) than other coastal land. Deltas have already become a focus of important work on climate change and increasing coastal hazards.(42) This paper uses a global data set on delta extents for 42 major deltas to further stratify the population and land exposure by deltaic area, using the same spatial overlay and zonal statistics methods as with LECZs. The data set, from Tessler et al.,(43) only includes major deltas, which account for about a fifth of the land area of the LECZ10.(44) A significant share of the urban population in the LECZ10 that is not in these major deltas is likely to be at other river mouths, often on smaller deltas.
This paper focuses particularly on the parts of deltas within LECZ10, which accounts for about 75 per cent of deltaic land (Table 2 in Supplementary Materials). Despite the correction for tree-height bias,(45) it is possible that some areas densely settled with high rise structures where the ground is below 10 metres in elevation and not protected by the structures, including those in deltas, are mis-categorized as being outside LECZ10 as the result of a high-buildings effect.(46) There are also challenges in defining a delta:(47) the land around the mouth of the Amazon, for example, is sometimes taken to be deltaic,(48) but at other times is not, as this land is not formed of the river sediment, often taken to be a defining feature of deltas. Instead, the river sediment is carried out to sea(49) and the land sometimes referred to as deltaic is not especially fertile. That Tessler et al. include a large Amazon “delta” in their data set(50) helps to explain the seemingly large deltaic area with low populations ascribed to Latin America in the results below.
c. Population and built-up densities
Population and built-up densities(51) provide rough indicators of the density of people and human-made property potentially at risk and of pressures on local environments. As described by MacManus et al.,(52) different international data sets on population distribution yield somewhat different estimates of population in LECZs. Perhaps more importantly, not only does the prevalence of hazards vary within any given LECZ, but also the vulnerability of different population groups and built-up structures is likely to vary considerably, even when exposed to the same hazards. In particular, lower-income groups are likely to be more vulnerable and may also live in more exposed (and consequently more affordable) areas. Conversely, not only is the ratio of built-up area to population likely to be higher in higher-income areas, but the properties in these areas are likely to be more valuable per square metre of land when measured at market prices, whether or not they are more important to human well-being.(53) Thus, the recent WMO Atlas of Mortality and Economic Losses from Weather, Climate and Water Extremes (1970–2019)(54) estimates that while low- and lower-middle income countries accounted for 81 per cent of the over 2 million disaster-related deaths over the study period, upper-middle and high-income countries accounted for 88 per cent of the US$ 3.6 trillion in economic losses. Only part of this large income-related shift from damage directly to humans and damage to property is likely to be captured by differences in the number of people and built-up areas in the exposed areas.
d. Urban extents and urbanization
Identifying and quantifying cities is important in part because of the agglomeration economies that make cities attractive places to live and invest in. These economies reinforce the path dependence of human settlement, and consequently pose various planning challenges. Urban settlements can be conceived of as interconnected systems made up of spatial agglomerations of people, buildings, infrastructures and administrative and economic capacities. The Degree of Urbanisation (DoU) data set used for this paper identifies Urban Centres using criteria of population density (1,500 people per square kilometre), built-up density (50 per cent built-up) and total populations (50,000).(55) The DoU data set also recognises lesser degrees of urbanization, and urban statistics extended to include these Urban Clusters are provided in the Supplementary Materials.
Urban Centres are the focus in the main body of this article because there is more international agreement on the populations of these more populous urban settlements than on Urban Clusters,(56) and because Urban Centres would be expected to exhibit stronger economies of agglomeration, and to manifest more complex planning challenges. To be consistent with our definition of urban settlements as spatially concentrated systems involving people and built structures, it would be preferable if population and built-up densities were used in tandem to identify urban extents. Urban statistics based on such a definition are not yet readily available, however.
As indicated in note 55, with the DoU approach there is a threshold through which land can be incorporated in Urban Centres based on its high built-up density (50 per cent), just as land can be incorporated based on its high population density (1,500 people per km2). There is however no equivalent built-up density threshold for identifying the smaller or less dense Urban Clusters. Moreover, the 50 per cent for built-up density threshold for Urban Centres is far higher in relative terms than the 1,500 threshold for population density, and was introduced to prevent the North American cities of relatively low population density from being identified as being made of multiple Urban Centres. It was not intended to give equivalent recognition to people and built-up land in constituting urban extents. Thus, for the DoU data set we use, Urban Centres have an average global population density (5,400 people per km2) over three times the population density threshold, and an average built-up density (45 per cent) less than the built-up threshold (see Table 10a, Supplementary Materials). (By way of contrast, the smaller Urban Clusters have an average population density of 1,500 people per km2 and an average built-up density of 19 per cent, as derived from Table 10e, Supplementary Materials.)
e. Other data sets
In addition to these key data sets, we assembled data on GDP in 2015.(57) These data are not part of the core approach or methods of this paper, but are meant to provide very rough indicators of economic performance useful in interpreting the results. We explore, for example, the extent to which wealthier regions have more built-up area per capita, as one would expect. One might also expect the built-up structures and people in poorer nations to be more vulnerable when facing equivalent hazards, owing to the cost of protective and other adaptive measures. In short, despite their crudity, GDP per capita provides useful context for interpreting some of the interregional differences, and a reminder of the potential importance of local economic conditions.
IV. Population and built-up area in and out of the leczs and the major deltas
This section reviews the statistics on population and built-up area in the LECZ10 and its deltaic areas (Figures 1–4, as well as Tables 1–9 in the Supplementary Materials summarize the relevant statistics). The sub-sections centre on different regions or regional comparisons, but they generally start with a review of population and built-up densities in each of three non-overlapping land types: outside LECZ10; in LECZ10 but not in a delta; and in deltaic LECZ10. This is followed by estimates of the relevant land areas, and the resulting population and built-up area within each land type. A summary of the growth in population and built-up land between 1990 and 2015 is also provided for each land type.
Global statistics
Section IVa examines the global figures, showing how much denser the LECZ10, and particularly the deltaic LECZ10, are compared to land inland of LECZ10. Section IVb compares Asia to the rest of the world, showing the extent to which Asia dominates the global LECZ10 and delta statistics. Section IVc compares patterns and trends within Asia, and the strikingly different ways in which the three major Asian regions contribute to Asia’s dominance of the LECZ10 and delta statistics, and the extent to which these results are rooted in a small number of key countries. Section IVd examines the regional (continental) contributions for the rest of the world, including North America and Europe, which are the second and third largest contributors to built-up area in LECZ10 despite being among the lowest contributors of population. Statistics on LECZ05 are indicated in the figures and referred to in the text when especially notable.
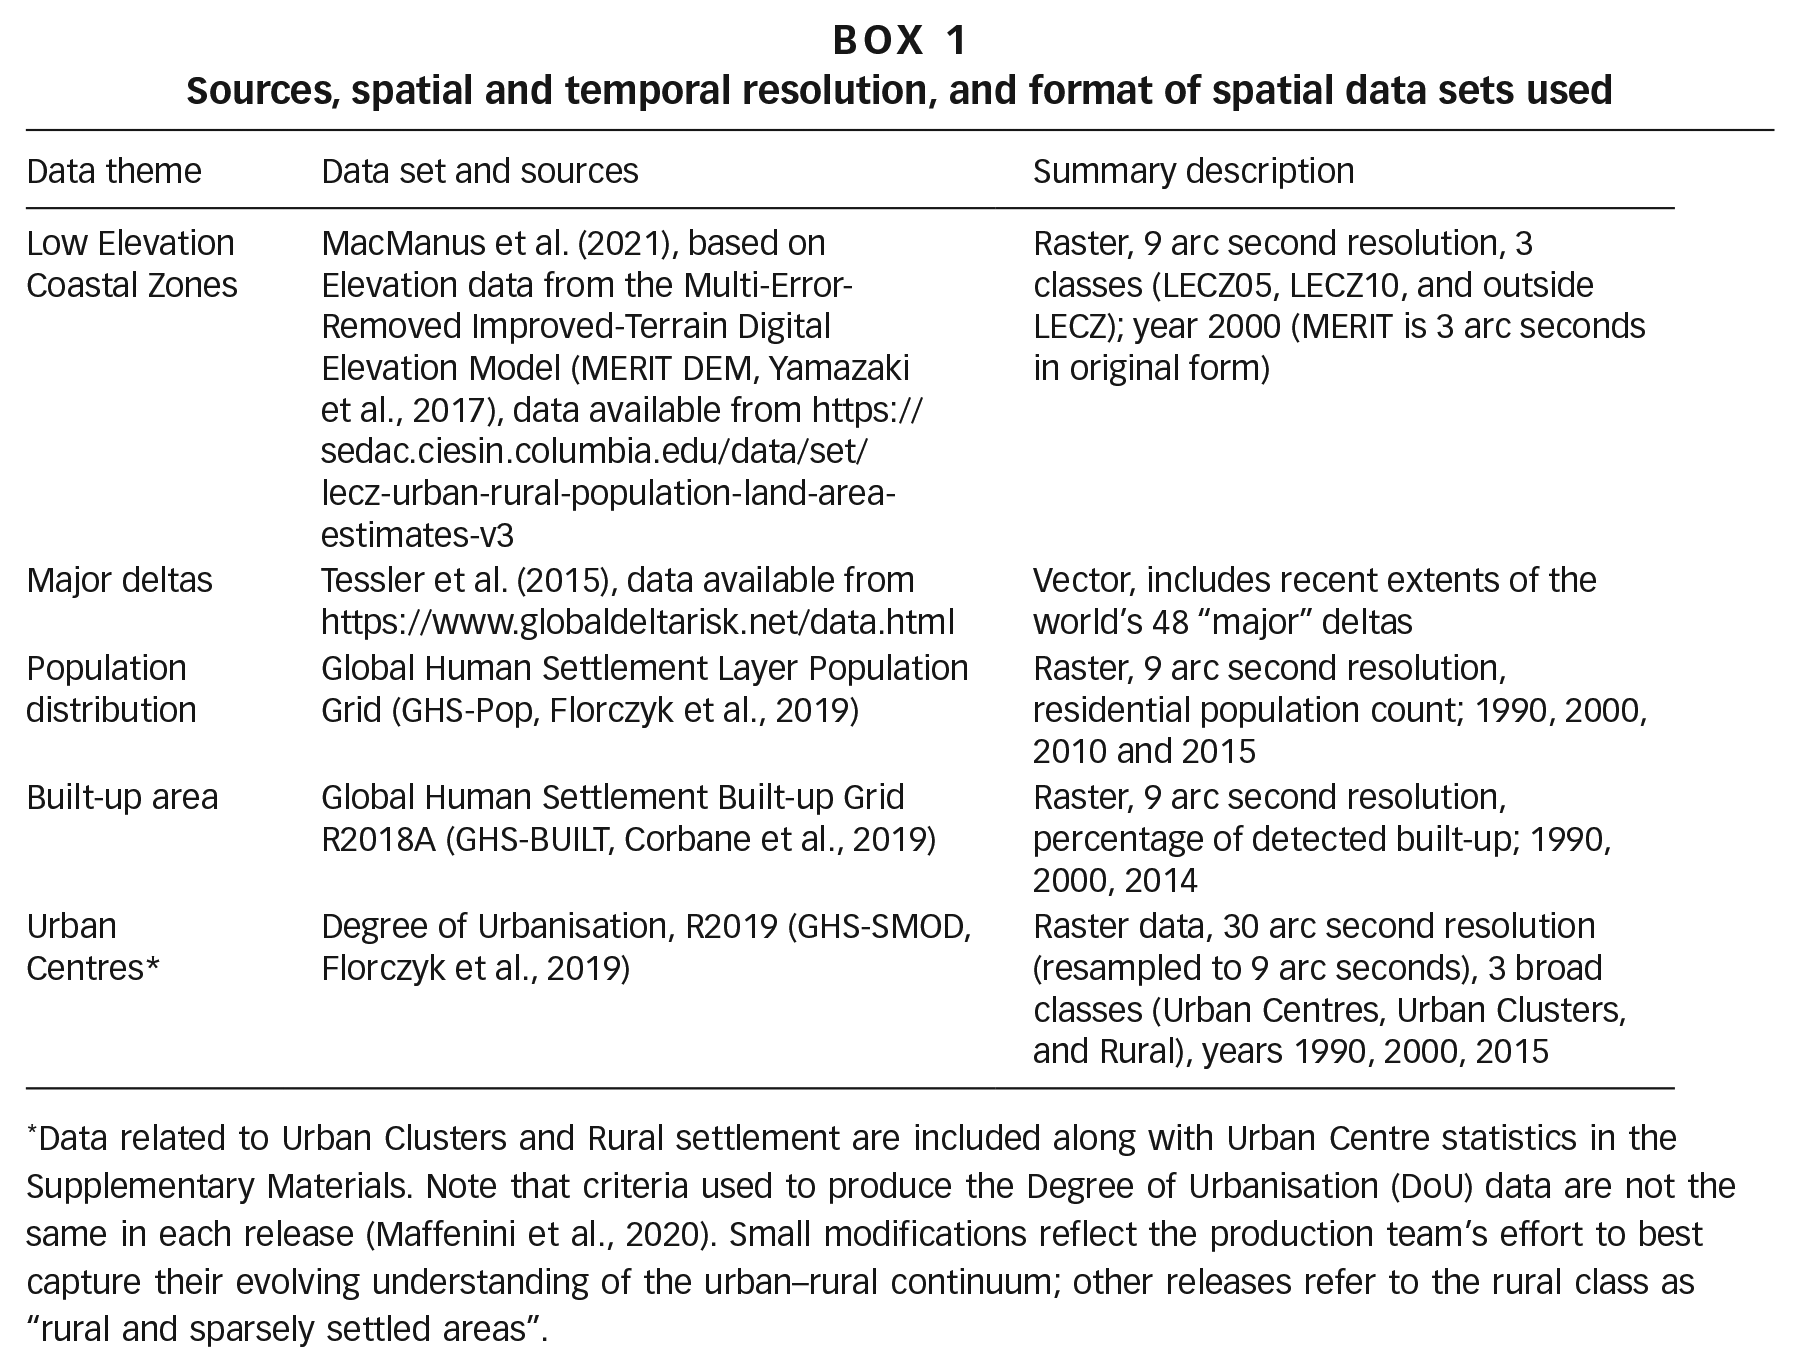
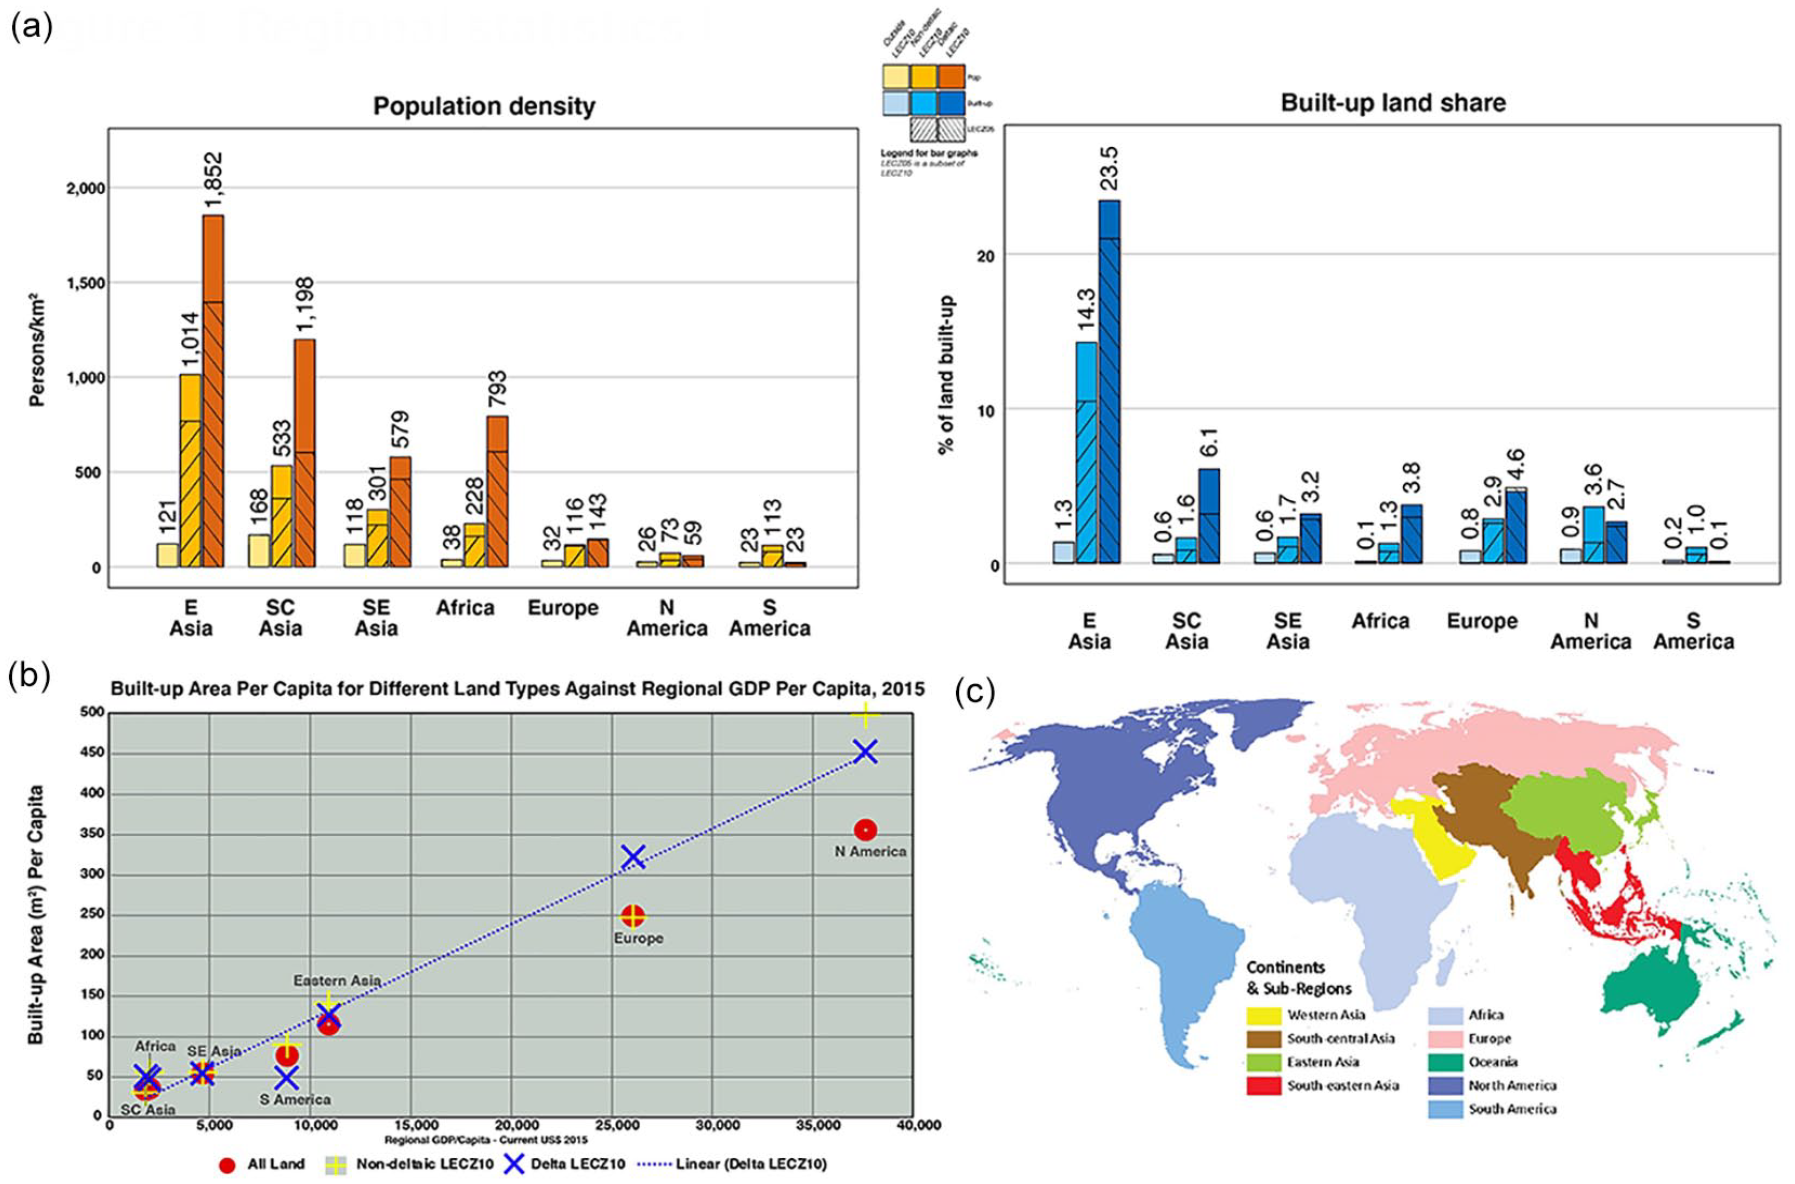
The continental regions and sub-regions used to summarize results in the sub-sections below are shown in Figure 3c. The map in Figure 1 indicates the layers (LECZ and deltas), illustrating primarily how small their area is. The map also indicates the approximate percentage of the population of each country residing in the LECZ10, giving an indication of the diversity within as well as across the regions/continents. In the later Figures 3–5 that compare the world regions, neither Western Asia nor Oceania are included, as they account for comparatively little of the world’s LECZ10 land, and less still of its deltaic LECZ10 land, population and built-up area. Statistics on these regions are included in the regional tables provided in the Supplementary Material.
a. Globally, population and built-up area are highly concentrated in LECZ10, and especially the deltaic LECZ10, where the highest growth rates are also found
Land in the deltaic LECZ10 is estimated to be 2.6 times more densely populated than non-deltaic LECZ10 land in 2015; and non-deltaic LECZ10 land is in turn 4.6 times as densely populated as land areas outside the LECZ10 (Figure 1a). The built-up densities display a similar pattern: the deltaic LECZ10 is 1.7 times as densely built-up as the non-deltaic LECZ10, and non-deltaic LECZ10 6.0 times as densely built-up as outside the LECZ (Figure 1a).
In practice, deltaic LECZ10 densities are regionally and locally (e.g. urban–rural) heterogeneous, as later sections of the paper demonstrate, but the average densities are high in absolute and not just relative terms: globally, average population density in LECZ10 in 2015 is estimated at 614 people per km2, with the built-up density of 5.1 per cent. To put this population density into context, land of less than half this average (300 people per km2) is considered sufficiently densely settled to justify inclusion in an Urban Cluster (see note 53).
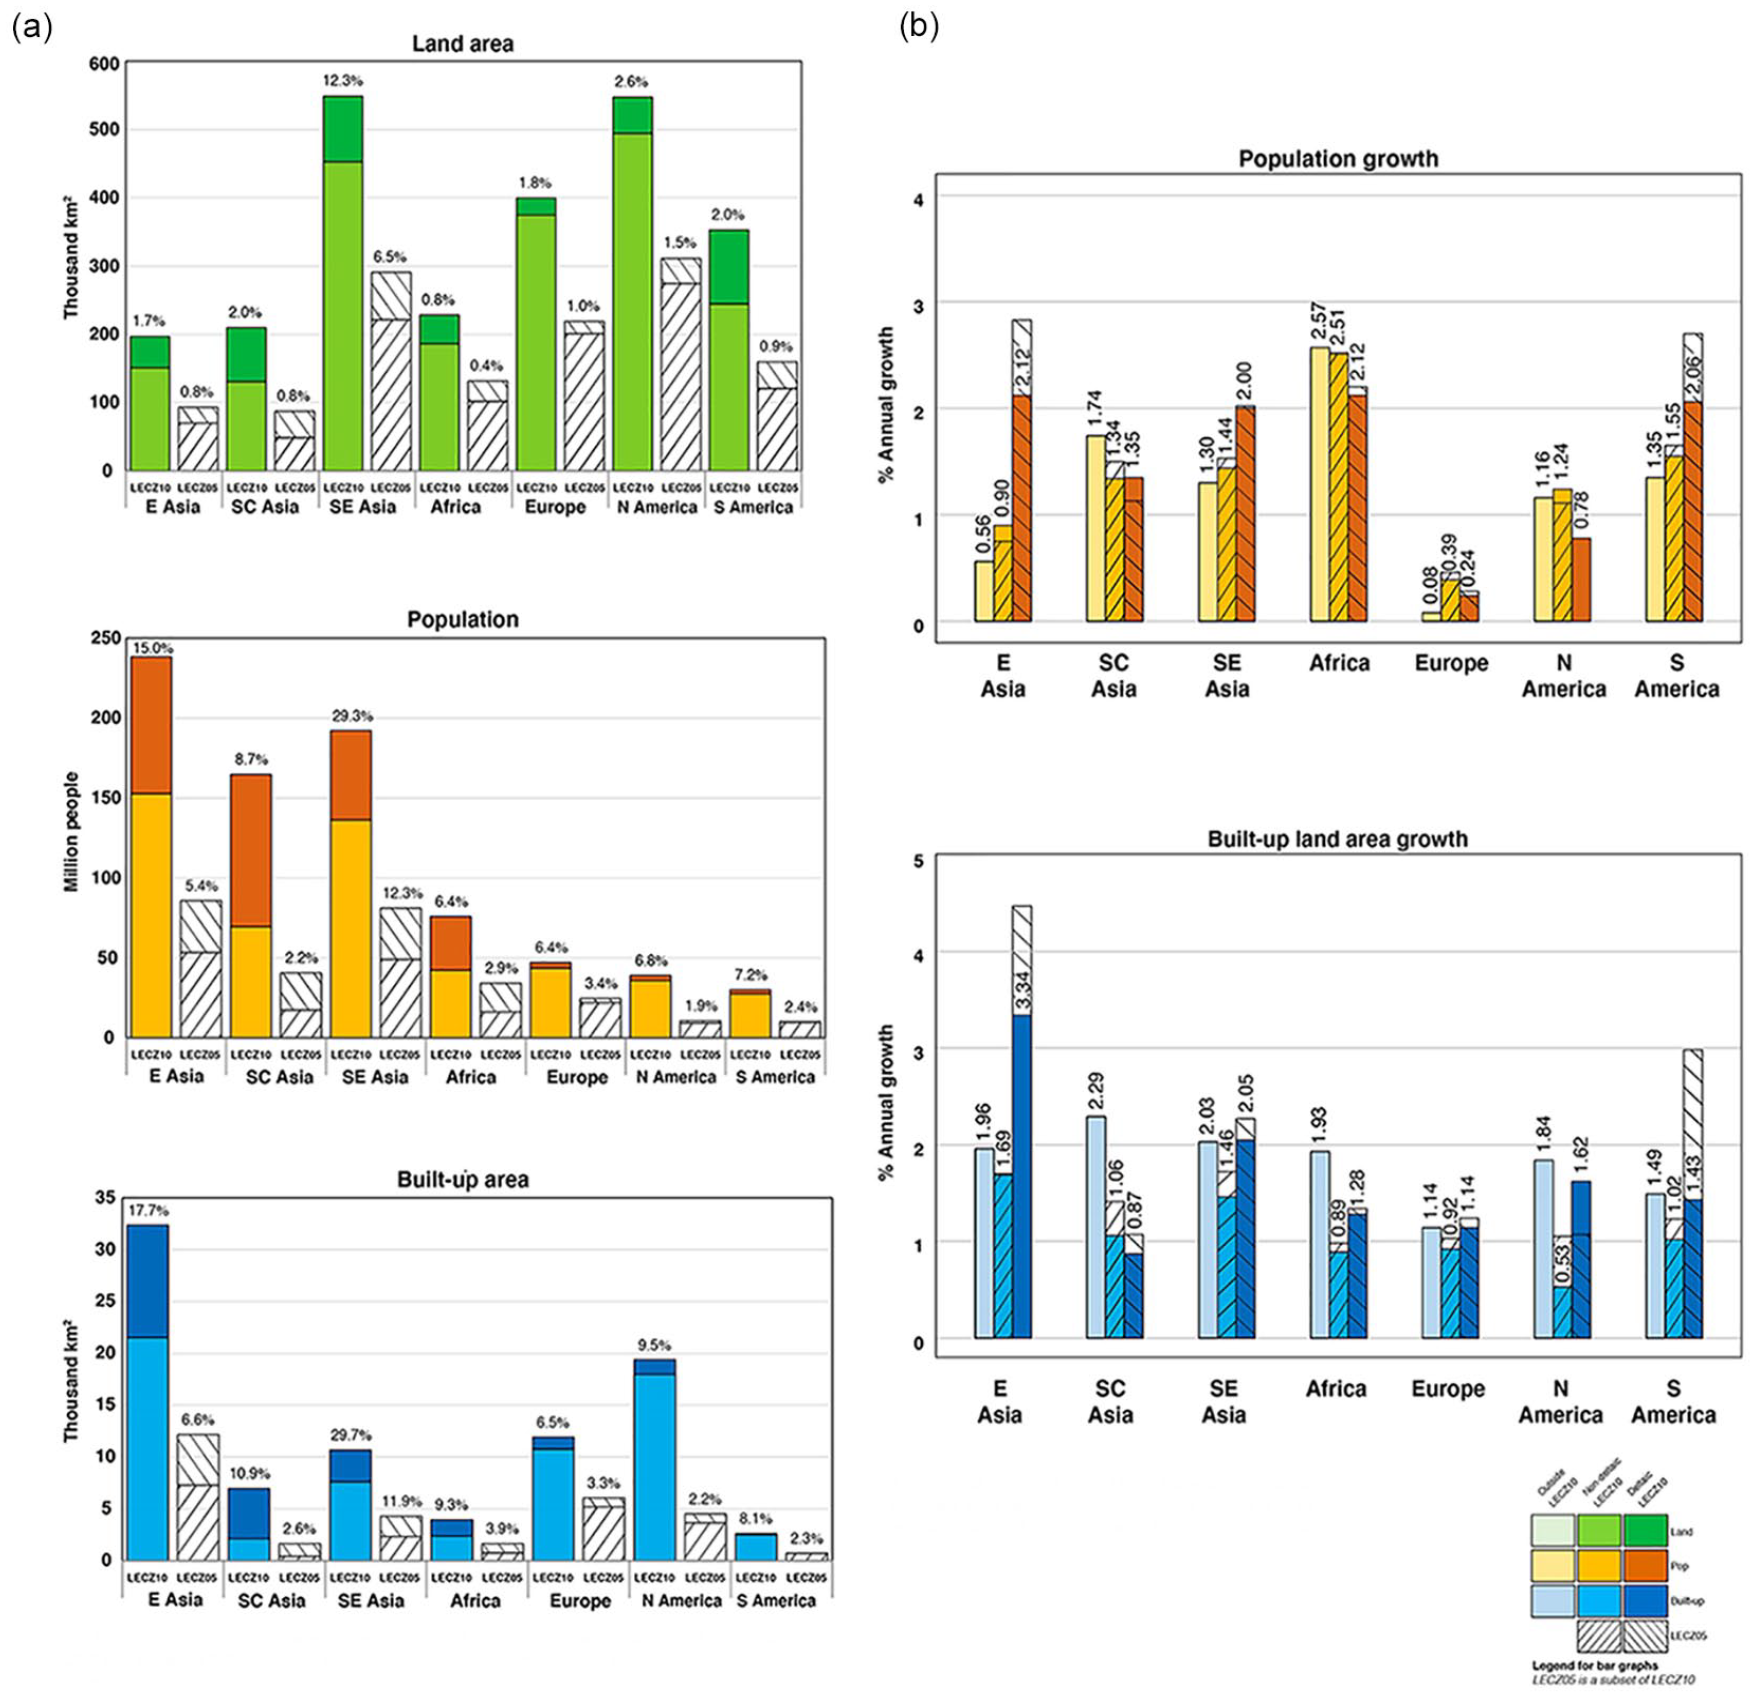
While the LECZ10 densities, and particularly their deltaic densities, are very high, their land areas are comparatively small. As illustrated in Figure 1c, the combined effect is that while LECZ10 only accounts for 2.1 per cent of the global land area (2,746,000 km2), it contained 11.1 per cent of the world’s population (or 815 million people) and 11.7 per cent of the global built-up area (or 91,000 km2). The deltaic figures are even more striking: with only 0.35 per cent of the world’s land (455,000 km2), the deltaic LECZ10 is home to 3.8 per cent of the world’s population (or 279 million people) and 3.0 per cent of its built-up area (or 23,000 km2).
As described in Section II, the comparatively dense settlement of the deltas and LECZs has a long history, but recent decades have seen growing concerns about climate change, as well as the environmental damage development often causes in deltas. Figure 1d illustrates the growth rates of population and built-up area in and out of the deltaic and non-deltaic areas of LECZ10, between 1990 and 2015. It shows the historical pattern being amplified, particularly for the deltaic LECZ10. Population growth is significantly higher in LECZ10 than outside it, entirely because of considerably high growth rates (1.77 per cent a year) in the deltaic LECZ10. For built-up land, the growth rate in the overall LECZ10 is actually lower than outside, but the deltaic LECZ10 had the highest growth rate (2.14 per cent).
LECZ05
For both deltaic and non-deltaic areas, the LECZ05 is generally more hazard-prone than LECZ10, but we have given it less attention as its population and built-up statistics are less certain.(58) As indicated in Figure 1a at the start of this sub-section, the estimated densities of both population and built-up densities are roughly a third lower in LECZ05 than in LECZ10, though the population densities are more sharply lower in deltaic areas and the built-up densities more sharply lower in the non-deltaic areas. These lower densities likely reflect efforts to avoid building or living in the more risk-prone areas, though even these lower densities are far higher than those outside LECZ10.(59) As shown in Figure 1c, only about half the land in LECZ10 is in LECZ05, with roughly similar proportions for deltaic and non-deltaic land. The result is that LECZ05 contains only about a third of the population and a third of the built-up area of LECZ10 (Figure 1c).
The population and built-up area growth rates, however, are considerably higher in the deltaic LECZ05 than in the deltaic LECZ10 (Figure 1d). Since the growth rates in the deltaic LECZ10 are themselves higher than those in the non-deltaic LECZ10 or outside LECZ10, those of the deltaic LECZ05 are by far the fastest growing areas, with population growth reaching almost 2 per cent and built-up area exceeding 2.5 per cent. Again, the LECZ05 estimates would seem to suggest that since 1990 the most hazard-prone areas have been growing fastest.
b. Asia’s domination of the global statistics on population and built-up area in the LECZ, and especially the deltaic LECZ
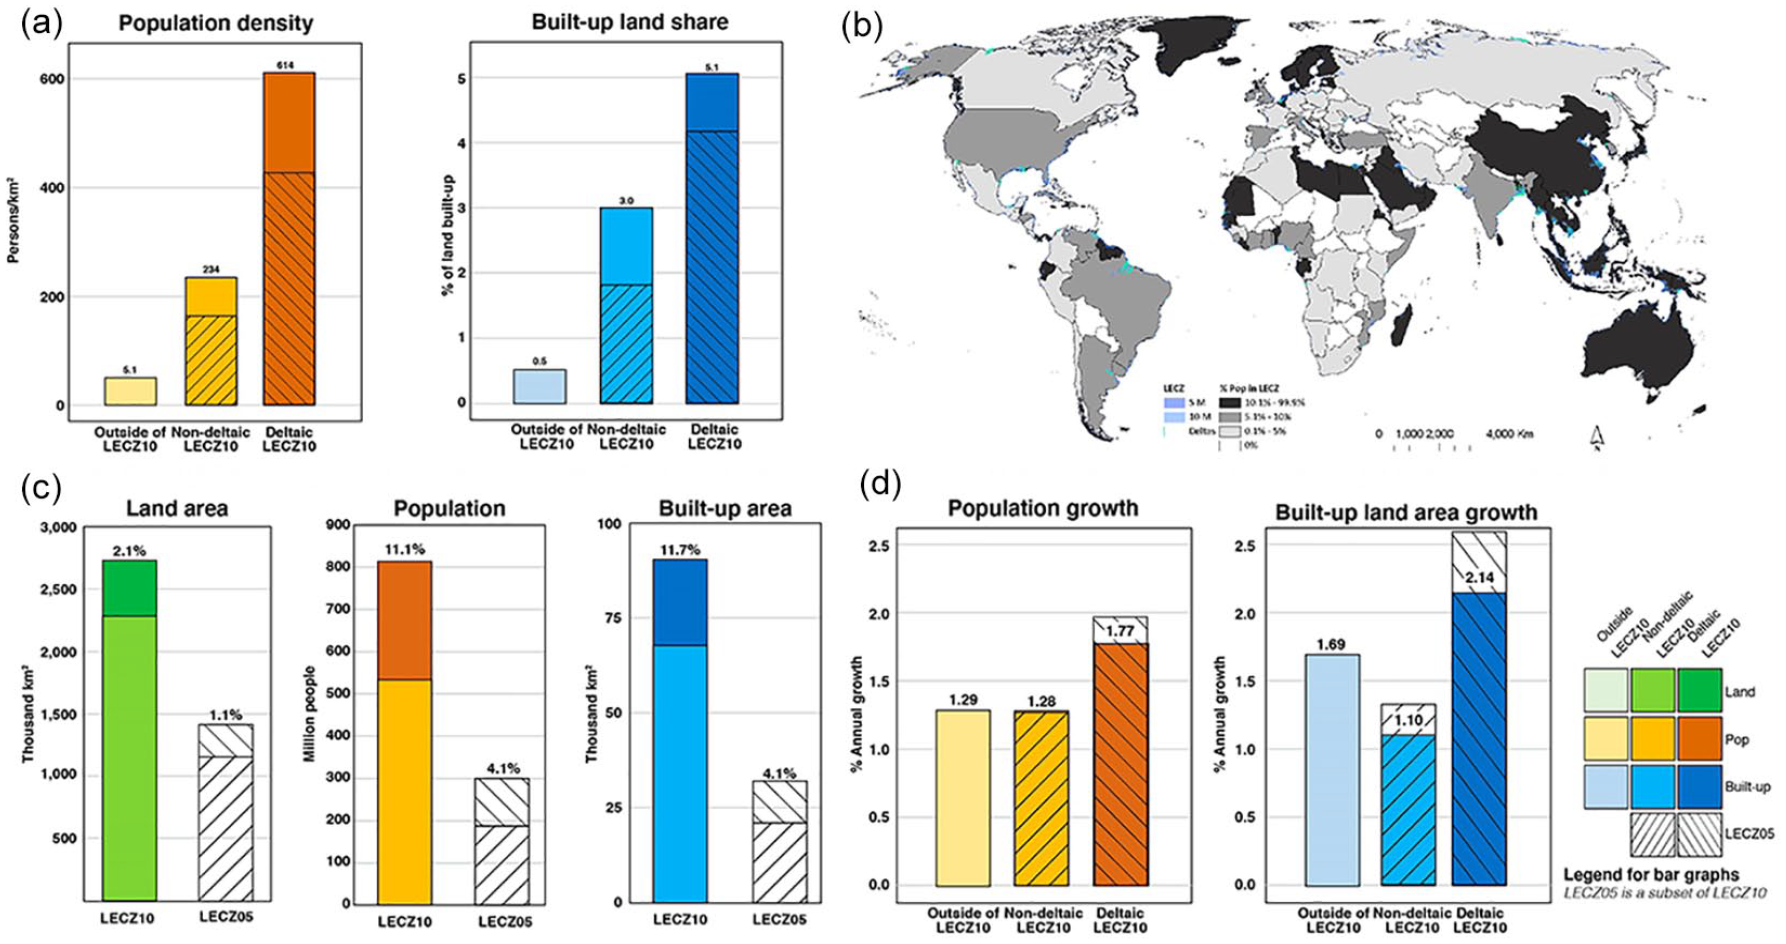
Overall, Asia accounts for 24 per cent of the world’s land, 36 per cent of the world’s LECZ10 and 49 per cent of its deltaic LECZ10 (see Table 5M, Supplementary Materials). Asia’s disproportionate share of land in low-elevation deltas reflects its physical geography (e.g. much of Asia being downstream of the Himalayas), its rainfall patterns (e.g. the Asian monsoons) and the water dynamics where the major rivers reach the sea (e.g. the comparative lack of ocean currents of the sort that prevent sediment from accumulating at the mouth of the Amazon). As illustrated in Figure 2b, many Asian countries have over 10 per cent of their population in LECZ10, and there are many deltas found across the continent. As described in more detail below, Asia’s deltaic lands are much more densely settled than those in other regions, putting large numbers of people and large amounts of property at risk from growing coastal hazards. Also, the extremely high population and built-up densities in Asia’s (deltaic) LECZ10 are indicative of high pressure being put on local environments.
In both Asia and the rest of the world, there are similarly large differentials in population densities between outside the LECZ10 and in non-deltaic LECZ10, and then between non-deltaic and deltaic LECZ10, with slightly higher differentials in Asia. But Asia stands out with its far higher population densities for every land type (Figure 2a): Asia’s inland population density is 4.5 times as high as the rest of the world, its non-deltaic LECZ10 density 4.6 times as high, and its deltaic LECZ10 density 5.8 times as high. In absolute terms, Asia’s LECZ10 deltas have an average of 1,059 people per km2 compared to just 184 people per km2 in the deltaic LECZ10 elsewhere.
Asian and rest of world statistics
For built-up densities, Asia displays a similar pattern of increasing density towards the coast, with non-LECZ10 densities the lowest and deltaic densities the highest (Figure 2a). Outside Asia, built-up densities are about five times as high in the non-deltaic LECZ10 as outside the LECZ10, but then fall slightly in the deltaic LECZ10. Asia’s built-up area densities are only about double those in the rest of the world outside the LECZ10 and in the non-deltaic LECZ10, and even the 4.6-fold difference in deltaic LECZ10 densities is not as large a differential as for population densities.
As of 2015, Asia accounted for 60 per cent of the world’s population and 39 per cent of its built-up area (Table 4, Supplementary Materials). These statistics coupled with the high population and built-up densities in Asia’s LECZ10 explain its dominance of the global LECZ10 population and built-up area. Asia’s share of population and built-up area in the LECZ10 reached 76 per cent and 56 per cent respectively. Even more significantly, Asia’s share of global population and built-up area in the deltaic LECZ10 rises to 85 per cent and 81 per cent (derived from Table 5, Supplementary Materials).
In other words, Asia’s LECZ10 population of over 600 million people is three times that of the rest of the world. Its deltaic LECZ10 population of 237 million is more than five times that of the rest of the world (Figure 2c). The built-up area figures are less striking, but still impressive. Asia’s LECZ10 has 5,200 km2 of built-up land, about a third more than the rest of the world, and Asia’s 1,900 km2 of built-up land in deltaic LECZ10 is almost five times that in the rest of the world (Figure 2c).
Asia’s population growth rates, from 1990 to 2015, are comparable to those in the rest of the world, with the highest rate of growth (1.8 per cent) in the deltaic LECZ10 (Figure 2d). However, Asia maintains these high growth rates from much larger starting points, so the absolute increase in population every year is considerably higher than that in other regions combined, and adds population to the most densely settled world region, placing additional burdens on sustainable development planning efforts.
Asia stands out for the much higher growth rate of its built-up area in all categories: outside the LECZ10, in the LECZ10 and the deltaic LECZ10. Moreover, Asia’s deltaic LECZ10 growth rate for built-up areas (2.3 per cent) is considerably higher than any other built-up growth rates in Asia, or any in the rest of the world (Figure 2d). Such figures reinforce concerns that Asia’s settlement patterns are locking in high exposure to environmental hazards and imposing increasing pressure on its ecologically rich and fragile deltas.
LECZ05
As noted in the previous section, globally LECZ05 is estimated to contain about half the land of LECZ10, with somewhat lower densities of population and built-up area, and as a result only about a third of the population and built-up land of LECZ10 (all estimates for 2015). Asia dominates most of the LECZ05 statistics in much the same way as it does the LECZ10 statistics. Overall, Asia is estimated to contain 79 per cent of the world’s deltaic LECZ05 population and 75 per cent of its built-up area, while comparable figures for deltaic LECZ10 are 85 per cent and 81 per cent (Figure 2c). Alternatively, Asia contains an estimated 69 per cent of the world’s non-deltaic LECZ05 population and 50 per cent of its built-up area, while comparable figures for non-deltaic LECZ10 are 71 per cent and 48 per cent. The especially high 1990–2015 growth rates of population and built-up area in the deltaic LECZ05 are evident in both Asia and the rest of the world, though it is skewed to Asia in the case of built-up areas, with the built-up area in Asia’s deltaic LECZ05 growing at 3.2 per cent as compared to 1.2 per cent in the non-Asian deltaic LECZ05 (Figure 2d).
c. Asia’s three major regions and their deltas contribute very differently to Asia’s dominance of the LECZ statistics, with East Asia the stand-out region(60)
As described in more detail below, each of the major Asian regions can claim its particular superlatives when it comes to the LECZ/delta statistics for 2015. South-Eastern Asia has the largest LECZ10 area of all world regions. Eastern Asia has the most densely populated and built-up LECZ10. South-Central Asia has the largest population in the deltaic LECZ10. However, bringing all the areas and densities together, Eastern Asia stands out as having more population and built-up area in LECZ10 than the other Asian regions, or any of the other continents of the world. No Asian region has unambiguously higher growth rates in LECZ10 or its deltas (1990–2015), though East Asia’s deltaic LECZ05 stands out as having the highest rates of both population and built-up area growth. As also illustrated below, within most of these regions there is equally important variation between countries. In this sub-section, region refers to both sub-regions within Asia and other continental regions.
Regional statistics I
Eastern Asia’s deltas have a population density of 1,852 people per km2, and a built density of 23.5 per cent – over half again higher than those in its non-deltaic LECZ10, and an order of magnitude higher than those outside the LECZ10 (see Figure 3a and Table 7, Supplementary Materials). If Eastern Asia’s deltaic LECZ10 population were spread evenly across its land area, virtually all of this deltaic land would be in Urban Centres (see note 55 for definition of Urban Centres). Compared to deltaic and non-deltaic LECZ10 population densities in other regions, Eastern Asia’s exceeds the other Asian regions and Africa by between 1.5 and 4.4 times, respectively. Yet despite these extremely high population densities, levels of East Asia’s built density in LECZ10 are even more extreme, relative to other Asian regions. Even outside LECZ10, Eastern Asia’s built-up densities in 2015 were over twice as high as the other Asian regions, though its population densities were comparable (Figure 3a). In LECZ10, East Asia’s built densities also exceed the other Asian regions’ built densities by a factor over twice that for population densities. In effect, the figures imply that in Eastern Asia, whatever the land type, there is on average more than twice the built-up area per capita as in the rest of Asia. This is likely to be in part because Eastern Asia is considerably wealthier than the other Asian regions, and wealth is correlated with more built-up area per capita.(61)
With these densities, and despite having the smallest area in the LECZ10 of any region (Figure 4a), Eastern Asia had the largest population (240 million) in LECZ10, and by far the most built-up area (33,000 km2) in the LECZ10 (Figure 4a) of any region in Asia or the rest of the world. It also had the second largest population in the deltaic LECZ10 (86 million) and the largest built-up area (11,000 km2), again in Asia or globally.
The underlying data (see note 60) indicate that China accounts for most of these large populations and built-up areas. In 2015, China accounted for 82 per cent of East Asia’s LECZ10 population and 79 per cent of its built-up area in 2015, with both shares rising to 99 per cent for the deltaic LECZ10 (with Japan contributing most of the rest of the population and built-up area in the non-deltaic LECZ10 areas).
Regional statistics II
With 549,000 km2 of land in LECZ10, South-Eastern Asia accounts for over half of Asia’s LECZ10 land and 20 per cent of the world’s (Figure 4a) – even though it accounts for only 14.5 per cent of Asia’s overall land area and 3.4 per cent of the world’s. Its LECZ10 densities display the pattern common to all regions where overall LECZ10 densities are high: they are highest in the deltas. However, its large areas of LECZ10 land are not very densely settled, and even less built-up, at least compared to other Asian regions (see Figure 3a). Moreover, there is great heterogeneity among the major South-Eastern Asian nations. The two largest contributors to South-Eastern Asia’s population and built-up area in LECZ10 were Indonesia and Vietnam, which jointly accounted for 57 per cent of the region’s LECZ10 population, and 59 per cent of its built-up area. Indonesia contributed somewhat more of the population and Vietnam somewhat more of the built-up area. These similarities hide large differences arising from Indonesia being the world’s largest archipelagic country, and Vietnam being the second most deltaic country (having 13 per cent of its land in deltas, second only to Bangladesh with 49 per cent). Of South-Eastern Asia’s 463,000 km2 of non-deltaic LECZ10, Indonesia accounts for 65 per cent and Vietnam accounts for only 5 per cent, while of the 96,000 km2 of deltaic LECZ10, Vietnam accounts for 44 per cent and Indonesia for only 2 per cent. Thus, while Indonesia elevates South-Eastern Asia’s LECZ10 land share and land area, it lowers the LECZ10 densities. It might also seem that Vietnam only accounts for similar shares of the population and built-up area because its deltaic LECZ10 is more heavily settled than Indonesia’s non-deltaic LECZ10. While this is the case, Vietnam’s non-deltaic LECZ10 actually accounts for slightly more population and appreciably more built-up area than does its slightly larger deltaic LECZ10. By comparison, the two other major deltaic countries in South-Eastern Asia, Thailand and Myanmar, have the more typical pattern of densities for Asia, with their deltaic LECZ10 more densely settled than their non-deltaic LECZ10.
South-Central Asia does not have the large LECZ10 land areas of South-Eastern Asia, or the exceedingly high LECZ10 built-up and population densities and quantities of Eastern Asia. It does, however, have an especially large share of its LECZ10 land in deltas, and more people living in deltaic LECZ10 than any other world region (Figure 4a). What is notably lower is its built-up density, reflecting its having the lowest built-up area per capita in the world. Bangladesh and India are the two South-Central Asian countries with the highest populations and built-up areas in LECZ10, combining to account for 93 per cent of both the built-up area and population in the region. Bangladesh accounts for somewhat more of the built-up area and India more of the population. The more important distinction is that for Bangladesh, 83 per cent of the LECZ10 population and 92 per cent of the LECZ10 built-up area were in deltas, while for India these shares were 42 per cent and 53 per cent respectively. But while the Indian shares are much lower than those of Bangladesh, they are high compared to the rest of the world.
As for growth rates (1990–2015), Eastern Asia’s overall LECZ10 population growth rate is lower than the other two Asian regions, but the deltaic growth rates are about the same. For built-up area, East Asia’s overall growth in LECZ10 is similar to that of the other regions, but the deltaic rates are far higher (Figure 4b). This relatively rapid growth in deltaic populations and built-up areas in East Asia reflects China’s dominance of East Asia’s statistics, and an economic strategy that concentrated migration and construction in what have become city-regions along the coast. Between 1990 and 2015, China also accounted for almost all of Eastern Asia’s increase in LECZ10 population (97 per cent) and built-up area (99 per cent). East Asia’s spatial patterns of settlement and construction suggest that the region’s development trajectory has been locking in high exposure to emerging climate risks and imposing severe pressures on particularly rich and fragile ecosystems. By comparison, the growth rates for South-Central Asia’s population are higher outside than inside the LECZ10 and those for built-up area are far higher. These growth patterns could shift in the future, particularly if, for example, China’s economic growth continues to subside, and South-Central Asia adopts an economic strategy more similar to China’s. However, it is hard to see Eastern Asia’s high deltaic population and built-up densities actually declining without radical policy shifts or major environmental disasters.
Despite the sizeable differences among the Asian regions, the differences with the rest of the world are starker, particularly when it comes to population figures. All of the three Asian regions have larger LECZ10 and far larger deltaic LECZ10 populations than any other world region: Africa is the only region that comes close, with an LECZ10 population that is still only half that of South-Central Asia. For built-up area, the three Asian regions top the list when it comes to built-up area in the deltaic LECZ10, but for the non-deltaic LECZ10 even East Asia is only somewhat above North America.
LECZ05
Generally, the variations in the LECZ05 statistics across the three regions of Asia follow similar patterns to LECZ10, but with roughly proportionally lower areas of land and densities and quantities of population and built-up area. Shifting to LECZ05 from LECZ10 brings down the populations and built-up areas by the biggest share in South-Central Asia, and least in South-Eastern Asia, but Eastern Asia still has the highest numbers and South-Central the lowest. Similarly, the deltaic shares shift somewhat, but as for LECZ10, South-Central Asia maintains the highest shares of LECZ05 population and built-up area in deltas. For growth rates, the differences between the Asian regions is more striking, and East Asia’s dominance of the growth statistics are accentuated. It is only in East Asia that deltaic LECZ05 has much higher growth rates in population and built-up area than deltaic LECZ10 (Figure 4b). For population, the East Asia growth rate of 2.8 per cent in the deltaic LECZ05 compares with 2.1 per cent in the deltaic LECZ10, and for built-up the 4.5 per cent growth in the deltaic LECZ05 compares with 3.4 per cent in deltaic LECZ10. As a result, while East Asia dominates Asia’s growth statistics when considering the larger deltaic LECZ10, it dominates the deltaic LECZ05 growth statistics even more comprehensively.
d. The rest of the world contributes less to global LECZ population and built-up area concentrations than Asia, but displays important regional differences
The non-Asian regions are a study in contrasts. Of the non-Asian regions, Africa has the least LECZ10 land yet the most LECZ10 population. North America and Europe have the most LECZ10 land and by far the most LECZ10 built-up area but even combined have less LECZ10 population than Africa. And South America has the largest deltaic LECZ10 but the least population and built-up area in LECZ10, and particularly in the deltaic LECZ10. The anomaly noted above concerning the Amazon “delta” helps to explain South America’s low levels of deltaic LECZ10 settlement densities. Differences in regional income levels also help to explain why regions with high LECZ/deltaic population densities do not always present high built-up densities, and vice versa. Higher-income regions would be expected to have more built-up area per capita than lower-income regions, whether or not an area is in the LECZ or a deltaic LECZ. Figure 3b illustrates that this is indeed the case, though the regional averages hide considerable intraregional diversity. Indeed, between the poorest regions and the wealthiest, the square metres of built-up land per capita in the deltaic LECZ10 increases almost 10-fold – from 50 to almost 500.
Africa’s LECZ10 population profile is, as illustrated in Figures 3a and 4a, the non-Asian one that comes closest to those of the Asian regions. Moreover, the ratio of its population density inside to outside the LECZ10 was similar to Eastern Asia’s (9 as compared to 10, whereas all other major regions have ratios between 3 and 5). However, Eastern Asia had by far the highest per capita GDP of the major Asian regions, while Africa has by far the lowest per capita GDP of the non-Asian regions. Probably as a result of this, Africa has by far the lowest built-up area per capita of the non-Asian regions (52 m2 in LECZ10 and 36 m2 on all land), while Eastern Asia has by far the highest built-up area per capita (136 m2 in LECZ10 and 115 m2 on all land) of the Asian regions. As a result, East Asia’s exceptionally high LECZ/deltaic population densities are accompanied by even more exceptionally high (for Asia) built-up densities, while Africa’s are accompanied by unexceptional built-up densities. This in turn explains why Africa has the largest LECZ10/deltaic populations outside of Asia, but only a very small share of the LECZ10 built-up area.
Another important point of difference is that Africa’s high inside/outside LECZ10 population density ratios are not a new thing: between 1990 and 2015, Africa’s population was on average growing considerably faster than in other regions, but Africa’s population was growing fastest outside the LECZ10, slightly less in the non-deltaic LECZ10 and considerably less in the deltaic LECZ10.
Within Africa, Egypt’s Nile delta, whose LECZ10 has a population density of 1,493 people per km2 despite a built-up density of only 7.4 per cent, has a major influence on the continent’s overall statistics. It accounts for about four-fifths of the continent’s deltaic LECZ10 population and built-up area, and a third of the continent’s overall LECZ10 population – despite about half of the delta’s population and built-up area being outside LECZ10. As such, without the Nile delta Africa would no longer stand out among the non-Asian continents as having a much higher population in the deltaic LECZ10. The Niger delta in Nigeria is the next largest contributor and adds a further 20 per cent of Africa’s LECZ10 population and 18 per cent of its built-up area.
In contrast to Africa, North America and Europe’s built-up densities and areas are on the high side, while their population densities and quantities are among the lowest (Figure 3a). Their built-up densities are only a small fraction of East Asia’s, but are sufficiently high that, combined with their LECZ10 land areas, they have the second and third largest expanses of built-up LECZ10 land, with deltas only playing a minor role (Figure 4a). North America and Europe are also the wealthiest and second wealthiest regions, and not surprisingly it is the comparatively high built-up areas per capita (499 and 253 m2) as compared with the global average of 111 (Figure 3b) that is key to explaining their much larger share of the LECZ10 built-up area than of population. Europe and North America also stand out for considerably lower rates of population growth in the deltaic LECZ10 than the non-deltaic LECZ10, although the growth of built-up area is faster (Figure 4b).
At the national level,(62) the North American figures are dominated by the United States, which accounts for 43 per cent of the region’s LECZ10 land, 91 per cent of its built-up area and 65 per cent of its population. For Europe, the Netherlands accounts for 25 per cent of the LECZ10 population and 26 per cent of its built-up area, despite having less than 0.2 per cent of the land. No other country stands out as having large shares of the LECZ10 populations or built-up area in Europe, but Russia’s large area of relatively sparsely settled LECZ10 helps explain Europe’s low LECZ10 densities: Russia accounts for 58 per cent of Europe’s LECZ10 land area, but only 8 per cent of its LECZ10 population and 4 per cent of its LECZ10 built-up area. Remove Russia, with its long and lightly inhabited northern coastline, and Europe’s LECZ10 population and built-up densities would more than double.
South America is most immediately striking for its low densities and quantities of both LECZ10 population and built-up area, despite having more “deltaic” LECZ10 land than any other of the regions shown in the figures, as well as a moderate amount of non-deltaic LECZ land (see Figures 3a and 4a). Indeed, not only are South America’s LECZ10 population and built-up densities lower than any other region, its deltaic densities are orders of magnitude lower (although its population growth rate is among the highest, from this low base). The country that stands out here is Brazil, whose Amazon delta is sometimes described as the biggest delta in the world, and sometimes described as not a delta at all. Brazil’s deltaic LECZ10 accounts for 65 per cent of the deltaic LECZ10 land area in South America, and has a population density of only 22 people per km2, and a built-up density of only 0.08 per cent. Without it, South America’s deltaic LECZ10 would be considerably smaller but its deltaic densities would only change marginally.
LECZ05
As with the Asian regions, in Africa, Europe and North and South America the general tendency is for population and built-up densities to be lower in LECZ05 than in LECZ10 for both deltaic and non-deltaic areas, with the absolute differences in population densities particularly large in Africa, which has by far the highest densities in both LECZs, in and out of deltas. A ranking of non-Asian regions according to how many people or built-up area there are in deltaic or non-deltaic LECZ05 is similar to that for LECZ10, though for built-up area Europe has the largest amount of built-up land in LECZ05, while North America did for LECZ10. The deltaic shares shift somewhat, but the shares are low except in Africa where they account for about half of the people and built-up land in both LECZ05 and LECZ10. For the most part, in the non-Asian regions the population and built-up growth rates 1990–2015 were similar in LECZ05 and LECZ10 (both in and out of deltas) (Figure 4b). However, there was one stand-out non-Asian region (Latin America) which had much larger population and built-up area growth rates in the deltaic LECZ05, just as East Asia had in Asia. However, Latin America’s population and built-up area in the deltaic LECZ05 started out so small that even the very high growth rate only added about 320,000 people to deltaic LECZ05 in Latin America between 1990 and 2015, while in East Asia almost 16 million were added (see Table 9 in Supplementary Materials).
V. Urbanization in the leczs and their major deltas
This section turns to the levels of urbanization in the LECZ10 and its deltas, and the rate at which these areas have been urbanizing in recent decades. The conventional measure of the level of urbanization of a nation is the share of the population living in urban areas, and the measure of the rate of urbanization is the annual percentage rate at which this urban share is growing.(63) As noted in Section III (under Urban extents and urbanization) we use Urban Centre populations to quantify urbanization, as we are more concerned with the formation of what could be described as cities than of smaller towns and urban settlements (the appropriate cut-off along the rural–urban continuum is inevitably somewhat context dependent). For the purposes of this article, the share of land that is in Urban Centres is also a useful indicator of urbanization, as this both indicates the pressure urban development is imposing on the local environment, and provides an alternative and easily grasped measure of the extent to which people and their constructs are crowded into LECZs and deltas. Following a brief presentation of the shares of land in Urban Centres, the levels and rates of urbanization are presented for the different land types and regions examined in the previous section.
Globally, Urban Centres only occupy 0.5 per cent of the world’s land, and about 47 per cent of its population and 37 per cent of its built-up area (calculated from Table 11a in Supplementary Materials).(64) Before turning to the different levels of urbanization in different land types and regions, and how these levels of urbanization have been changing, it is worth noting that the population and built-up densities of land in Urban Centres vary significantly across both land types and regions. These differences deserve more attention than we can afford to devote to them here, but they make little difference to the principal conclusions being drawn in this article. Across the land types, the global average population and built-up densities of land in Urban Centres are lower in the LECZ10 than outside LECZ10, with population densities slightly higher in the deltaic than non-deltaic LECZ10, and built-up densities somewhat higher in the non-deltaic than the deltaic LECZ10 (see Table 10a in Supplementary Materials). The densities of land outside Urban Centres follow almost the opposite pattern and are highest in deltaic LECZ10, and lowest outside LECZ10 (Table 10c in Supplementary Materials). In effect, the rural–urban continuum takes a somewhat different form in the different land types and goes beyond simple differences in urban shares. The differences across regions are even larger, but with population and built-up densities moving in different directions, generally reflecting the regionally different ratios of built-up area per capita described above and presented in Figure 3b. Whatever the land type, the Urban Centre land of North America has the lowest average population density, and the average population densities of Urban Centre land in Africa, which are the world’s lowest, are several times lower. Alternatively, North American Urban Centre land has the highest built-up densities and these are several times higher than those of African Urban Centre land, which has the lowest built-up densities in its Urban Centre land.
In terms of levels of urbanization of land, a strikingly large share of the land in LECZ10 and especially the deltaic LECZ10 is in Urban Centres, as illustrated in Figure 5a. Globally, compared to land outside LECZ10, Urban Centres cover a six times larger share in the non-deltaic LECZ10 and a 16 times larger share in the deltaic LECZ10, where the share reaches 8 per cent. The shares are particularly high in Eastern and South-Central Asia, reaching an amazing 28 per cent in the deltaic LECZ10 of Eastern Asia. Globally, there are 487 million people and 43,000 km2 of built-up land in these LECZ10 Urban Centres (Table 11a in Supplementary Materials).
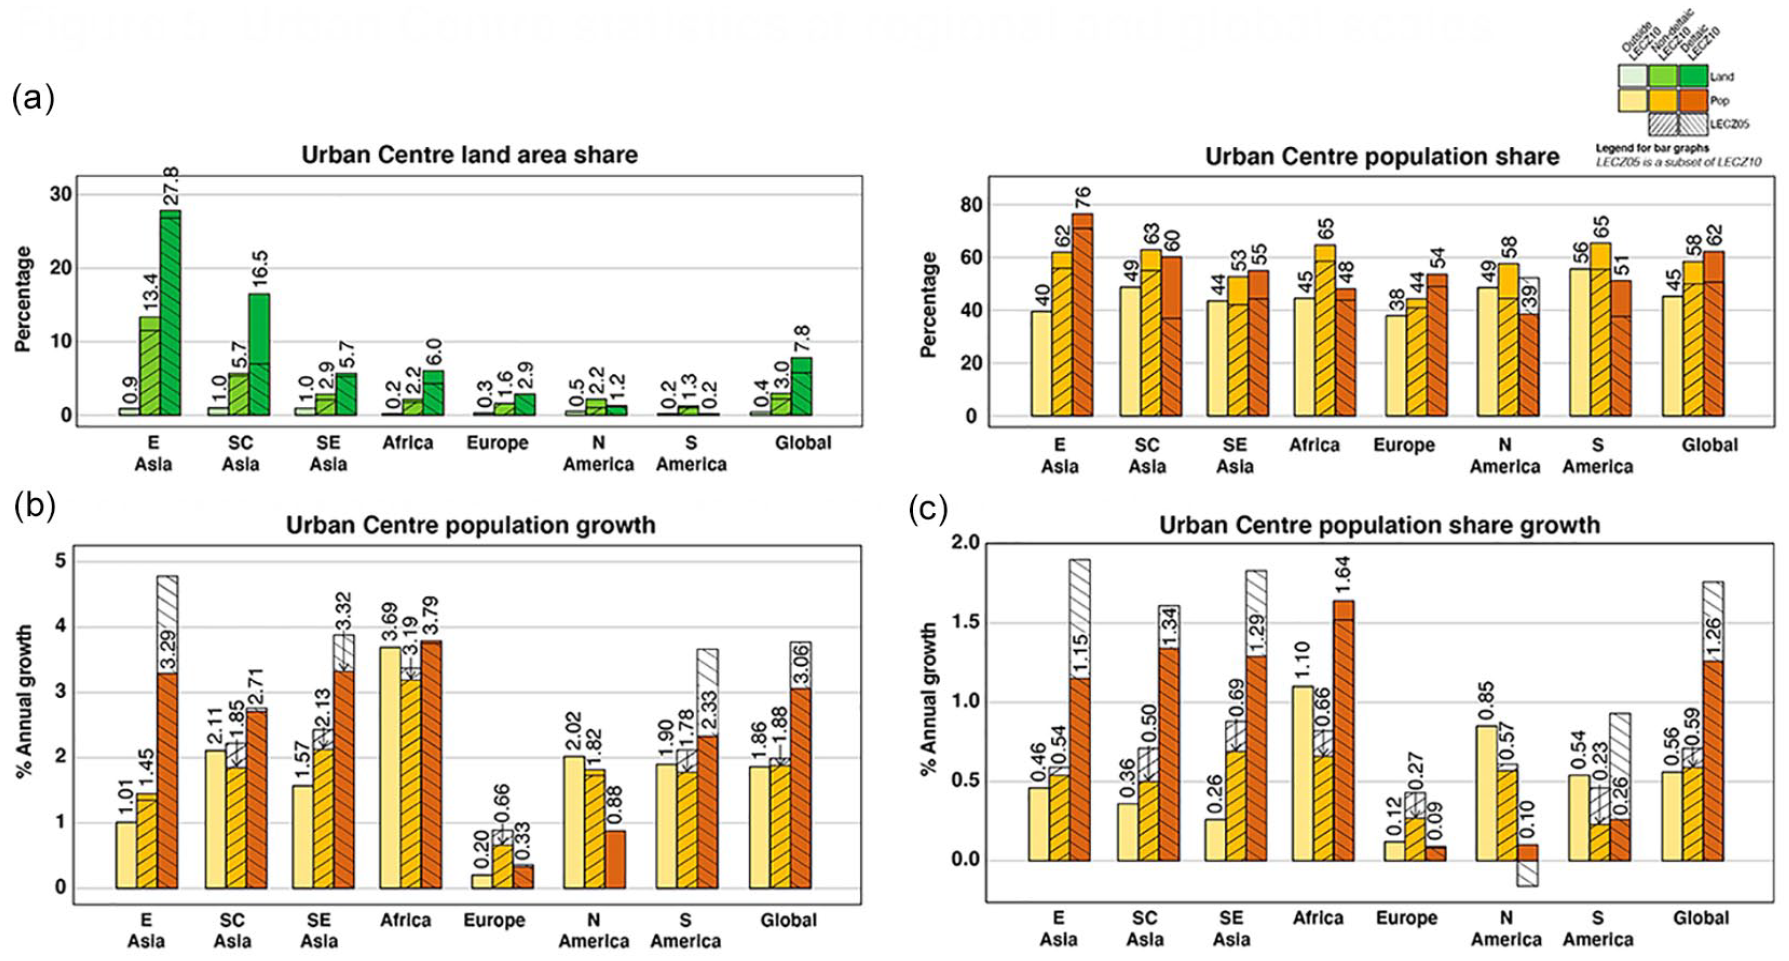
Urban Centre statistics at regional and global scales
In every region, the share of the population living in Urban Centres in LECZ10 is higher than outside LECZ10, but the differences are less striking, and in half the regions the shares are highest in the non-deltaic LECZ10 (Figure 5b). Eastern Asia is exceptional in having Urban Centre population shares that are almost twice as high in the deltaic LECZ10 as outside LECZ10. Generally, the differences in urbanization levels between outside and inside the LECZ10 and its deltas are not as sharp as the differences in the raw population densities illustrated in Figure 3a above. This is not especially surprising. It is not primarily population pressure but economic transformation that pushed almost half of the world’s population into the 0.5 per cent of land that is in Urban Centres (Tables 1 and 11a in Supplementary Materials). Indeed, modern urbanization emerged first in Europe and North America, when their overall population densities were far lower than Asia. In effect, LEZC10 and its deltaic areas are not just densely populated because they have a higher population share in Urban Centres: their land outside of Urban Centres is also comparatively densely populated.
The 1990–2015 global rate of Urban Centre population growth is about twice as high in deltaic LECZ10 compared to either non-deltaic LECZ10 or outside of LECZ10 (Figure 5b). Overall, Urban Centre population is growing fastest in Africa, where there is little difference in growth rates between the different land types, all of which have annual growth rates over 3 per cent. In all three of the Asian regions the Urban Centre population growth rates are around 3 per cent for the deltaic LECZ10, but considerably less on the other land types. Outside Asia, the growth rates are particularly low in Europe, and only exceed two in South America’s deltaic LECZ10.
Related, and equally striking, the rates of urbanization for the same period are about twice as high in the deltaic LECZ10 than in either the non-deltaic LECZ10 or outside LECZ10 (see Figure 5c). Again, this is driven primarily by Asia and to a lesser degree Africa. To the extent that urbanization is path-dependent, and does lock in population and built-up area, this is a major concern for these regions. Further research is required to explain why these urbanization rates are so high, and what this implies in particular localities. However, along with many of the results presented earlier, these high rates highlight the importance of deltaic areas in both adapting to climate change and protecting coastal environments and ecosystems.
LECZ05
The share of LECZ05 land in Urban Centres in 2015 was generally slightly lower than the share of LECZ10 land (and for deltaic land in South-Central Asia it is more than 50 per cent lower). The shares of population in Urban Centres are also generally lower in LECZ05 than LECZ10, mostly with higher differentials, and with a few exceptions (the urbanization level in South-Central Asia’s deltaic LECZ05 is only a third lower than in its deltaic LECZ10, and North America’s deltaic LECZ05 urbanization level almost a third higher than that of its deltaic LECZ10).
More importantly, urban-related differences resulting from focusing in on LECZ05 (and consistent with the results in previous sections) relate to Urban Centre population growth (1990–2015) in deltaic East Asia. In most regions and land types, the Urban Centre population growth rates in LECZ05 were quite close to those for the whole LECZ10. In the deltaic LECZ05 of both East Asia and South America, these Urban Centre population growth rates were about 1.5 percentage points higher than in the deltaic LECZ10 (see Figure 5b). This differential could be important to South America’s future, but as noted in a previous section its overall deltaic LECZ05 population was very low, and the implications for the global profile or Urban Centre population in 2015 are minimal. In contrast, East Asia alone contributed 16 million of the global increase in LECZ05 Urban Centre population of 34 million between 1990 and 2015 (Table 12a in Supplementary Materials).
When it comes to urbanization rates (the rate at which the population share in Urban Centres are growing), the three Asian regions that together were shown to dominate the statistics on population in LECZ10 and its deltas are also shown to have had even higher urbanization rates in LECZ05 than LECZ10, and by considerable margins. This strongly reinforces concerns that urbanization may not only have been pulling people to low-lying deltaic areas, but making it hard to reverse this trend. Africa actually has a slightly lower urbanization rate in its deltaic LECZ05 than its deltaic LECZ10, though it will be important to track Africa’s urbanization as its population growth is likely to remain the highest of the world regions for some decades and much of its urbanization has yet to unfold.(65)
VI. Discussion And Conclusions
Urbanization creates locational path dependencies that persist over centuries, if not millennia. Historically, urbanization has often taken place in deltas because their natural abundance and access to waterways have attracted people and investment. Increasingly, it has become the economic qualities of the cities, only loosely linked to their deltaic locations, that drive further growth of population and built-up area. In the right circumstances, urbanization can facilitate and even contribute to adaptation to climate change.(66) Urban density can reduce the cost of protective measures (per capita and per unit of property), and given the right incentives the comparatively small footprint of Urban Centres would allow them to fit more easily in safer locations. However, once a settlement pattern is in place, it is hard to shift, particularly in response to future risks that are still not widely acknowledged locally.
Deltaic settlement has always brought risks, and increasingly it is bringing environmental damage. Being at the intersection of terrestrial, riparian and coastal habitats, deltas are ecologically sensitive and hazardous sites. Increasing human activity can transform deltaic ecosystems, degrading local ecosystem services (e.g. the salinization of groundwater and soils) and increasing risks such as flooding. Moreover, global climate change is also increasing risks in deltas, through more frequent and severe flooding and storms, and long-term sea level rise. Indeed, the very existence of deltas is a symptom of a relatively stable climate – and hence sea levels. For many cities, the same coastal deltaic locations that once gave them an economic edge may eventually spell their downfall.
In this context, there is an urgent need to avoid or break urban lock-in within low-lying deltas. Encouraging further uncontrolled and unprotected settlement and construction in such contexts is maladaptive, particularly when large ecosystems like mangroves and marshes are degraded, effectively reducing nature-based defences.(67) Even encouraging new protected settlement is likely to be maladaptive if these planned protections are based only on current risks, or serve to attract people and investment to areas that are likely to become appreciably more difficult to protect in the future.(68) This conclusion is reinforced by a recent systematic review on climate change adaptation, which found that research on coastal and ocean ecosystems frequently identified constraints and barriers to adaptation posing important limits to people’s capacity to avoid significant harm,(69) underscoring that people living in deltaic settlements may find it especially challenging to respond to climate-induced changes.
Unfortunately, not only is steering settlement and investment towards less risk-prone locations difficult, but failures are quite likely to harm already disadvantaged groups. For example, poorly conceived efforts to prevent “excessive” urban population growth can easily result in forms of urban exclusion that drive the most vulnerable groups not to distant locations where they thrive, but into more precarious settlements within the same city where the risks they face are compounded.(70) Informal settlements and enterprises are not only likely to be more vulnerable to more severe flooding and environmental degradation, but to policies designed not to help them move but to drive them out.
In these conditions, removing policy measures that actively incentivize settlement in low-elevation deltaic areas is an important first step. As described above, over the past 30 years the biggest increase in population and built-up area in deltaic LECZs has been in China, where the pull towards coastal deltas was not due to their natural advantages alone: the state chose these particular locations for political as well as practical considerations. Small villages in vulnerable locations became some of the world’s biggest cities because long-term flood risk was not a consideration, despite ongoing climate change and relative sea level rise. This rapid development has made policies to reduce subsidence and enhance defences against flooding a national issue in China.(71) More generally, and in some cases under the influence of the Chinese model, coastal development of Special Economic Zones and port redevelopment have been incentivized in many other parts of the world, and are particularly attractive to large developers.
Removing the more egregious policies and practices stimulating urban development and/or causing subsidence and climate change is unlikely to be sufficient, even if accompanied by major investments in physical barriers.(72) More concerted and equitable efforts to guide urban development to safer locations will also be important, and while such efforts will need to be driven locally, given the scale of the challenge they will need to be supported nationally and internationally.
This paper lays bare the scale of the challenge by combining five spatial data sets: low-elevation coastal zones, major deltas, population distribution, built-up areas and urban extents. While this global assessment is no substitute for granular information feeding into sound local decision-making, it provides a useful indication of where concentrations of people and built structures may be particularly exposed to environmental hazards including those induced and exacerbated by climate change, as well as where human settlement patterns may be placing pressure on important natural environments.
Our results illustrate that the LECZs and especially their major deltas contain large concentrations of both population and built-up area. The LECZ10 accounts for just 2.1 per cent of land but is home to 11.1 per cent of the world’s population (815 million people) and 11.7 per cent of built-up area (or 91,000 km2). The deltaic LECZ10 accounts for only 0.35 per cent of the world’s land, but is home to 3.8 per cent of the world’s population (279 million people) and 3.0 per cent of its built-up area (or 23,000 km2).
While there are deltaic hotspots of risk all over the world – from the mouths of the Nile to the Niger, the Mississippi to the Rhine – this paper reveals that low-elevation deltaic settlement is overwhelmingly concentrated in Asia. Asia accounts for around one-third of the global LECZ10 land area, but over three-quarters of the global LECZ10 population and over half of its built-up area. For the global deltaic LECZ10, Asia’s shares rise to 85 per cent of the population and 81 per cent of the built-up area.
There is considerable variation within Asia, and the exceptionally high population and built-up densities in East Asia’s deltaic LECZ10 suggest that both environmental pressures and risks are likely to be especially intense in this region. Given how China dominates the East Asian statistics, it is worth reiterating how China’s strategy of nurturing export-oriented industrialization through coastal Special Economic Zones in the 1980s and 1990s created or reinforced urban path dependencies in these locations through agglomeration economies, durable and immovable physical infrastructure, and self-reinforcing governance arrangements. The result is that China has recently seen much higher rates of urban growth in (deltaic) low-elevation coastal areas, despite the growing risks associated with settlement and construction in these parts of the country.
Looking towards the future, some lower-income and rapidly urbanizing regions may follow China’s development trajectory. South-Eastern Asia too had particularly high population growth rates in the deltaic LECZ10. Although South-Central Asia and Africa have seen higher growth rates of population and built-up area outside the LECZ10, this could change if their economic growth strategies shift towards the Chinese model. Worryingly, Africa, South-Central Asia and South-Eastern Asia all saw the Urban Centre share of the population increasing fastest in their deltaic LECZ10, which – given urban path dependencies – suggests possible lock-in to maladaptive patterns of settlement and construction.
Just as a few regions dominate the global statistics, a few countries dominate each region’s statistics. Indeed, in all the world regions except Europe one or two countries account for the majority of both population and built-up area in their region’s LECZ10 (China in East Asia, Bangladesh and India in South-Central Asia, Indonesia and Vietnam in South-Eastern Asia, Egypt and Nigeria in Africa, the United States in North America, and Brazil and Argentina in South America).
More locally still, the results of this research reinforce the importance of expanding the already noteworthy base of the research and policy initiatives on urbanization and climate adaptation in specific deltas, some of which cross national boundaries. It is at this scale that the most meaningful climate-related risk assessments and adaptation strategies can be undertaken. This would need to include adaptation measures that recognise concomitantly the potential harm (e.g. groundwater extraction, loss of ecosystem services associated with marshes and mangroves) caused by development in LECZ10 and its deltas, as well as the rising risks of climate change and subsidence.
While estimates of population and built-up area in LECZ05 are less robust than those for LECZ10, they are concerning enough to deserve attention. Globally, the population and built-up densities of the LECZ05 are appreciably lower than in LECZ10, in both deltaic and non-deltaic areas, probably reflecting the fact that people prefer not to live or build in more hazard-prone areas. However, the attraction of deltas is more powerful than the lower elevation effect, and the population and built-up densities in the deltaic LECZ05 (428 people per km2 and 4.2 per cent respectively) are still far higher than the non-deltaic LECZ10 (234 people per km2 and 3.0 per cent). Moreover, there is no evidence that an aversion to settling the deltaic LECZ05 has increased with the growing awareness of climate change in the past 25 years. To the contrary, between 1990 (when the first IPCC report was published and global climate change began to receive sustained international attention) and 2015, the population and built-up growth rates in the deltaic LECZ05 were well over twice those in the non-deltaic LECZ10. Moreover, the urbanization rate (defined as the rate of increase in the population share in Urban Centres) of the deltaic LECZ05 over this same period was about two-thirds higher than that of the deltaic LECZ10, which was itself more than twice that in the rest of LECZ10 or the rest of the world. Such results strongly corroborate the concerns expressed in Section II about the danger that rapid urbanization of deltas is not only putting people and property in harm’s way, but making it increasingly hard to move them out of harm’s way, and adapt to some of the major risks of climate change. This is a particular concern in Asia but deserves attention globally.
There are still uncertainties in the estimates presented here, particularly for LECZ05,(73) but this study reflects substantial improvements made to the underlying data in the past decade and finds general agreement with the broad patterns established based on coarser source material.(74) Additionally, internationally comparable statistics on population and built-up areas in LECZs, and the delineation of urban areas and deltas, will likely continue to improve with time, and may eventually be supplemented by spatial assessments not based simply on LECZs but on globally comparable procedures for identifying areas facing comparable seaward and flooding hazard and risks (incorporating, for example, globally comparable flood modelling) given different demographic and climatic trajectories, and projections of where extreme weather events and sea levels are likely to increase most. At least as important, more locally relevant statistics are likely to become available, and should be able to better inform efforts to adapt to climate change in the LECZs and their deltas. Already, however, it is possible to answer the question posed in the title to this article in the affirmative: rapid urbanization of the LECZs and particularly their deltas is indeed undermining the potential for adaptation to climate change in the long term.
Supplemental Material
sj-xlsx-1-eau-10.1177_09562478231192176 – Supplemental material for Is rapid urbanization of low-elevation deltas undermining adaptation to climate change? A global review
Supplemental material, sj-xlsx-1-eau-10.1177_09562478231192176 for Is rapid urbanization of low-elevation deltas undermining adaptation to climate change? A global review by Gordon McGranahan, Deborah Balk, Sarah Colenbrander, Hasim Engin and Kytt MacManus in Environment & Urbanization
Footnotes
Acknowledgements
The research on which this paper is based has received funding from a Dean’s Research Award at the Marxe School of Public and International Affairs, Baruch College, City University of New York; NASA Socioeconomic Data and Applications Center (SEDAC grant 80GSFC18C0111); and the World Resources Institute (04435RA). The authors would like to thank Matthew Heaton for his assistance with the figures, and to acknowledge the anonymous reviewers, as well as the editors at Environment and Urbanization, for their patience with this rather long and figure-laden paper.
Supplementary Material
The data presented in this article is to be archived in the NASA Socioeconomic Data and Applications Center (SEDAC) and is also available at the DOI https://doi.org/10.7927/4hgr-db70. An accompanying web map is available at ![]() .
.
4.
Hallegatte et al. (2013); ![]() , especially chapter 7.
, especially chapter 7.
11.
14.
Krugman (1991, ![]() ).
).
17.
23.
Despite this uncertainty, there has been progress in modelling coastal flood risk globally, with estimates of people and/or built-up area at risk taking account not only of elevation but of storm surges, expected sea level rise and their regional variations (Muis et al., 2016). There are also estimates that attempt to take infrastructural coastal defences into account (Hallegatte et al., 2013), and even to evaluate the costs and benefits of selected infrastructural defence measures (Tiggeloven et al., 2020), and to examine possible effects on migration out of particularly risky areas (Lincke and Hinkel 2021). Protecting or reclaiming nature-based defences can be important, particularly in coastal deltas and estuaries (Glavovic et al., 2022, page 2173), but are harder to model globally.
29.
Averaged across the coastal population the delta and city subsidence effects were estimated at 1.6 mm/yr and 2.7–4.8 mm/yr respectively. Post-glacial rebound was estimated at 0.5 mm/yr, roughly cancelled out by a climate-induced sea level rise of 0.6 mm/yr, again both averaged across estimated coastal population (Nicholls et al., 2021b).
32.
37.
For urban extents, MacManus et al. (2021) use the classification “urban”, “quasi-urban” and “rural” for comparison across four different data sources, some of which are continuous variables with no previously stated categorizations. The three classes correspond to “Urban Centres”, “Urban Clusters” and “Rural” in this paper (and in the DoU data reports such as Maffenini et al., 2020). For more details on the DoU classes and their use in this paper see footnote 55.
39.
Others have used more inclusive LECZ measures – up to 100 km from sea coast to understand broader development trajectories (Reimann et al., forthcoming; Small and Nicholls, 2003) – and also more restrictive elevation bands of single-metre increments (Kulp and Strauss, 2019). Higher uncertainty around the smaller bands (Lichter et al., 2011; Gesch, 2018) have led us to create only two zones, as described in ![]() .
.
42.
See for example Bianchi (2016); Edmonds et al. (2020); Nicholls et al. (2021a, 2021b); ![]() .
.
44.
Edmonds et al. (2020) provide a data set delineating delta extents that differs considerably from that of Tessler and colleagues. Whereas Tessler et al. (2015) use detailed spatial representations corresponding to coastlines and other physical geographic features, Edmonds et al. (2020) use minimum convex hulls which produce triangular and straight-line representations of the deltas, resulting in substantial size and shape differences even when both data sets agree on the approximate location of a delta. The Edmonds et al. collection includes many more deltas than that of Tessler et al. but the vast majority of these are small: the median area of all deltas is 7.6 km2 (including 90 over 1,000 km2). All 48 deltas in Tessler et al.’s data set are greater than 1,000 km2 and all but five of these are also found in the Edmonds et al. collection. Owing to the spatial precision of the Tessler et al. collection, it is preferred for this analysis, which overlays those extents with data delineating population and built-up distributions and Urban Centre locations. Information on both the Tessler et al. and the Edmonds et al. delta data sets, as well as maps of these delta extents, can be found at ![]() .
.
51.
Population density is population per km2 and built-up density is built-up area per km2, with the latter most clearly expressed as a percentage.
53.
Markets also implicitly place a lower value on the lives of lower-income people, but such valuations are morally questionable, and most economic assessments of lives lost use the concept of “statistical lives”, which vary less than the valuation implied by markets.
55.
The DoU approach (Dijkstra et al., 2020; Florczyk et al., 2019) equates urban with the concentration of population, with built-up area as a possible indicator rather than a defining feature of urban settlements. Urban Centres (or “high density clusters”) are identified as clusters of contiguous square kilometre grid cells with population densities of at least 1,500 per km2 or built-up area densities of at least 50 per cent, and total populations of at least 50,000 (Florczyk et al., 2019, page 19). The 50 per cent threshold for built-up area is not intended to be a minimum built-up density for land to be considered part of an Urban Centre, analogous to the 1,500 population density: the high built-up threshold was designed to avoid excessive fragmentation of Urban Centres identified primarily through their population density and size. Urban Clusters are identified as clusters of contiguous square kilometres that are not in Urban Centres, but have population densities of at least 300 and combine to total populations of at least 5,000 (Florczyk et al., 2019, page 19). Urban Clusters may meet the total population criteria by including the population of adjoining Urban Centres, and some areas that meet neither condition are included in Urban Centres or Urban Clusters if they are encircled or if including them smoothes the cluster boundary. For version R2019, used in this paper, candidate grid cells were not considered for inclusion in Urban Centres or Urban Clusters if they did not have even minimal evidence of built-up structure (3 per cent built-up density). The DoU approach continues to evolve (Maffenini et al., 2020) and countries adopt it with varying customizations. References to statistics on or thresholds for Urban Centres or Urban Clusters throughout this paper refer to those used in the DoU (R2019) approach. While this approach gives some consideration to built-up densities in identifying urban extents, Urban Centres and Clusters are primarily defined by population characteristics, and in effect urban systems are defined as systems of people rather than systems of people and physical constructions.
59.
The deltaic areas outside of LECZ10 are an exception to this, and are considerably more densely populated and built-up even than the deltaic areas in LECZ10, reinforcing the observation that less hazardous locations are more attractive, even if this can be outweighed by the attractions of deltas (see ![]() , Supplementary Materials).
, Supplementary Materials).
60.
The statistics on individual countries cited in this and the following sub-section are based on the data publicly available in the Low Elevation Coastal Zone (LECZ) data collection at the Socioeconomic Data and Application Center (SEDAC) website.
61.
For more of this see Figure 3b below, and accompanying text, and relevant discussion in ![]() .
.
64.
The low share of built-up area relative to population may be an outcome of population density and overall population being the principal criteria for identifying Urban Centres, with comparatively high built-up density thresholds used primarily for smoothing: were built-up area treated as one of the defining characteristics of Urban Centres the ratio of built-up area to population in Urban Centres would likely be significantly higher.
References
Supplementary Material
Please find the following supplemental material available below.
For Open Access articles published under a Creative Commons License, all supplemental material carries the same license as the article it is associated with.
For non-Open Access articles published, all supplemental material carries a non-exclusive license, and permission requests for re-use of supplemental material or any part of supplemental material shall be sent directly to the copyright owner as specified in the copyright notice associated with the article.