
Abstract
Urban segregation is a widespread phenomenon with profound social implications, and one that presents difficult measurement challenges. Segregation indexes may be affected by scale or zoning biases of the modifiable areal unit problem (MAUP). In this article, we develop a methodology that relies on spatial clustering algorithms to simultaneously cope with both kinds of MAUP biases, and we test it with complete census data for most Chilean cities. We find a robust correlation between segregation and city size, contesting previous claims about the spuriousness of this relationship. We also show that socioeconomic polarization is a widespread phenomenon in Chile and that it is not just a problem of disadvantaged groups’ concentration. Based on these results, we suggest that area-based desegregation policies should be generally reinforced, and complemented in big Chilean cities with housing-mix policies. We argue that using spatially unbiased segregation indexes could improve comparative urban studies.
Keywords
I. Introduction
Urban segregation is an ancient and universal phenomenon(1) that involves the spatial separation of different social groups. As a consequence, minorities or disadvantaged populations that are spatially isolated may face exceptional difficulties in accessing the labour market or other cultural and social resources. However, there is no general agreement about the definition of urban segregation, nor are there universally adequate methods for measuring it. Massey and Denton(2) developed a landmark comparison of different segregation indexes, classifying them along five main dimensions. However, their analysis was focused on segregation of ethnic minorities, while more recent studies recognize the increasing importance of socioeconomic processes of segregation.(3) During the last third of the 20th century, for example, class segregation rose in the US while racial–ethnic segregation lessened.(4) In Chile, similarly, strong income inequalities and the similar educational attainment of immigrants from other Latin American countries, compared to that of the domestic population, make socioeconomic segregation more relevant than ethnic segregation. Besides, from a methodological perspective, measurement biases related to the modifiable areal unit problem (MAUP) (explained in Section IIIb) could produce major statistical inconsistencies in comparative studies of urban segregation.(5)
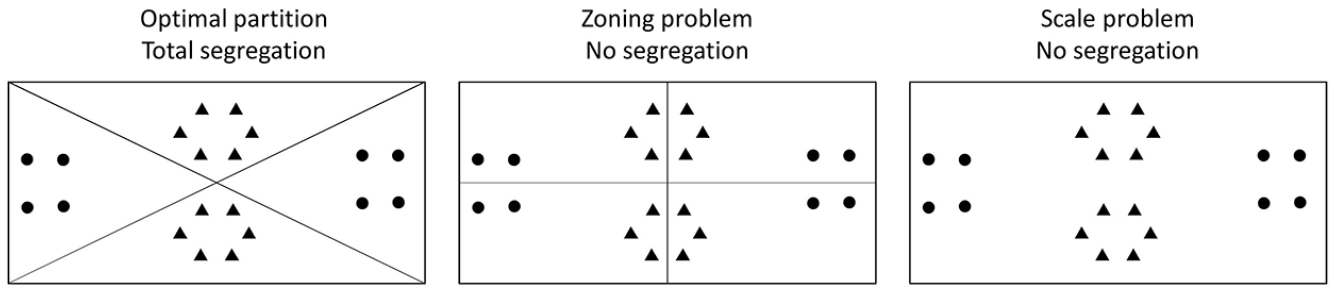
In this article, we develop a comparative analysis of urban segregation in Chilean cities using novel spatially unbiased indexes of segregation. Firstly, we focus on measures of socioeconomic segregation that do not rely on arbitrary class distinctions but are instead designed for the analysis of continuous quantitative variables such as income or years of formal education.(6) Secondly, we use spatial clustering approaches to measure segregation, in order to avoid MAUP inconsistencies (Figure 1) produced by data aggregation at different scales and/or different zoning schemas.(7)
MAUP biases affecting segregation indexes
In order to contextualize these issues within a substantial problem of urban studies, we focus on the relationship between segregation and city size, which is particularly relevant for low- and middle-income countries that are experiencing rapid and ill-regulated urban growth.(8) City size-related MAUP biases are particularly difficult to address,(9) but we provide robust evidence of a significant correlation of city size and segregation using complete 2012 census data for 98 Chilean cities ranging in population from 10,000 to 6 million. These results underscore the necessity of regulating urban development in rapidly growing cities. They also support an analytical strategy that could be useful for international urban comparisons.
This research will be developed in four sections: in Section II, a description of demographic trends and the institutional context in Chile; in Section III, a review of measures of segregation with special attention to MAUP; in Section IV, a description of data and methods; and in Section V, a discussion of the main results. We conclude with an assessment of the contribution of the proposed measures for comparative segregation analysis, highlighting the relevant insights that they provide for desegregation policies in Chile.
II. Chilean Cities Under Neoliberal Planning
Over the last century, Chilean cities have experienced major transformations, due to population growth, internal migration and economic transformations.(10) The population has increased from about 3 million in 1900 to 18 million in 2018. Over the same period, the urban population increased from about 40 per cent to 87 per cent, thus applying sustained pressure on urban growth.(11) In particular, Greater Santiago, Chile’s capital city, with its early development as an industrial and railway hub, attracted most internal immigration until 1970. Since then, the main attractors have been main regional cities such as Antofagasta and Iquique in the north, Coquimbo and Valparaíso in the central coast, and Puerto Montt in the south.
City size varies widely in this country. The capital has 6 million inhabitants, Concepción and Valparaíso’s urban areas nearly a million each, seven cities have populations between 500,000 and 200,000, 11 others over 100,000, and 91 more between 10,000 and 100,000.
Neoliberal state reforms were introduced during Pinochet’s dictatorship (1973–1990) and deeply influenced social inequalities and urban development in Chile.(12) Over this period, income inequalities and poverty rates sharply increased, reaching the highest levels in recent history towards the end of the dictatorship.(13) Since 1976, massive displacements of poor households from affluent sectors towards urban peripheries were forcefully executed through deliberate policies of socioeconomic segregation.(14) This was justified as a way to focus social spending on poor municipalities. But it has resulted in a sharp distinction between poor-quality public services – notably health and education – in low-income areas and high-quality privatized services for affluent households.
Since the recovery of democracy in 1990, income inequalities have persisted and urban segregation has been aggravated by land market dynamics and social housing policies.(15) Chile has sharp inequalities (Gini index of 0.48), near the average of Latin America, which is the second most unequal continent after Africa.(16) Income inequalities are most notable among the highest income groups. The richest decile has an average income 2.5 times higher than that of the second 10 per cent, and the top 1 per cent of the population receives about 30 per cent of national income.(17) These inequalities are expressed in wide material differences that are spatially reinforced through urban segregation of the elites, who are capable of insulating themselves in order to avoid conflict and insecurity, while fostering the sociospatial reproduction of class privileges.(18)
In recent decades, massive housing developments for the middle and upper classes have been built in urban centres and newly urbanized peripheries, as high-rise buildings and single-family homes respectively. Public housing policies are poorly regulated from a spatial perspective, being based mainly on the distribution of vouchers to poor families that then deal directly with private developers. Profit-seeking leads to the building of large-scale, dense social housing developments on urban peripheries, where lower land prices are found. High-income peripheral developments are either built as closed communities or in areas separate from low-income areas, so sprawling cities become more segregated.
In sum, public planning capacities in Chile have been weakened in favour of market-oriented urban policies, with deep impacts on urban segregation, as documented by several authors.(19) Chilean cities have developed during the last half century in a context of rapid economic growth, acute income inequalities, significant internal migration flows, and market-oriented urban policies that have deliberately or indirectly fostered urban segregation. Thus, Chile offers a challenging case study of socioeconomic segregation, with widespread spatial polarization of social groups and huge variations in city size and economic structures.
III. Socioeconomic Segregation, Indexes and Maup Biases
a. Socioeconomic segregation and desegregation policies
Urban segregation can be defined in general as “the degree to which two or more groups live separately from one another, in different parts of the urban environment”,(20) a spatial manifestation of socioeconomic processes that has serious social consequences.(21) However, it is very difficult to identify and distinguish among relevant social groups and to quantify their spatial separation, especially when comparing different contexts.
The classic study of Massey and Denton(22) provides an exhaustive analysis of several indexes that measure different dimensions of segregation. Yet these were mostly designed as inter-group measures with a focus on ethnic minorities. However, a focus on socioeconomic segregation is becoming more relevant,(23) has more direct links to urban economic theory,(24) and allows for a better description of Chile’s blurred class boundaries and relative ethnic homogeneity.(25) In this country, native peoples are largely mixed with European descendants, especially in urban areas, although there are still rural communities where poverty rates are very high, especially those of Mapuche people. Recent waves of immigration, mainly from other Latin American countries, have introduced cultural diversity that is not directly associated with income inequalities. Although minority groups such as Haitians are very poor and show sharp ethnic and language differences from the rest of the population, immigrants generally have on average more years of formal education than Chileans, and substantial participation in labour markets.
In consequence, we focus on socioeconomic segregation measures based on continuous variables such as income or years of formal education, avoiding arbitrary categories that distinguish between similar situations (i.e. between poverty and vulnerability). In particular, we use the years of formal education of household heads as the core variable for measuring segregation, for several reasons. First, education is a good measure of cultural capital and is closely associated with social capital, both of which are highly relevant for the reproduction of socioeconomic level in Chile.(26) In contrast, income may present short-term variations (i.e. sporadic unemployment) that may be unrelated to social status in the long term. Second, workers with tertiary education earn about double what uneducated groups earn, a ratio that is fairly constant in Latin America.(27) Third, years of formal education are consistently measured in census data in several Latin American countries, as has been shown by previous comparative studies.(28) Income, meanwhile, is not reported by censuses on this continent and has proven difficult to measure accurately through socioeconomic surveys in Chile. Education is the most relevant correlate of income in Chile,(29) but both are proxies for socioeconomic level, which is a more complex social structure that involves social and cultural capital, wellbeing, income and accumulated wealth.
However, education variables have limitations for the study of segregation. First, the expansion of the university system in Chile has considerably increased the share of the population with tertiary education, so years of formal education is not an appropriate variable for the long-term longitudinal analysis of segregation. Second, young graduates with more years of formal education may have lower incomes than older professionals. Third, variations in years of formal education fail to explain the huge income differences that are observed in the richest 10 per cent. Fourth, variables such as quality of housing, access to water and sanitation systems, quality of employment and food security, among others, may be very important to understanding segregation among low-income groups, especially in poorer countries of Latin America and Africa. Composite indexes of socioeconomic level could be elaborated with this kind of information, but this would require a thorough review of the availability and comparability of international sources. In sum, we acknowledge that years of formal education is not a perfect proxy for socioeconomic level, but we argue that it gives an approximate measure of social hierarchies that is available and comparable across many countries.
The widely recognized negative effects of the concentration of poverty and ethnic minorities(30) have prompted desegregation policies in several countries, following the premise that mixed urban environments offer better life chances to their inhabitants.(31) These policies can be classified in three broad types.(32) First, housing-mix policies aim to diversify accommodation at a neighbourhood scale in terms of affordability and tenure, with the objective of increasing local interactions among different groups. This approach has shown signs of success, but evidence is inconclusive and highly dependent on context.(33) Second, dispersion policies, implemented through housing allocation or subsidies, allow poor families to move out of segregated areas into neighbourhoods with better conditions of job accessibility, school quality and other environmental factors. These policies can be successful when they generate large environmental improvements,(34) but they can also be detrimental when support networks are lost.(35) Third, area-based policies are focused on territorial improvements that complement investments in employment, education, health and housing redevelopment. Area-based policies have been criticized because they may promote selective migration of individuals who benefit the most from social policies,(36) or they can lead to gentrification.(37)
In Chile, there are limited examples of successful desegregation policies. Attempts to implement housing-mix policies have been unsuccessful, and there are no precedents for dispersion policies. Area-based policies have been relatively successful, however. The “Quiero mi barrio” (I love my neighbourhood) programme is an area-based desegregation policy that has improved 570 poor neighbourhoods in Chile since 2006.(38) It provides transitory funding and has a limited scope, only involving public space and infrastructure projects. This programme has produced neither gentrification nor the selective emigration processes that have been criticized in other countries,(39) probably due to its limited scope and because social housing in Chile is owned instead of rented. In 2006, the Ministry of Housing and Planning (MINVU) proposed a housing-mix policy that would have required social housing quotas in big private developments, but it was never established in law. In 2011, the latest modification of the Metropolitan Plan of Santiago (PRMS) considered a 30 per cent social housing quota in suburban developments, but this was reduced to 5 per cent in its final implementation, and it has not produced a measurable impact on desegregation. Probably, higher social housing quotas, including in urban centres, would be needed to impact social mixing opportunities, but this kind of policy should be adopted based on robust evidence on segregation in all Chilean cities.
b. Segregation indexes and MAUP biases
Segregation can be measured with different indexes designed for either categorical or continuous variables. Massey and Denton(40) proposed five conceptually distinct dimensions: unevenness, exposure, clustering, concentration and centralization.(41) However, Reardon and O’Sullivan(42) have argued that when spatial considerations are accounted for, most of these dimensions are equivalent, and that it is only necessary to distinguish between exposure and unevenness.
First, they argue that exposure can be measured with a general combined index of interaction and isolation. Both are measures of interaction probabilities that are similar but inverse: interaction measures the probability of social contact among different groups, while isolation measures the probability of limiting social contact within a specific group.
Second, they show that unevenness at higher levels of aggregation (i.e. census tracts) is closely related to clustering at smaller levels (i.e. blocks) and that concentration and centralization are particular cases of unevenness. Unevenness measures, such as the widely used Duncan’s dissimilarity index,(43) measure the differential distribution of social groups in urban space. Ideally, they should be calculated among homogeneous neighbourhoods, but they are often calculated using arbitrary administrative units.(44) Unevenness measures can also be calculated with continuous variables such as income or years of formal education.(45)
Spatial autocorrelation is the correlation of a single variable among neighbouring points in space. It is usually calculated with the Global Moran index,(46) which can be used as a measure of the clustering dimension of segregation, and is related to unevenness at larger scales.(47) This index is not dependent on the pre-definition of arbitrary zones, and has been previously used for international comparisons in the Americas.(48) Therefore, it is useful as a benchmark for comparative segregation analysis.
Regardless of the dimension of interest, a difficult challenge for the measurement of segregation is related to the modifiable areal unit problem (MAUP). MAUP refers to the inconsistency of statistical measures when the same information is analysed with different spatial partitions. It is especially severe when a phenomenon is spatially clustered.(49) For social groups that are more intensely clustered, segregation indexes show stronger inconsistencies when they are measured with different scales or zoning schemas.(50)
On one hand, the scale problem occurs when large areal units mix spatial clusters of different social groups, blurring differences that are relevant at smaller scales (Figure 1). This effect on segregation indexes has been widely reported,(51) showing lower segregation indexes as larger areal units are considered. Krupka(52) calculated segregation indexes in 265 metropolitan areas in the US, comparing the results obtained at the levels of blocks, census tracts, zip codes and counties. This analysis showed that the correlations between segregation indexes and city size decrease as they are measured in smaller units. On this basis, he argued that the assumption that big cities tend to be more segregated is spurious, due to a systematic underestimation of segregation indexes in small cities.
On the other hand, the zoning problem arises when the same number of spatial partitions are shaped differently, producing areal units that can contain whole spatial clusters or divide and mix them with heterogeneous populations (Figure 1). This problem is of particular interest for redesigning electoral districts in order to obtain unfair political advantages, a practice commonly known as “gerrymandering”.(53) This issue has been also reported by several studies of urban segregation, which find severe inconsistencies with empirical or simulated data.(54) Administrative units such as census tracts or zip codes can produce comparative biases when some of them are homogeneous while others contain heterogeneous populations.
Reardon and O’Sullivan(55) have developed spatial segregation measures by aggregating data around each location with decay functions that give more weight to the nearest observations. Thus, they avoid using arbitrary areal units. However, they do not address the scale problem, arguing that the adequate extent should be defined by researchers for each specific study case.
In order to avoid scale and zoning inconsistencies, we develop a multiscalar approach that relies on spatial clustering algorithms that have been extensively developed in regionalization research.(56) Spatial clustering can be done with partitioning techniques, akin to the K-means method,(57) or by hierarchical processes related to Ward’s(58) method. Both approaches include neighbourhood restrictions that only allow the aggregation of contiguous entities. This aims to avoid spatial aggregation biases through optimal areal design, obtaining exhaustive and non-redundant partitions of space in homogeneous zones.(59)
In sum, measuring segregation is a particular case of MAUP, for which relevant solutions have been proposed regarding inconsistencies of scale(60) or zoning.(61) However, there is no analytical strategy that makes it possible to address both problems simultaneously.
IV. Data and Methods for a Multiscalar Measure of Segregation
This research was based on the complete dataset of the Chilean 2012 census, with individual data georeferenced at the block level. This is the country’s smallest urban entity, contained between intersecting streets. As discussed in Section IIa, the main variable for this analysis was the number of years of formal education for household heads, which is the best available proxy for socioeconomic level in the Chilean and other Latin American censuses.(62) If they are available, other continuous variables such as income or multidimensional vulnerability indexes could be used for calculating the following indexes.
Cities with a population of under 10,000 were excluded, as segregation processes are less evident in very small cities, and because relevant control variables cannot be robustly calculated due to small sample sizes in complementary sources. Thus, we obtained a set of 112 cities. However, the 2012 Chilean census has been questioned as a comprehensive data source due to its high omission rate (9.6 per cent), a problem that is spatially concentrated in some areas and in particular cities. For this reason, we have also excluded cities with omission rates above 10 per cent, generating a subset of 98 cities. In Greater Santiago, four of the 36 municipalities are above this threshold: Peñalolen (16.7 per cent), Renca (11.6 per cent), Lo Barnechea (10.9 per cent) and Independencia (10.5 per cent). The case of Peñalolen is very problematic, because it has a large population and presents a distinct pattern of small-scale segregation of high- and low-income groups, so its high omission rates could produce an underestimation of segregation in this metropolis. To our knowledge, there is no robust method for correcting this bias. Excluding these cases produces similar segregation indexes, but this is not advisable from a topological perspective, because it introduces artificial discontinuities within a consolidated urban area. We ultimately decided to include these four municipalities, considering that Greater Santiago has an overall omission rate of 5.3 per cent. We acknowledge that segregation indexes for this metropolis might be slightly distorted, but it is likely that more complete information would produce higher values, so the core argument of a correlation between city size and segregation would be reinforced.
Considering that most segregation studies in the US use census samples (usually 5 per cent) that are much less representative, we argue that working with individual data for over 90 per cent of the population is a robust enough basis. Globally, we have found no evidence of differential omission rates by socioeconomic level, so our analysis of the spatial distribution of different populations should be robust in comparison to studies in the US, where the omission rates are higher for ethnic minorities.(63)
Control variables at the city level were obtained from the Casen 2013 survey, a detailed official instrument that provides information on income and relevant socioeconomic information, applied in all Chilean cities with a total national sample of 66,725 households. This information makes it possible to calculate Gini indexes for income inequality and poverty rates. Migration trends were proxied with the part of the population with fewer than five years of residence, as obtained from the 2012 census. Geographical control variables were also considered, including dummies for the adjacency of the sea and lakes, and ground irregularity measured as the standard deviation of absolute heights among block centroids (the central points of census blocks).
Focusing on the measurement of evenness, we calculated the Jargowsky(64) neighbourhood sorting index with individual data of household heads. This index adds the deviation of each area from the average while controlling for the global heterogeneity of the city, which is very useful for comparative studies (mathematical formulation provided in the online supplement to this paper, formula 1). In each city, Jargowsky indexes were calculated multiple times from small (blocks) to large (two areas) spatial units, following a process of hierarchical spatial clustering.(65)
In order to control for aggregation biases, we also calculated the corresponding Jargowsky indexes with 50 sets of random data, created by shuffling the variable of study years among households, in order to keep density patterns constant. By definition, the level of segregation measured with shuffled data is a spurious effect, so we discounted these values from measurements with real data, thus obtaining spatially unbiased measures of segregation at multiple scales (Figure 2).
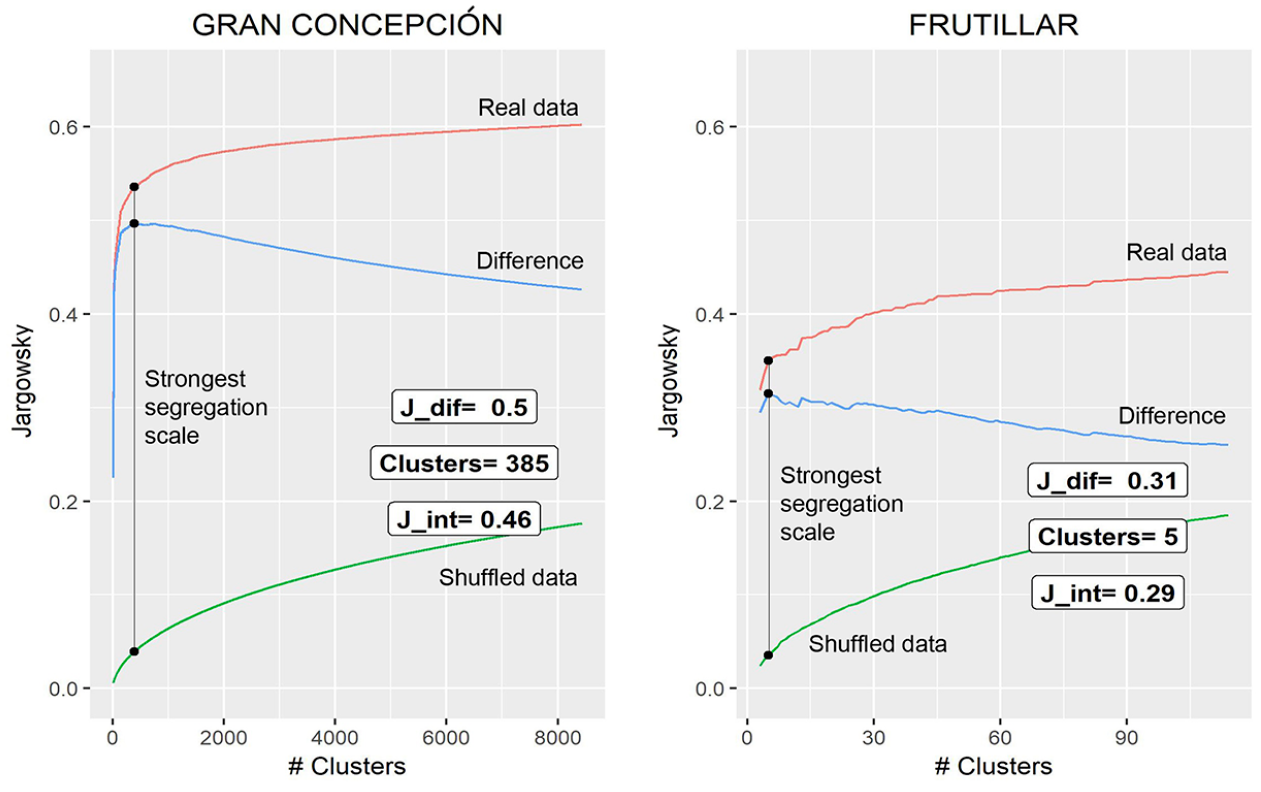
Jargowsky indexes throughout spatial hierarchical clustering in a big and a small city
With these data, we calculated two composite Jargowsky indexes: first, the Jargowsky difference, defined as the maximum difference between real and shuffled values, which also defines the strongest segregation scale (Figure 2); and second, the Jargowsky integral, calculated as an average of the Jargowsky differences among all aggregation levels (mathematical formulation provided in the online supplement, formula 2).
We also calculated the Jargowsky index for concentric areas around each block, with 300-, 600- and 1,000-metre radiuses. This is another way to develop a multiscalar segregation analysis that avoids arbitrary boundary definitions. It assesses the evenness of socioeconomic groups from an egocentric spatial perspective (where an area is seen from the perspective of the viewer) at several scales.(66)
Moreover, we calculated the Global Moran index(67) for each city in order to assess the clustering dimension of segregation. This index measures the spatial autocorrelation of high and low values of average education years among blocks, providing a measure of the clustering of households at the extremes of the social hierarchy in different parts of the city (mathematical formulation provided in the online supplement, formula 3).
Using these segregation indexes as dependent variables, we estimated multivariate regression models. We first considered two city-size indicators, the logarithms of households and of areal units (blocks or clusters), in order to control for spatial aggregation effects.(68) Second, we complemented the logarithm of households with relevant control variables.
Finally, we classified cities using K-means clustering,(69) using the Jargowsky difference index and significant covariates identified in the regression models. We analysed results for two to sixteen clusters. We settled on a four-cluster configuration that provides a balanced distribution (with five clusters or more we obtain groups with no more than two cities). It also allows us to recognize meaningful differences and similarities among and within groups.
The following section develops the results of this approach.
V. Segregation is Correlated to City Size in Chile
Most global population growth in the 21st century is projected to occur in low- and middle-income countries, especially in their main cities. These areas drive economic development but frequently present strong social inequalities and difficult governance challenges.(70) In this context, a robust assessment of the correlation between city size and urban segregation is relevant for understanding how social interactions may change as a result of migrations and urban growth, and also to design and evaluate desegregation policies.
Previous studies in the US have shown that bigger metropolitan areas have higher levels of segregation,(71) but Krupka(72) contested these results, claiming that they were biased by MAUP scale inconsistencies. In particular, he argued that if the correlation between segregation and city size is an artefact of the data collection process, the regression coefficients of the population should be non-significant or negative when controlling for the number of areal units. Krupka(73) showed that this is the case for blocks, tracts, zip codes and counties in 265 US cities, and concluded that the correlation between segregation and city size is spurious. However, we contend that Krupka was using administrative perimeters that may be strongly affected by MAUP zoning inconsistencies (Figure 1), so his conclusion might also be a statistical artefact.
Regarding the Chilean case, the administrative and official survey zones that are used for data aggregation – municipalities, census districts and census zones – are probably inadequate for the analysis of urban segregation. These areal units tend to follow main streets, which usually have similar socioeconomic composition on both sides, and thus tend to separate homogeneous neighbourhoods. As a consequence, administrative areas show random mismatches with actual segregation patterns (Map 1). This produces severe comparative biases between cities where data are aggregated in socially homogeneous areas, vs. cities where data are aggregated in heterogenous areas.
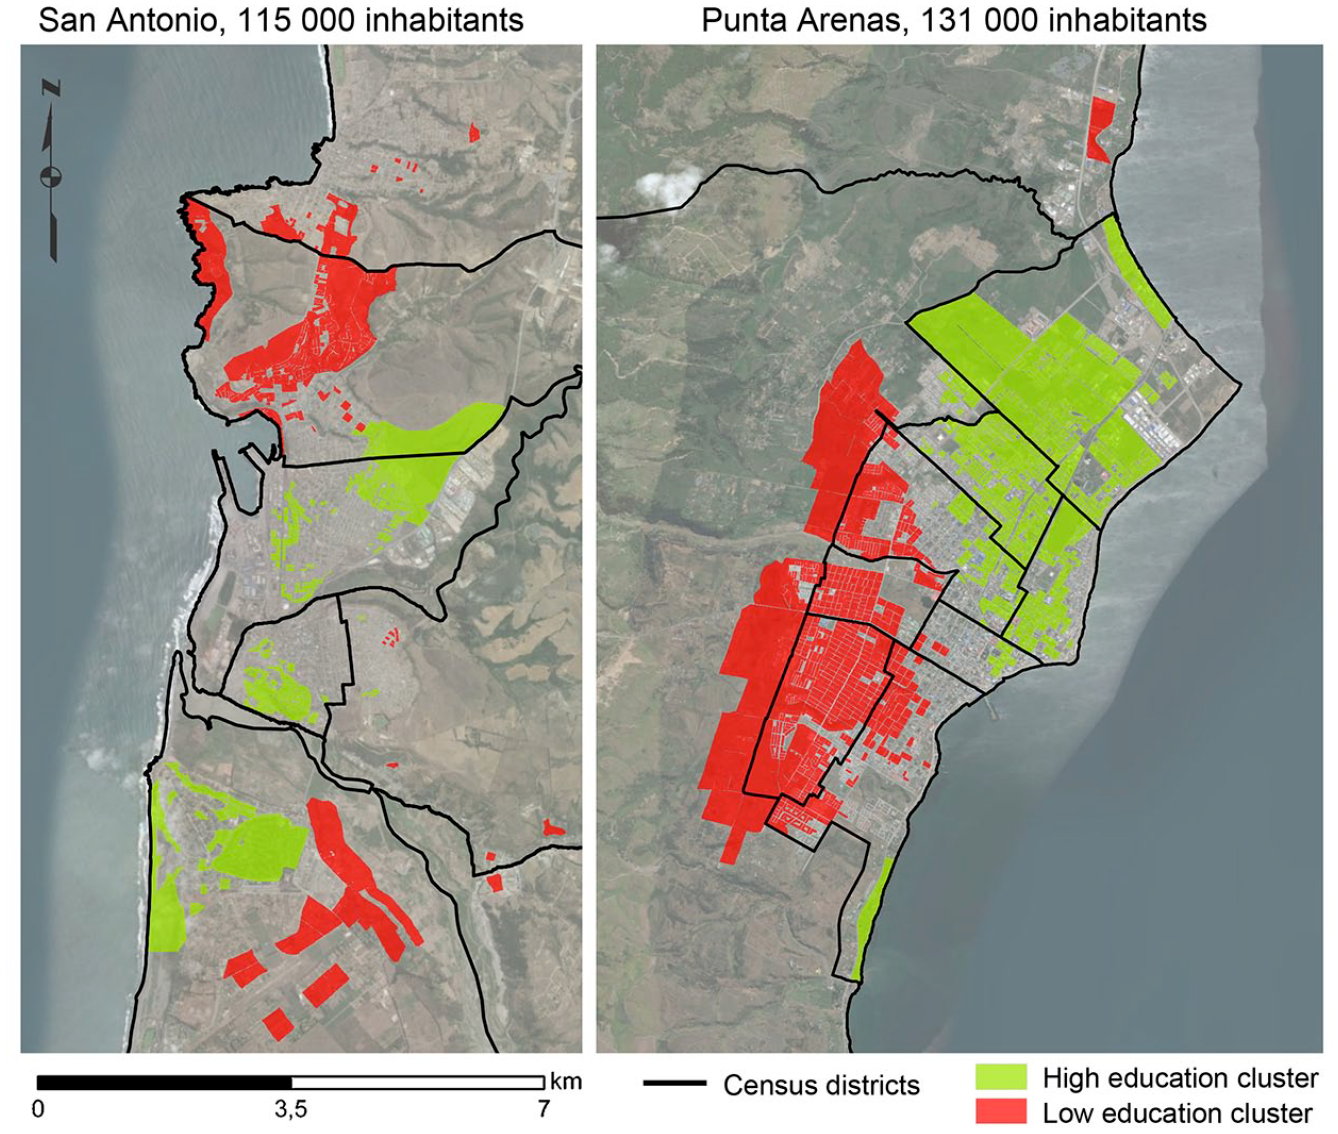
Census districts and socioeconomic clusters in two intermediate cities
Considering the likelihood of mismatches of administrative areas and segregation patterns, we have used different approaches to spatial data aggregation that help avoid scale and zoning MAUP biases (Figure 1). These are homogeneous zones built by spatial clustering in the case of the Jargowsky indexes, the nearest neighbours of each block for the Global Moran index, and a 300-, 600- or 1000-metre radius around each block for the egocentric evenness measures. The corresponding segregation indexes, calculated for 98 Chilean cities, show a strong positive correlation between population and segregation, while the numbers of areal units have negative coefficients or non-significant values, with the exception of egocentric evenness indexes (Table 1). Following Krupka’s(74) argument, this suggests that aggregation biases are not relevant in these cases.
The regression models of the Jargowsky integral and difference indexes, calculated at the strongest segregation scale and for all possible scales respectively, have very good fit (high R2) and highly significant correlation coefficients with the number of households (Table 1). The egocentric evenness indexes also show high R2 values that increase as the aggregation radius gets larger, which supports the argument that segregation may be underestimated in small cities as data are aggregated in larger areal units. The Global Moran index has a lower R2 and the coefficient of the number of spatial units is not significant.
Regression results for segregation indexes and city size
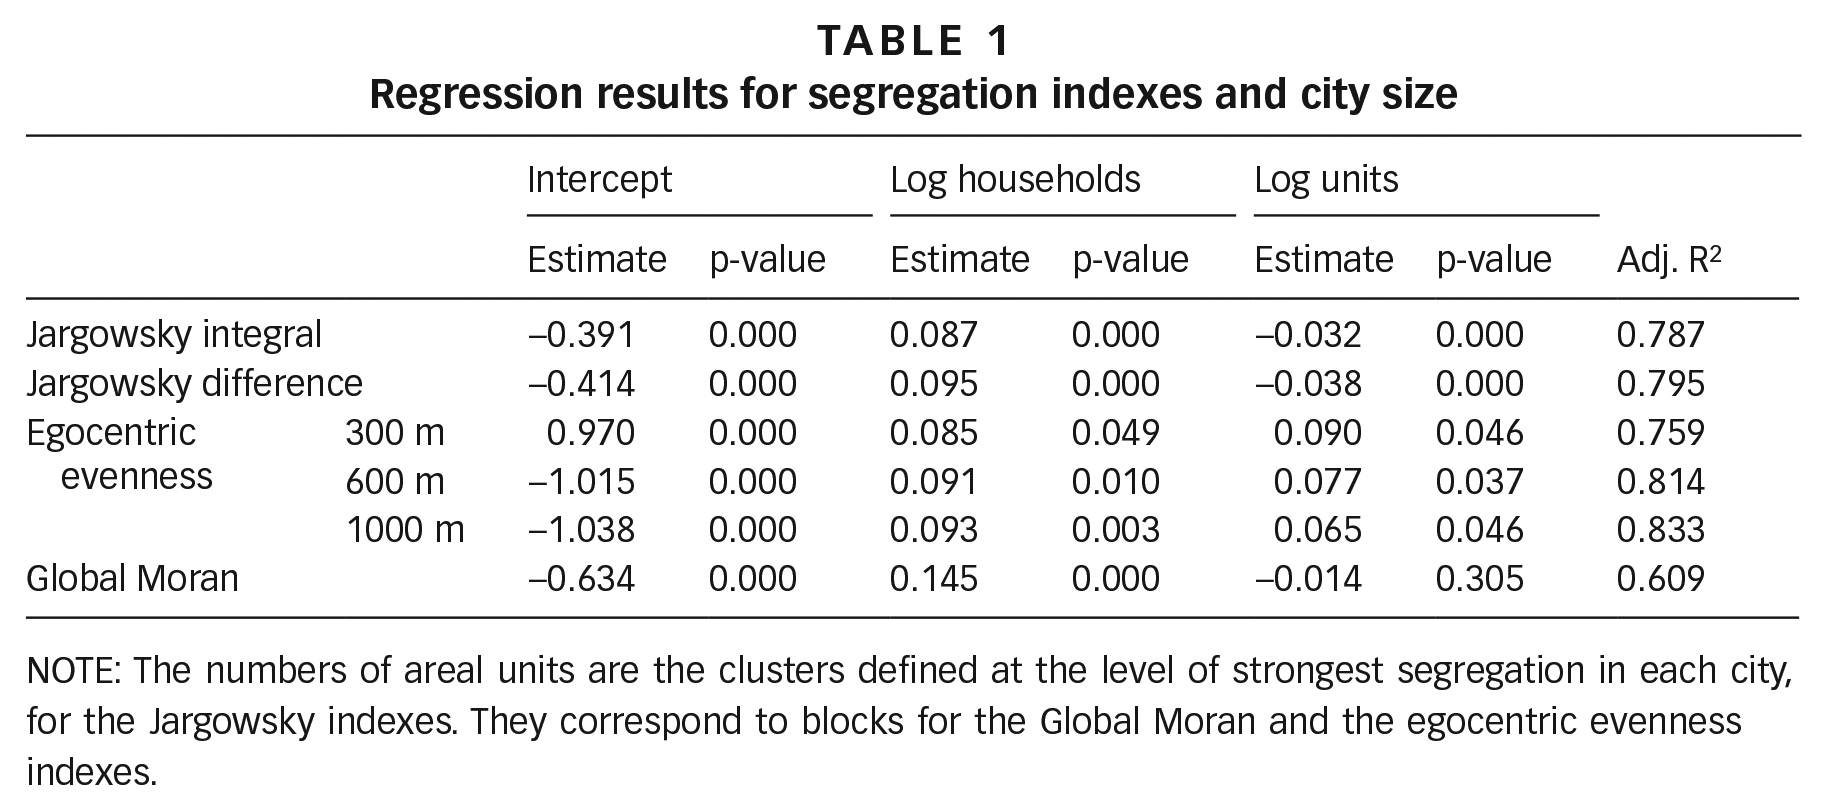
NOTE: The numbers of areal units are the clusters defined at the level of strongest segregation in each city, for the Jargowsky indexes. They correspond to blocks for the Global Moran and the egocentric evenness indexes.
These results show a robust correlation between segregation and city size in Chile, when using areal units that are based on spatial clustering, concentric rings or spatial autocorrelation analysis. In particular, this suggests that calculating Jargowsky indexes for homogeneous zones – built by spatial clustering and controlled for spurious aggregation effects – is a robust way to simultaneously address scale and zoning biases.
Furthermore, the comparison between the Jargowsky indexes calculated at the scale of strongest segregation for each city, using real and shuffled data, shows that bigger cities would be less segregated than smaller ones if households were randomly distributed (Figure 3). Thus, their stronger segregation indexes are probably caused by several processes that affect the main Chilean metropolis, such as the concentration of high-skilled workers, rapid increases in land values, massive housing developments and gentrification.(75) Nevertheless, the high dispersion of values among smaller cities highlights that a small city size does not guarantee a low level of segregation.
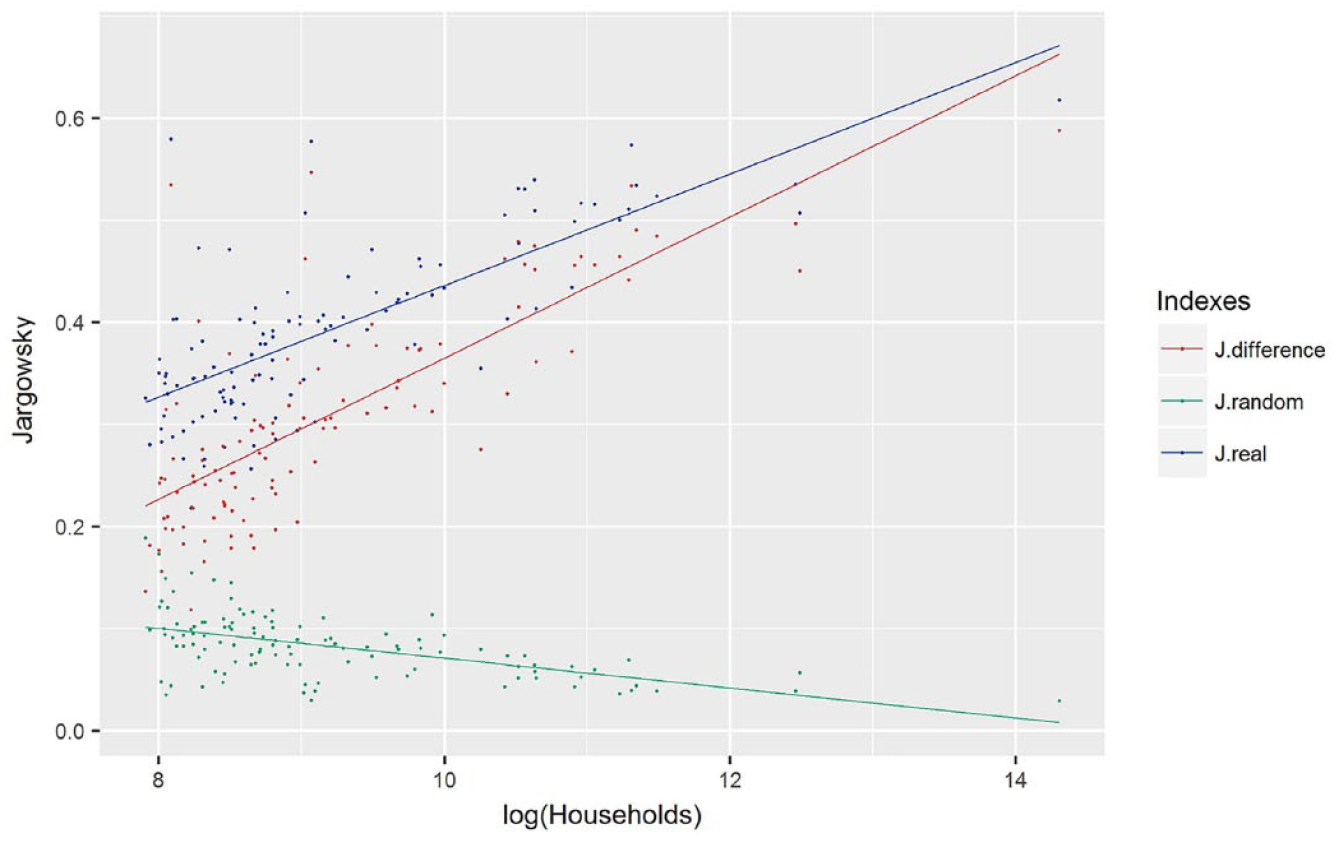
Jargowsky indexes with real and shuffled data by city size
a. Multivariate analysis of urban segregation
In order to evaluate the robustness of the previous regressions and to provide a broader perspective on segregation in Chile, we used city-level variables that serve both as controls and as a way to assess the interactions between different segregation measures and relevant urban characteristics.
Among all of the considered indicators, the regression model for the Jargowsky difference index has the best fit (adjusted R2 of 0.76). It shows a strong correlation with city size (logarithm of the number of households) and significant correlations with two control variables (online supplement, Table S1). First, income inequality has a positive correlation with segregation, which is expected as the two are different manifestations of social inequality, respectively monetary and spatial. Second, the share of recent residents is also positively correlated with the Jargowsky difference index, suggesting that faster residential mobility contributes to sorting out different groups in urban space.
Regarding egocentric evenness, we report results for the smallest concentric radius (300 metres), as larger aggregation areas might underestimate segregation in small cities, as suggested by previous results (Table 1). In any case, regression models with 600- and 1000-metre radiuses are rather similar. We also report a multivariate regression for the Global Moran index (online supplement, Table S1). In both models, the robust correlation between city size and segregation is confirmed, but no significant control variables are observed.
These multivariate models show a strong and consistent correlation between different segregation measures and city size, with much higher statistical significance than any of the control variables that have been considered (online supplement, Table S1). Significant correlations with relevant control variables are observed only for the Jargowsky difference index, supporting the argument that it is a robust measure, capable of avoiding or reducing spatial aggregation biases.
In order to understand the different interactions of segregation, size, income inequality and the share of new residents, cities have been classified in four types using K-means analysis (Table 2 and online supplement, Figure S1). The first type consists of the biggest cities, which have the highest levels of segregation, inequality and residential mobility. The second type contains cities of intermediate size with relatively high levels of segregation and average levels of other variables. The third type corresponds to small cities, with low levels of segregation, relatively strong income inequality and average residential mobility. The fourth type also consists of small cities, with low segregation and income inequality, and average residential mobility.
Averages and standard deviations of selected variables by city type
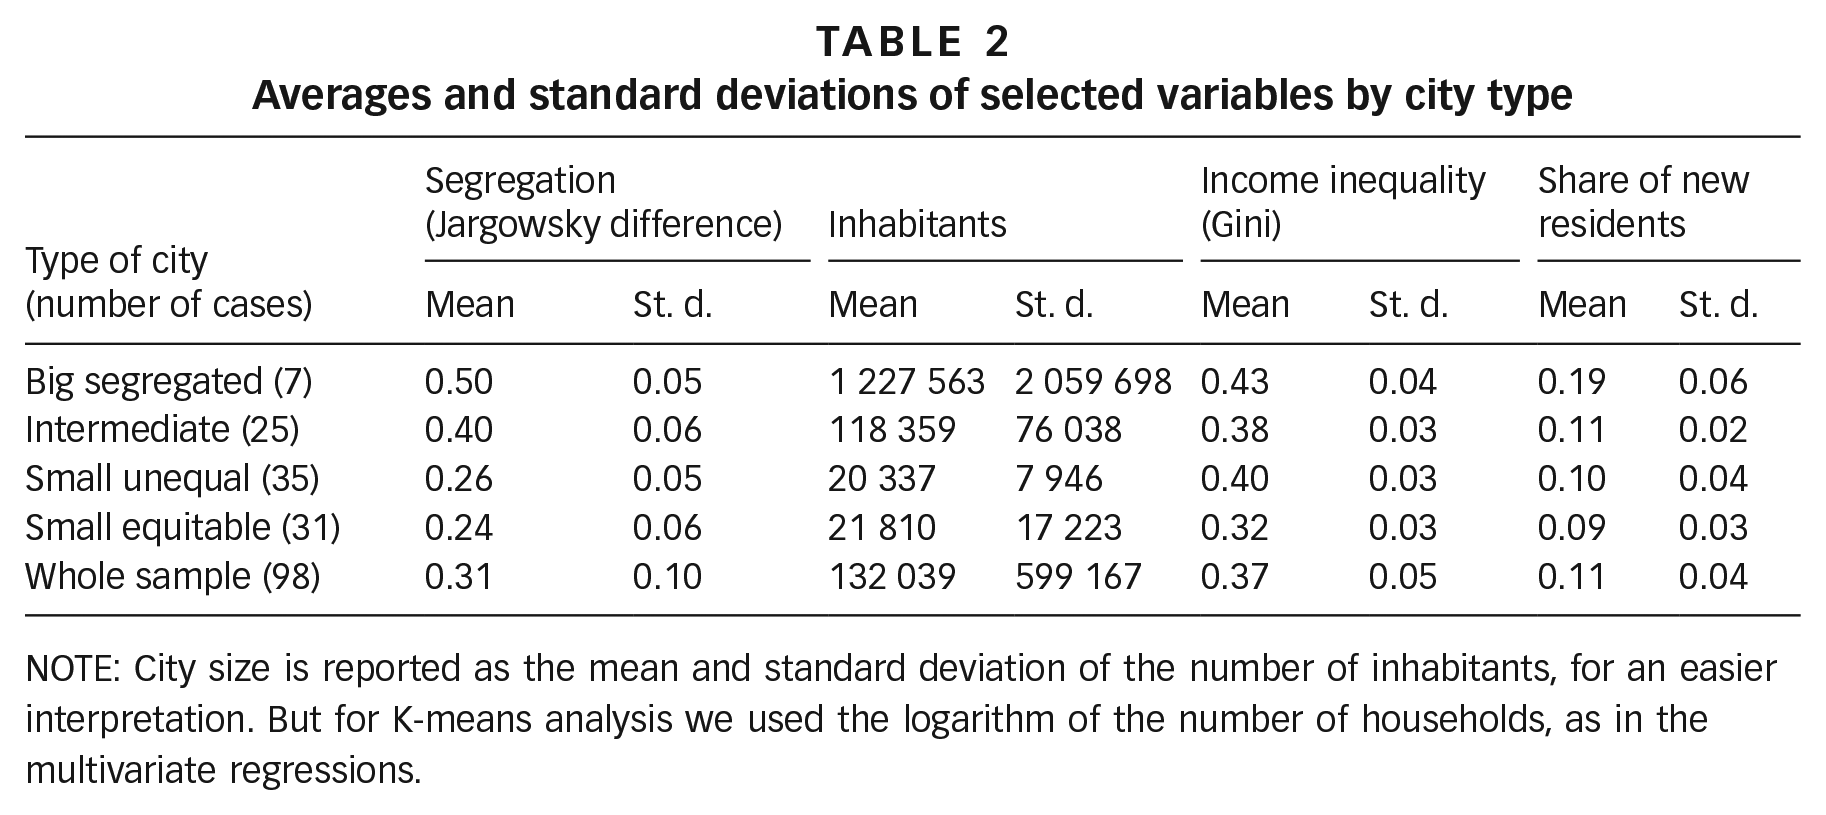
NOTE: City size is reported as the mean and standard deviation of the number of inhabitants, for an easier interpretation. But for K-means analysis we used the logarithm of the number of households, as in the multivariate regressions.
This classification shows that the biggest cities in Chile are sharply distinct in terms of their high segregation, inequality and residential mobility. In contrast, small cities show wide differences (Table 2 and online supplement, Figure S1), sometimes presenting high inequality with low segregation or vice versa (online supplement, Figure S2). Thus, increasing city size is strongly associated with higher spatial and income differentiation, but these processes can also be rather intense in some smaller cities. In sum, big cities tend to be segregated, unequal and dynamic, while small cities are very heterogeneous, especially regarding inequality.
b. Strongest segregation scales
A complementary perspective on variation in segregation patterns is given by the analysis of the strongest segregation scale for each city, as defined by the maximum difference of the Jargowsky index between real and random data (Figure 2). Cities’ and clusters’ sizes at this scale are closely correlated (r=0.9) but there are relevant differences for cities of similar size, especially for smaller ones (Figure S2, online supplement).
Averaging all cities, the clusters at the strongest segregation scale contain nine blocks, but this approaches single blocks in some small cities and 30 blocks in Greater Santiago, with populations ranging from 30 to 1,166 households (Figure S2, online supplement). This range is similar to the scale of other segregation measures that have been analysed, considering the 12 nearest blocks for calculating the Global Moran index and a 300-metre radius for egocentric evenness. These extents are consistent with arguments of a reduction of the scale of segregation, due to the presence of upper-middle class gated developments in poor areas.(76) However, previous studies in Chile were based on larger administrative areas (i.e. census tracts), so it is possible that the most acute segregation scale was actually smaller but previously overlooked due to methodological limitations.(77) In comparison, census tracts in Chile are much bigger, containing at least 15 blocks, 38 on average and a maximum of 101.
However, homogeneous clusters and groups of nearest blocks may show important variations in size and population density, because blocks can be much larger in the periphery than in central urban areas. These areal units are not necessarily an accurate representation of the multidimensional complexity of “neighbourhoods” and they might represent very different conditions of inter-group coexistence, either in compact clusters or large, sparse areas. In small, socially homogeneous areas, the probability of interaction with different people can be higher than in large-scale homogeneous areas. A thorough intra-urban analysis would be required for understanding social interactions in segregated neighbourhoods, but homogeneous areas are adequate for inter-city comparisons, because they measure distribution patterns that will be similarly affected by density gradients that are present in most cities.
The social implications of social homogeneity in larger areas highlight the relevance of the wide variations of cluster sizes at the scale of strongest segregation (online supplement, Figure S2). Moreover, other kinds of differences may be sharper, such as housing market specialization, accessibility to services, commerce and other urban qualities. In our sample, there is a strong correlation of cluster size with segregation measures (respectively r=0.68 and r= 0.66 for the Jargowsky difference and integral indexes), and both correlations remain highly significant (>99.99 per cent) when controlled by city size. Thus, the scale of strongest segregation for the Jargowsky difference can be understood as a complementary measure of segregation, because isolation should be more severe in bigger homogeneous areas.
In Chile, the heterogeneous segregation conditions (online supplement, Figures S1 and S2) depend not only on city size, but also on historical processes of urbanization, topography and urban singularities. For instance, Greater Valparaíso and Greater Concepción, the second and third most populous Chilean metropolises, have similar sizes, but the former has over twice the number of clusters at the strongest segregation scale. This pattern of small-scale segregation is consistent with the sharp topographical irregularities that characterize Greater Valparaíso. In Greater Concepción, the greater scale of segregation adds to higher segregation measures that reflect a stronger polarization of social groups.
To give examples of small cities, Frutillar and Coelemu each have just over 10,000 inhabitants but they have very different scales of strongest segregation, at 627 and 33 households on average respectively (Map 2). On one hand, Frutillar consists of two large polarized clusters – a tourist town next to the shore of Lake Llanquihue and a big development of social housing alongside a highway. On the other hand, Coelemu, an agricultural town located between hillsides alongside the Itata River, has a more homogeneous population with a less conspicuous pattern of residential segregation (Map 2). As with the comparison between Greater Valparaíso and Greater Concepción, heterogeneous social interaction is more difficult in Frutillar due to the greater extent of more socially homogeneous areas. Moreover, this city shows a high specialization of its housing market that will probably sustain and reinforce this urban divide.
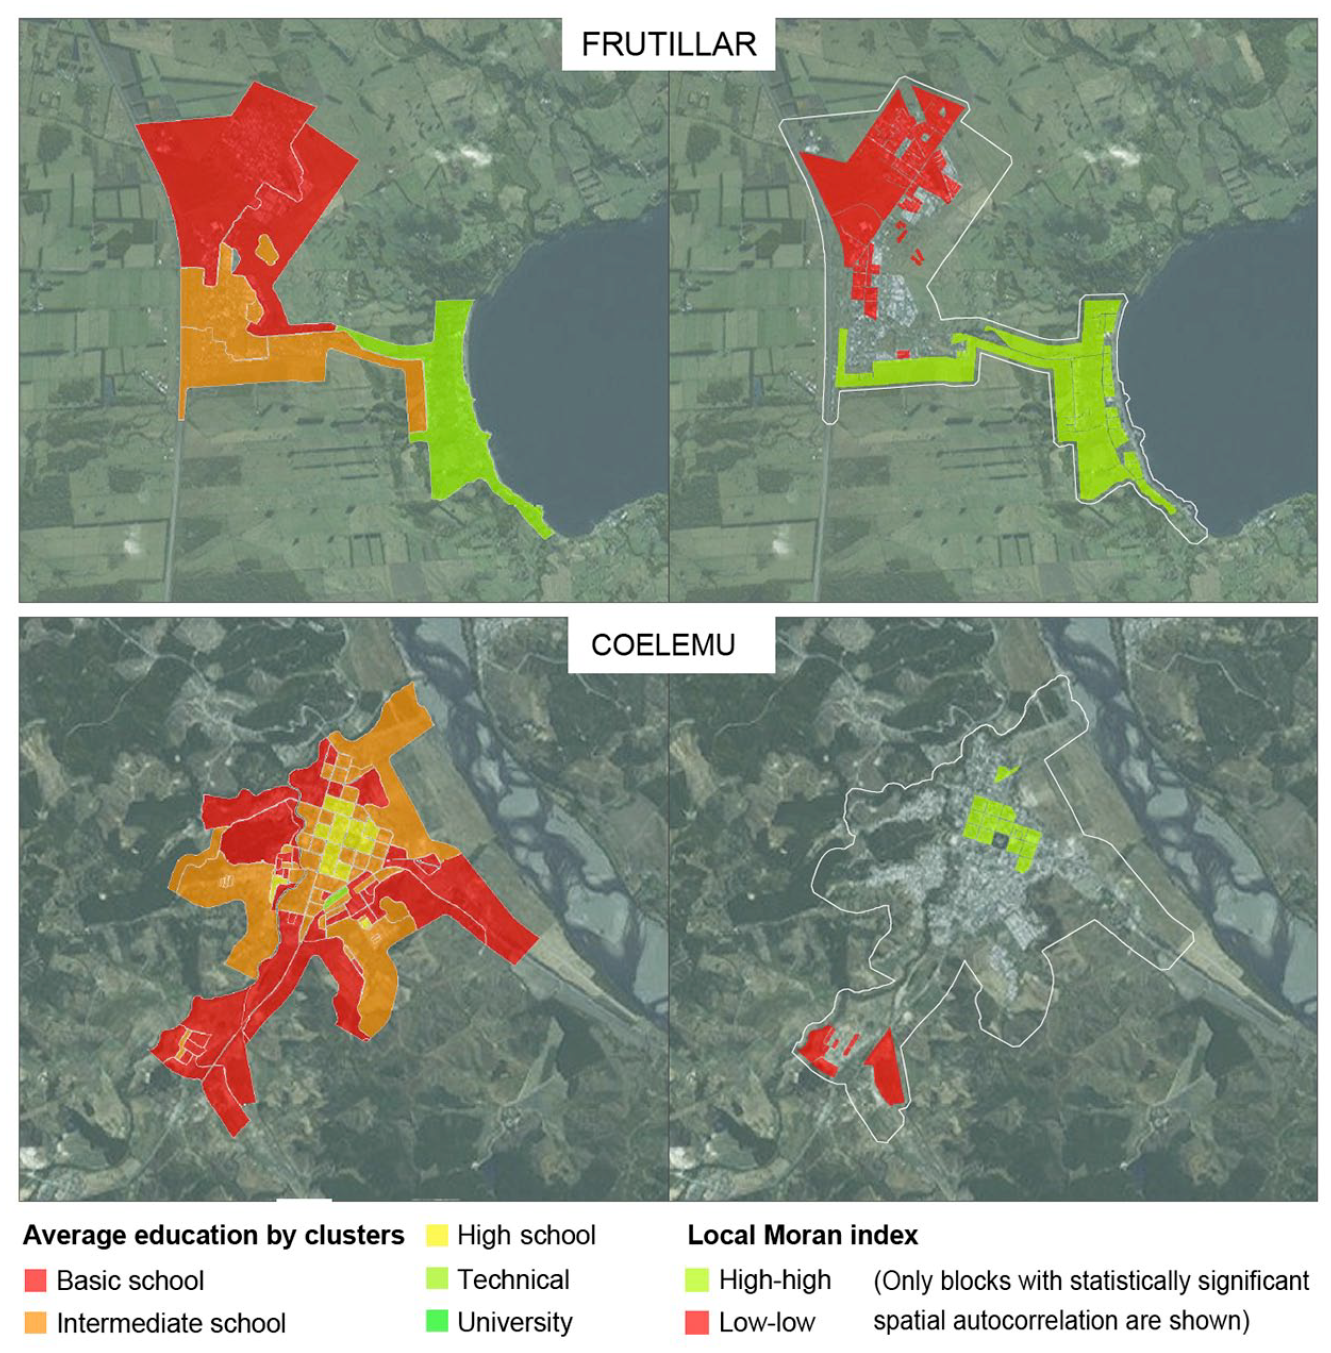
Clusters and spatial autocorrelation in two small cities
Developing an exhaustive analysis of urban singularities goes beyond the scope of this article, but these examples show that using a fixed scale or administrative zones may severely bias segregation measurements. Instead, spatial clustering algorithms, which are designed to control MAUP scale and zoning biases, can provide a robust methodological approach for comparing segregation among very diverse cities.
VI. Conclusions
Urban segregation is a universal and ancient phenomenon with profound social implications, but the adequate measurement of segregation presents technical challenges. In particular, segregation indexes may be affected by MAUP scale and zoning inconsistencies, thus biasing comparative urban studies. In this article, we have developed multiscalar indexes to provide robust evidence for comparing segregation in Chilean cities, contributing relevant knowledge regarding methodology, urban structures and policy recommendations.
From a methodological perspective, this study shows the usefulness of regionalization methods(78) for producing robust measures of segregation in comparative urban studies. Based on results for most Chilean cities, we argue that multiscalar indexes of segregation, using spatial clustering algorithms, make it possible to cope simultaneously with scale and zoning MAUP biases.
Regarding urban structures in Chile, we have presented useful evidence for understanding the relationships between segregation and scale, and for providing a comprehensive perspective on socioeconomic differentiation in urban space. On one hand, we have confirmed the positive correlation between segregation and city size in Chile, contesting Krupka’s(79) argument about the spuriousness of this relationship (Section V). We have also shown that the potential for mixing increases with city size, observing that big cities would be less segregated than small ones if households were randomly distributed (Figure 3). Thus, the correlation between segregation and city size is not a mechanical consequence of growing populations and it might be caused by intertwined economic processes: the specialization of the workforce in big cities, higher income inequality, the higher bidding capacity for urban space of global companies and well-paid workers, large homogeneous housing developments, and circular causation are among these phenomena.(80) Moreover, market-oriented urban policies(81) have reinforced urban segregation in Chile over the last 40 years of rapid economic growth and urban development.
On the other hand, the measurement of socioeconomic segregation highlights the need to study this phenomenon in terms of the spatial specialization between both ends of the social hierarchy, rather than focusing only on disadvantaged groups. Previous research in Greater Santiago has shown that high-income spatial homogeneity is the main driver of segregation.(82) In this city, the spatial concentration of the elites is key for upper-class social reproduction, and it is also a main factor underpinning properties’ surplus value.(83) Large high-education clusters can be observed in most Chilean cities (examples in Maps 1 and 2), and the presence or absence of the upper class is reflected in higher or lower segregation indexes of small and intermediate cities respectively. This systematic class division in urban spaces could be an important aggravating factor for social tensions, which have exploded across all of Chile since October 2019.
The intensity and ubiquity of segregation in Chilean cities show the necessity of implementing strong desegregation policies that should be differentiated by city size. Housing-mix policies that would require social housing quotas in private developments are feasible in Chile (see Section IIIa), considering the weak budget of the state and a relatively fast rate of housing stock growth.(84) These policies should be focused on central areas of big cities with high levels of segregation, which attract considerable investment in high-rise buildings. To complement these housing-mix policies, area-based policies such as “Quiero mi barrio”(85) should be sustained for longer periods and reinforced with employment, education and health programmes, in order to improve living conditions and lifetime opportunities in segregated poor neighbourhoods. This kind of area-based policy could also be a substantial contribution for improving living conditions in poor neighbourhoods of small and intermediate cities, where the scarcity of big private developments implies a weaker basis for housing-mix policies. Dispersion policies have never been tested in Chile and they have shown inconsistent results in other countries, so we would not recommend this alternative before increasing the effort on housing-mix and area-based policies.
This research has been possible due to the availability of exhaustive census data for all Chilean cities, at the individual level and georeferenced by blocks. We do not have access to similar databases elsewhere, but it would be useful to reproduce this methodology in other countries, in order to ascertain if the correlation between segregation and city size is a general or context-dependent phenomenon. In forthcoming research, the adoption of spatially unbiased measures of segregation could allow for the improvement of international urban comparisons.
Supplemental Material
garreton-supplement – Supplemental material for Exploring the correlation between city size and residential segregation: comparing Chilean cities with spatially unbiased indexes
Supplemental material, garreton-supplement for Exploring the correlation between city size and residential segregation: comparing Chilean cities with spatially unbiased indexes by Matias Garreton, Agustin Basauri and Luis Valenzuela in Environment & Urbanization
Footnotes
Funding
The authors disclosed receipt of the following financial support for the research, authorship, and/or publication of this article: The authors acknowledge funding from the Centre for Social Conflict and Cohesion Studies (COES, CONICYT/FONDAP/15130009).
Supplemental material
Supplemental material for this article is available online.
Notes
References
Supplementary Material
Please find the following supplemental material available below.
For Open Access articles published under a Creative Commons License, all supplemental material carries the same license as the article it is associated with.
For non-Open Access articles published, all supplemental material carries a non-exclusive license, and permission requests for re-use of supplemental material or any part of supplemental material shall be sent directly to the copyright owner as specified in the copyright notice associated with the article.