
Abstract
“Clean Team” provides serviced, free-standing toilets as a sanitation option in low-income areas of Kumasi, Ghana. A cross-sectional survey was carried out to assess sanitation and hygiene practices in 199 Clean Team households and 201 neighbouring, non-Clean Team households. Adults in non-Clean Team households were no more likely to report unsafe defecation (faeces not contained in a latrine) than their Clean Team neighbours, although their reliance on public toilets may lead to occasional unsafe practices. Children in Clean Team households used the household toilet from a younger age than those in non-Clean Team households, and their faeces were thus more often disposed of safely. Soap and water were more frequently found at the latrine in Clean Team households than in latrine-owning non-Clean Team households.
Use of Clean Team toilets is likely to reduce faecal contamination of the environment through safer child defecation and stool disposal practices, and may increase the opportunity for post-defecation handwashing with soap.
I. Introduction
Clean Team is a social enterprise in Kumasi, Ghana offering serviced, free-standing toilets as a sanitation option for households in dense, low-income areas. This paper reports the findings of a study to explore the household sanitation and hygiene practices associated with Clean Team toilet uptake, practices that have the potential to impact on public health. In this cross-sectional study the current practices of Clean Team households are compared with their pre-Clean Team practices and with the practices of non-Clean Team neighbours.
II. Background
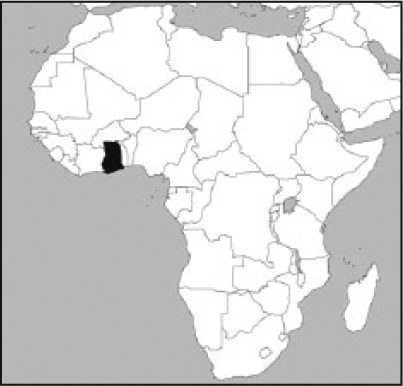
Kumasi is the administrative capital of the Ashanti region of Ghana. It is home to West Africa’s largest open-area market and is a commercial and transport hub in both Ghana and neighbouring countries. With a population of over two million and a high annual growth rate of 5.5 per cent, Kumasi is a close second to the capital Accra, some 270 kilometres away, for the position of Ghana’s largest city.(1) Half of the inhabitants of Kumasi live in high-density areas characterized by poor infrastructure. An estimated 43 per cent of Kumasi’s homes use a toilet connected to a septic tank, 36 per cent use fee-charging public toilets (60 per cent in indigenous, traditional-material housing areas(2)), and 18 per cent use a pit latrine or a Kumasi ventilated improved pit latrine (KVIP).(3) Open defecation is rare in the city (2 per cent of households practise it), and the use of bucket latrines – previously commonplace – has been made illegal as it is associated with indiscriminate dumping of faecal waste. The use of a bucket latrine, reported by 0.2 per cent of the population, may be underreported.(4) “Flying toilets” (faeces-filled plastic bags that may be disposed of outside) are still anecdotally reported to be in use. A sewerage system serves around 300 dwellings in a small area in the city centre only,(5) at a cost prohibitive to further expansion.(6) Clean Team provides customers with a free-standing, urine-diverting, chemical toilet in their home. Urine is diverted to either a drain or a storage vessel, and faeces are retained in a sealable container within the toilet. A reservoir of perfumed, anti-bacterial, chemical solution in the container covers the faeces and reduces smell and insect problems (Photos 1A, 1B and 1C).
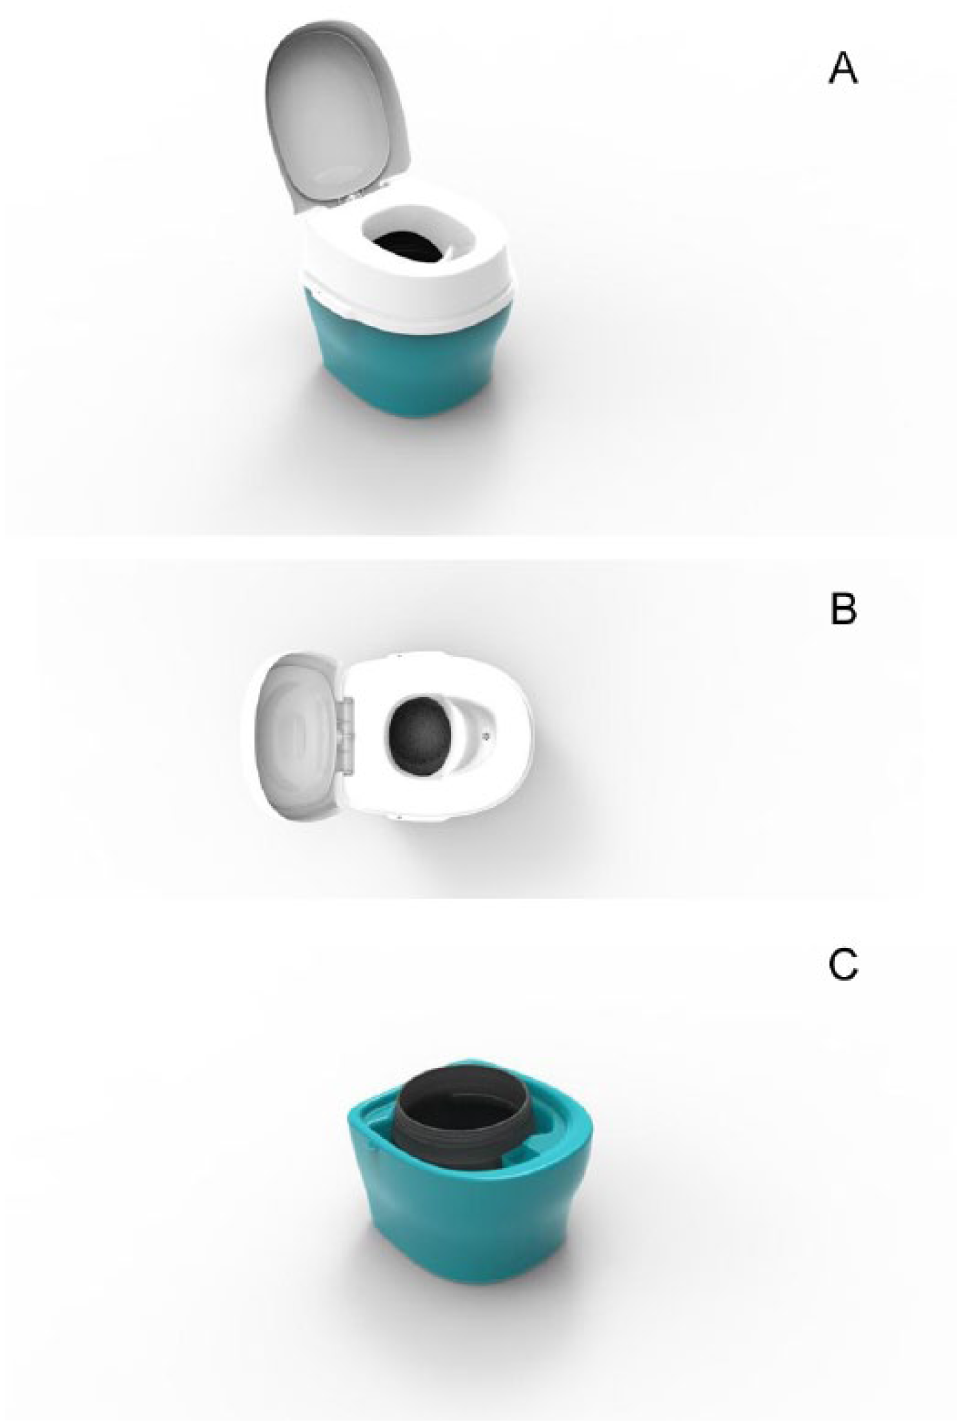
The Clean Team container-based, free-standing toilet
The design allows for easy and hygienic emptying. The waste container can be sealed and removed by a service operative and replaced with a fresh one. This is done between two and four times per week depending on the level of service for which the client pays. The containers of faeces are taken off-site, the faeces are disposed of at a waste treatment plant, and the containers are cleaned for re-use. In contrast to the outlawed bucket latrines, the physical separation and containment of faeces within the Clean Team toilets, the training and equipment provided for service operatives, and the site of the final disposal of waste ensure safe management of faeces. The benefits of container-based sanitation systems over bucket latrines are explored elsewhere in more detail.(7) Further information can also be found at www.cleanteamtoilets.com.
Clean Team Ghana Limited has been operating in Kumasi since July 2011, and currently serves over 500 households. The first clients were recruited door-to-door by Clean Team sales representatives and thereafter through mass recruitment drives in the community and by word of mouth.
Clean Team customers pay an average of US$ 11.02 per month for their toilet. (By contrast, once-daily use of a public toilet by a family of four would cost between US$ 3.60 and 18 per month depending on the fee charged by the operator of the toilet they use.) If either party wishes to end the Clean Team contract, the toilet can simply be removed. Most Clean Team customers continue to subscribe, however, implying that they value the service provided.
From a public health perspective, the value of Clean Team toilets depends partly on the safe handling and final disposal of faeces by service operatives, but also on how the service influences the sanitation and hygiene practices of individuals in subscribing households. Specifically, the public health implications depend on the extent to which uptake of Clean Team toilets results in: i) the household-level containment of faeces that would otherwise end up outside, and ii) the increased likelihood of handwashing with soap after defecation.(8) Safe stool disposal, particularly of child faeces that more frequently contaminate the home environment, is important for reducing risk of diarrhoea.(9) As discussed by Cairncross and colleagues, the health benefits of sanitation are unlikely to be realized unless the majority of individuals in a community adopt safe sanitation practices.(10) Indeed, the limited impact shown by recent sanitation trials can be largely attributed to low sanitation coverage (and use).(11)
This study sought to address the following questions: Is the Clean Team toilet used as the usual place of defecation for all household members or for certain individuals only? How do Clean Team households compare with non-Clean Team households and with their own pre-Clean Team conditions with respect to the usual place of defecation, disposal of children’s faeces, and presence of soap and water at the place of defecation?
III. Methods
a. Study design and setting
A cross-sectional survey and a small qualitative study were carried out in low-income urban areas of Kumasi City, Ghana. Homes in the study areas, as in much of Kumasi,(12) were typically single- and multi-storey traditional compound houses, in which five to ten individual households occupied single rooms and used communal cooking and bathing areas or had small private bathing areas separated off inside their dwelling room. Single-storey compounds – the “indigenous” sector – are generally characterized as housing of high density and low socioeconomic status.(13)
The survey covered two exposure groups: households with a Clean Team toilet and neighbouring households that had never been Clean Team customers.
b. Outcome measures
The survey collected data on the outcome measures listed below:
The proportion of household members practising safe faeces disposal.
The proportion of households where the faeces of all household members are disposed of safely.
The proportion of those households using a sanitation facility at home in which the presence of soap and water was observed beside the facility.
In this study we defined “safe faeces disposal” as defecation or disposal of faeces in a public toilet or any household toilet or latrine including a Clean Team toilet, i.e. a sanitation option that allows faeces to be isolated from the environment.
Our definition differs from the WHO/UNICEF Joint Monitoring Programme (JMP) for Water Supply and Sanitation definition of “improved” sanitation, which refers to any sanitation solution “that hygienically separates human excreta from human contact”.(14) The current JMP definition would classify the Clean Team toilet as a bucket latrine, and it includes bucket latrines along with public toilets among those solutions classified as “unimproved” sanitation. The JMP definition has offered a measurable indicator of progress towards the Millennium Development Goal target for provision of basic sanitation, and will continue to be useful for monitoring progress towards the new target for Sustainable Development.(15) However, it is a broad measure intended for monitoring trends and does not take into account nuances such as safely managed manual emptying or consistent usage, and well-maintained shared or public sanitation. Our purpose was not to challenge the JMP definition but simply to define terms appropriate for our own study.
c. Sampling
The sample size was calculated for comparison of proportions for two primary outcomes: the proportion of individuals practising safe faeces disposal and the proportion of households with all members practising safe faeces disposal. A household was defined as individuals who normally live and eat together (same “room”). Sample size was computed for a range of possible proportions and based on simple random sampling with 90 per cent power and an alpha of 0.05. The final sample size was selected pragmatically (proportion in Clean Team households=0.5, proportion in non-Clean Team households=0.35) that was anticipated to reflect what the study would find and was feasible for data collection: n=200 per group.
Clean Team households were randomly selected from 569 entries in the Clean Team customer database. Households that had been with Clean Team for less than one month were excluded. An equal number of neighbouring, non-Clean Team households were randomly selected using a standardized protocol to identify target households from an adjacent compound or floor (in the case of multi-storey residential blocks). Selected households that declined to participate or could not be contacted after a repeat visit were replaced by the next household on the randomized client list (Clean Team sample), or by re-numbering and randomizing the remaining households (non-Clean Team sample).
d. Data collection
Data were collected from 199 Clean Team households and 201 non-Clean Team households in 16 poor neighbourhoods. A verbally administered, structured questionnaire was used to collect data on household characteristics and sanitation and hygiene practices. Data were recorded using the mobile phone-based application nfield capi. Clean Team households were asked to report on current practice and pre-Clean Team practice. Primary respondents were female heads of household or senior female caregivers as they were considered best placed to report on disposal of child faeces. Questions on usual and occasional defecation practices and disposal of adult faeces from chamber pots (if reported) were administered to all household members aged seven years and over who were present at the time of the survey. The primary respondent answered on behalf of younger children and any household members absent at the time of the survey. The primary respondent also reported on the usual place of disposal of child faeces. Spot-check observation was used to collect information on the functional condition of a household latrine – modified from Jenkins et al., to include structural safety of use, adequate containment of waste, privacy achieved and presence of a slab (if pit latrine)(16) – and the presence of soap and water at the place of defecation. In addition, spot-check observation at a minimum of two public toilets in each survey area was used to record the type of facilities and presence of soap and water at these common places of defecation. Public toilets were selected by asking inhabitants of the respective areas for the location of the nearest public toilet, which was subsequently visited.
e. Qualitative study
Qualitative data were collected through two focus group discussions (one each with Clean Team and non-Clean Team users) and semi-structured interviews with 10 Clean Team users. Respondents came from a convenience sample from two neighbourhoods. Information on user fees and policies on allowing disposal of child faeces from chamber pots at public toilets was obtained through interviews with the caretaker at each facility visited.
f. Data analysis
The quantitative data were transferred into Stata 13 for cleaning and analysis. The relative socio-demographic status of participating households was determined by principal components analysis of household assets, following Vyas and Kumaranayake.(17) Simple descriptive analyses were performed and differences between Clean Team and non-Clean Team household means and proportions compared using appropriate statistical tests (independent samples t test and chi-square, including score test for trend), stratified by age.
Differences in use of a potty by children aged two–six in Clean Team and non-Clean Team households with a latrine and non-Clean Team households without a latrine were explored using a risk difference regression model (generalized linear model with identity link and binomial distribution). Standard errors were adjusted for household-level clustering by using robust standard errors. Reported and self-reported usual defecation practices were used to generate a binary individual-level measure of safe faeces disposal whereby anyone reporting that they usually defecate somewhere other than in a latrine was considered unsafe unless their faeces were ultimately disposed of in a latrine. A household-level measure of safe faeces disposal was created by considering the safety of faeces disposal of all household members. Differences between the proportion of Clean Team users and households practising safe defecation were compared with pre-Clean Team practices using the McNemar test for paired data.
g. Ethics and consent
Ethical approval for the study was given by the ethics committee of the London School of Hygiene and Tropical Medicine and the Ghana Health Service Ethical Review Committee. Witnessed, written informed consent was obtained for all respondents over 18 years. Caregivers gave written consent on behalf of all household members under the age of 18. Individuals aged 7 to 17 were presented with simpler information and also provided written assent.
IV. Results
a. Characteristics of households participating in the cross-sectional survey
Data were collected from 199 Clean Team households and 201 non-Clean Team households in 16 poor urban neighbourhoods. Eighty-seven Clean Team households had been using a Clean Team toilet for more than one year. Overall, five Clean Team and 23 non-Clean Team households declined to participate in the study or were unavailable after a repeat visit to the home.
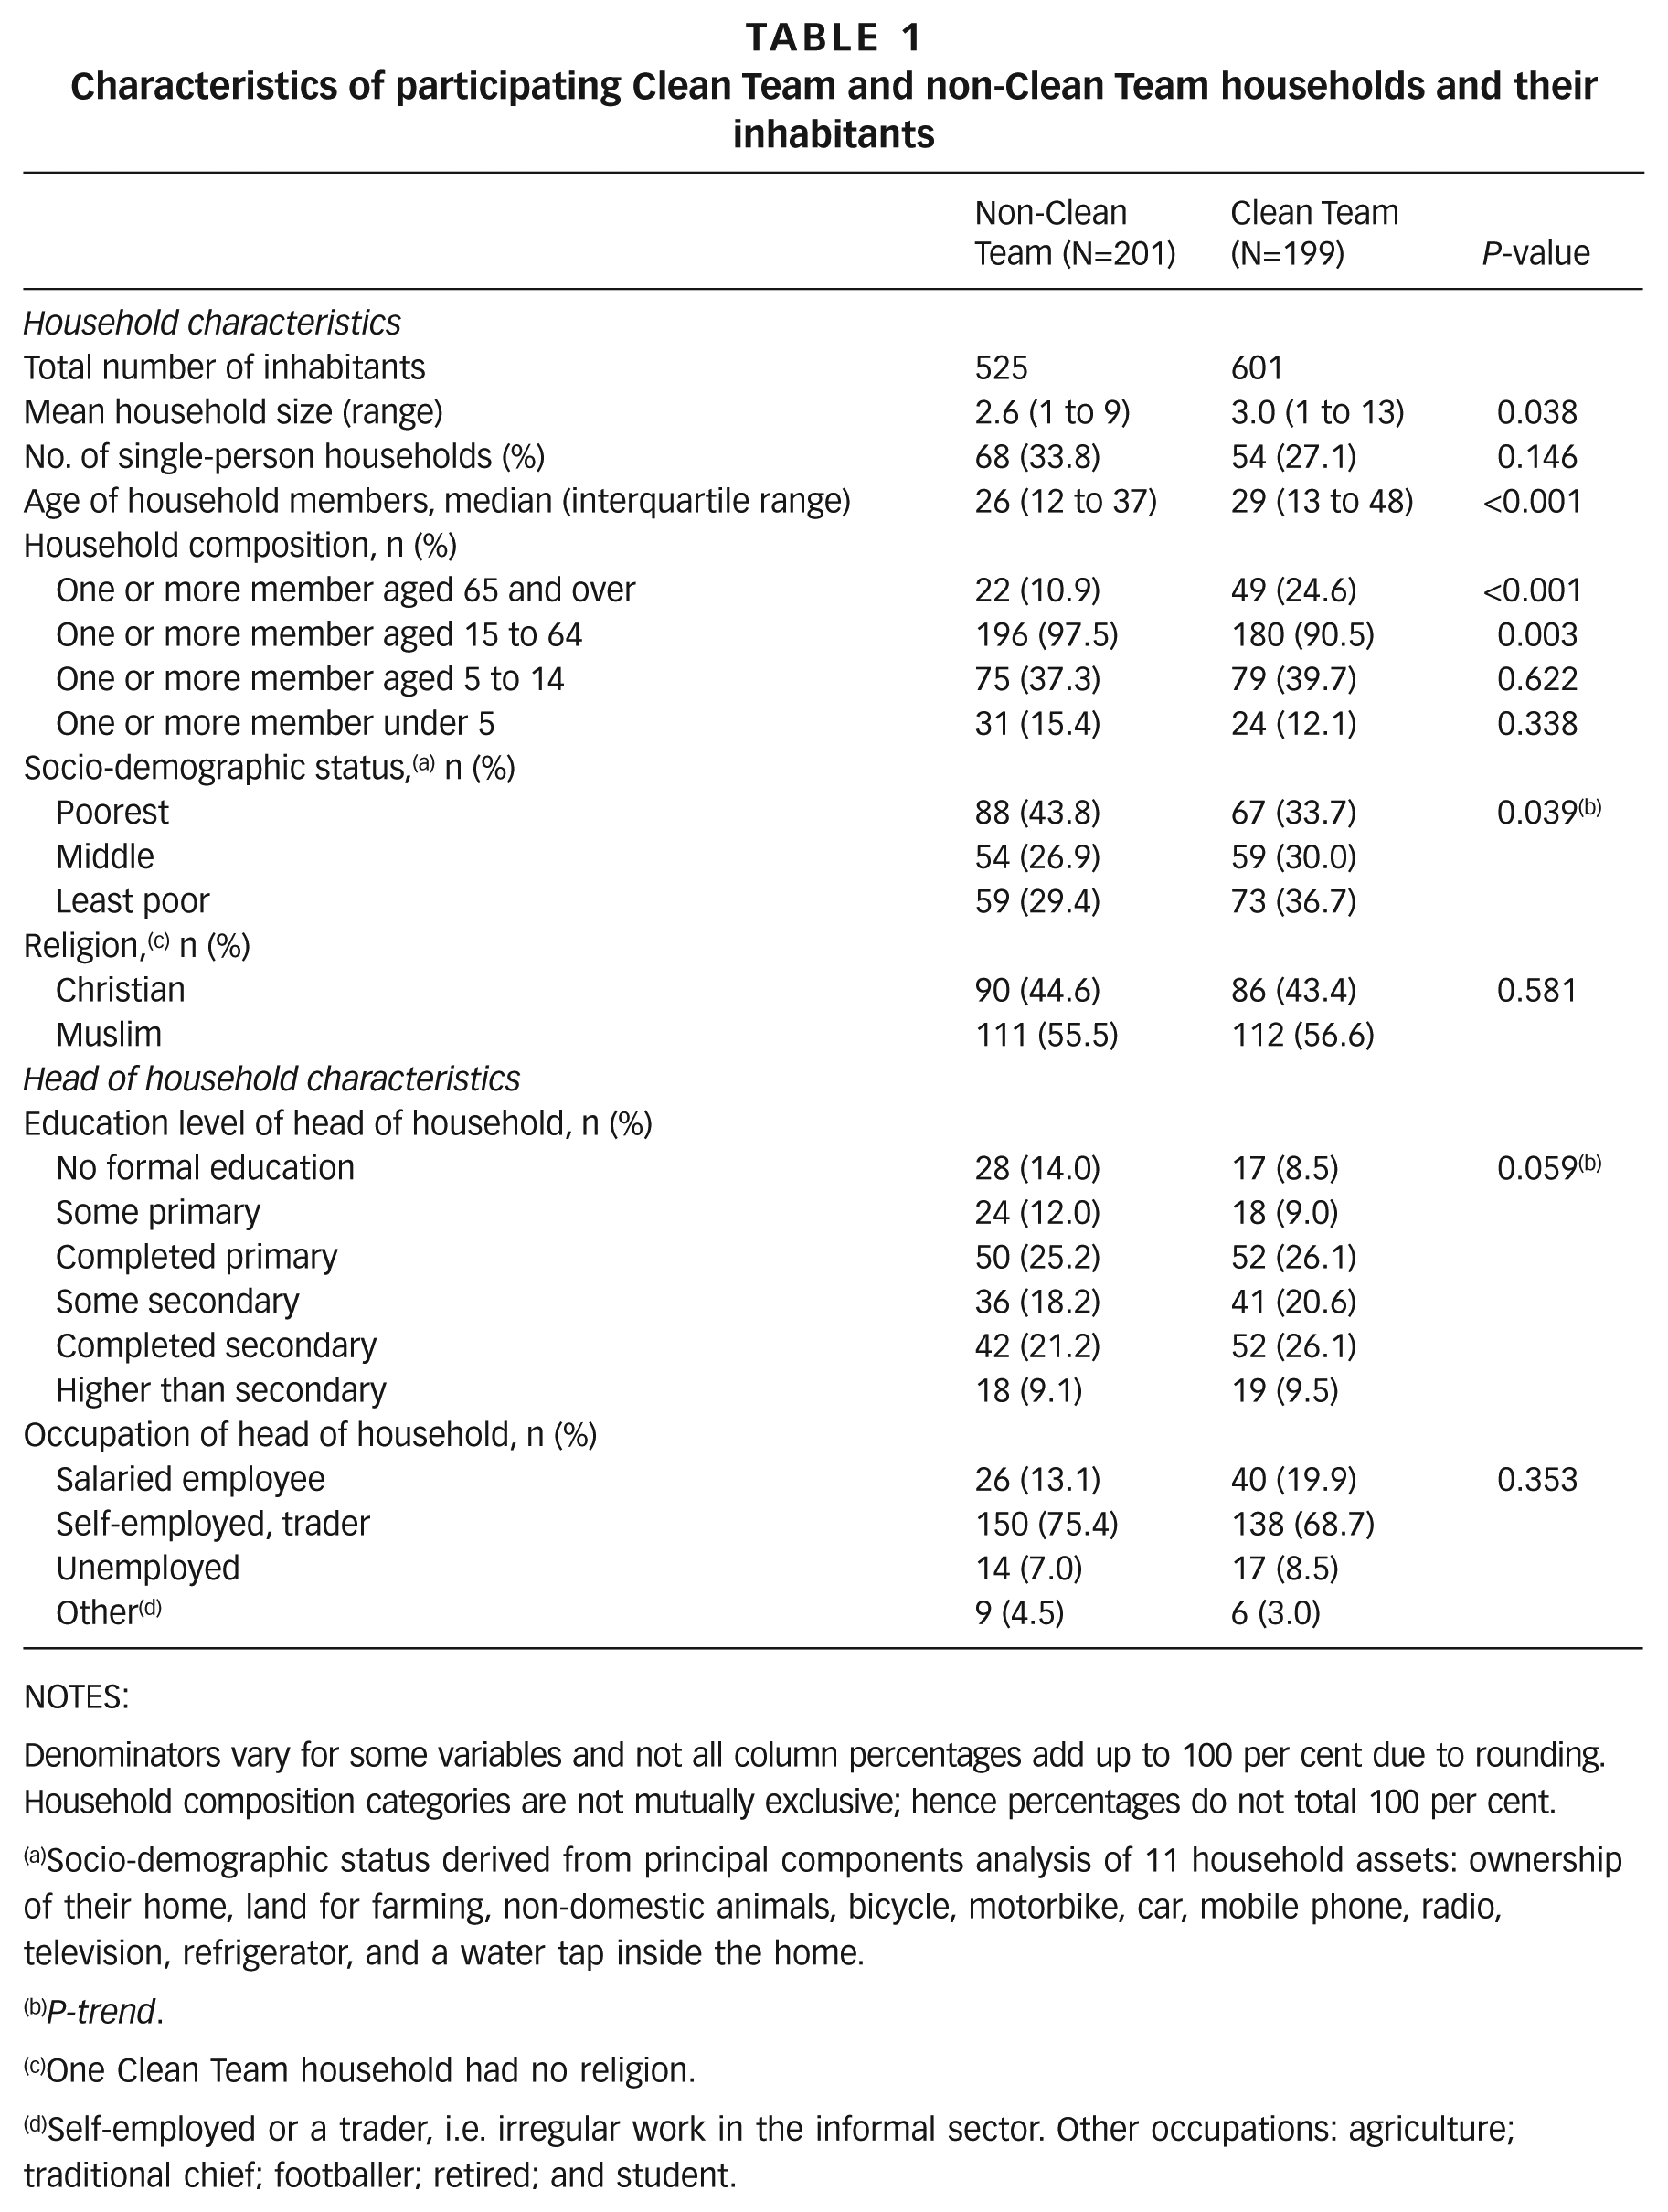
Clean Team households were slightly larger in size than those of their non-Clean Team neighbours (mean of 3.0 household members vs. 2.6 respectively, p=0.038), more frequently housed older individuals (25 per cent vs. 11 per cent had one or more inhabitants over 65, p<0.001), and had more educated household heads (p-trend<0.001). Clean Team households were of higher socioeconomic status than non-Clean Team households (p-trend=0.039). More Clean Team than non-Clean Team households (37 per cent vs. 29 per cent) fell into the highest socioeconomic grouping in this sample. Slightly more than half of all households in both groups identified themselves as Muslim (57 per cent Clean Team, 56 per cent non-Clean Team); the remainder were Christian. These results are shown in Table 1.
Characteristics of participating Clean Team and non-Clean Team households and their inhabitants
NOTES:
Denominators vary for some variables and not all column percentages add up to 100 per cent due to rounding. Household composition categories are not mutually exclusive; hence percentages do not total 100 per cent.
Socio-demographic status derived from principal components analysis of 11 household assets: ownership of their home, land for farming, non-domestic animals, bicycle, motorbike, car, mobile phone, radio, television, refrigerator, and a water tap inside the home.
P-trend.
One Clean Team household had no religion.
Self-employed or a trader, i.e. irregular work in the informal sector. Other occupations: agriculture; traditional chief; footballer; retired; and student.
b. Reasons for uptake of a Clean Team toilet
Respondents in interviews and focus groups gave reasons for taking up the Clean Team service that were related to dissatisfaction with their previous sanitation. The main sources of dissatisfaction were lack of cleanliness, smell and lack of convenience. The pedestal design of the Clean Team toilets was also valued by elderly users who had difficulty squatting. Clean Team toilets were believed to particularly benefit the sick or those with mobility problems and families with elderly or young members. An elderly respondent said: “Previously we would use a chamber pot as we cannot get out of the house easily to the public toilet. That was difficult with my bad back and it was very smelly.” Other household members commented that addressing the needs of older members was a motivation for uptake of Clean Team since Clean Team toilets were easier to use for older people, both because they did not have to walk so far to access them and because they were seated rather than squatting toilets. Focus group participants with young children commented that the Clean Team toilet was cleaner and safer, especially at night, and “easier when they need to go and you are busy doing something”.
c. Sanitation access
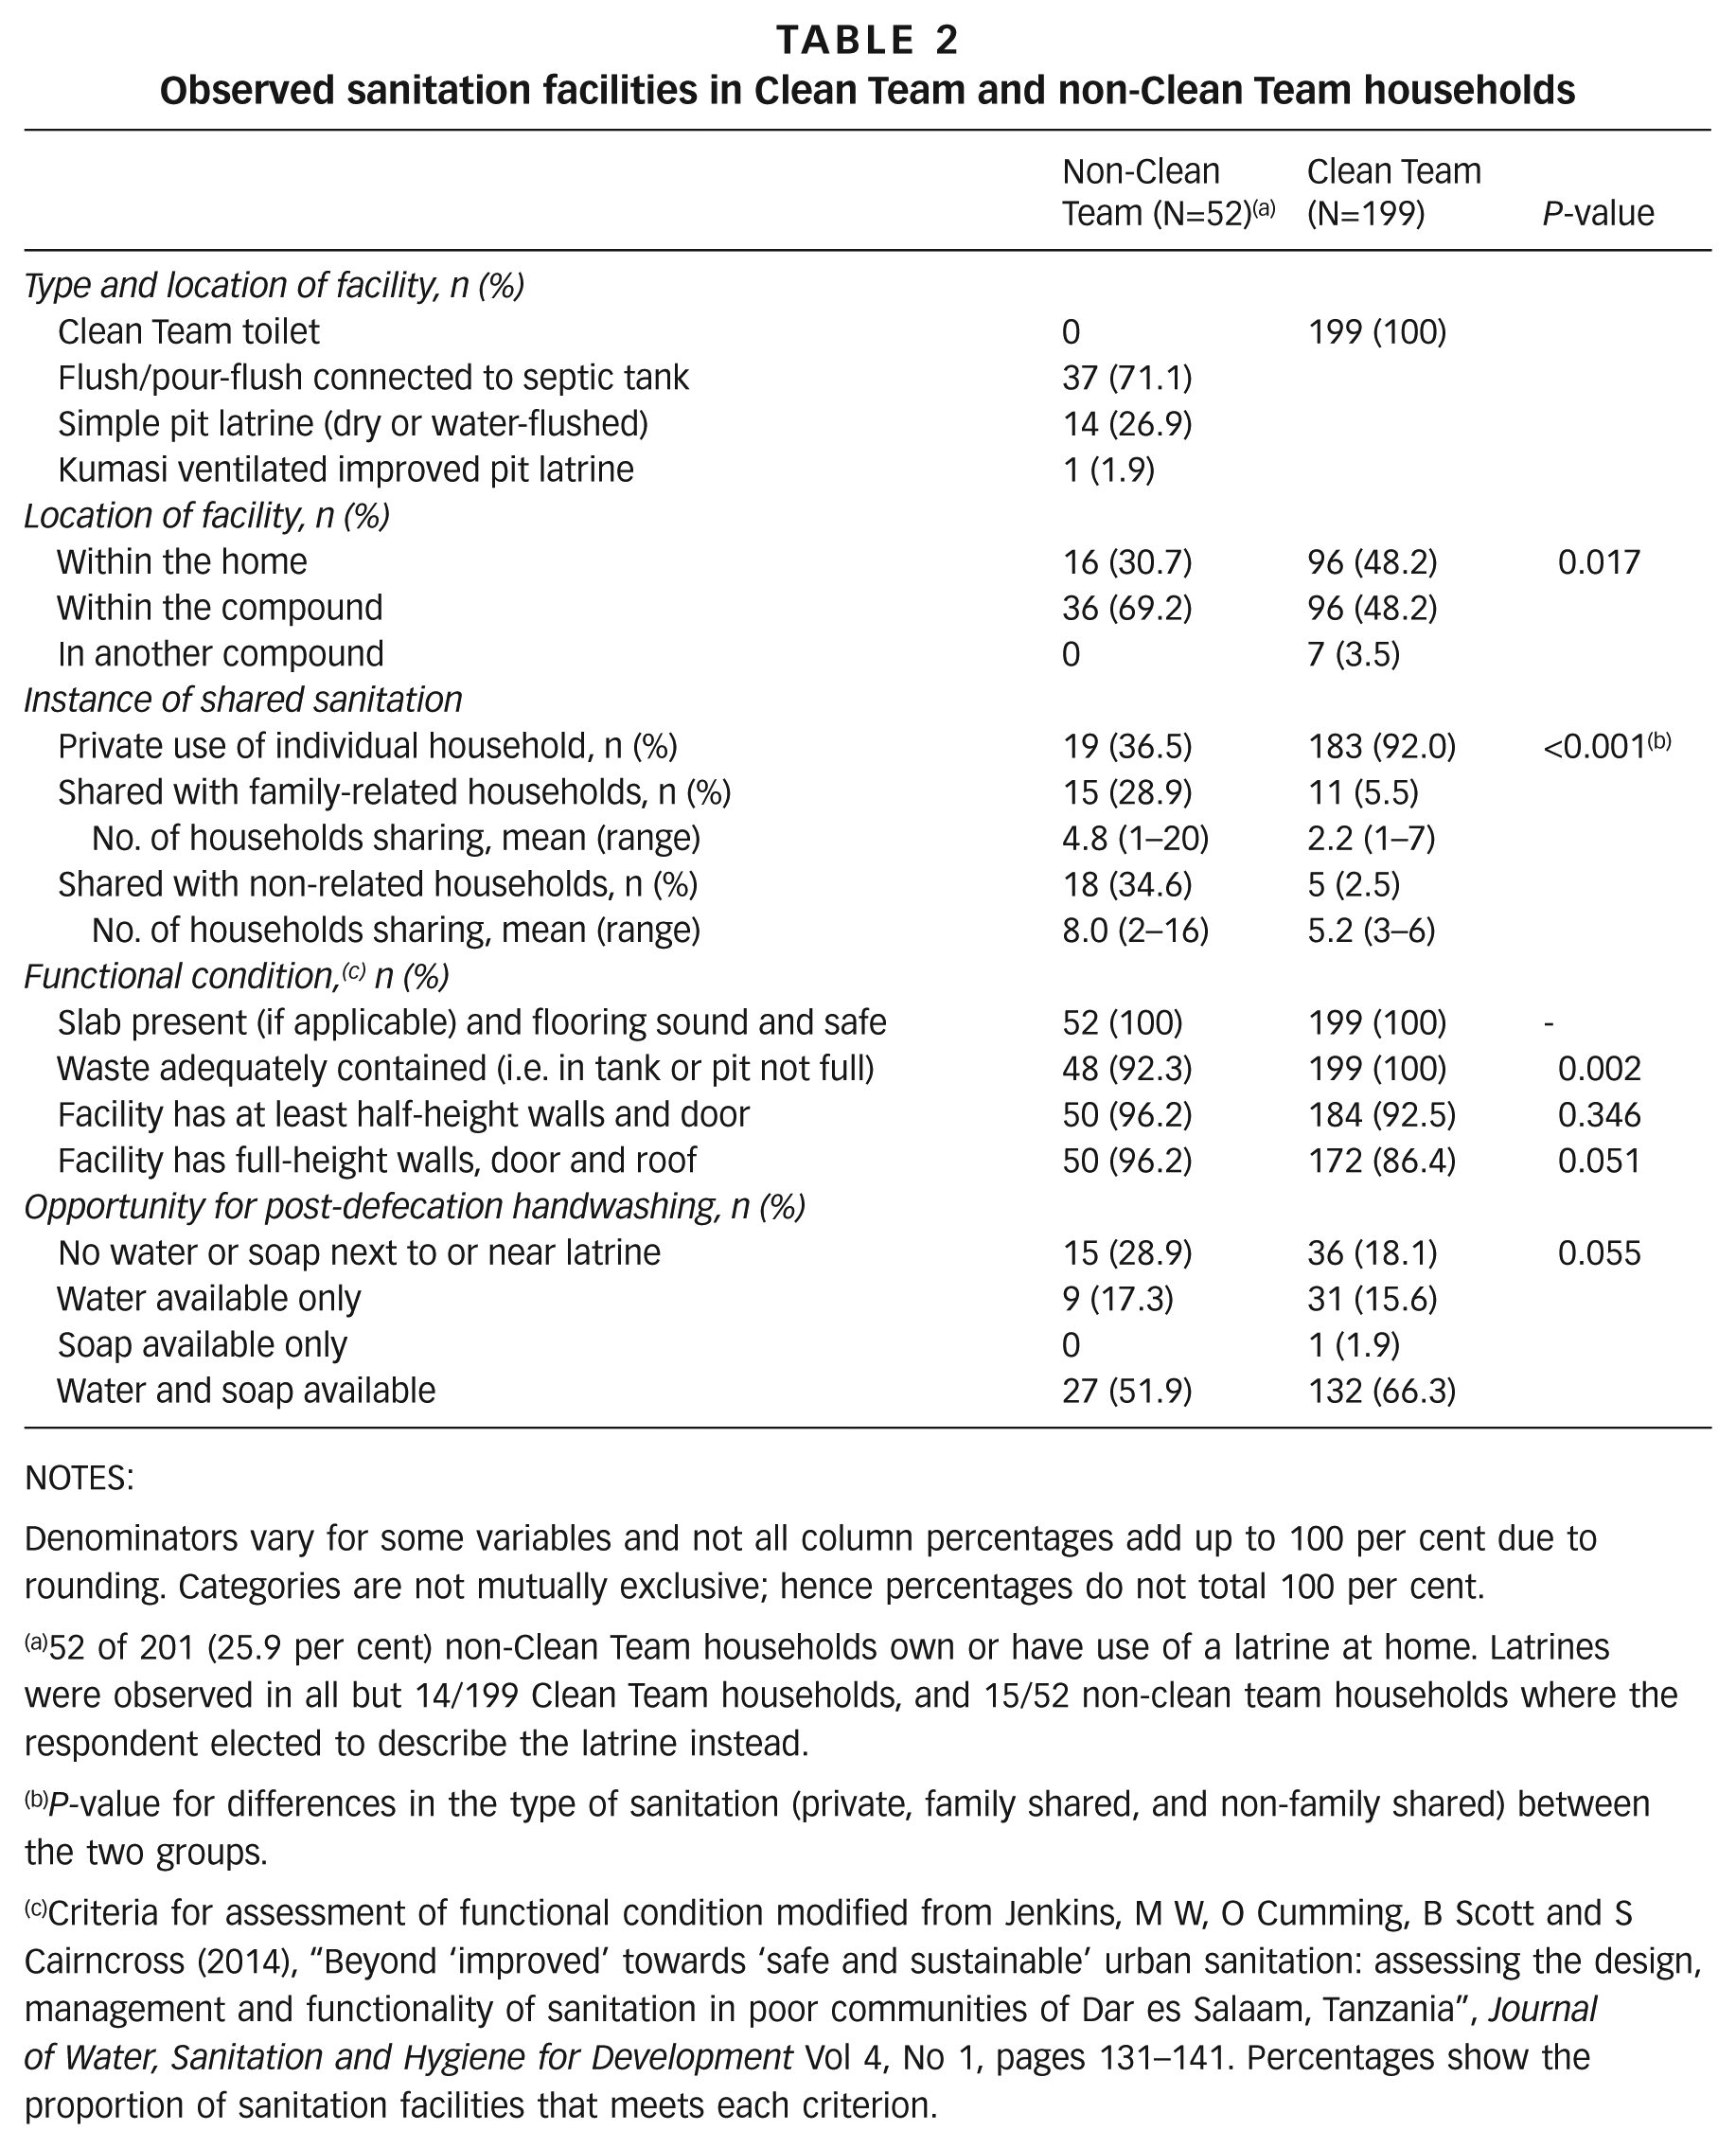
A quarter (n=52) of non-Clean Team households owned or used a sanitation facility in their home or compound (Table 2). The majority of these were flush or pour-flush toilets connected to a septic tank and the remainder were pit latrines. All latrines had slabs and all but two had adequate privacy (full-height walls and a door). Most of these toilets were situated in the compound rather than inside the dwelling (which requires permission from the landlord), and 63 per cent were shared among households. By contrast, half of Clean Team toilets were inside the dwelling and almost all were used by one household only (p<0.001). Toilets in non-Clean Team households were more frequently shared than those in Clean Team households. Furthermore, shared toilets in non-Clean Team households were shared among a greater number of households than the shared Clean Team toilets (mean of 6.5 vs. 3.1 households, p=0.007).
Observed sanitation facilities in Clean Team and non-Clean Team households
NOTES:
Denominators vary for some variables and not all column percentages add up to 100 per cent due to rounding. Categories are not mutually exclusive; hence percentages do not total 100 per cent.
52 of 201 (25.9 per cent) non-Clean Team households own or have use of a latrine at home. Latrines were observed in all but 14/199 Clean Team households, and 15/52 non-clean team households where the respondent elected to describe the latrine instead.
P-value for differences in the type of sanitation (private, family shared, and non-family shared) between the two groups.
Criteria for assessment of functional condition modified from Jenkins, M W, O Cumming, B Scott and S Cairncross (2014), “Beyond ‘improved’ towards ‘safe and sustainable’ urban sanitation: assessing the design, management and functionality of sanitation in poor communities of Dar es Salaam, Tanzania”, Journal of Water, Sanitation and Hygiene for Development Vol 4, No 1, pages 131–141. Percentages show the proportion of sanitation facilities that meets each criterion.
d. Access to soap and water
Water availability was generally good. Many households had either a tap in the yard or compound or a tap on the street immediately outside. Almost all households had containers of stored water beside the house. Soap and water were more commonly found together near the Clean Team toilets (66 per cent) than by the toilets in non-Clean Team households (52 per cent), p=0.055 (Table 2). Independent of having a Clean Team toilet, availability of soap and water was 25 per cent more likely in households with a private latrine. Both water and soap were also more frequently present at the main handwashing location in Clean Team homes than in non-Clean Team homes: water present=173 (87 per cent) Clean Team households vs. 132 (66 per cent) non-Clean Team households, p<0.001; and soap present=156 (78 per cent) Clean Team households vs. 89 (44 per cent) non-Clean Team households, p=<0.001. Two Clean Team and three non-Clean Team households did not have soap anywhere in the home at the time of the survey.
e. Place of defecation for adults and older children
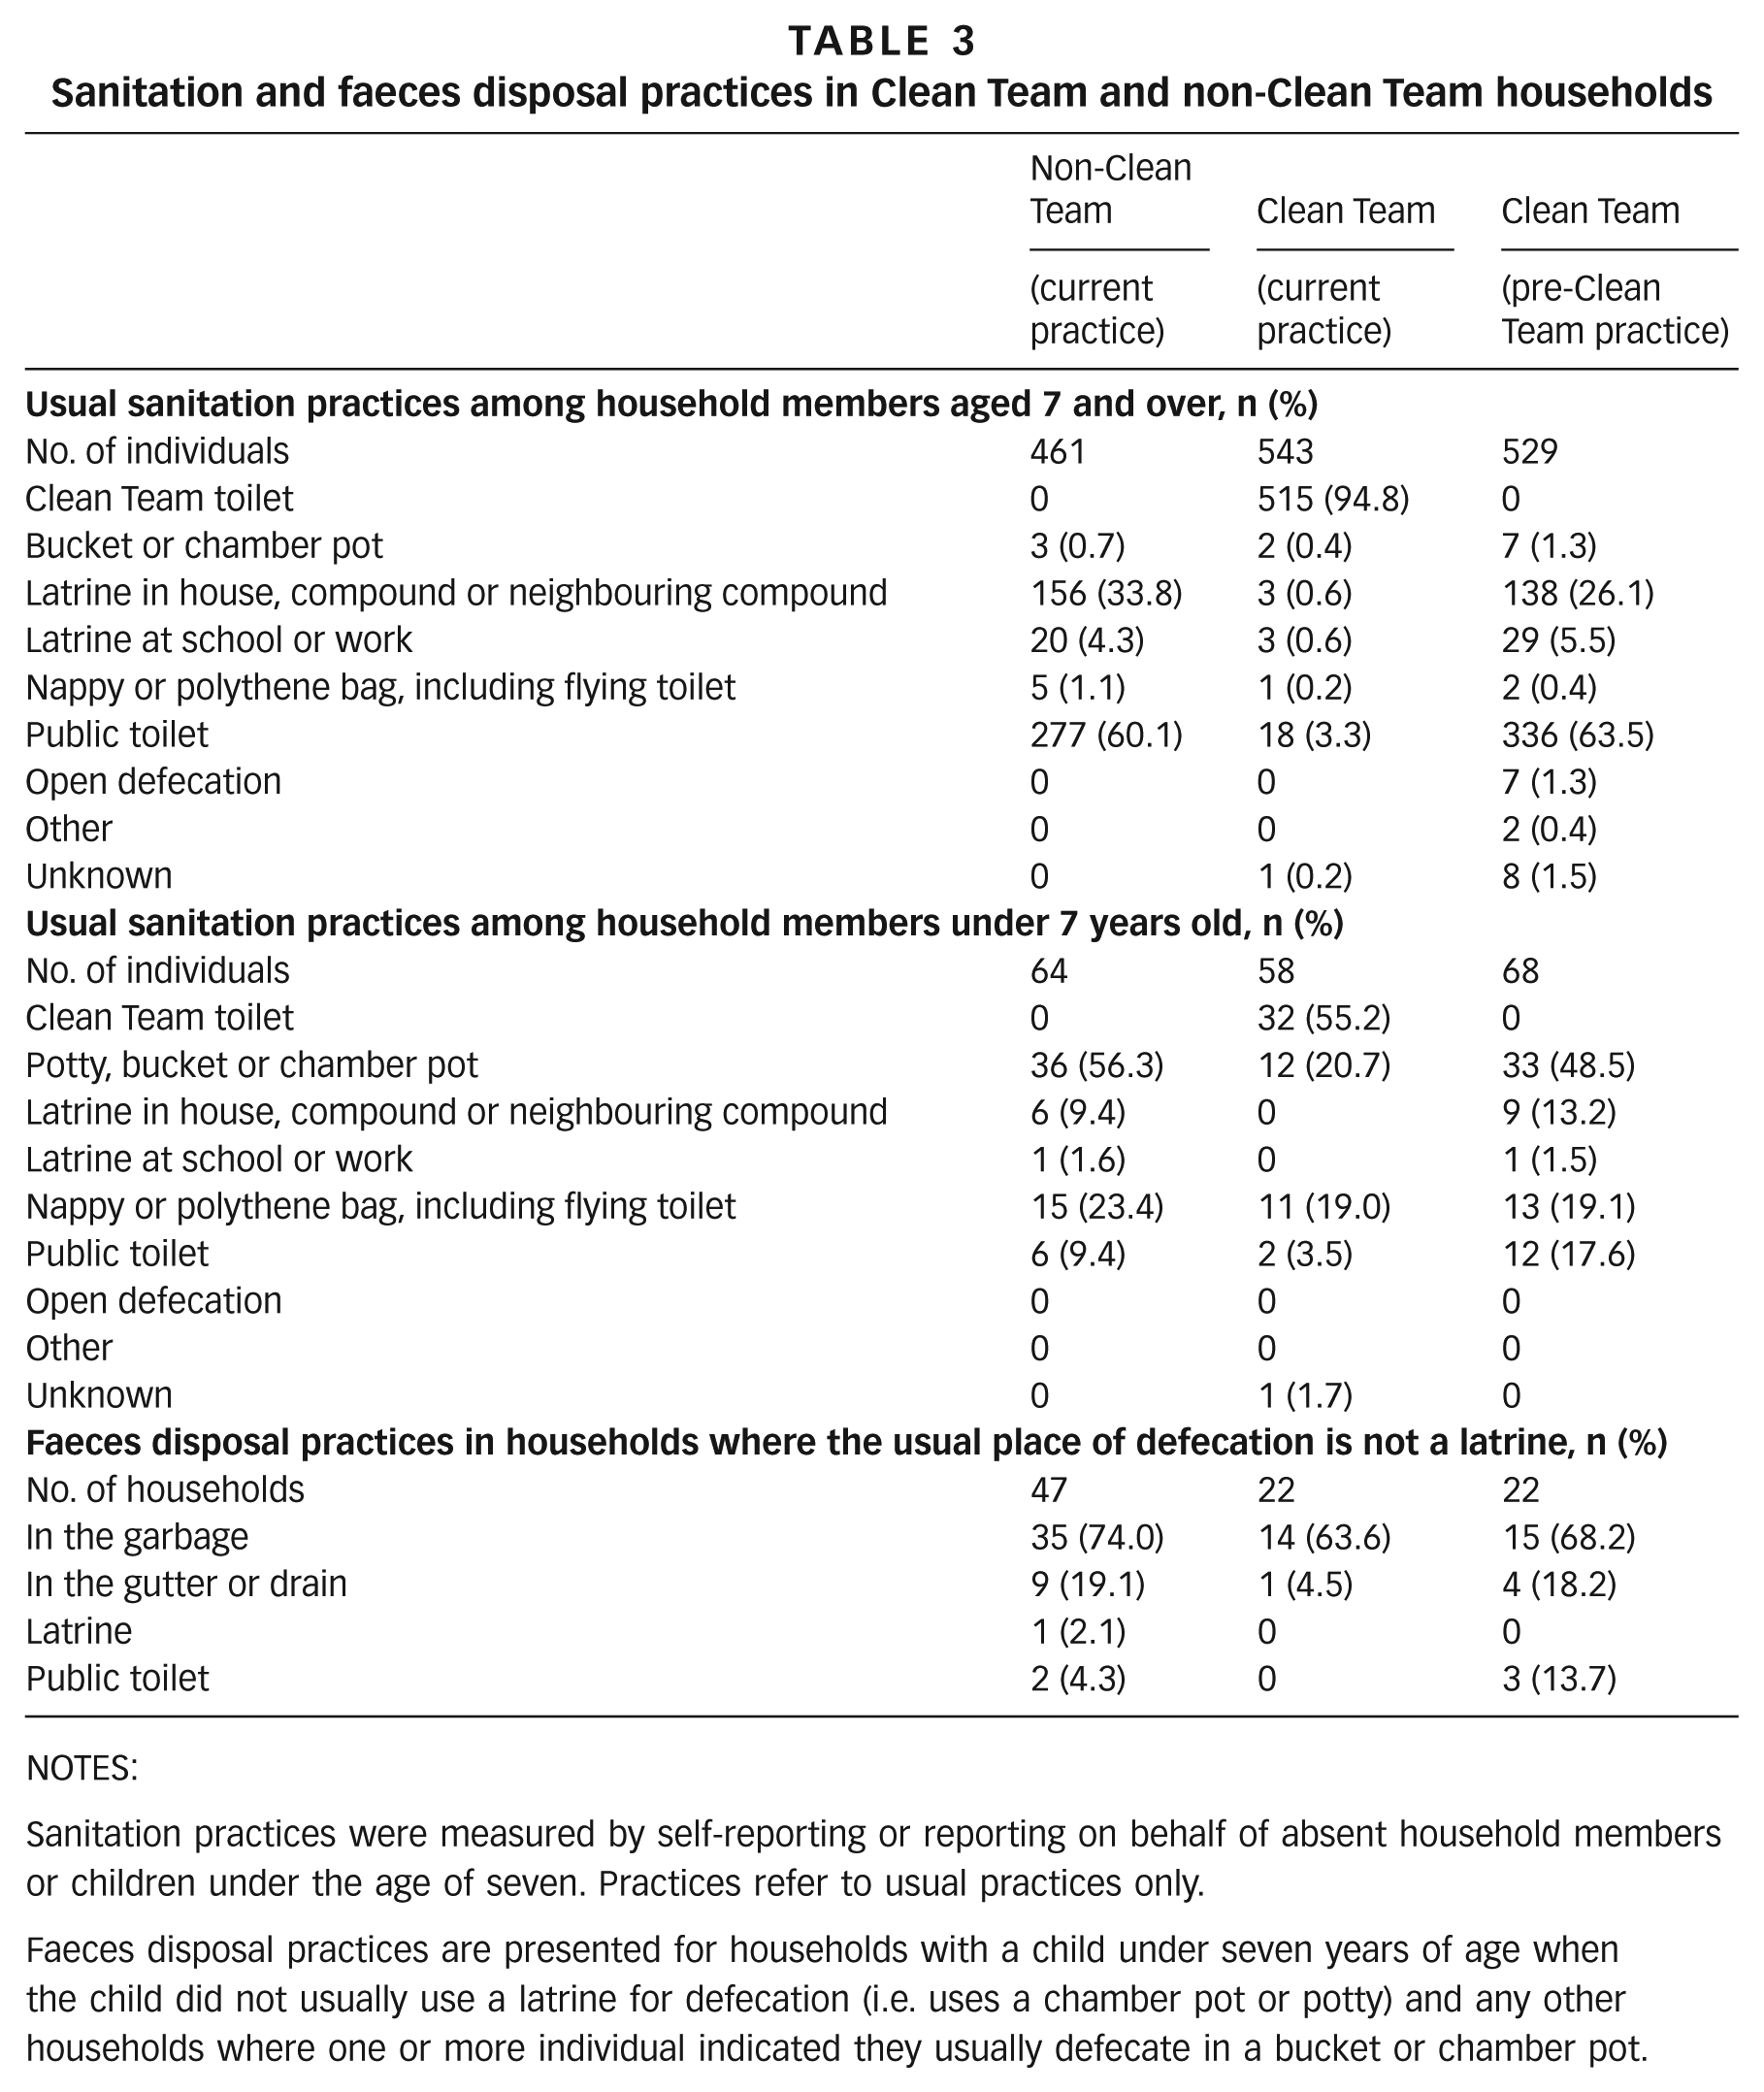
The defecation place was self-reported by 247 (41 per cent) and 229 (44 per cent) individuals in Clean Team and non-Clean Team homes respectively. Data on defecation practices for the remaining individuals were reported by the principal respondent in each household. Table 3 compares usual defecation and faeces disposal practices of Clean Team and non-Clean Team householders and households. It also presents reported practices in Clean Team households before they acquired a Clean Team toilet. As the form of sanitation used is related to age, findings are presented separately for household members above and below seven years of age.
Sanitation and faeces disposal practices in Clean Team and non-Clean Team households
NOTES:
Sanitation practices were measured by self-reporting or reporting on behalf of absent household members or children under the age of seven. Practices refer to usual practices only.
Faeces disposal practices are presented for households with a child under seven years of age when the child did not usually use a latrine for defecation (i.e. uses a chamber pot or potty) and any other households where one or more individual indicated they usually defecate in a bucket or chamber pot.
Sixty per cent of the 461 individuals aged seven years and over living in non-Clean Team households reported that they usually defecate in public toilets, while almost all remaining individuals reported that they usually use a latrine at home or in a neighbouring compound. Twenty individuals reported that a latrine at work or school was their usual place of defecation. All but one of these individuals were from a household with no form of home sanitation, and half were from the lowest socioeconomic grouping. Although only three individuals aged seven and over used a chamber pot as their main place of defecation, and none reported that they usually defecate in the open, a further 37 individuals admitted that they occasionally defecate in the open or use a chamber pot or flying toilet, in total representing 9 per cent of all individuals. In Clean Team households the Clean Team toilet was the usual (n=515) or occasional (n=3) place of defecation for 95 per cent of individuals seven years and older. Twenty-four individuals preferentially used public toilets or a latrine at school, work or home instead of the Clean Team toilet, and two-thirds of individuals occasionally used these facilities alongside their usual place of defecation.
Interviews in Clean Team households suggested that household members who chose not to use the Clean Team toilet disliked the possibility of being splashed, seeing other people’s faeces, and the smell that developed after a few days of use. Practices of Clean Team household members prior to uptake of Clean Team were similar to the current practices of their non-Clean Team neighbours, with the majority of individuals reporting use of public toilets or another latrine (Table 3).
f. Place of defection for younger children
Use of the Clean Team toilet by children under seven in Clean Team households was more frequent than use of other home or public latrines by children of this age group in non-Clean Team households. Use of chamber pots as the usual place of defecation by children under seven was significantly lower in Clean Team households than in non-Clean Team households (21 per cent vs. 56 per cent, p<0.001) (Table 3).
We explored these relationships further using a regression analysis that excluded children under two years old who would be unlikely to use a latrine (n=102). Thirty-two (65%) of 49 children aged two–six in Clean Team households primarily used the Clean Team toilet (mean age 4.9 years), while only five (28 per cent) of the 18 children of the same age in non-Clean Team households with a latrine use this latrine to defecate (p<0.001). After controlling for the age of the child and household-level clustering, we observed a risk difference in child chamber pot use of 35.0 per cent (95 per cent confidence interval: 15.6 per cent to 54.4 per cent; p<0.001) between Clean Team households and non-Clean Team households with no latrine, and a risk difference of 27.6 per cent (95 per cent confidence interval: 0.1 per cent to 55.0 per cent; p=0.049) between Clean Team households and non-Clean Team households with a latrine.
g. Disposal of faeces from chamber pots and disposal of children’s faeces
The usual place reported for disposal of adult faeces from chamber pots or the stools of young children who did not defecate in a latrine was the public garbage sites. This was the case for Clean Team (64 per cent) and non-Clean Team (74 per cent) households. Nappies or plastic bags of faeces were reportedly dumped at these sites alongside other household garbage, sometimes when visiting public toilets (which are often adjacent to solid waste sites). Some faeces were also disposed of in the gutter or drain by the house (Table 3). According to focus group discussion participants, this occurred mainly at night as it is considered a “bad, dirty practice”. The Clean Team toilet was also used to dispose of faeces from chamber pots in some Clean Team households instead of in the gutter, drain or a public toilet, as was common before having the Clean Team toilet (Table 3).
h. Safe faeces disposal
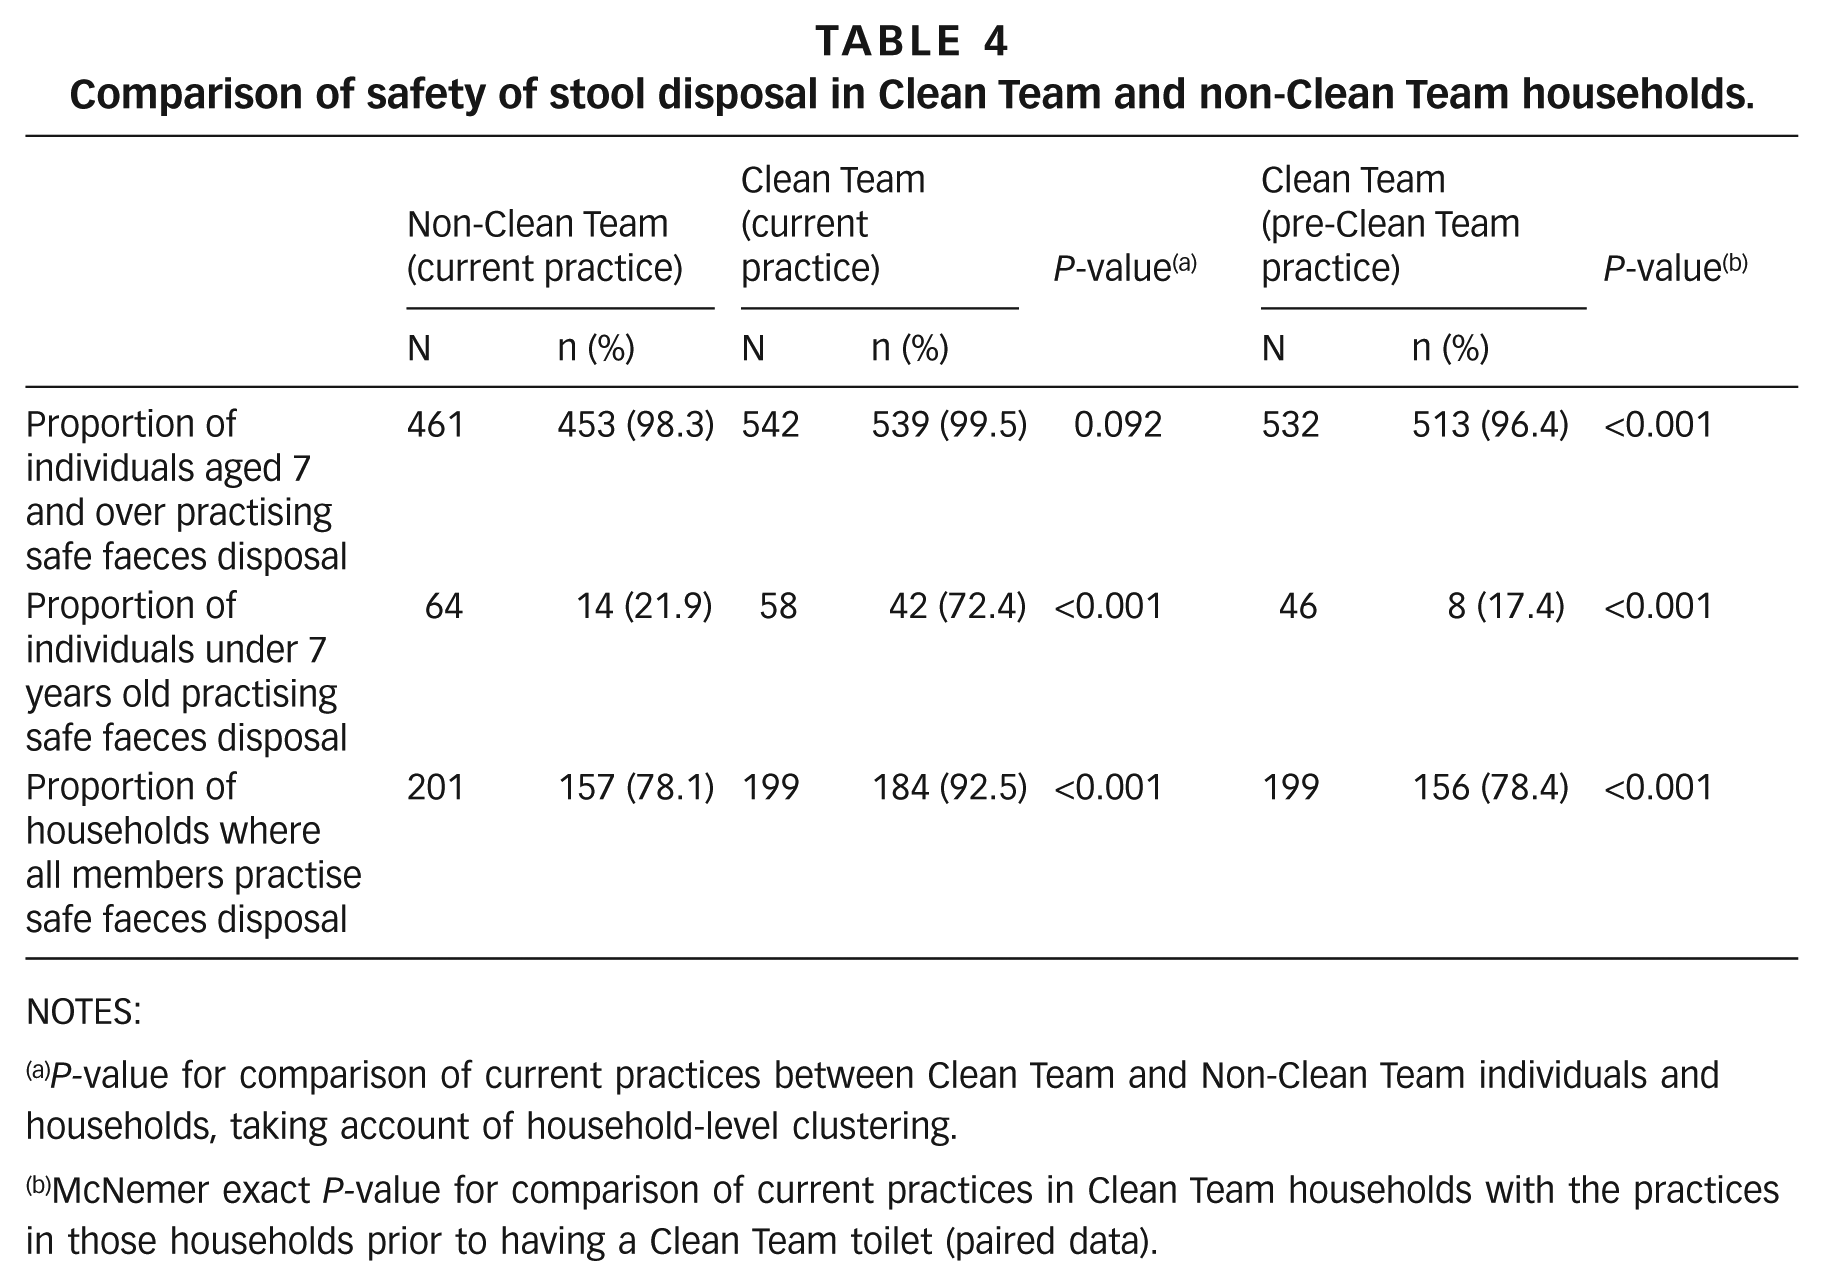
Individuals in Clean Team households were significantly more likely to defecate in or have their faeces disposed of in a toilet than were individuals in non-Clean Team households. This effect was largely due to the differences in defecation and faeces disposal practices for children under seven years of age. In 72 per cent of Clean Team households the faeces of children under seven were disposed of safely in the toilet, compared with 22 per cent of non-Clean Team households (p<0.001) (Table 4). Consequently, when looking at faeces disposal for all household members we find a greater proportion of Clean Team than non-Clean Team households in which the faeces of all household members are disposed of safely (93 per cent vs. 78 per cent, p<0.001). Comparison of current practices in Clean Team households with those prior to having a Clean Team toilet followed a similar pattern (Table 4).
Comparison of safety of stool disposal in Clean Team and non-Clean Team households.
NOTES:
P-value for comparison of current practices between Clean Team and Non-Clean Team individuals and households, taking account of household-level clustering.
McNemer exact P-value for comparison of current practices in Clean Team households with the practices in those households prior to having a Clean Team toilet (paired data).
i. Public toilets
In total, 25 public toilets were visited and caretakers interviewed. All but one had separate facilities for men and women. The quality and construction varied from simple, dry pit latrines to water closets, and consequently facilities varied in price per use (0.10 to 0.50 Ghanaian cedis, or US$ .03 to .15 as of Oct 2014 when the study was conducted) and cleanliness. Seventeen facilities (68 per cent) had water available in buckets for handwashing, but only nine (36 per cent) had soapy water in a bucket at the communal entrance and one had a small piece of bar soap that could be requested from the attendant. Eight public toilets permitted emptying of chamber pots at the same price as for latrine usage. Toilet staff at these facilities reported that they rarely observe people emptying chamber pots, but they do see people disposing of faeces in plastic bags in the solid waste collection sites next to the latrines. Several attendants in public toilets with septic tanks stated that they do not allow faeces to be disposed of at their latrine because plastic bags clog the drains.
V. Discussion
There are, as noted, two principal routes by which Clean Team toilets could benefit public health through their influence on household practices. First, they may reduce faecal contamination of the environment by increasing the number of individuals who follow safe sanitation and child stool disposal practices. Second, by bringing the place of defecation closer to home, they may increase the number of people who have access to soap and water convenient to their usual place of defecation, and consequently increase the frequency of handwashing with soap post-defecation.
Public toilets are the predominant form of sanitation for those living in high-density, low-income areas in Kumasi, as found in this study as well as others.(18) Open defecation and the use of flying toilets and chamber pots that are emptied outside occur but are not common. The majority of Clean Team households are drawn from the population of public toilet users. Clean Team toilets may therefore have done little to reduce faecal contamination of the environment resulting from routine unsafe sanitation practice by adults. However, Clean Team toilets may have served to reduce occasional unhygienic sanitation practices, for example during illness or at night, that is likely to occur in households that must rely on public toilets.
Our findings suggest that having a Clean Team toilet was associated with children ceasing use of a chamber pot or potty and starting to use a toilet at an earlier age than children in non-Clean Team households. This was the case not only for non-Clean Team households using a public toilet but also for non-Clean Team households that had their own latrine. Faeces emptied from potties or chamber pots were most commonly disposed of in garbage, gutters or drains, even in Clean Team households. Our qualitative findings suggest that this was because Clean Team toilets are urine-diverting, and emptying in the mixture of faeces and urine from a child’s potty or chamber pot is not recommended as it may increase the problem of smell. The earlier cessation of potty use associated with uptake of a Clean Team toilet has potential public health significance in decreasing the contamination of the environment with the faeces of young children.
Some Clean Team users commented that the current toilet design is not suitable for small children. Modification of the design to facilitate use by younger children and/or disposal of waste from potties or chamber pots could further increase their contribution to safer disposal of children’s faeces.
Although observation of actual handwashing practices was not within the scope of this study, the presence of conveniently placed soap and water facilitates handwashing and is consequently a useful proxy for handwashing practice.(19) A greater proportion of Clean Team households had soap and water in close proximity to the toilet than non-Clean Team households with access to a toilet at home. Possibly this reflects the higher income levels of Clean Team households, but is also likely due to the fact that Clean Team toilets were more often exclusively used by single households, thus increasing the security of soap placed there.
Among public toilet users the availability of soap for post-defecation handwashing was lower than among users of household toilets. Given that most Clean Team households previously used public toilets, it is likely that uptake of a Clean Team toilet increased the probability of having convenient soap available for handwashing after defecation. This in turn is likely to have increased handwashing rates. However, we cannot discount entirely the possibility that current Clean Team users were already more concerned with hygiene than their neighbours before they acquired a Clean Team toilet, or that they previously elected to use only public toilets where handwashing with soap was possible.(20)
This study has two main limitations. One is that the cross-sectional design does not allow us to make statements about causality with respect to the practices we report on. The other is the reliance on self-reporting of defecation and faeces disposal practices, leading to the possible underreporting of unsafe practices, which may mask some of the impact of Clean Team. Nevertheless, reporting of unsafe practices was higher than the official figures for Kumasi.(21)
It is likely that unsafe faeces disposal was most common amongst the poorest Kumasi households.(22) Such households had not been the target customers for Clean Team to date, and uptake of Clean Team was highest among relatively wealthier households within the low-income neighbourhoods where Clean Team operates. If the Clean Team service is able to penetrate lower economic strata it may have a greater impact on unhygienic defecation.(23) In the same vein, if Clean Team toilets were successfully introduced in urban areas with a bigger open defecation problem, then the potential for public health benefits would also be greater. Nevertheless, our findings suggest that Clean Team toilets can contribute to safer sanitation practices in Kumasi by reducing the age at which children start to use a latrine and thus improving the safety of household sanitation practices.
Footnotes
Acknowledgements
The study team are grateful to Clean Team Ghana, particularly Valerie Labi and Naomi Kokuro, for granting us access to their customer database and for the assistance of their staff in identifying randomly selected households. Our thanks also go to Wolf-Peter Schmidt at LSHTM for his input into the study design and methods and comments on the manuscript; and to Fiona Majorin (LSHTM) and Carolyn Jones (Unilever) for their feedback on the manuscript. Last but not least, we thank all our participants for volunteering for this study.
Funding
The study was co-funded by Water & Sanitation for the Urban Poor and Unilever PLC.
1.
Ghana Statistical Service (2013), 2010 Population and Housing Census, National Analytical Report, accessed October 2015 at http://www.statsghana.gov.gh/docfiles/publications/2010_PHC_National_Analytical_Report.pdf; also Kumasi Metropolitan Assembly (2006), Kumasi Metropolitan Assembly, About this Metropolis, accessed October 2015 at http://www.kma.ghanadistricts.gov.gh/?arrow=atd&_=6&sa=5490.
2.
Salifu, L (2013), A Rapid Field Evaluation of the Pilot Asafo Simplified Sewerage Scheme in Kumasi, Ghana, accessed October 2015 at ![]() .
.
3.
Ghana Statistical Service (2014), 2010 Population & Housing Census, District Analytical Report, Kumasi Metropolitan, accessed October 2015 at ![]() .
.
4.
See reference 3.
5.
See reference 2.
6.
IWA Water Wiki (2015), Kumasi: Sanitation Status, accessed October 2015 at ![]() .
.
7.
Tilmans, S, K Russel, R Sklar, L Page, S Kramer and J Davis (2015), “Container-based sanitation: assessing costs and effectiveness of excreta management in Cap Haitien, Haiti”, Environment and Urbanization Vol 27, No 1, pages 89–104.
8.
Biran, A, T Rabie, W Schmidt, S Juvekar, S Hirve and V Curtis (2008), “Comparing the performance of indicators of hand-washing practices in rural Indian households”, Tropical Medicine and International Health Vol 13, No 2, pages 278–285; also Biran, A, A Tabyshalieva and Z Salmorbekova (2005), “Formative research for hygiene promotion in Kyrgyzstan”, Health Policy Plan Vol 20, No 4, pages 213–221; and Hernandez, O, J Devine, J Karver, C Chase and Y Coombes (2012), Measuring the Behavioral Determinants of Handwashing with Soap, Water and Sanitation Program technical paper, accessed December 2014 at ![]() .
.
9.
Curtis, V, S Cairncross and R Yonli (2000), “Domestic hygiene and diarrhoea - pinpointing the problem”, Tropical Medicine and International Health Vol 5, No 1, pages 22–32.
10.
Cairncross, S, U Blumenthal, P Kolsky, L Moraes and A Tayeh (1996), “The public and domestic domains in the transmission of disease”, Tropical Medicine and International Health Vol 1, No 1, pages 27–34.
11.
Schmidt, W P (2015), “Seven trials, seven question marks”, Lancet Global Health Vol 3, No 11, pages 659–660.
12.
See reference 2.
14.
WHO/UNICEF Joint Monitoring Programme for Water Supply and Sanitation (n.d.), Improved and unimproved water and sanitation facilities, accessed June 2014 at ![]() .
.
15.
WHO/UNICEF Joint Monitoring Programme for Water Supply and Sanitation (2014), Progress on Sanitation and Drinking Water - 2014 Update, Geneva and New York, accessed December 2014 at ![]() .
.
16.
Jenkins, M W, O Cumming, B Scott and S Cairncross (2014), “Beyond ‘improved’ towards ‘safe and sustainable’ urban sanitation: assessing the design, management and functionality of sanitation in poor communities of Dar es Salaam, Tanzania”, Journal of Water, Sanitation and Hygiene for Development Vol 4, No 1, pages 131–141.
17.
Vyas, S and L Kumaranayake (2006), “Constructing socio-economic status indices: how to use principal components analysis”, Health Policy Plan Vol 21, No 6, pages 459–468.
19.
See reference 8, Biran et al. (2008); also see reference 8, ![]() .
.
20.
Luby, S P and A K Halder (2008), “Associations among handwashing indicators, wealth, and symptoms of childhood respiratory illness in urban Bangladesh”, Tropical Medicine and International Health Vol 13, No 6, pages 835–844.
22.
See reference 15.
23.
Rheingans, R, O Cumming, J Anderson and J Showalter (2012), Estimating inequities in sanitation-related disease burden and estimating the potential impacts of pro-poor targeting, Sanitation and Hygiene Applied Research for Equity (SHARE) research report, accessed December 2014 at ![]() .
.