
Abstract
In order to develop a constructive new urban agenda (NUA), the United Nations Conference on Housing and Sustainable Urban Development (Habitat III) must move beyond sterile proclamations, and acknowledge what we have learned since previous Habitat meetings – that urban policy significantly influences inclusive economic growth. A new urban agenda that takes new research and understandings into account could be like investments in health in terms of the high rate of return. More than that, changes in urban regulations and in the way subsidies are targeted could allow most of the desired gains to be realized without additional resources. An NUA, in other words, could be like perestroika for cities. Indeed, it could support a “restructuring” that is both more manageable and more fundamental than other, more popular, growth strategies. By examining a number of case studies, the paper demonstrates that a central message of Habitat III should be that better urban policy is much more than just a claim on public resources, it can be an important way to achieve inclusive growth.
Keywords
I. Introduction
In a recent meeting to discuss the agenda of the United Nations Conference on Housing and Sustainable Urban Development (Habitat III), to be held in Quito, Ecuador in October 2016, Joan Clos, the executive director of UN-Habitat, said that the programme developed in Habitat II was not transformative, largely because it was never applied. He went on to say that United Nations Development Programme analysts give no attention to urbanization issues and are unaware of the benefits of urbanization in development. In his view, it is essential to improve the argument discussed in Habitat III so that a constructive urban agenda can be developed.(1)
Dr Clos is of course correct in his judgement about the importance of Habitat III in setting an effective development agenda. It will be the first UN convening to follow the ending of the Millennium Development Goals (MDGs). As such, this conference has the potential to provide considerable momentum in the creation of a new development perspective, and, in UN-Habitat’s words, to establish the new urban agenda (NUA) for the 21st century.(2) But, in order to be able to achieve these ambitious goals, the conference must move beyond the bland, anodyne recommendations that typically flow from a convening of the almost 200 recognized UN members.(3) It must surpass sterile proclamations that cities are important, poverty is terrible, and policymakers need to do better.
Fortunately, for the first time in the 40 years since the UN began convening vicennial conferences on cities, it can be argued that an effective urban agenda is not only desirable for its own ends, but is essential for development of a sustainable, inclusive economic growth. In the two previous Habitat meetings, such an argument could not credibly be made. It can now be said with confidence that:
Effective urban policy underpins growth.(4) This view is far different from a suggestion that urbanization and economic growth have some mysterious non-causal, chicken-or-egg-like linkage, as was the consensus view at Habitat II.(5)
Urban externalities include phenomena that go well beyond just urban pollution.(6) Cities are the fulcrum upon which climate change must be addressed. Cities, particularly wealthy cities, are the chief producers of greenhouse gases; at the same time cities are the places where the most people are at risk, often with low-income neighbourhoods disproportionately affected.
Inequality has significant adverse effects on economic growth.(7) Moreover, thanks to the work of Piketty and his critics,(8) we now know that the almost universal increase in income inequality witnessed since the last Habitat meeting stems largely from urban housing markets.(9)
In short, 2016 is unlike the halcyon days of 1996, when the more pessimistic prospects of the lowest-income countries were yet to be widely recognized, the increase in income inequality was not nearly as pronounced, and the establishment of democratic, market-oriented political systems around the world seemed to be at hand.(10)
Moreover, the context for this meeting is unlike that of the first meeting in 1976, when that predominantly rural world had not yet begun to witness the beginnings of both China’s and India’s remarkable growth. Even though the average Chinese per-capita income is now 15 times higher than it was at the time of Habitat I, the historical context for this meeting is considerably less optimistic than it was at the previous meetings. Habitat I took place at the end of Les Trente Glorieuses, the 30 post-war years of sustained economic growth in Organisation for Economic Co-operation and Development (OECD) countries; Habitat II took place at the so-called “End of History” and the short-lived market triumphalism following the collapse of the Soviet Union.(11)
Habitat III will meet at a less confident time. The idea that government can solve problems or effectively regulate financial transactions is no longer broadly held.(12) Indeed, in the US, trust in government is at less than one-third the level it was at the turn of the millennium.(13) Habitat III follows in the wake of war, displacement of the most refugees since World War II, the worst financial crisis since the Great Depression, the international spread of infectious disease, and extraordinary levels of un- and underemployment that affect so much of the urban youth in Africa and Southern Europe, and black youth in American cities.(14)
While the historical context for the Habitat III conference is in many ways bleaker than was the case with the previous conferences, it is analytically more supportive of the importance of the new urban agenda. But for this stronger conceptual basis to be effective, UN-Habitat must change its approach. Rather than simply calling for better urban planning and more resources for the urban poor, as was the case in the “old urban agenda” (the Istanbul Declaration on Human Settlements, which was the outcome document agreed upon in 1996 at the Habitat II conference), the NUA must articulate, in line with these new analytical underpinnings, how much more is at stake.
The new urban agenda is potentially like an investment with a high rate of return rather than yet another claimant on public expenditures. Not only could it pay for itself in the long run, it would not require additional resources in the short run. In other words, the NUA is like perestroika for cities. Like those “restructuring” reforms in the former Soviet Union, an NUA would recognize that a new way of managing cities is needed, and that this new approach has the potential to be both extraordinarily productive and more inclusive. To see this urban agenda as self-financing does not imply that there is not a shortage of urban infrastructure investments. Rather, it is to say that when most of the gains can be achieved simply by changing the way things are done, rather than by providing more resources, the social return must be extraordinary. Recognizing the potential for these gains could also increase the commitment by member states to implement the NUA after Habitat III. The limitations in the implementation of the old urban agenda become clear when one considers the rather unsatisfying outcomes in terms of access to adequate housing and urban development since 1996.
In order to articulate the rationale for an NUA, UN-Habitat must recognize first that these new findings actually exist. More importantly, Habitat III should argue for an effective urban agenda to be considered in the same vein as the industrialization policies that have become central to discussions of macroeconomic development policy,(15) or the calls to address increasing income inequality by an international wealth tax, as suggested by Piketty.(16)
Another difference between this conference and Habitat II is the relationship with local governments, which in 1996 were able to actively participate and engage in the decision-making process. It seems counterintuitive that there is currently no direct mechanism for local and city governments to contribute to the new urban agenda, an agenda that has to make sense at the local and city level in order to facilitate successful implementation. Instead, it is up to the representatives from national governments to decide what the urban agenda for the next 20 years should look like. This is a step backwards.
The rest of this paper attempts to demonstrate why the Habitat III preparations should focus on establishing this broader rationale for an NUA. The next section summarizes why an NUA could have a strong, positive effect on inclusive economic growth, considering the relationship among urban policy, income inequality and economic growth. Section III presents case studies exemplifying the conceptual arguments. It first discusses urban policy in Accra, Ghana, and then broadens the perspective to consider countrywide urban policies in Uganda. A third case considers New York City, where urban policy has had particularly pathological effects, adversely affecting growth and significantly increasing inequality.
The last section summarizes the paper’s arguments. Its key message is that, while it is by no means easy to implement an effective national urban agenda, it is even more difficult to craft an international one. These difficulties are even more complicated because the individual countries are at different points in their urbanization trajectory. Nevertheless, an NUA is not only needed, it also has the potential to offer a much more manageable way to achieve inclusive growth than the alternative policies that have received prominence thus far. Habitat III offers the opportunity to redirect this discourse from discussions of industrial policy and the need for an international tax on capital.
II. Urbanization And Economic Growth
Two channels have the most direct effect on how urban policy affects economic growth: the restrictions placed on resources being able to move to higher-productivity locations and the effects on the distribution of wealth.(17) Before reviewing these channels, we first consider the question of why the new urban agenda should focus on inclusive economic growth rather than the social issues that have traditionally characterized UN-Habitat’s agendas. An NUA would be strategic in increasing the impact of available resources, because cities are the places where most of the underused domestic resources reside and where the least effective expenditures of current resources are largely made.(18) At a time when official development assistance (ODA) appears to have plateaued at about half the level long agreed to by donors, it is clear that domestic resource mobilization will be increasingly important.(19) It is cities that have the greatest promise for both better tax administration and improved efficacy of public expenditures.
Moreover, informal employment is increasingly the default in developing countries, and has perhaps doubled in many places, such as cities in sub-Saharan Africa.(20) It is very difficult to do a great deal about UN-Habitat’s social aspirations if joblessness and vulnerability characterize the urbanization process in much of the world.
a. Urban policy and inclusive growth in rapidly urbanizing economies
The canonical representation of the relationship between urbanization and economic growth is shown in Figure 1. It depicts a positive and strong relationship between the share of the population living in cities and per-capita income. No country has achieved middle-income status without high levels of urbanization. In 1961, Jane Jacobs argued that cities were in fact the font of wealth creation through a series of agglomeration economies produced by “the ballet of the streets”, or more prosaically the interaction brought about by proximity.(21) In the 1980s, Nobel Laureate Robert Lucas and fellow economist Paul Romer turned this idea into the endogenous growth theory, which described technological change and innovation not as something that occurs in an unexplainable way, but through the sorts of interactions described by Jacobs.(22)
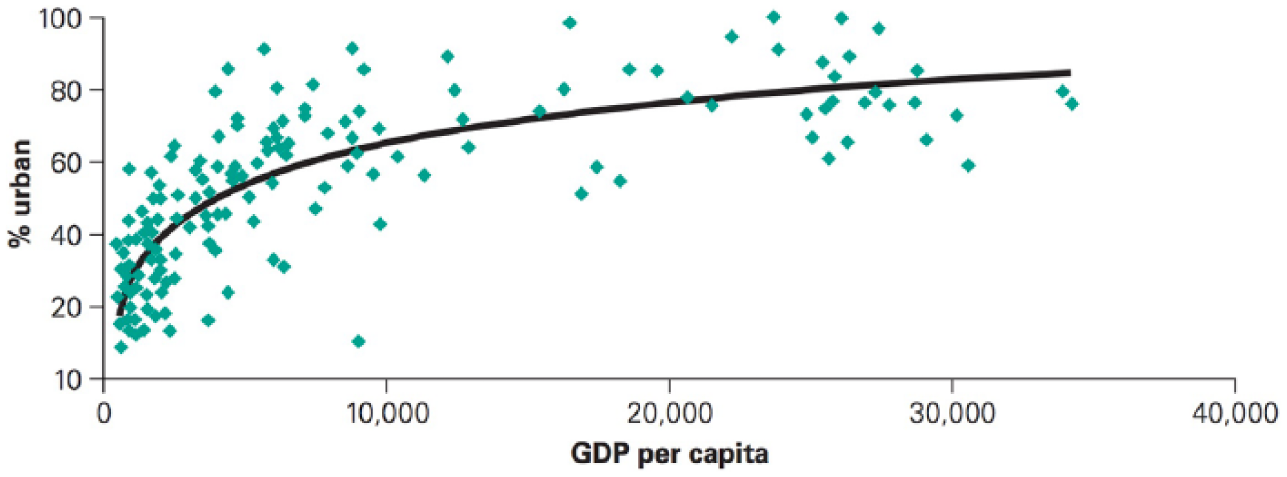
Urbanization and per-capita GDP (US$) across countries, 2000
Empirical work examining the effects of urbanization on growth is not as sanguine. Henderson(23) and Polenske(24) both argued that there was no clear evidence that more people living in cities led to higher levels of economic growth. Indeed, Ades and Glaeser(25) argued that large primate cities reduced growth, as their existence and size reflected politically motivated behaviour destructive of inclusive growth.
More recently, Jedwab and Vollrath(26) have undertaken an historical analysis of urbanization over the last 500 years, showing that the share of the population living in cities has increased by 25 to 30 percentage points over that period regardless of income growth. They suggest that the urbanization–growth linkage is affected by a variety of factors. Interestingly, around 1960 urbanization patterns changed; urbanization without growth occurred in the poorest countries, and city size was no longer indicative of rising living standards, as it had been over the previous 450 years. According to the study, whether or not urbanization is an innovation for good or ill depends very much on local circumstances. However, Jedwab and Vollrath indirectly show the importance of urban policy. In places where the urban agenda is distortive – due to extreme centralization, conflict or corruption – the urbanization process can result in mega-cities, such as Kinshasa, which despite offering insalubrious living conditions is nevertheless still more livable than the countryside.
As shown by Duranton, one of the keys is whether a country’s governance structure enables labour and innovations to flow to areas with higher returns.(27) If such a system is in place, then significant increases in growth can occur by shifting resources, such as infrastructure but also human capital, to more productive locations. To be able to use resources to exploit better opportunities, the government must help signal which locations permit productive investments. For this to be fruitful, there have to be the accompanying infrastructure investments, which allow resources to move to such locations. But, besides obtaining higher wages and infrastructure services there, prospective migrants must be able to afford to live in the more productive locations.
The issue of the affordability versus the productivity of a location is the topic explored by Hsieh and Moretti, who attempt to answer the question: why cities?(28) Their answer is that the growth of cities determines the growth of nations; however, a city’s contribution to aggregate growth can differ significantly from what one might infer from the growth of the city’s GDP. Some of the cities with the strongest rates of local growth – New York, San Francisco and San Jose – contributed only a small fraction of US growth over the 1964 to 2009 period. By contrast, almost half of aggregate US growth was driven by cities in the South.
Hsieh and Moretti further demonstrated that the increasing dispersion of average wages across cities lowered aggregate US GDP by more than 13 per cent. As a final step they showed that lowering regulatory constraints in the three aforementioned cities to the level of the median city would expand their labour force and increase US GDP by almost 10 per cent. In short, the aggregate gains in output and welfare from spatial reallocation of labour are substantial. Of particular concern are housing supply constraints in high-productivity cities, which increase housing costs. This prevents migrants from moving into these cities, and represents a major impediment to an efficient spatial allocation of labour. High housing prices also underpin the growth of informal housing that is cheaper because quality is poor and overcrowding high. In turn, forced evictions of informal settlements, which unfortunately continue to be common practice, drive up housing prices.
The case studies of Accra and Uganda sketch these sorts of effects, demonstrating that when urban policies are distorted, many of the prerequisites for the industrial policies that many have called for(29) are not in place.
b. Housing policy, income distribution and economic growth
Urban policy obviously has implications for economic growth in rapidly urbanizing countries. But it also matters in cities where urban growth is not the economy’s basic characteristic, mainly through its effects on income distribution and housing affordability. To highlight these effects requires reviewing recent work both on the causes of increasing income inequality and on its effects on economic growth.
Piketty’s analysis of income inequality and the role of housing prices
Thomas Piketty’s study on the behaviour of the top 1 per cent of the income distribution has been called a “watershed of economic thinking” and a book that will “change the way we think about society and do economics” .(30) In Capital in the Twenty First-Century, he analyses 200 years of data on capital accumulation and income distribution in the most extensive evidence ever collected. He argues that when taxes and wars have not diminished the return to capital, wealth essentially creates more wealth, and inequality increases. While a number of problems with his proposed process have been raised, the basic idea makes intuitive sense: if the income of the owners of capital increases at a faster rate than the income of workers, income distribution becomes less egalitarian.
Since 1980, following the Reagan and Thatcher era, increases in inequality have been the norm throughout the world, and these increases have been experienced most intensely in the places that hold most of the existing wealth. Not surprisingly, New York City, home to more than 650,000 millionaires, is among these places.(31) And it is in its housing market that these trends have been most obvious. House prices have risen much faster than income in many countries, while the value of other capital has only risen weakly, if at all, relative to income. Even in cities in Norway, Sweden or Finland, which have among the most egalitarian income distributions in the world, house prices are rising rapidly.(32) Piketty’s perspective suggests why this trend might occur: as the rich get richer they compete with each other in so-called “superstar” cities, bidding up real estate prices.(33)
Homeowners have enjoyed almost all of the increase in capital value relative to income levels. How does this affect inclusive economic growth?
The links between inequality and economic growth
According to studies from the OECD and IMF,(34) economic growth is slowed by income inequality. According to the OECD report, the concentration of income between the richest and poorest in most member countries is the highest it has been since 1985. The study found that the 3 Gini point rise in inequality, the average increase for OECD states over the last 20 years, translates into 0.35 per cent less economic growth per year for a total 8.5 per cent GDP loss over that time period. In contrast, a similar increase in the income share of the bottom 20 per cent would imply a 0.38 percentage point increase in growth.
Piketty’s findings of increased inequality in the distribution of wealth, inclusive of housing, does not translate directly into increased inequality of income. However, because the two forms of inequality are highly correlated, no attempt is made here to suggest how much difference there is between wealth and income inequality in terms of their effect on inclusive growth. With the assumption that wealth and income have similar effects in this regard, the question is what kinds of urban policies led to the rise in inequality and housing unaffordability.
To answer this question, the next section presents the case study of New York City. Prior to considering this case, we focus on Accra and Uganda, two examples of how urban policy affects inclusive economic growth.
III. Case Studies Of The Linkages Between Urban Policy And Growth
a. Accra, Ghana
In a recent study of the behaviour of Accra’s housing market, Buckley and Mathema(35) raise the question of whether housing has become so unaffordable that lower-income families are unable to move to the city. Estimating the elasticity of housing supply, they found that Accra has significantly lower housing supply responsiveness than other African cities. This result is consistent with both the observed higher housing prices and UN-Habitat’s traditional argument that ill-designed urban policies have adverse effects on lower-income families.(36) Before focusing on the broader-scale problem, the obvious question is: How does policy create such an inelastic housing supply?
First, problems with land administration in Ghana have long been noted.(37) Large holdings of public lands characterize much of Accra, reducing the supply responsiveness. Further, by creating minimum standards—i.e. of plot sizes for new housing—that exceed what most people can afford, the regulations have created a very high floor price on new housing, as well as much less dense development at the periphery.
Second, the inflexibility in redeveloping the city’s existing housing stock corresponds to the increased value of the land and expanding city boundaries. Considering property title ambiguities in the central city, Accra has one of the characteristics of Gyourko et al.’s superstar cities – “these markets do not allow for increasing density through construction”.(38) As a result, the existing housing stock is considerably less responsive to demand. A significant result of the observed increase in Accra’s house prices is, in effect, a regulatory tax on housing supply. This tax redistributes wealth from poorer renters to the owners of real estate. It also taxes the income of those who are unable to move to the higher-paying jobs in the city, as Hsieh and Moretti argue is the case in the US.(39)
In sum, Accra’s urban policy distortions arise because of ambiguous title rights in the city’s land market and excessive land use regulations, resulting in significant reductions in productivity and in costly misallocation of resources. As the Ugandan case will show, countrywide policies can be equally problematic.
b. Uganda
The simplest traditional way to consider spatial reallocation of resources is by examining the urban–rural income differential. The 2010 Uganda Household Survey reveals that income levels in Uganda’s urban areas are almost three times higher than rural wages; in 2005 they were slightly more than half that level. The 2010 difference between urban and rural is more than double the difference that is typical of developing countries.(40) In addition, the fact that the difference is increasing rather than converging suggests that resources have not moved at a sufficient rate to lower the gap in relative wages. Similarly, the ratio of income in Kampala to income in other urban areas increased by almost 30 per cent over this period. The scale of the difference suggests that more productivity-enhancing infrastructure investment opportunities are not being realized. The obvious question is: What causes the country’s highly distorted spatial investments?
The answer is that the urban policy now in place does not provide a basis for spatial allocation of infrastructure investments to the areas with the greatest returns. And local governments are unresponsive because the central government pursued a number of policies that effectively eliminated local government autonomy. For instance, it abolished the main local tax instrument and prohibited the application of property tax to residential properties. The loss of these revenue sources resulted in a decline over 10 years in local governments’ own-source revenues from 22 per cent of local government expenditures in 2000 to 5 per cent in 2010.(41) In addition, unconditional grants to local governments declined by so much that by 2011 local governments had discretion over only about 15 per cent of their expenditures. In 2000 this figure had been over 50 per cent.(42) Finally, the central government took over management of the country’s largest city, Kampala, while simultaneously increasing the number of regional governments to 112.(43) It is only a slight exaggeration to say that urban policy in Uganda is now implemented almost completely by the central government. If an urban policy exists, it has very little in the way of resources.
In sum, the real costs of both Uganda’s and Ghana’s urban policies – both static and dynamic – are very high, and it is important to focus on the barriers that prevent a more optimal spatial resource allocation. When urban–rural differences are so large and increasing, it should not be surprising that efforts to establish an industrial cluster fail, as was recently the case in Uganda under a World Bank credit. Moreover, if the weaknesses in developing urban policy in two of the continent’s best-performing economies are symptomatic of processes elsewhere in Africa, then the aspirations for industrial policy may be more than too optimistic; they may result in misdirected resources.(44)
c. New York City
New York City stands as a model of what can happen in the increasingly wealthy global cities, if they are well managed. But when one follows Piketty’s analysis, it becomes clear that New York’s renaissance has not been following an entirely benevolent general trend. In fact, its renaissance reflects a process that has almost exclusively benefitted the very top of the income distribution, and is very much like the general trend in housing value relative to the value of other capital. According to a recent study of the Federal Reserve Bank of New York,(45) the price of housing reflects the city’s attractiveness as a global investment in a volatile world economic environment rather than the value of housing services.
The point is not to argue that housing costs can easily be reduced, but rather that trends have been intensified rather than cushioned by current policies. The problems with New York’s housing policies go well beyond the regulatory constraints. As Figure 2 indicates, the increase in inequality in the city has significantly surpassed the increase in New York State and across the US. Once again, the obvious question is: What has caused this trend? And the answer, once again, is urban and, particularly, housing policy.
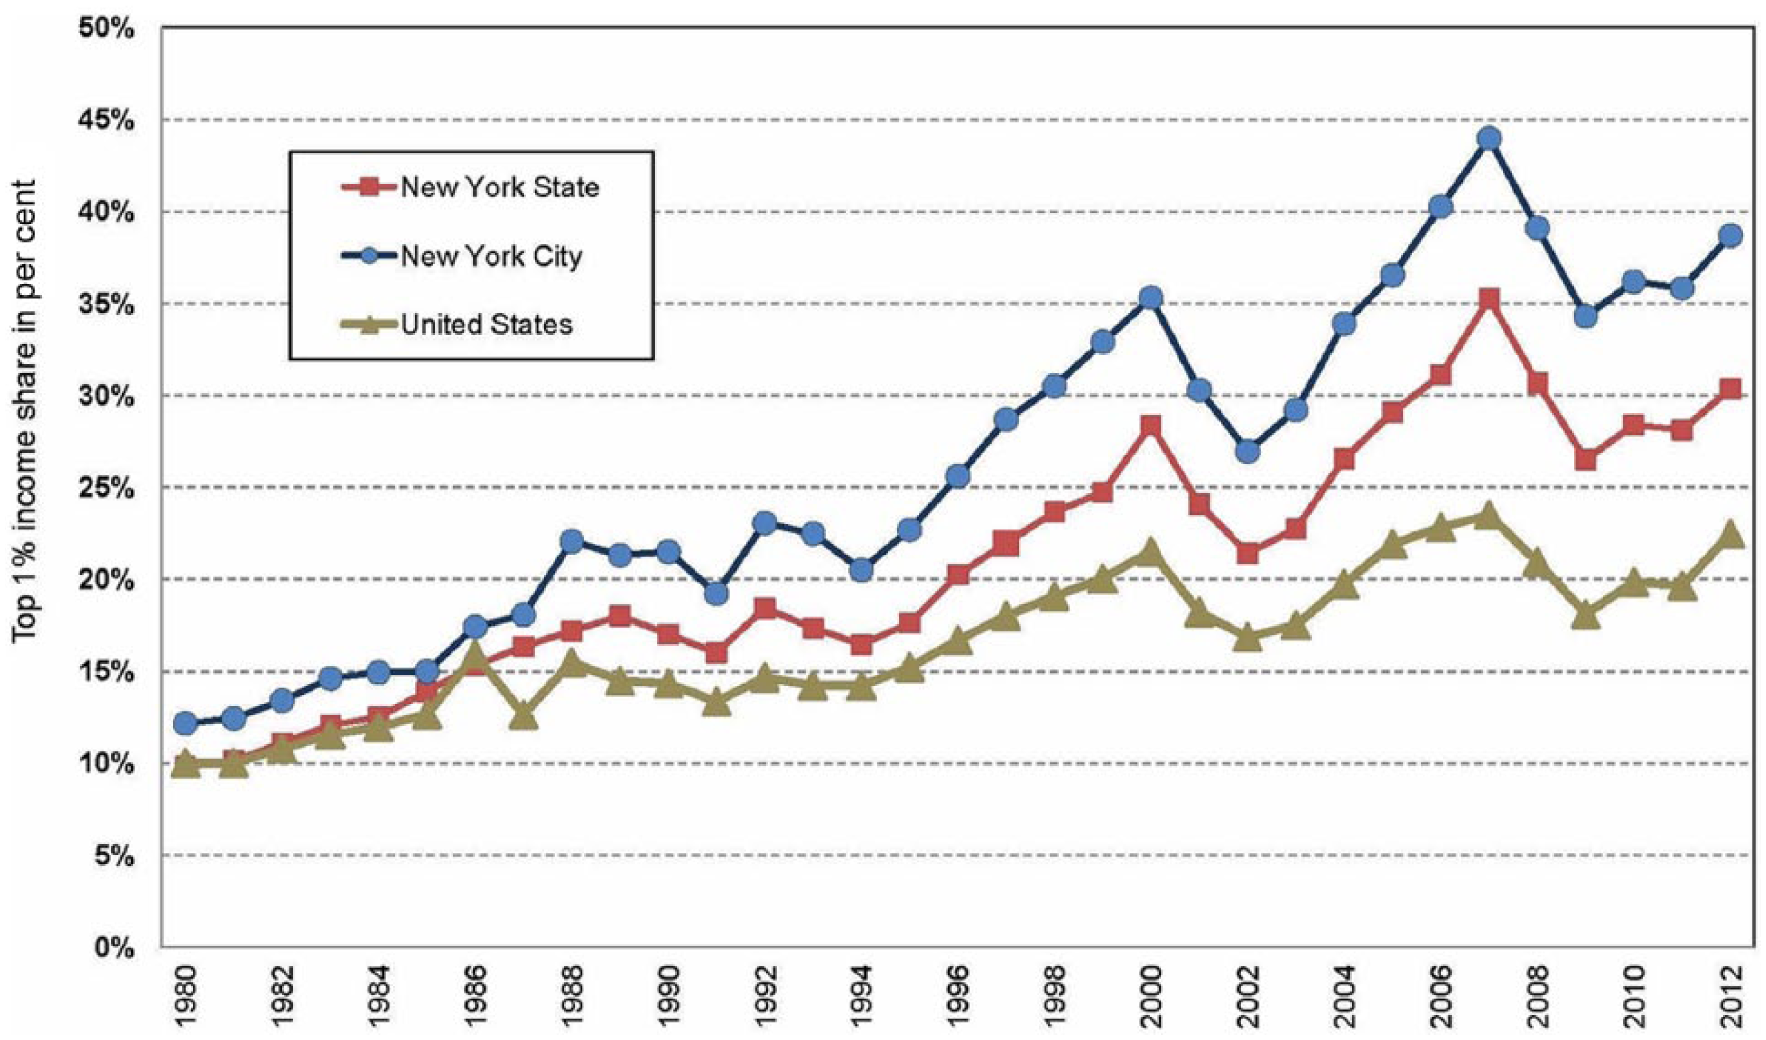
Income distribution trends: changing income shares of the top 1 per cent in New York City, New York State and the United States, 1990–2012
New York City’s housing policy
Despite having the nation’s largest, most extensive housing programmes, the city has failed to improve access to housing for the average New Yorker. In 2012, more than 30 per cent of families paid more than 50 per cent of their income for rent. Fifteen years ago only 20 per cent faced such a burden.(46) It is perhaps surprising that the city has not only some of the nation’s most expensive housing stock, but also the most dilapidated and inaccessible housing stock of any large city in the country, with a deteriorating trend.(47)
As incomes fall below the levels needed to rent the lowest-cost housing, the inevitable result is either homelessness – the city had more than 116,000 homeless in 2014, including more than 42,000 children – or doubling up (sharing housing).(48) At the same time, in 2013 the city provided tax breaks of over a billion dollars to develop some of the most expensive apartments in the world.(49) But misdirected subsidies are not the only problem. Over the past 15 years the city was able to bring more than 150,000 mostly tax-delinquent units back into service. Today, there are no more such units to bring inexpensively to market. In addition, the annual loss of units from the 60 per cent of the housing stock that is publicly controlled – through rent control, rent stabilization, and the nation’s largest public housing stock – continues. These units migrate to the much more expensive private supply, often after having been consolidated into larger units, thereby lowering the overall supply of units.(50)
In short, when one looks at affordability trends through the prism of a disaggregated analysis of Piketty’s long-term results on inequality, a different perspective emerges. This disaggregated view, which places much more emphasis on housing, suggests that for cities to remain dynamic, inclusive places, there is a need to recognize that housing prices have a great deal to do with wealth and income inequality. Moreover, if the analyses of these effects on economic growth are taken into consideration, it is clear that these policies are affecting cities’ basic economic health. Richard Florida found that New York City’s population continues to grow only because the increase in immigration to the city from abroad exceeds the outflow of residents to other parts of the country.(51) Certainly, a large number of these international migrants are either at the very top or very bottom of the income distribution, making for an increasingly polarized city.
IV. Conclusions
The central conclusion is that UN-Habitat must realize its opportunity to change the direction of discussion of the need for a new urban policy agenda. However, to do so requires a more compelling framing of the issue, building upon the rich set of analyses and evidence on the importance of urban policy. Besides this main conclusion are three other findings: first, while there are no simple decision-making rules to guide urban policy, many of the current policies violate basic notions of how to manage cities. As the case studies emphasize, there is a strong need for an urban agenda that gives priority to carefully weighing the costs that planning regulations can pose. Second, the beneficial potential of the NUA is often not recognized sufficiently. Our faith in the value of an NUA has been undermined by the poor legacy of the Habitat II Agenda and its limited implementation. Finally, and most practically, urban policy has far more direct linkages to the causes of inclusive growth than either Piketty’s calls for a new system of international capital taxation or the emphasis on industrial policy.
Cumulatively, these conclusions lead to the argument that the Habitat III process should call for a new urban agenda as a basic reform issue, a reform of the way cities are managed, much like the basic reforms of the economy of the former Soviet Union. This new agenda should call for much more local autonomy, but also ensure that considerable attention is given to the broader effects that local decisions can have. But, once again, the rationale for this approach is much stronger than has been articulated in either the earlier Habitat meetings or in the Preparatory Committee discussions thus far.
At this stage in the preparations, it is important that more attention be given to the way the issue is framed. Otherwise, the likely outcome of Habitat III will be very much like that of Habitat II. That is, there will be a brief increase in the attention given to urban issues before this not very significant interest declines again to levels that are a fraction of the attention given to other policy agendas.(52)
Footnotes
Acknowledgements
Mike Cohen, David Satterthwaite and Ivan Turok made some helpful comments, as did participants in a Joint Work Programme for Habitat III, held in New York at the September 2015 UN meetings. Ford Foundation funding is gratefully appreciated.
1.
Joan Clos in remarks made at the Joint Working Group meeting on Habitat III at UN meetings, New York, September 2015.
2.
UN-Habitat (2015), “The New Urban Agenda Will Be Decided in Quito”, 19 December, available at ![]() . The New Urban Agenda is the outcome document agreed upon at Habitat III. This agenda is meant to guide the efforts on cities of a wide range of actors for the next 20 years. Therefore, this agenda is supposed to lay the groundwork for policies and approaches that will extend far into the future. The Habitat III preparatory process will influence the formulation of the New Urban Agenda, which will first be unveiled as a “zero draft” by April 2016. The Habitat III Bureau and Secretariat will be the ones to write the zero draft. Its terms will then be negotiated by member states at Habitat III before an agreement is reached in Quito.
. The New Urban Agenda is the outcome document agreed upon at Habitat III. This agenda is meant to guide the efforts on cities of a wide range of actors for the next 20 years. Therefore, this agenda is supposed to lay the groundwork for policies and approaches that will extend far into the future. The Habitat III preparatory process will influence the formulation of the New Urban Agenda, which will first be unveiled as a “zero draft” by April 2016. The Habitat III Bureau and Secretariat will be the ones to write the zero draft. Its terms will then be negotiated by member states at Habitat III before an agreement is reached in Quito.
3.
See Satterthwaite (1998) for a discussion of the sorts of compromises involved in such large meetings. It is, admittedly, not an easy task. Like Clos, he suggests that there is little evidence that either of the Habitat conferences had a significant effect on urban or housing policy. Habitat I essentially established the UN habitat agency, and Habitat II defined a Habitat Agenda. Further, Badiane argued, at a conference organized by Cities Alliance in October 2015, that Habitat II was a housing rather than urban agenda. Satterthwaite, D (1998), Can U.N. Conferences Promote Poverty Reduction? A Review of the Istanbul Declaration and the Habitat Agenda, Woodrow Wilson International Center for Scholars, Washington, DC.
4.
Hsieh, C and E Moretti (2015), “Why do Cities Matter? Local Growth and Aggregate Growth”, National Bureau for Economic Research Working Paper 21154; also Duranton, G (2009), “Are Cities Engines of Growth and Prosperity for Developing Countries?”, in M Spence, P Annez and R M Buckley (editors), Urbanization and Growth, World Bank on behalf of Commission on Growth and Development, Washington, DC, available at available at ![]() .
.
5.
See among others Henderson, J V (2003), “Urbanization and Economic Development”, Annals of Economics and Finance Vol 4, pages 275–341.
6.
World Bank (1991), Urban policy and economic development: An agenda for the 1990s, Washington, DC, available at ![]() .
.
7.
IMF (2014), World Economic Outlook: Uneven Growth. Short- and Long-Term Factors, International Monetary Fund, Washington, DC; also Cingano, F (2014), “Trends in Income Inequality and its Impact on Economic Growth,” OECD Social, Employment and Migration Working Paper No 163, OECD Publishing.
8.
Piketty, T (2013), Capital in the Twenty-First Century, Belknap Press of Harvard University Press.
9.
Bonnet, O, P H Bono, G C Chapelle and E Wasmer (2014), “Capital is not back: A comment on Thomas Piketty’s ‘Capital in the 21st Century’ “, VOX CEPR’s Policy Portal.
10.
Income inequality has increased over this time period in 17 of 22 OECD countries. The growth in the number of democracies in the early 1990s was at the fastest ever recorded rate by in the almost 200 years of Polity IV’s observations. ![]() , The Integrated Network for Societal Conflict Research, Regime Authority Characteristics and Transitions Datasets, University of Missouri.
, The Integrated Network for Societal Conflict Research, Regime Authority Characteristics and Transitions Datasets, University of Missouri.
11.
The idea of the end of history was that democratic, market-based economies would be the general type of system to which all countries would evolve. See Fukuyama, F (1989), The End of History and the Last Man, Free Press, New York.
12.
Warwick, K (2013), “Beyond Industrial Policy: Emerging Issues and New Trends,” OECD Science, Technology and Industry Policy Papers No 2, OECD Publishing.
13.
Gallup (2014), Trust in Government, available at ![]() .
.
14.
Over 60 million people are refugees or internally displaced, the highest figure since World War II. The Ebola virus has led to death and quarantines – particularly of the urban poor – on a level that has not been observed since cholera closed European ports a hundred years ago. Black youth unemployment in the US, at over 20 per cent, was more than double white youth unemployment for the 2012–2015 period; see Bureau of Labor Statistics (2015), “Employment and Unemployment Among Youth Summary - Summer 2015”, US Department of Labor press release, 18 August, available at http://www.bls.gov/news.release/youth.nr0.htm. Southern European rates of youth unemployment approach 50 per cent in Spain and Greece and are over 30 per cent in Portugal. Unlike in South Africa, where, according to Oosthuizen and Cassim (2014), youth unemployment exceeds 60 per cent, overall youth world unemployment is lower than the US rate at 13 per cent; see ILO (2014), Global Employment Trends for Youth 2015: Scaling up investments in decent jobs for youth, International Labour Organization, Geneva; and Oosthuizen, M and A Cassim (2014), “The State of Youth Unemployment in South Africa”, Blog post, 15 August, Brookings, available at http://www.brookings.edu/blogs/africa-in-focus/posts/2014/08/15-youth-unemployment-south-africa-oosthuizen. This much lower rate occurs, however, because of the lack of a safety net, and much of the employment is what is termed vulnerable and in the informal sector. For more information on unemployment on South Africa, see Pieterse, E (2013), “Filling the Void: Towards an Agenda for Action on African Urbanization”, Urbanization Imperatives for Africa: Transcending Policy Inertia, African Centre for Cities, Cape Town.
15.
See reference 12; also Rodrik, D (2007), One Economics, Many Recipes: Globalization, Institutions, and Economic Growth, Princeton University Press, Princeton.
16.
See reference 8.
17.
Of course climate change is an essential part of any urban or development agenda. It is not dealt with here despite its large effects on inclusive growth because it is receiving so much attention in the Intergovernmental Panel on Climate Change process, whereas the topics discussed here receive little to no attention in the UN meetings.
18.
On both the ineffective targeting of energy subsidies, which are many times larger than total development, and assistance and tax revenue collected, see World Bank (2013), Financing for Development: Post-2015, World Bank Group, Washington, DC. In addition, Buckley et al. document the sharp increase in badly targeted, large-scale urban housing subsidy programmes that have simultaneously emerged in many countries: Buckley, R M, A Kallergis and L Wainer (2015), The Housing Challenge: Avoiding the Ozymandias Syndrome, Rockefeller Foundation and New School.
19.
A commitment to provide 0.7 per cent of GDP has been repeatedly made since a UN General Assembly resolution in 1970, and was most recently reaffirmed in the discussions of the MDGs. Development assistance stands at about half this target. On trends in ODA, see the reports of the OECD.
20.
Africa has the world’s youngest population and 200 million people aged 15 to 24. That number is expected to double in the next 30 years. See Hino, H and G Ranis (2014), Youth and Employment in Sub-Saharan Africa: Working but poor, Routledge, New York.
21.
Jacobs, J (1961), The Death and Life of Great American Cities, Random House, Inc, New York.
22.
Romer, P (1986), “Increasing returns and long-run growth,” Journal of Political Economy Vol 94, No 5, pages 1002–1037; also Lucas, R E (1988), “On the Mechanics of Economic Development”, Journal of Monetary Economics Vol 22, No 1, pages 3–42.
23.
Henderson, V (2003), “Urbanization and Economic Growth: The So What Question”, Journal of Economic Growth Vol 8, No 1, pages 47–71.
24.
Polenske, K R (2005), “Clustering in Space Versus Dispersing Over Space”, in in B Johansson, C Karlsson and R Stough (editors), The Emerging Digital Economy: Entrepreneurship, Clusters and Policy, Springer, Berlin.
25.
Ades, A and E Glaeser (1995), “Trade and circuses: Explaining urban giants”, Quarterly Journal of Economics Vol 110, No 1, pages 195–227.
26.
Jedwab, R and D Vollrath (2015), “Urbanization without Growth in Historical Perspective”, Working Papers from The George Washington University, Institute for International Economic Policy.
27.
Duranton, G (2014), “Growing Through Cities in Developing Countries”, Policy Research Working Paper No 6818, World Bank, Washington, DC.
29.
Noman, A and J Stiglitz (2011), “Strategies for African Development,” in A Noman, K Botchwey, H Stein and J Stiglitz (editors), Good Growth and Governance for Africa: Rethinking Development Strategies, Oxford University Press, Oxford.
30.
Piketty’s book, Capitalism in the Twenty-First Century, has been widely praised. The reference to it being a watershed is from Branko Milanovic, one of the leading experts on income distribution; see Milanovic, B (2014), “The Return of “Patrimonial Capitalism”: A Review of Thomas Piketty’s Capital in the Twenty-First Century”, Journal of Economic Literature Vol 52, No 2, pages 519–534. The second quote is from Paul Krugman; see Krugman, P (2014), “Why We’re in a New Gilded Age”, New York Review of Books, 8 May.
31.
On the city’s number of millionaires see Frank, R (2010), “New York Has the Most Millionaires”, The Wall Street Journal, 3 August, available at http://blogs.wsj.com/wealth/2010/08/03/new-york-has-the-most-millionaires/. New York City has the highest Gini coefficient/index – a widely used measure of income concentration ranging from zero, representing perfect equality, to 100, where all income flows to one single person – of the 15 largest cities in the US. If Manhattan were a country it would have one of the least egalitarian income distributions in the world. The Economist (2013), “Cities and their millionaires”, 9 May, available at http://www.economist.com/blogs/graphicdetail/2013/05/daily-chart-7; also Pilkington, E (2014), “Mayor Bill De Blasio challenges New York’s millionaires with higher taxes”, The Guardian, 4 January, available at ![]() .
.
32.
These countries all have Gini coefficients less than half that of Manhattan. For a discussion of house price trends in their major cities, see Moody’s Investors Service (2013), Denmark, Finland, Norway and Sweden: Peer Comparison, 30 September, available at ![]() .
.
33.
Gyourko et al. (2013) present this notion for American cities. Gyourka, J, C Mayer and T Sinai (2013), “Superstar Cities”, American Economic Journal: Economic Policy Vol 5, No 4, pages 167–199.
34.
Ahrend, R et al. (2014), ”What Makes Cities More Productive? Evidence on the Role of Urban Governance from Five OECD Countries”, OECD Regional Development Working Paper No 2014/05, OECD Publishing, Paris; also Berg, A and J Ostry (2011), “Inequality and Unsustainable Growth: Two Sides of the Same Coin?”, IMF Staff Discussion Note SDN/11/08.
35.
Buckley, R M and A Mathema (2008), “Real Estate Regulations in Accra: Some Macroeconomic Consequences?”, Urban Studies Vol 45, No 11, pages 2249–2271.
36.
Expenditure on housing and services in Accra is much higher than in other cities in the study, and in Accra the quality of housing is lower: average room occupancy is more than three persons per room, with more than 45 per cent of families living in a single room. In addition, the payment form is onerous. For example, it is not unusual for renters in Accra, who account for almost two-thirds of all households in the city, to have to make upfront payments of three years of rent, suggesting an extremely tight housing market.
37.
Gough, K and P Yankson (2000), “Land Markets in African Cities: The Case of Peri-urban Accra, Ghana”, Urban Studies Vol 37, No 13, pages 2485–2500.
38.
Gyourko, J, C Mayer and T Sinai (2006), “Superstar Cities”, NBER Working Paper 12355, National Bureau of Economic Research, Cambridge, USA, page 3, available at ![]() .
.
40.
Young, A (2013), “Inequality, the Urban-Rural Gap, and Migration”, The Quarterly Journal of Economics Vol 128, No 4, pages 1727–1785. Young’s analysis of the survey results from the Demographic and Health Surveys of 65 countries shows that the Ugandan average is more than double the mean estimated ratio from other countries.
41.
Manyak, T and I Katono (2008), “Decentralization and Conflict in Uganda: Governance Adrift”, African Studies Quarterly Vol 11, No 4.
42.
Steffensen, J, P Tidemand, H Naitore, E Ssewankambo and E Mwaipopo (2004), ”Final synthesis report - a comparative analysis of decentralisation in Kenya, Tanzania and Uganda”, World Bank, Washington, DC, available at ![]() .
.
43.
The timing of the creation of these new district units suggests that electoral politics generated their development. For example, the number of districts increased by 11 for the 2001 presidential election, then by another 24 for the next presidential election in 2006, and then finally by 32 for 2011’s election. In total, 67 new districts have been established since the 2000s and 20 more were proposed in 2012.
44.
According to Green (2008), Garrett and Rodden (2003), and Dickovich and Riedl (2010), many other African countries today are reducing the autonomy of urban governments. Dudwick et al. (2011, page 37) indicate that more than two-thirds of the African countries they examined have similar patterns of a lack of convergence between rural and urban areas. Dudwick, N, K Hull, R Katayama, F Shilpi and K Simler (2011), From Farm to Firm: Rural-Urban Transition in Developing Countries, World Bank, Washington DC; also Dickovich, J and R Riedl (2015), Comparative Assessment of Decentralization in Africa: Final Report and Summary of Findings, United States Agency for International Development; Garrett, G and J Rodden (2003), “Globalization and Fiscal Decentralization”, in M Kahler and D Lake (editors), Governance in a Global Economy: Political Authority in Transition, Princeton University Press, Princeton; and Green, E (2008), “District Creation and Decentralization in Uganda”, Crisis States Research Centre Working Paper No 24, Development Studies Institute, London School of Economics and Political Science.
45.
Brahm, J (2012), “To Buy or Not to Buy? The Changing Relationship between Manhattan Rents and Home Prices”, Current Issues in Economics and Finance Vol 18, No 92012, Federal Reserve Bank of New York. Brahm shows that Manhattan house prices have been driven by speculative demands rather than rental values.
46.
Schill, M and G Daniels (2003), “State of New York City’s Housing and Neighborhoods: An Overview of Recent Trends”, Economic Policy Review Vol 9, No 2, Federal Reserve Bank of New York, page 9; also ![]() , Housing New York: A Five-Borough, Ten-Year Plan, New York.
, Housing New York: A Five-Borough, Ten-Year Plan, New York.
48.
49.
New York City Office of Tax Policy (2013), Annual Report on Tax Expenditures, Fiscal Year 2013, City of New York Department of Finance, New York, available at ![]() .
.
50.
In the mid-2000s, numerous units developed under the US Department of Housing and Urban Development, Low-Income Housing Tax Credit or Mitchell-Lama affordable housing programme were no longer subject to affordability restrictions, and entered the private market. Furman Center for Real Estate and Urban Policy (2012), “Renters and Rental Units”, in State of New York City’s Housing and Neighborhoods in 2012, pages 25–29, available at ![]() .
.
51.
Florida, R (2014), “Two Very Different Types of Migrations Are Driving Growth in U.S. Cities”, CityLab, 21 April, available at ![]() .
.
52.
A Google Ngram on the subject matter, which measures the amount of attention given to a topic in published literature over time, indicates that interest in urban policy has been far weaker than that of alternative strategies, such as industrial policy or income inequality.