
Abstract
This paper reviews and assesses how urban poverty in Zambia is defined and measured by the government, using data from the Jesuit Centre for Theological Reflection (JCTR). It shows the often dramatic differences in the scale and nature of urban poverty, depending on what poverty measurements are chosen and applied. Applying the government poverty line, which takes no account of differences in costs between rural and urban areas, shows the incidence of urban poverty falling from 49 per cent in 1991 to 27.5 per cent in 2010; but a food basket based on what urban households eat is twice the cost of the food basket used in the official poverty line. In addition, as the paper describes, what urban poor households pay for food is often particularly high as they cannot buy in bulk. The official poverty line’s allowance for housing costs is based on what low-income groups spend on housing, not on the costs of the cheapest reasonable quality accommodation. The JCTR estimate for the cost of essential non-food needs is twice that in the official poverty line, and the JCTR review of house prices shows that the cost of “adequate” housing in cities is far higher than the allowance for housing in poverty lines. The paper also discusses other reasons why official poverty lines understate urban poverty, including neglecting the costs low-income groups face for transport, health care and keeping their children in school.
Keywords
I. Introduction
With only a year left to the 2015 deadline for achieving the Millennium Development Goals (MDGs), the fight against poverty is at the centre of national and international development discussions. The triple crises – fuel, food and economic – that reached their heights in 2008 have only increased the urgency.
According to global reports, some progress has been made towards poverty eradication. For example, Chen and Ravallion(1) found that on average, the number of poor people in the world’s nations has declined. However, the new estimates still show irregular trends across regions. East Asia experienced a dramatic 63 per cent reduction in the numbers below the US$ 1.25 a day poverty line between 1981 and 2008, while sub-Saharan Africa only had a slight reduction of four per cent, from 51 per cent to 47 per cent, for the same period.
Whether the overall improvements are a result of better data and revised methodology for assessing poverty is not really clear. This paper draws on evidence from Zambia to demonstrate that its poverty lines(2) may fail to reflect people’s basic needs in a realistic way, particularly for those in urban areas. The criteria for both “extreme” and “overall” poverty in Zambia ignore typical household consumption patterns, an important consideration in measuring poverty. Furthermore, they do not take into account spatial price differentials.
As poverty statistics are an intrinsic aspect of policy-making, the definition and measurement of poverty is critical. This article posits that the success of both national and international development plans should be anchored in a precise characterization and measurement of poverty. It examines the robustness of urban poverty measurements in Zambia and elaborates on some of the problems of poverty assessment. It does so by critiquing the methodology of the Central Statistics Office (CSO), the major statistical body in Zambia, using data from the Jesuit Centre for Theological Reflection (hereafter JCTR), a prominent local, non-state actor that has been conducting cost of living surveys in Lusaka and other towns in Zambia since the 1990s. The article specifically interrogates the basic form and characteristics of the CSO’s extreme and overall poverty lines in relation to the JCTR’s findings. It also uses anecdotal evidence collected from select high-density (low-income) areas of Lusaka to question the suitability of poverty lines in the country.
Section II of this paper provides a brief overview of the income versus multi-dimensional measurements of poverty. The discussion then focuses on poverty in Zambia, assessing poverty levels and some of the related debates, followed by a detailed analysis of the CSO measurements of extreme and overall poverty in relation to the JCTR’s cost of living surveys.
II. Overview of Poverty Measurements
Historically, poverty measurements have been associated with the late nineteenth century British social reformers.(3) Not surprisingly, the initial conceptualization of poverty was income based, and income has remained at the core of the concept’s meaning. The justification for this is that (in market-based economies) lack of income is highly correlated with other characteristics of poverty and is a predictor of associated and future deprivation.(4) As defined by Townsend,(5) people can be said to be in poverty when they lack, or are denied, the income and other resources, including the use of assets and receipt of goods and services in kind, to obtain the conditions of life – that is, the diets, material goods, amenities, standards and services – that enable them to participate in relationships and follow the customary behaviour that is expected of them by virtue of their membership in society. Ravallion(6) similarly defines a poverty line for a given individual as the money the individual needs to achieve the minimum level of “welfare” to not be deemed “poor”, given his or her circumstances.
Currently, the World Bank sets the poverty line – the minimum income level to meet basic needs – at US$ 1.25 a day in 2005 purchasing power parity. This was based on the extreme poverty lines for the 10–20 poorest countries of the world.(7) This suggests that everyone at the poverty line is taken to be equally worse off, and all those below the line are worse off than all above it.
Many have criticized the Bank’s conventional measurement of poverty, which takes income as a proxy measurement of welfare. Income-defined poverty lines are problematic for a number of reasons. Wratten(8) argues that income is a useful indicator if we want to identify those people who are likely to lack the resources to attain a socially acceptable standard of living. However, it does not measure accurately their capacity to achieve access to the goods and services they require (which may be influenced by other factors such as education, information, legal rights, illness, threatened domestic violence or insecurity).
Motivated by some of these criticisms, Amartya Sen developed his widely used “capabilities” approach. He argues that “… a person’s ‘capability’ refers to the alternative combinations of functionings that are feasible for that person to achieve. Capability is thus a kind of freedom: the substantive freedom to achieve alternative functioning combinations (or, less formally put, the freedom to achieve various lifestyles).”(9) One of his points of emphasis is that unlike low income, which is only instrumentally significant, the capability approach concentrates on deprivations that are intrinsically important. As such, Sen argues that income is not the only instrument in generating capabilities.(10)
Mitlin and Satterthwaite(11) suggest that the 1990s brought a wider discussion of poverty beyond consumption-based definitions to include discussion of the lack of basic services provision and other deprivations. This has been exemplified by the adoption and implementation of the MDGs globally. Even the World Bank has since recognized that an exclusive focus on income may not be enough and that an alternative empirical approach to measuring poverty may also be needed. Hence, in 1993, the Bank began conducting poverty assessments that included participatory surveys. Initial investigations along these lines were designed to elicit information about an expenditure-based or income-based poverty line. For example, respondents might be asked: “What income would you consider to be the minimum needed to make ends meet?” More recent work on participatory poverty assessments is much more open-ended, interactive and qualitative, allowing people to describe what constitutes poverty in whatever dimension they choose.(12)
It is clear, therefore, that there is now widespread agreement on the definition of poverty as including both low income and limited capabilities to fulfil universal human needs. Perceptions about the nature of poverty, and the policy responses that follow from these perceptions, are central in deciding how best to study, measure and analyze poverty.(13) In interrogating urban poverty measurements in Zambia, this article will adopt an expanded definition of poverty, embracing other dimensions of well-being such as decent housing, water and sanitation.
III. The Incidence of Poverty in Zambia
The Central Statistics Office (CSO) of Zambia has been collecting poverty data to monitor the social dimensions of adjustment programmes since its first priority survey in 1991. The overall aim of these surveys was to understand and highlight social dimensions emanating from Zambia’s Structural Adjustment Programme and to analyze how such activities affected different segments of the country’s population. Among other data, the survey collected information on health, education, household expenditure and household amenities and facilities.
The priority surveys evolved into broader surveys, namely the Living Conditions Monitoring Surveys (LCMSs). To date, five LCMS reports have been published, for 1996, 1998, 2002/03, 2004 and 2006/2010. One objective of these broader LCMSs was to identify vulnerable groups in society that cannot afford, or do not have access to, the basic necessities of life and necessary social and economic infrastructure.(14)
As in many other countries, poverty levels in Zambia have been at the centre of national debates, with both the figures and their analysis contested by various factions of society. Ideally, it would be better to assess the changes in people’s living standards by analyzing poverty over time, and while one objective of these Zambian welfare studies is to provide comparable estimates over time, the differences in survey design, and in some instances adjustments in methodologies for estimating poverty, limit the validity of these comparisons. However, a few surveys are comparable and these are 1991 and 1993; 1996, 1998 and 2004; and 2006 and 2010. This paper draws mainly from the 2006 and 2010 LCMSs, which were published in one report due to the delayed release of the 2006 results.(15)
Table 1 provides a summary of poverty levels since 1991 and shows that the incidence of overall poverty was very high in the early 1990s. This is not surprising, as at the time the government was implementing austerity measures through the Structural Adjustment Programme in order to reduce the fiscal deficit. As indicated by Ndulo and Mudenda,(16) between 1981 and 1990 formal employment as a percentage of the labour force averaged 23 per cent, but fell to an average of 12 per cent for 1991–2000 when the liberalization programme was in full swing, and by 2003 it had fallen further to 8.1 per cent.
Incidence of overall and extreme poverty in Zambia
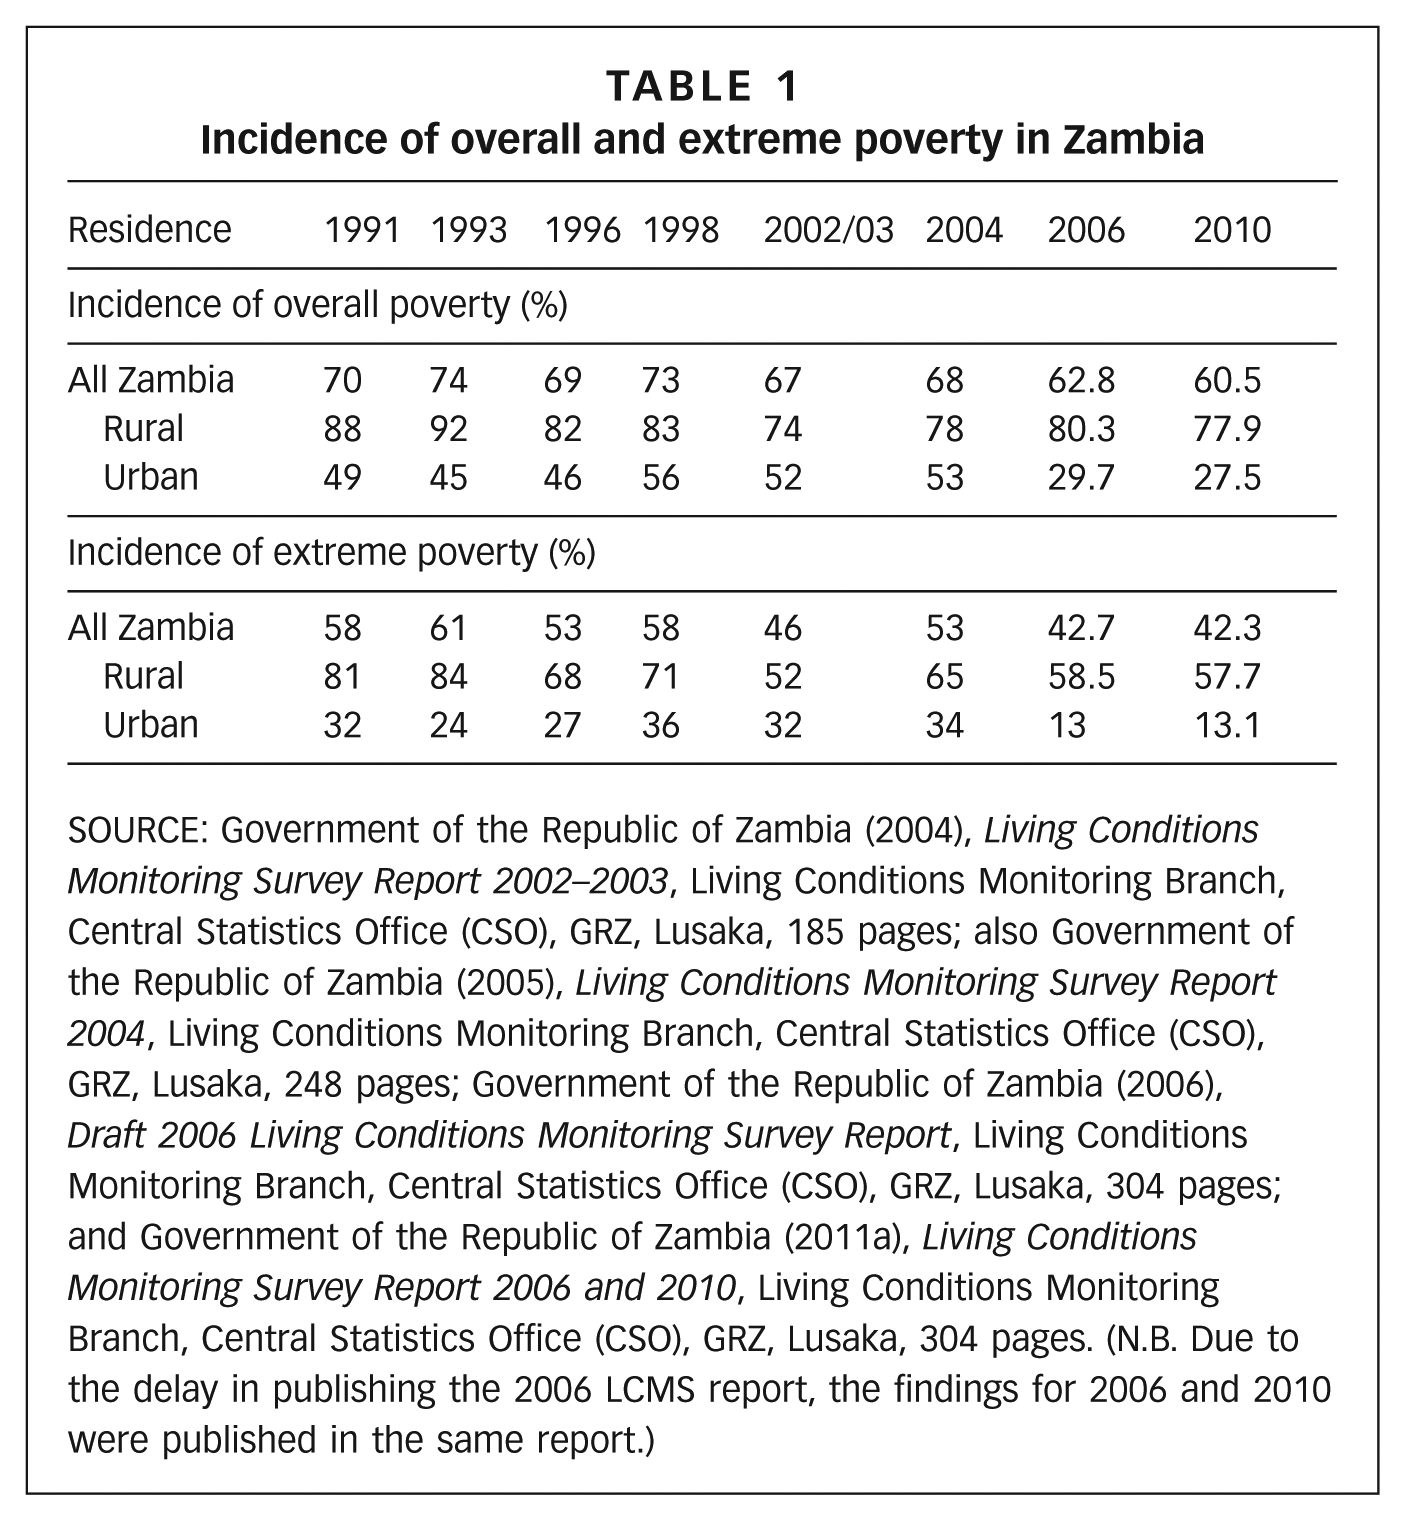
SOURCE: Government of the Republic of Zambia (2004), Living Conditions Monitoring Survey Report 2002–2003, Living Conditions Monitoring Branch, Central Statistics Office (CSO), GRZ, Lusaka, 185 pages; also Government of the Republic of Zambia (2005), Living Conditions Monitoring Survey Report 2004, Living Conditions Monitoring Branch, Central Statistics Office (CSO), GRZ, Lusaka, 248 pages; Government of the Republic of Zambia (2006), Draft 2006 Living Conditions Monitoring Survey Report, Living Conditions Monitoring Branch, Central Statistics Office (CSO), GRZ, Lusaka, 304 pages; and Government of the Republic of Zambia (2011a), Living Conditions Monitoring Survey Report 2006 and 2010, Living Conditions Monitoring Branch, Central Statistics Office (CSO), GRZ, Lusaka, 304 pages. (N.B. Due to the delay in publishing the 2006 LCMS report, the findings for 2006 and 2010 were published in the same report.)
The trend between 1996 and 2004 in Table 1 shows that poverty levels increased between 1996 and 1998, from 69 per cent to 73 per cent, but by 2004 had decreased to 68 per cent. Extreme poverty followed the same trend. Based on this data, more than 50 per cent of Zambians in the 1990s were unable to meet their basic nutritional requirements.
The LCMS of 2002/03 showed an overall poverty rate of 67 per cent, with 46 per cent of the population being extremely poor and unable to afford even the minimum basic food requirements. According to the 2002/03 LCMS, poverty was highest in the fourth quarter, considered to be the lean (peak hunger) period due to low seasonal agricultural production. Figure 1 shows a typical seasonal calendar and critical events timeline. In light of this seasonal aspect of poverty, the CSO conducts cross-sectional surveys in the fourth quarter of the year. The aim is to capture the highest poverty levels in the year, taking the 2002/03 results as the norm.
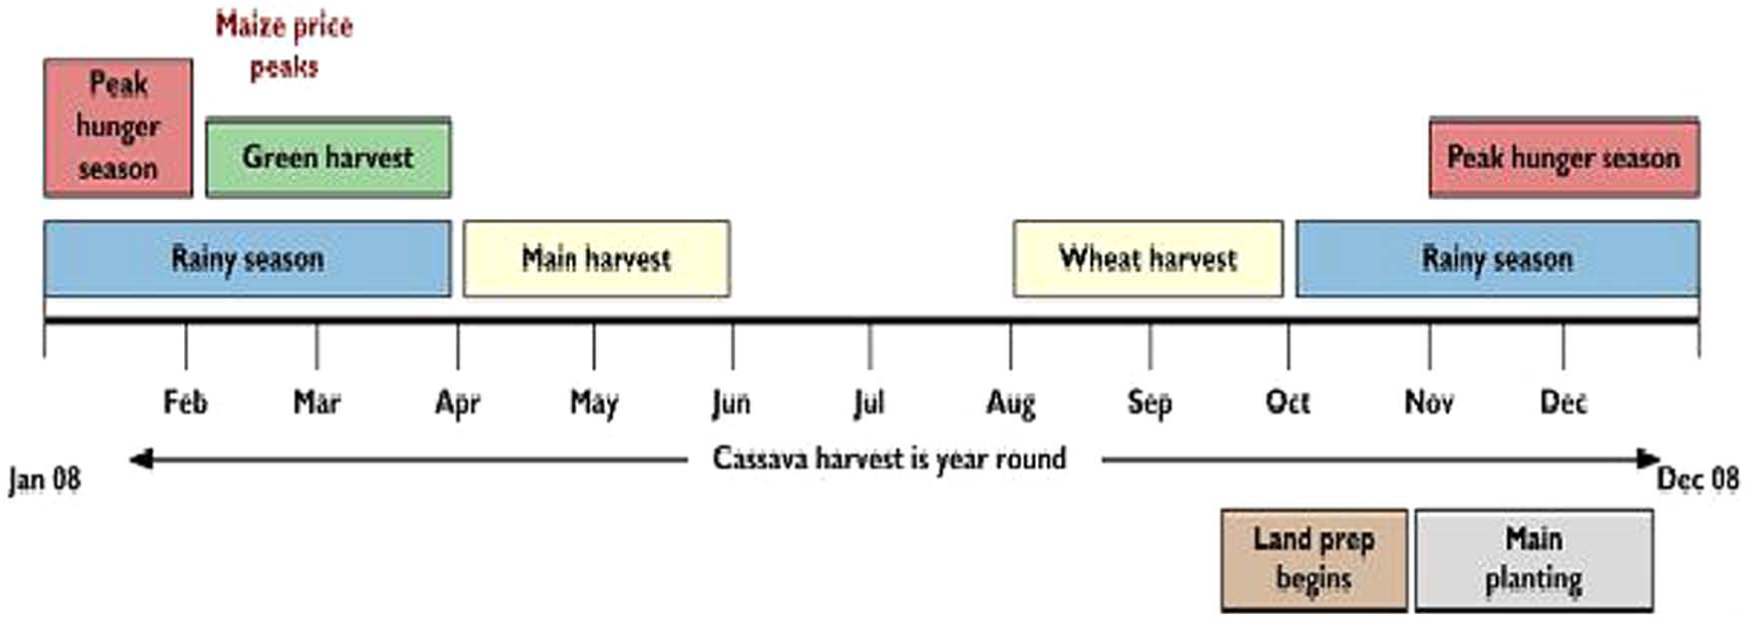
Seasonal calendar and critical events timeline
While food availability in rural areas affects food affordability in urban areas,(17) there may be a lag in urban price changes relative to changes in supply in rural areas. The JCTR has observed through its monthly cost of living surveys that over the years, food prices in urban areas in Zambia are highest in the first quarter of the year, reflecting this lag.
Critics of the CSO survey methodology have argued that measurements should differentiate between rural and urban areas and take account of this lag in price changes. Adjusting for seasonal cost of living differences is important to ensure equal treatment of urban and rural dwellers. As suggested by Satterthwaite,(18) there is a need for greater attention to understanding and measuring urban poverty in ways that better capture the scale and nature of its deprivation.
There are also disparities in costs related to how food items are accessed: urban dwellers typically purchase these, while rural people consume mainly self-produced foods at lower cost. Urban settlements in Zambia are dense and there are few opportunities for urban agriculture. Even when a market value is estimated for own-produced foods in rural areas, food prices are generally lower mainly due to higher supply and lower transport costs from the farm gate to the local market. Therefore, using an average cost underestimates urban poverty and is likely to overestimate rural poverty.
However, the CSO uses the same approximated nominal cost of food for the same bundle of food needs without weighting it to reflect actual costs of food and non-food items in different regions, at different times. For instance, the 2006 CSO food poverty line was valued across the board at 275,751 Zambian Kwacha (K), the average national price at which the CSO bundle of food items reaches the pre-determined mean food energy requirement of 2,100 calories per person per day. This single national food poverty line does not make sense in the Zambian context, considering the significant disparity in food costs across urban centres. The disparity would be greater between rural and urban areas.
IV. The Controversy over Poverty Statistics in Zambia
Zambia’s poverty statistics, particularly for 2006, have proved confusing and controversial. Different government departments produced different results prior to the combined 2006 and 2010 LCMS report publication in November 2011. The preliminary 2006 LCMS poverty estimates provided by CSO alarmed many stakeholders: they indicated that while rural poverty increased from 78 per cent to 80 per cent, urban poverty fell significantly from 53 per cent to 34 per cent.(19) This unprecedented 19 percentage point reduction in urban poverty between 2004 and 2006 was controversial, as socioeconomic indicators had not improved. For example, only about 10 per cent of the entire Zambian labour force was in formal employment.(20) No clear explanations were offered by the government as to why poverty had fallen so dramatically within a two-year period when the same methodology was used.
In view of this confusion, it was not surprising that there was a significant delay in publishing the final 2006 LCMS results, and the CSO published both the 2006 and 2010 results in the same report. According to the CSO, this was necessitated by adjustments in the measurement of poverty.(21)
One trend that remains uncontested throughout all the surveys is the geographic pattern of poverty in Zambia: it is more concentrated in rural areas than in urban areas. The following sections explore the robustness of the poverty measurements in order to consider the likely accuracy of urban poverty estimates; the analysis is based on the 2006 and 2010 LCMS results.
V. Interrogation of the CSO Poverty Lines
a. A critical assessment of the measurement of the extreme poverty line in Zambia
Poverty estimates in Zambia have been made on the basis of the cost of a “minimum food basket”. The Prices and Incomes Commission and the National Food and Nutrition Commission defined this minimum food basket in 1992 based on the nutritional needs of an average family of six – two adults and four children aged between one and 12 years old. The average calorie intake was set at 2,094 per household member for this average family.(22)
On a conceptual level, the construction of a food basket has to consider several aspects, in particular, desired nutritional values, typical consumption patterns and the measurement of consumption. The food component of the poverty line is almost universally anchored to nutritional requirements for good health. However, some critics, including Ravallion,(23) argue that this does not generate a unique monetary poverty line, since many bundles of food goods yield the same nutritional level. For instance, in the Zambian case, an alternative to the CSO’s food basket measurement has been constructed by the JCTR as a result of their own survey. The cost of living survey, called the Basic Needs Basket (hereafter BNB), features a slightly different bundle of food items that also adds up to an average of 2,100 calories per person per day. The two baskets, their differences and the significance for poverty measurement are explained in detail below.
Most of the available literature recommends that the food basket be constructed using food expenditure values of households in the lowest one or two quintiles of the population so that the basket reflects the consumption patterns of the poor. In developing the minimum food basket in Zambia, the CSO starts by determining the cost of a simple food basket that meets minimal nutritional requirements for a family of six,(24) without necessarily following what is typically consumed by the poor.
This paper argues that any reasonable calculation of food poverty lines should be based on typical consumption patterns, informed by household food expenditure shares. That is, poverty calculations should take into consideration what households are actually consuming, and adjust quantities to meet both calorific and micro-nutritional requirements such as iron and zinc.
Taking the 2006 food expenditure shares depicted in Table 2 as an example,(25) urban households devoted 80 per cent of their total food budget to the listed food items on the left, while urban poor households devoted 86 per cent of their total food budget to the list on the right. Either of these food baskets could be used to calculate the food poverty line after adjusting for nutritional requirements.
Food share for households in urban Zambia (2006)
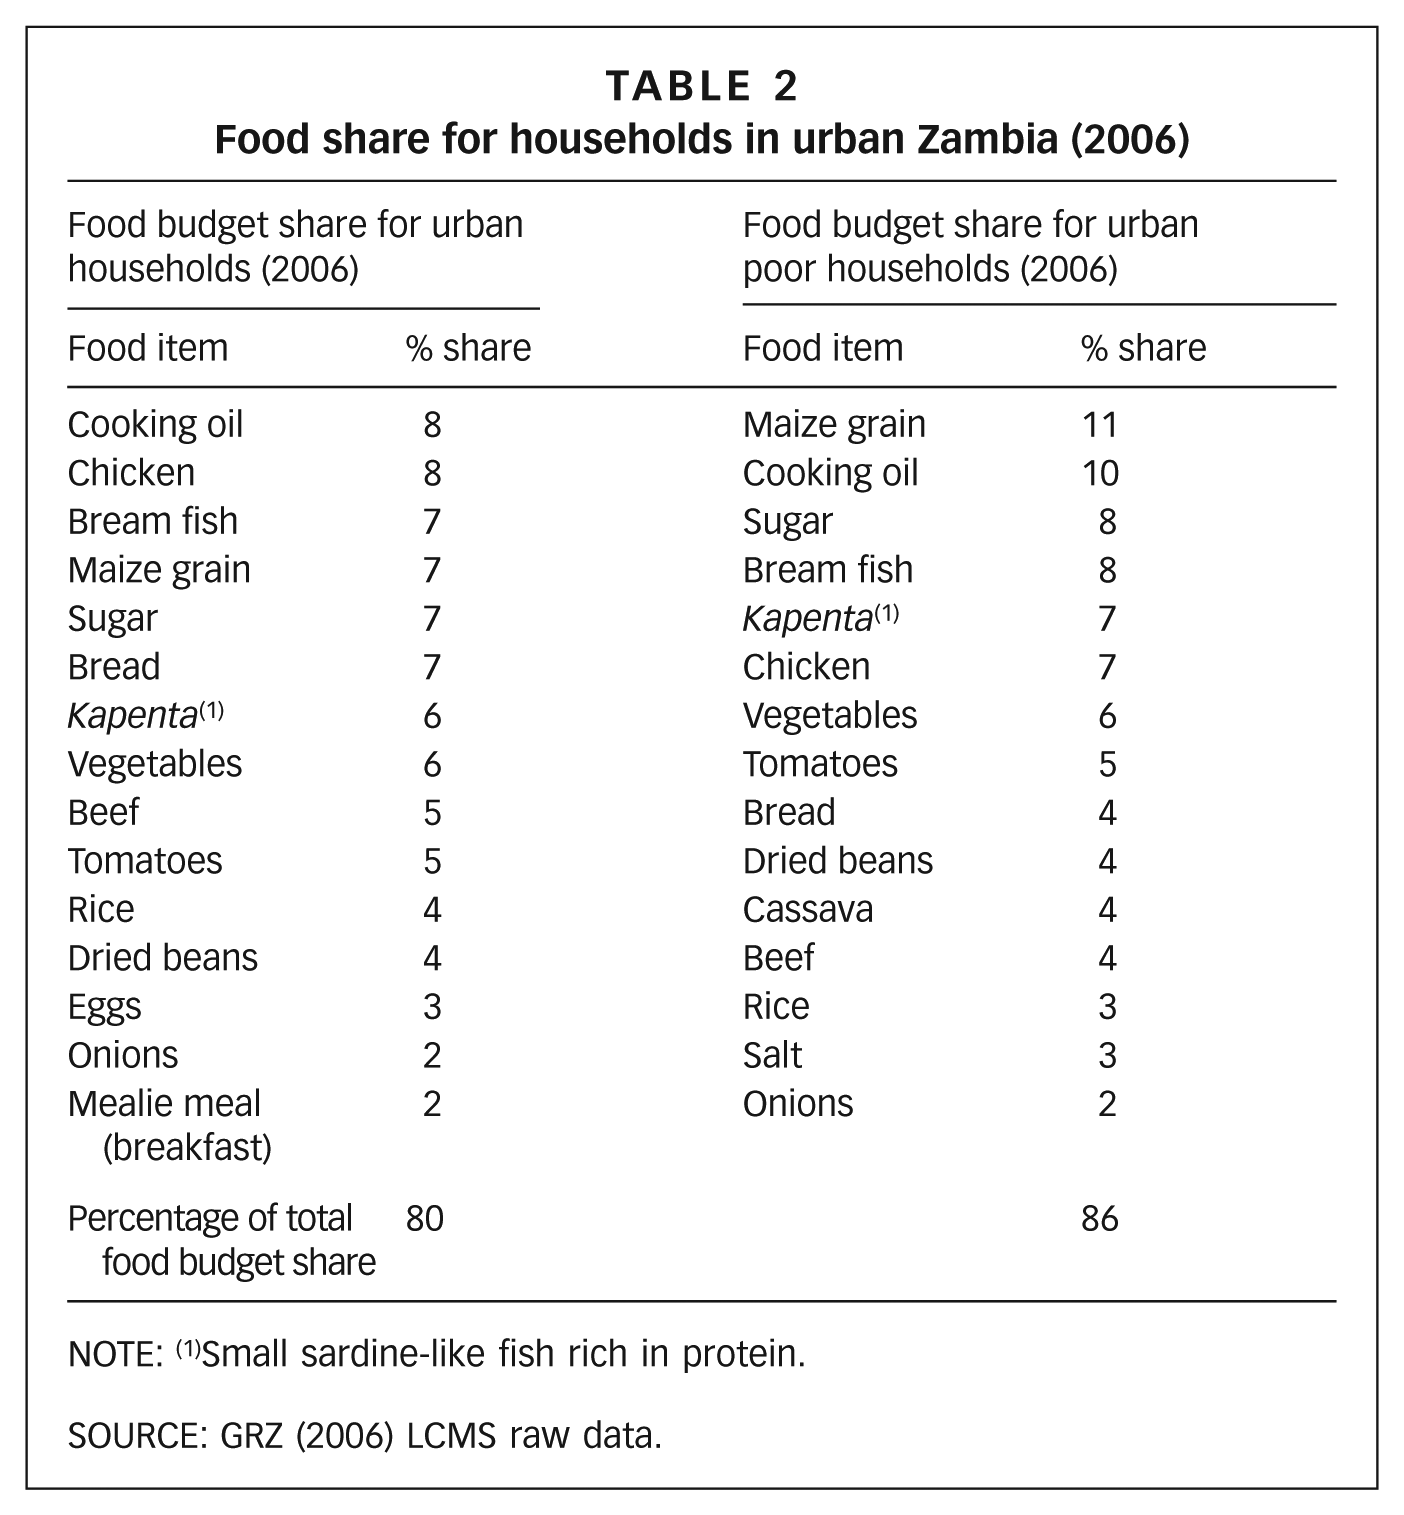
NOTE: (1)Small sardine-like fish rich in protein.
SOURCE: GRZ (2006) LCMS raw data.
Comparing the overall food budget shares for households in urban areas with that for the urban poor, the variation is minimal. Specifically, while urban households in general devoted three per cent and two per cent of their food budget to eggs and breakfast mealie meal,(26) respectively, the urban poor devoted four per cent to cassava and three per cent to salt. As the majority of the food items are constant, the rest of the analysis will refer to the food budget share for urban poor households only.
b. CSO and JCTR food baskets
While both the JCTR and CSO food baskets (Tables 3 and 4) amount to approximately 2,100 calories per person per day, the two are different in both construction and content. The CSO conducts nationwide surveys of food costs, which makes it possible to aggregate the findings, while the JCTR conducts town-specific surveys and its basket is based on Lusaka costs. The CSO also conducts its survey at the beginning of each month, while the JCTR does so at the end of each month.
CSO food basket to meet monthly nutritional requirements of a household of six in December 2006 and December 2010 (prices in Zambian Kwacha)
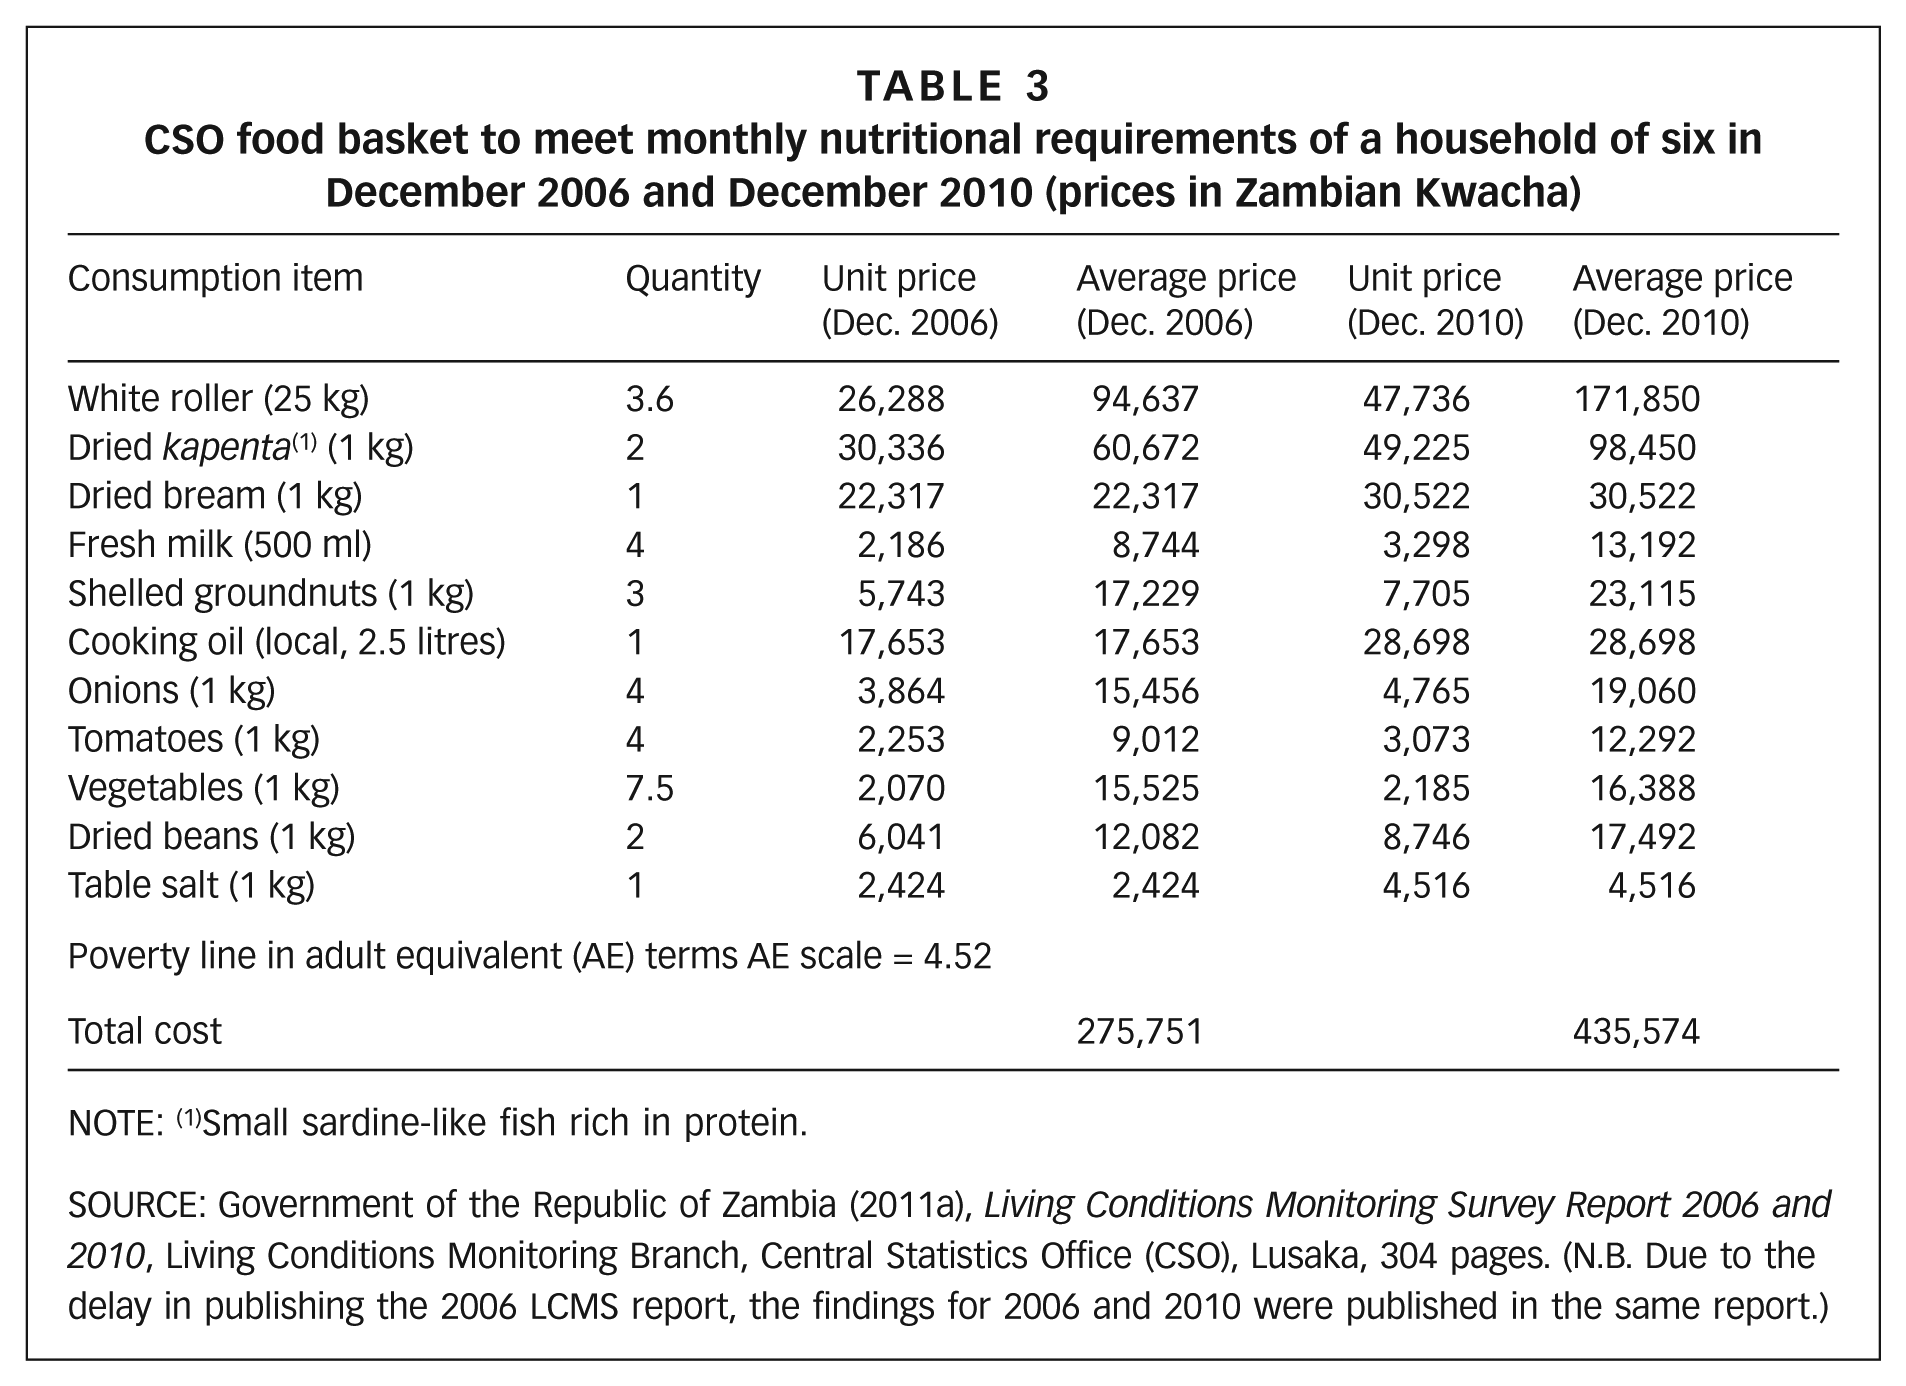
NOTE: (1)Small sardine-like fish rich in protein.
SOURCE: Government of the Republic of Zambia (2011a), Living Conditions Monitoring Survey Report 2006 and 2010, Living Conditions Monitoring Branch, Central Statistics Office (CSO), Lusaka, 304 pages. (N.B. Due to the delay in publishing the 2006 LCMS report, the findings for 2006 and 2010 were published in the same report.)
JCTR food basket to meet monthly nutritional requirements of a household of six in December 2006 and December 2010 (prices in Zambian Kwacha)
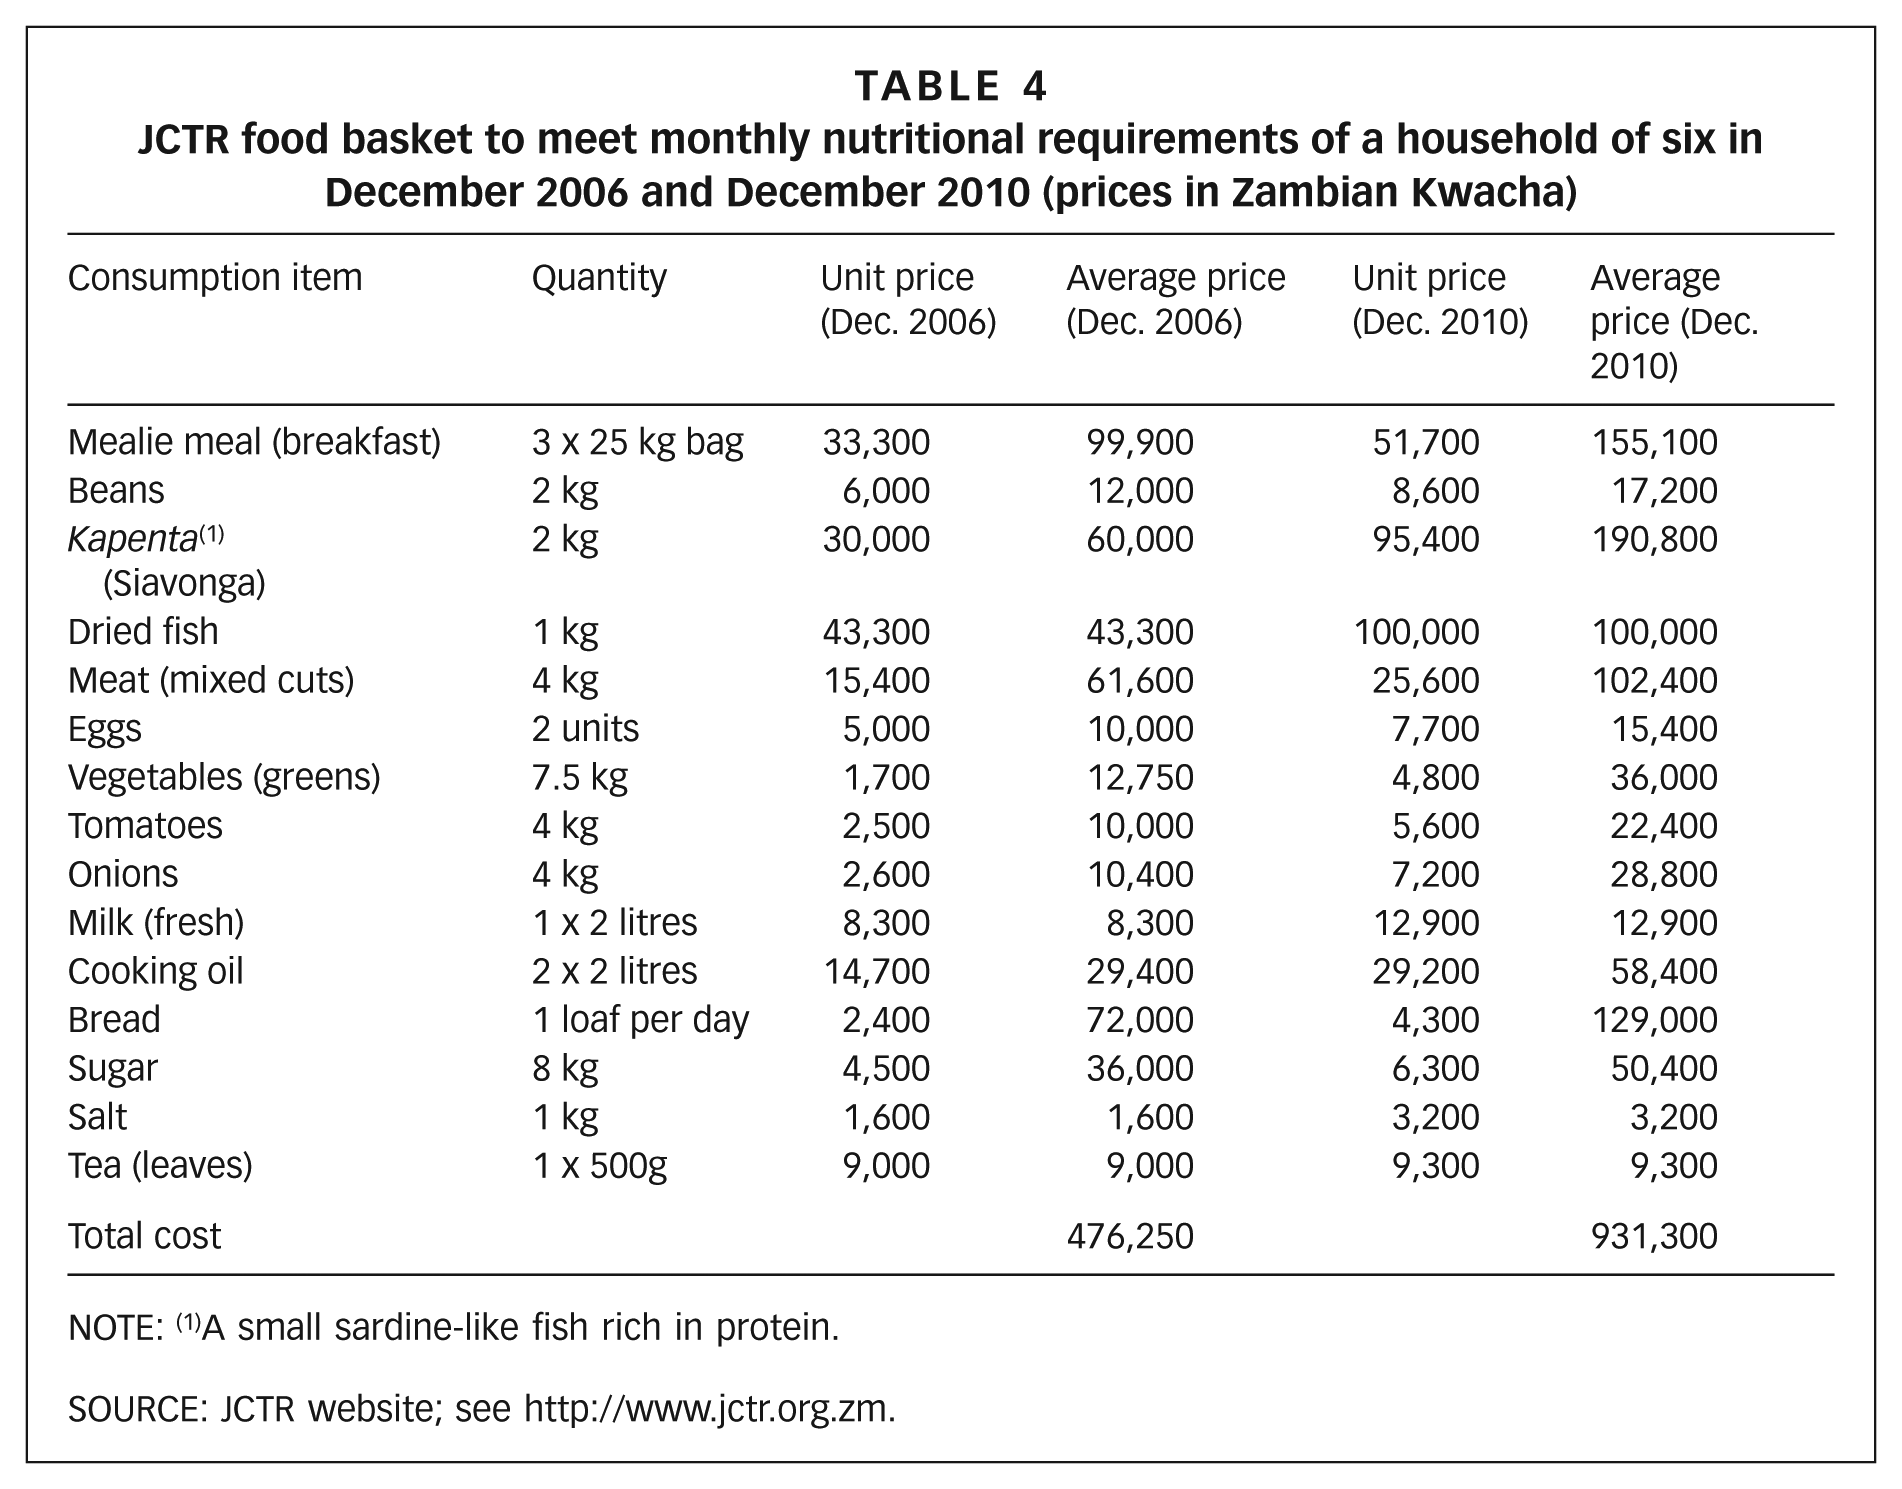
NOTE: (1)A small sardine-like fish rich in protein.
SOURCE: JCTR website; see http://www.jctr.org.zm.
There are also some major variations with regard to the content of the baskets. The JCTR takes into consideration what is consumed by a typical household in an urban town and includes basic foods consumed at breakfast, lunch and supper. It includes some preferred items that are excluded by the CSO, such as bread, sugar, meat, eggs and tea leaves. It also includes 60 per cent more cooking oil and more expensive forms of both mealie meal and dried fish. Other costs for equivalent items are roughly the same. The CSO, on the other hand, includes groundnuts and 20 per cent more mealie meal. These differences are a reminder of Ravallion’s(27) argument that different bundles of food goods can yield the same calorific value.
Therefore, the JCTR’s food basket is a more accurate reflection of urban consumption patterns than the CSO’s, but it is not an exact representation of the consumption patterns of urban poor households (Table 2). However, after estimating the 2006 total shares of both the JCTR and CSO baskets, the results reveal that the CSO captured only 51 per cent of the urban food budget share while the JCTR captured 61 per cent. This finding implies that the JCTR food basket is more representative of the consumption patterns of the urban poor, although not by much.
Table 3 shows that the food poverty line calculated by the CSO for 2006 was K275,751 and this had increased to K435,574 for 2010. This represents the estimated expenditure level at which a typical Zambian family reached the pre-determined mean food energy requirement of 2,100 calories per person (adult equivalent) per day in those specific years.
For a slightly different bundle of food items also totalling 2,100 calories per person for an average family of six in the capital, Lusaka, the cost of the JCTR food basket for December 2006 and December 2010 totalled K476,250 and K931,300, respectively, significantly higher than the CSO figures of K275,751 and K435,574. The food component of the JCTR’s BNB consisted of basic food items commonly consumed by households (Table 4) and, like the CSO, did not focus on consumption of the lowest population quintile.
Focusing on the budget share for the urban poor in Table 2, the following food items are excluded from the CSO food basket: sugar, chicken, bread, cassava, beef and rice. While subjective choices and arguments can be made about any food basket as long as required nutrients are met, surely, examining the consumption patterns of at least the urban poor should be a basic step in estimating the urban food poverty line. In the case of Zambia, this is a serious anomaly that could lead to underestimating the figure.
The paper therefore argues that the CSO should calculate the urban food poverty line using the consumption patterns as depicted by the food budget expenditure for either an average urban household (as done by the JCTR) or, even better, an urban poor household.
c. Spatial cost differentials – evidence from the JCTR surveys
In his book on the analysis of household surveys, Deaton(28) stresses the need to not only analyze prices over time but also over space.
The JCTR collects price information from seven retail outlets across Lusaka, covering high-, medium- and low-density areas (representing low-, middle- and high-income areas, respectively). A similar method is applied in the 10 other towns across Zambia where the JCTR conducts BNB surveys. Figure 2 only shows select towns for purposes of highlighting the point.
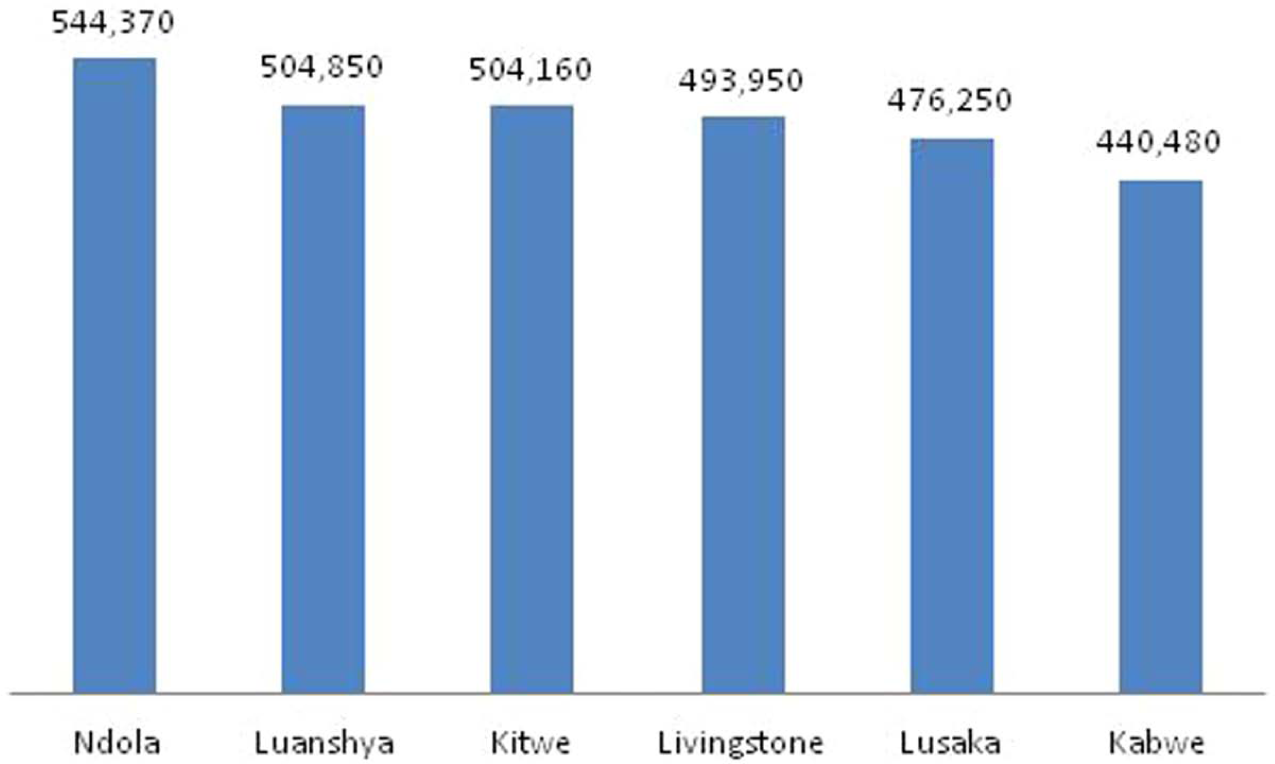
Town-specific food costs, December 2006 (Zambian Kwacha)
In addition, the cost of living varies across locations within the same city. Using the JCTR Lusaka food price data, it is evident in the areas surveyed that high-density areas generally record relatively lower prices than medium- or low-density areas. In December 2006 for instance, prices in the Chawama and Chainda markets, both high-density areas, resulted in JCTR basket values of K373,900 and K431,750, respectively. The average Lusaka food basket, on the other hand, came to K476,250. The variation is likely to be more between rural and urban areas. Therefore, when determining the composition of the food basket for calculating a poverty line, attention should be paid to how food prices vary by region and by urban centre. As argued by Deaton,(29) at the same level of expenditure, urban consumers consume fewer calories compared to rural consumers. In consequence, a common nutritional standard requires a higher level of expenditure in the cities and it is therefore argued here that the CSO in Zambia should estimate poverty lines separately for urban and rural areas and for different cities.
In order to determine how households are coping and whether the relatively lower prices in high-density areas have a positive influence, the JCTR also conducts monthly qualitative “satellite homes” surveys in the high-density areas of Lusaka. A finding that further challenges the CSO (and JCTR) baskets is that it is unusual for families in high-density areas to buy any commodity in the quantities that are produced by factories for the retail market. Instead, they purchase small repackaged goods, reflecting the reality of incomes earned in the informal sector on a daily basis or every few days and the inability of homemakers to control consumption. For example, a small 300–500-gramme packet of mealie meal, locally called pamela, is preferred to a 25-kilogramme bag, which is not affordable for low-income households.
According to the satellite homes survey,(30) a 400-gramme packet of mealie meal costs on average K1,500, resulting in a household expenditure of K93,750 for 25 kilogrammes, 31 per cent more than the cost of a single 25-kilogramme bag. This pattern extends to sugar, salt and cooking oil, among other goods. It generally costs significantly more to buy these goods in sub-optimal packets, but neither “basket” takes this into account.
VI. Measurement of the Overall Poverty Line
There is broad recognition that setting the non-food component of the poverty line is highly controversial and, as Ravallion(31) describes, this is probably the most contentious of all the data used in measuring poverty. The major challenge is finding agreement on the definition of “standard of living” and the identification of its cost from available data. Even if a fixed bundle of non-food goods were defined, it is unclear whether it would gain wide acceptance or maintain relevance over time. In the case of the food basket described above, most practices use the nutritional level to provide an objective criterion for what is considered a minimum. There is no such anchor for non-food items.
a. CSO non-food poverty measurement
The CSO acknowledges in its LCMSs that there is no straightforward approach to determining the non-food poverty line; however, the food poverty line sets the basis for how the CSO determines it.
Prior to the revisions in the 2006 and 2010 LCMSs, the CSO used a fixed single national Engel’s ratio of about 70 per cent when accounting for non-food requirements. In simple terms, 30 per cent of the food poverty line was factored into the overall poverty line to cover non-food expenditure.
For the 2006 and 2010 poverty estimates, the CSO switched to using year-specific rather than fixed Engel ratios, a reflection of changes in consumption patterns over time.(32) These year-specific ratios for 2006 and 2010 were calculated at 61 per cent and 66 per cent, respectively. This means that 39 per cent in 2006 and 34 per cent in 2010 was allocated to non-food expenditure, or K365,468 and K581,583, respectively.
However, in reality and specifically in the Zambian context, this methodology is not convincing. In particular, it fails to make any allowance for spatial differences in prices of non-food items (see Figures 3A and 3B for spatial food and non-food price differentials). The aggregate approach, already problematic for food, is even more questionable for non-food analysis, especially considering the high cost of housing.
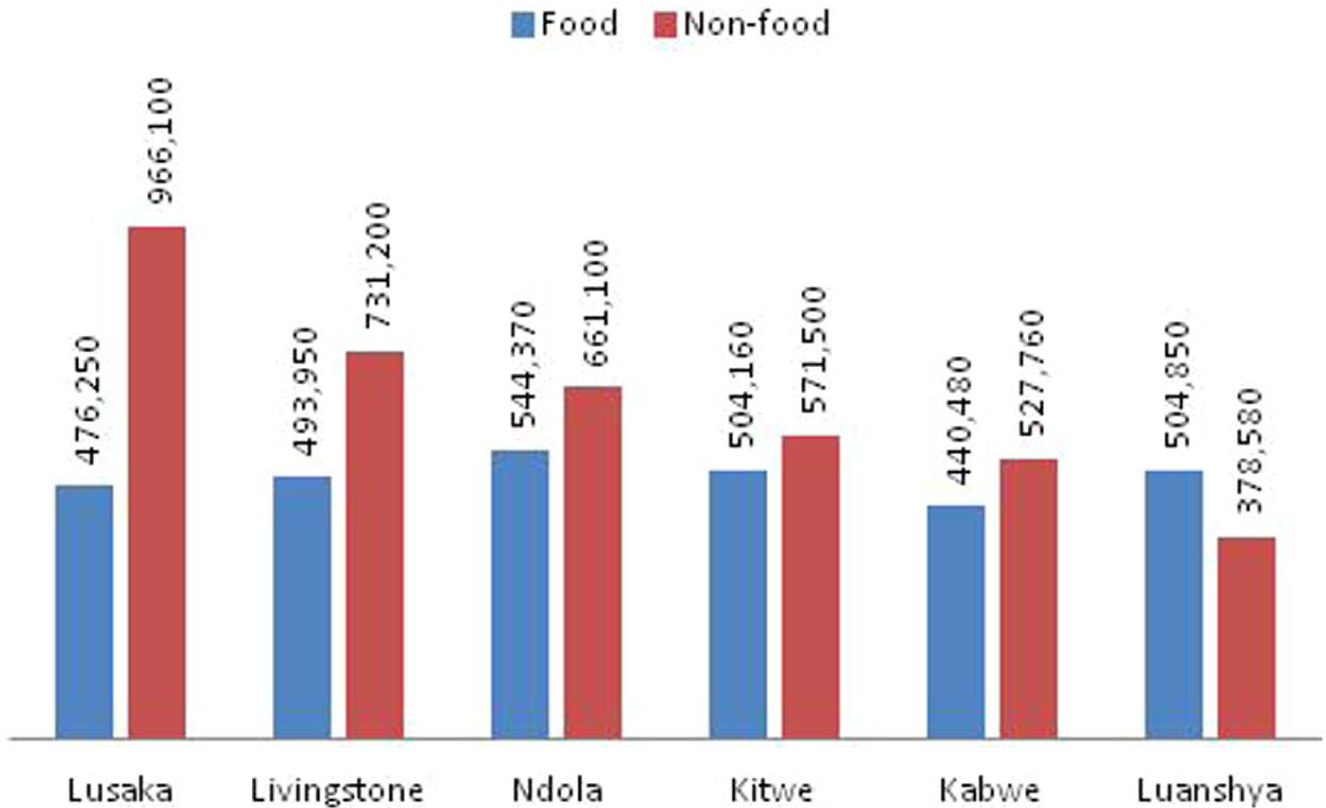
Spatial Basic Needs Basket (BNB), December 2006
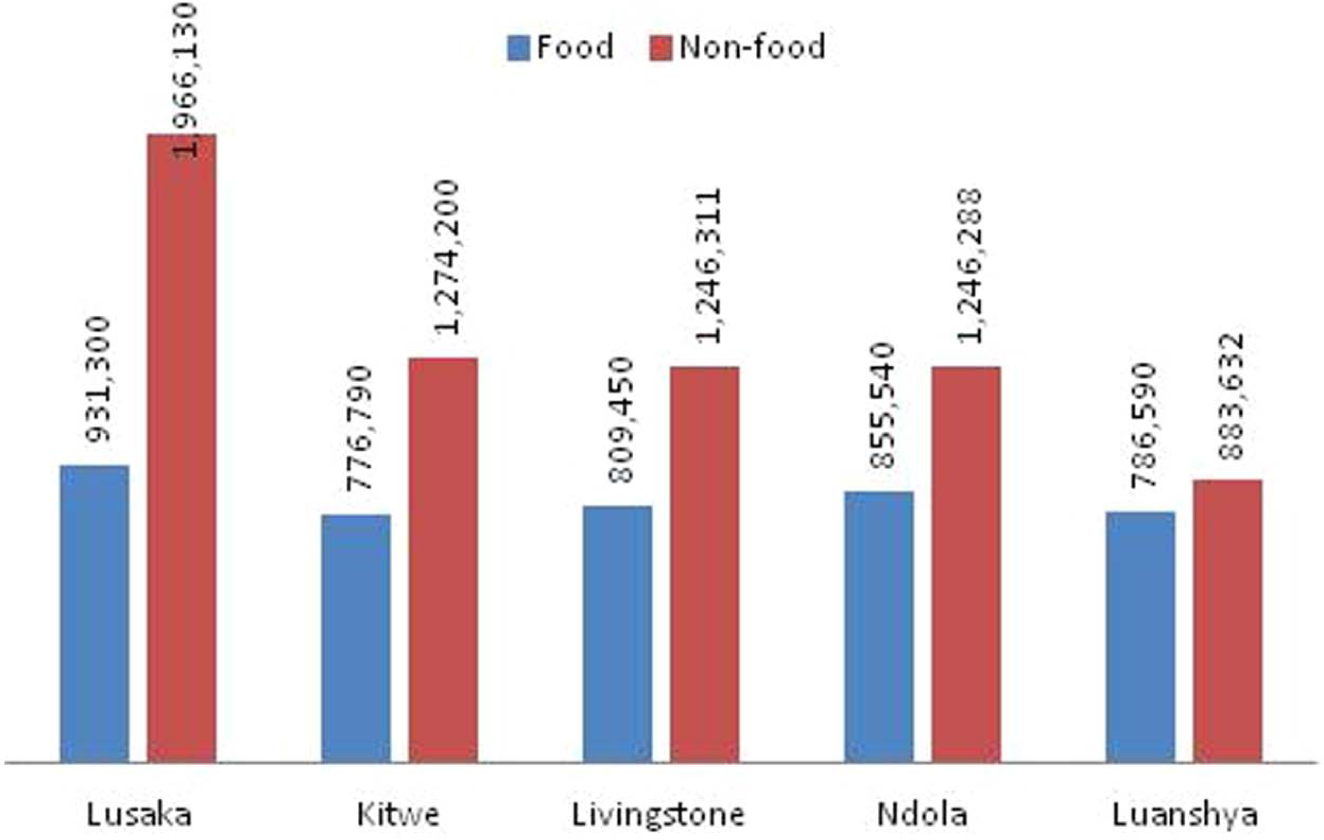
Spatial Basic Needs Basket (BNB), December 2010
Returning to the LCMSs, expenditure patterns for households in both 2006 and 2010 reveal that households spent on average more on non-food items than on food. The 2010 national average household expenditure was K485,792 for non-food and K469,863 for food,(33) but average figures mean little here. When disaggregated for rural and urban populations, in both surveys households in urban areas were found to spend significantly more on non-food items than on food, while their rural counterparts spent more on food than on non-food items (Table 5).
Average monthly household expenditure in 2006 and 2010 (Zambian Kwacha)
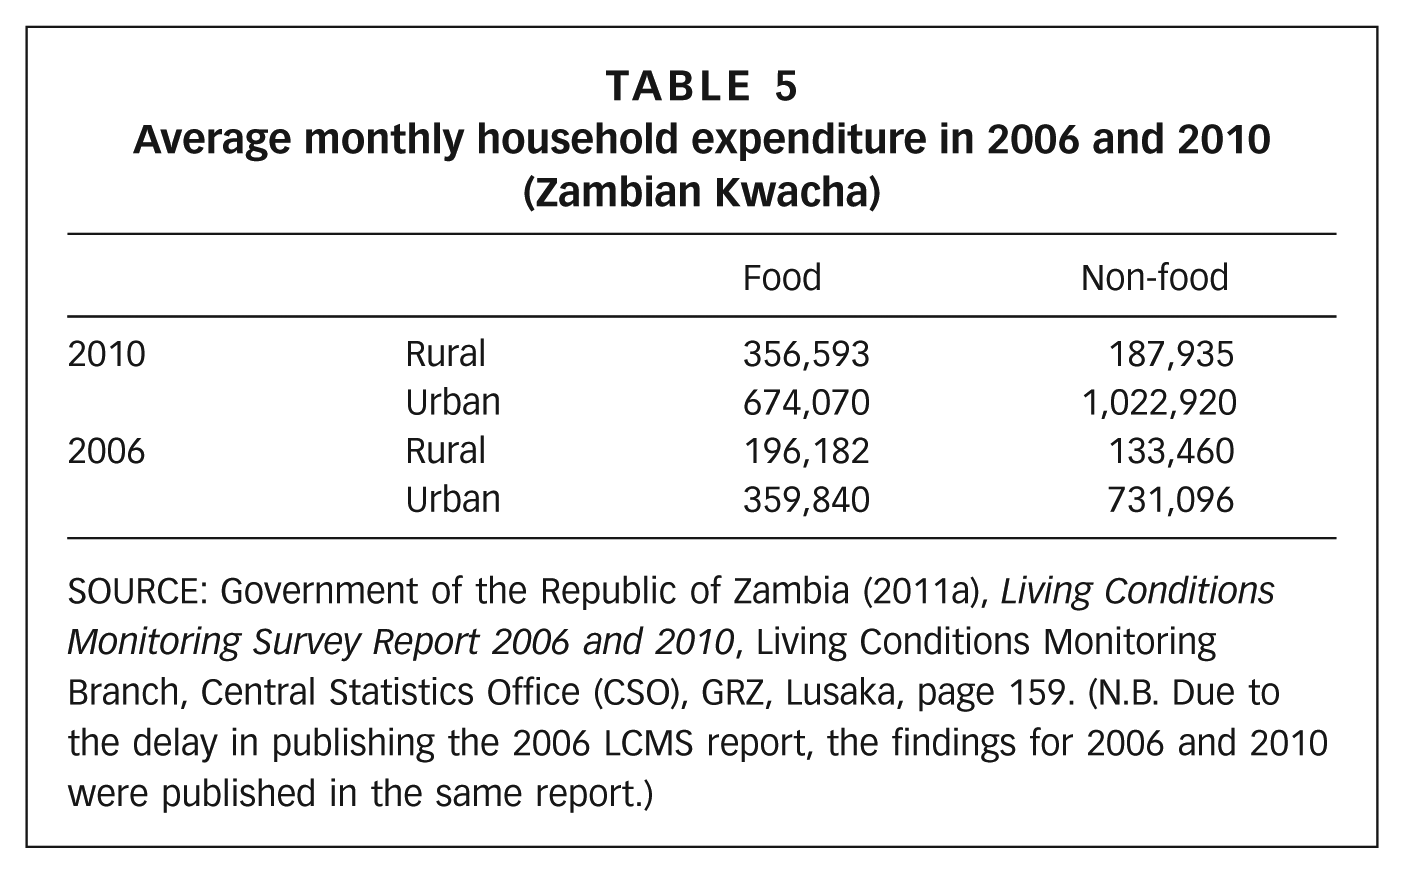
SOURCE: Government of the Republic of Zambia (2011a), Living Conditions Monitoring Survey Report 2006 and 2010, Living Conditions Monitoring Branch, Central Statistics Office (CSO), GRZ, Lusaka, page 159. (N.B. Due to the delay in publishing the 2006 LCMS report, the findings for 2006 and 2010 were published in the same report.)
The CSO’s decision to allocate 39 per cent in 2006 and 34 per cent in 2010 as non-food expenditure to the poverty line is a fairly good reflection of rural realities. But in urban areas, this formulation is clearly a long way from reflecting the actual household demand behaviour.
In 2010, non-food items accounted for 51.5 per cent of total household expenditure on average, with urban households recording a much higher share (60.9 per cent) than rural households (35.4 per cent). In the same year, the percentage share towards housing in urban areas was 31.5 per cent, while in rural areas it was much lower at 16 per cent (Table 6).
Expenditure share on non-food items by non-food type and residence (2006 and 2010) (%)
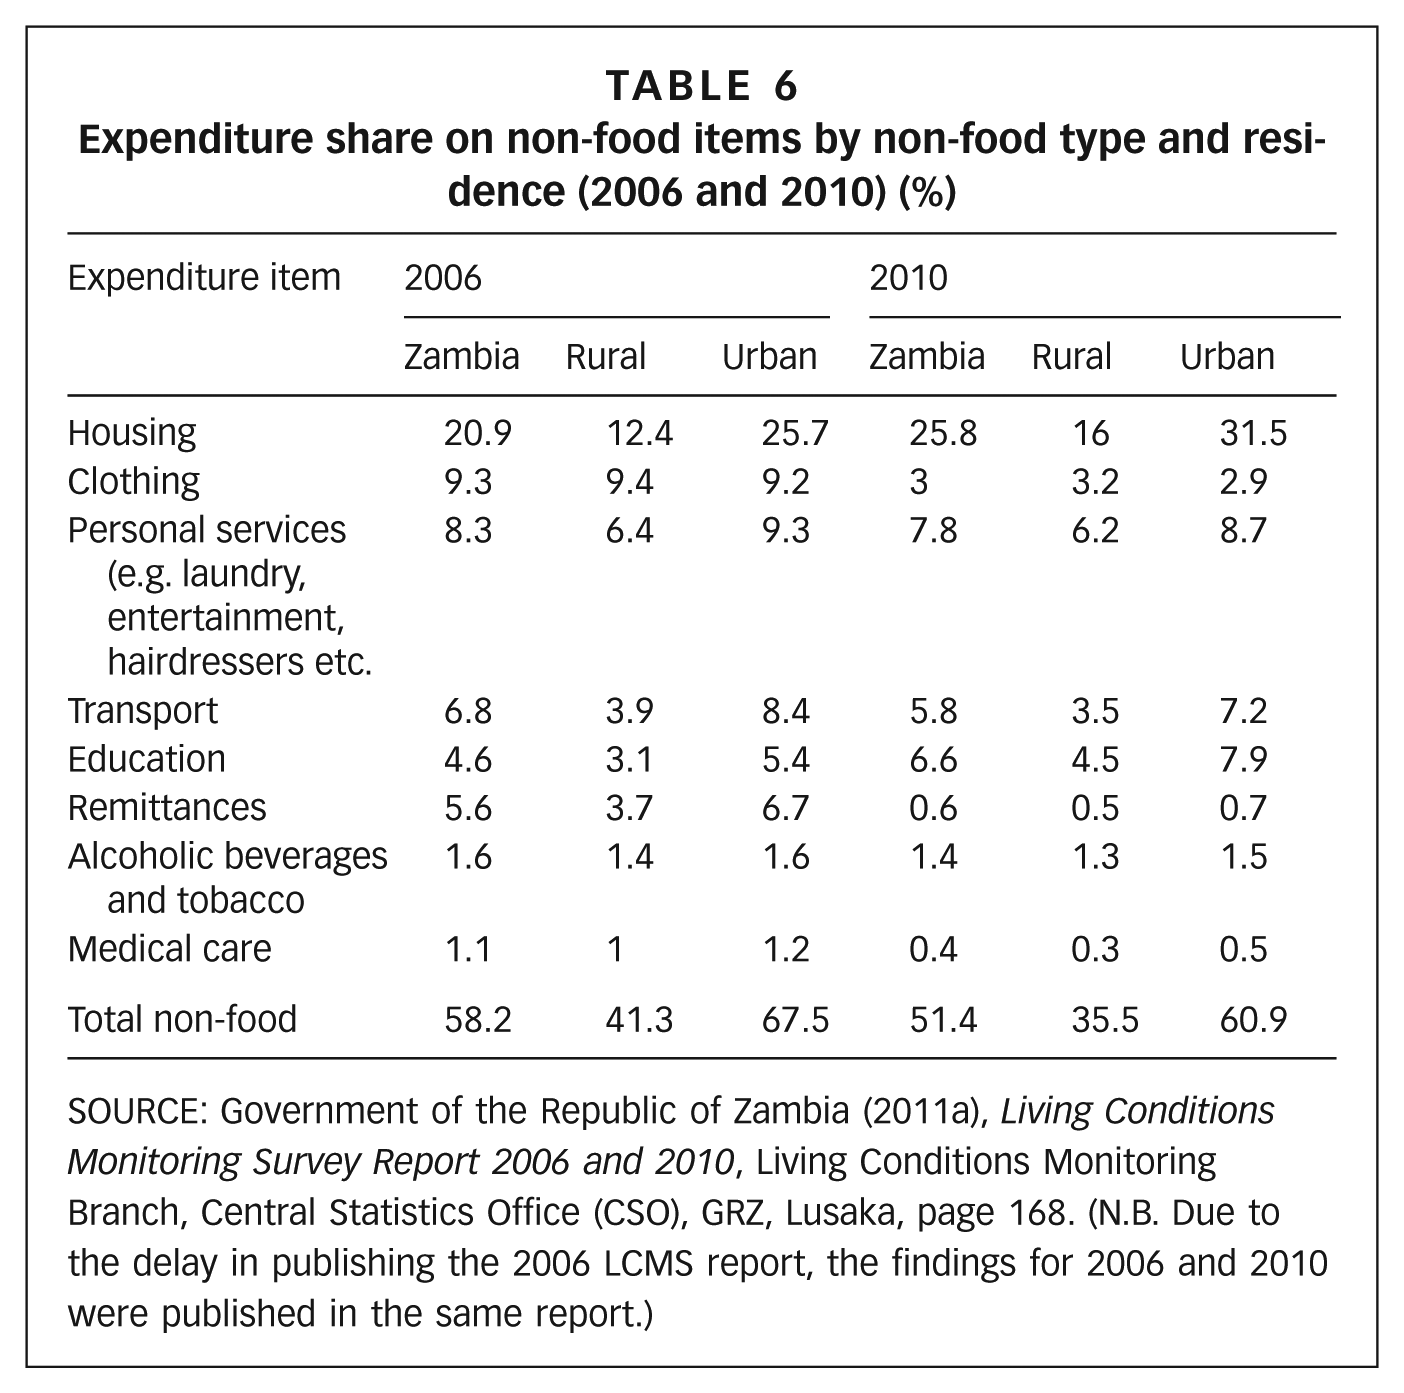
SOURCE: Government of the Republic of Zambia (2011a), Living Conditions Monitoring Survey Report 2006 and 2010, Living Conditions Monitoring Branch, Central Statistics Office (CSO), GRZ, Lusaka, page 168. (N.B. Due to the delay in publishing the 2006 LCMS report, the findings for 2006 and 2010 were published in the same report.)
These figures suggest that an inherent weakness of the poverty line in Zambia is that housing costs, a major monthly expense, are inadequately accounted for. The JCTR takes a different approach from the CSO. Rather than looking at what people with incomes close to the food poverty line spend on non-food costs, it determines an adequate quality of housing and looks at that cost. Adequate quality is judged to be a three-bedroom dwelling providing a bedroom for the parents and one each for the girl- and boy-children. According to the JCTR’s BNB, the average cost for such a house in a medium-density neighbourhood in Lusaka in December 2006 amounted to K650,000 − more than the total food costs in the same month of K476,250. In 2010, the cost was as high as K1,500,000.
b. How appropriate is the overall poverty line? Evidence from the JCTR’s non-food data
Given the lack of an agreed anchor analogous to the food energy requirements used in setting the food component of the poverty line, it is not surprising that the scope for disagreement between the JCTR and the CSO appears far greater regarding the non-food component. Table 7 shows the essential non-food items as defined by the JCTR and gives the associated costs for Lusaka.
Cost of essential non-food items for Lusaka, December 2006 and December 2010 (Zambian Kwacha)
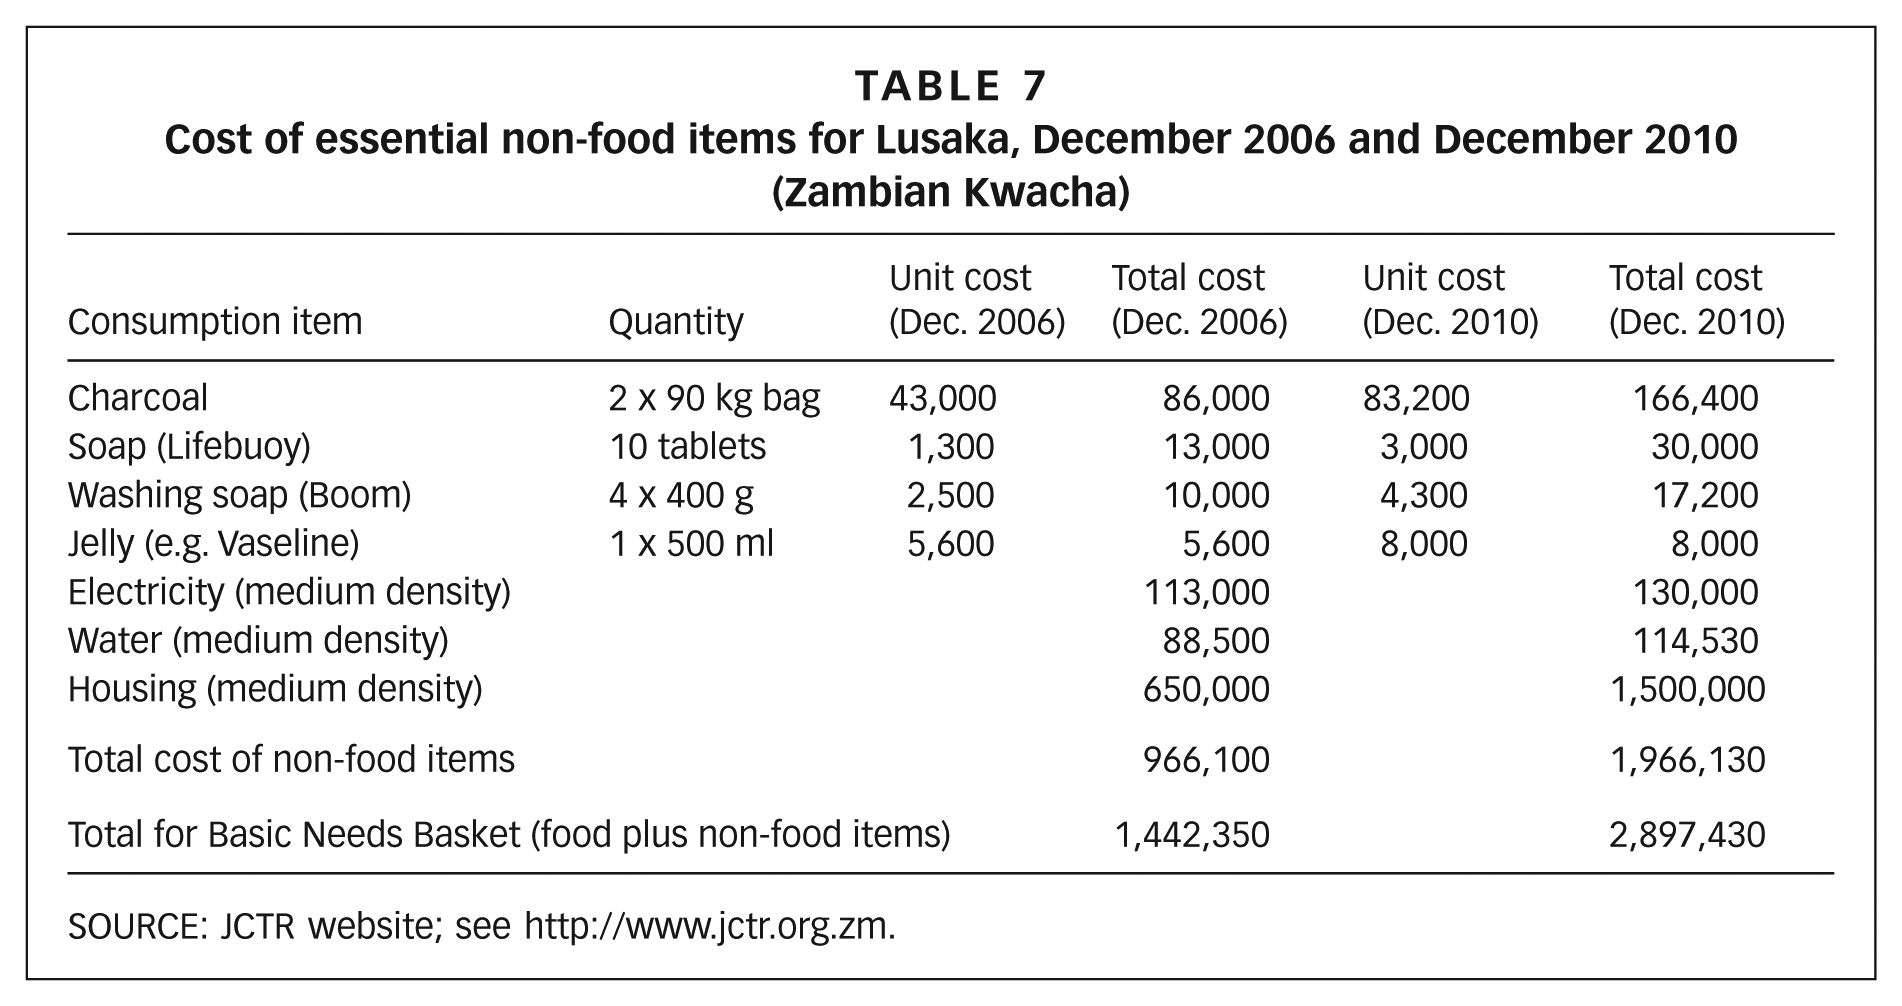
SOURCE: JCTR website; see http://www.jctr.org.zm.
Clearly, the JCTR’s BNB includes a higher cost for non-food items than for food items. As observed by the World Bank,(34) taking the JCTR cost of living as a poverty line would imply higher poverty rates than those presented by the CSO or the World Bank.(35) While the CSO set a poverty line of K365,468 in 2006, the JCTR’s assessment of the total cost of basic needs amounts to K1,442,350. However, as shown in Figure 3A, the cost of living is much higher in Lusaka than in other towns in Zambia, mostly because of the higher housing costs.
c. Examples of costs that are neglected in the CSO overall poverty line
Although the JCTR’s BNB includes higher costs than the CSO’s, even this does not give a total picture of the actual monthly cost of living as it excludes many other essential expenses such as transport. As the 2006 LCMS established,(36) clothing, transport, education and health made up 9.3 per cent, 6.8 per cent, 4.6 per cent and one per cent, respectively, of the total urban household expenditure.
The following sections provide details on just two essential non-food expenses (housing and water and sanitation), indicating how they influence the high cost of living in urban areas, with a specific focus on Lusaka.
i. Housing
Zambia is considered to be one of the most urbanized countries in sub-Saharan Africa, although 60 per cent of the population still lives in rural areas. Estimates are that 50–80 per cent of the urban population resides in informal settlements, where their lack of legal status and inadequate services provision make them extremely vulnerable. This vulnerability is made worse by insecure, low-wage employment. The vast majority of the urban poor work in the informal economy in a variety of activities, including petty trading and casual labour.
Anecdotal evidence from the JCTR’s satellite homes research suggests that many families in Lusaka, especially in high-density areas, are able to pay for only one, two or three rooms rather than rent a whole house (with separate bedrooms, kitchen and bathroom). The research further shows that most landlords in high-density areas sub-let rooms and most houses are shared by an average of three families.
Some critics have raised concerns about the cost of housing reflected in the JCTR’s BNB, arguing that the standards implied are unrealistically high for Zambia. Tipple(37) argues that the JCTR’s BNB rent element seems inappropriate, as it is unlikely that any household that is restricted to K800,000 a month for food (cost in May 2011) will live in a medium-cost dwelling. But it is worth looking at how the poverty line would change if it included the cost of “adequate” housing. The UN Global Shelter Strategy, to which Zambia is a signatory, defines “adequate housing” as encompassing adequate security, privacy, space, lighting and location with regard to work and basic facilities. The JCTR surveys the cost of a basic three-bedroom house located in a medium-density area. Three-bedroom units in high-density areas do not fulfil these requirements because they lack access to infrastructure – toilets are either non-existent or are poorly maintained pit latrines, and water is also lacking.
The 2010 JCTR data showed that the monthly cost of a three-bedroom house was K1,500,000 (US$ 315) in medium-density areas of Lusaka, K900,000 (US$ 189) in Livingstone, K850,000 (US$ 179) in Ndola, K700,000 (US$ 147) in Kitwe and K400,000 (US$ 84) in Luanshya. A two-bedroom house in a medium-density area in Lusaka costs on average US$ 189, although these properties are hard to find. Those in the low-income brackets are likely to live in high-density areas, with greater overcrowding.
According to the World Bank,(38) 90 per cent of Lusaka’s housing stock were squatter units, accommodating about 70 per cent of the city’s population on less than 20 per cent of its residential land. In the poor settlements, between 35 and 40 per cent of the residents own houses; the remainder are tenants.
The JCTR’s satellite homes research(39) found that the monthly housing cost for two rooms with electricity in January 2010 averaged K150,000 (US$ 31.50) in Kanyama Compound and K200,000 (US$ 42) in Garden Compound, both high-density areas of Lusaka. Some respondents from these areas revealed that due to limited space, arrangements were made with friends living in the same location to separate boys’ sleeping rooms from the girls’. As suggested by Mitlin and Satterthwaite,(40) setting allowances for housing costs within poverty lines based on what a particular set of low-income households spend on housing often means allocating only enough for low-income households to afford very low-quality, inadequate housing.
Therefore, while the rental cost for a three-bedroom house in Lusaka as suggested by the JCTR’s BNB is significantly higher than what most Zambian families are actually paying for housing, the three-bedroom house is the appropriate size to promote a decent standard of living for a family of six. This implies that a higher allowance should be allocated towards non-food costs if families in urban areas are to live a decent life. A similar argument is made for other non-food costs such as water and sanitation.
ii. Water and sanitation
Reducing the proportion of the population without sustainable access to safe drinking water and basic sanitation is one of the targets under MDG 7, which focuses on ensuring environmental sustainability.
Figures achieving these targets vary according to the source. WHO–UNICEF(41) reports that the percentage of the urban population in Zambia with access to improved sanitation actually fell between 1990 and 2008 (to 58 per cent), while the percentage with access to improved water fell from 89 to 87 per cent.(42) Zambian government figures are somewhat lower. According to the 2009 Zambia Demographic and Health Survey, while 82 per cent had access to an improved source of drinking water in the urban areas, only 40 per cent had piped water to their houses; 37 per cent accessed water from a public tap and six per cent from a protected dug well.(43) The 2010 LCMS found that about 62 per cent of households in Zambia had access to a safe water supply, while the remaining 38 per cent accessed water from unsafe sources.
Nevertheless, access to clean water is not cheap. Dagdeviren(44) estimates that low-cost water is unaffordable for about 40–60 per cent of urban dwellers in Lusaka and the Copperbelt, where most of the urban population lives. Most high-density areas have communal taps where households pay a service charge. In some areas, a charge is made for each 20-litre container filled; for instance, in one of the high-density areas visited to conduct further research for this paper, households paid K500 (US$ 0.11) per 20-litre container. Therefore, the price of 150 litres(45) per day was US$ 0.78. Many households complained that they could not buy enough safe water for use each day and hence supplemented it with unsafe water from shallow wells.
It is therefore not surprising that the World Bank’s Poverty and Vulnerability Assessment(46) established that residents of informal urban settlements in Zambia generally relied on self-made shallow wells for water supply and on pit latrines for the disposal of human waste. This is a serious health challenge because of possible water contamination, and most residents cannot afford to boil or to chlorinate their drinking water. Clearly, there has been inadequate investment in the water sector in Zambia.
Based on these findings, therefore, an adequate allowance for non-food costs such as housing and water should be made to ensure that the poverty line reflects better the income that households should have in order to afford a decent standard of living.
VII. Conclusions
This article critically questions the robustness of poverty measurements in urban Zambia. It largely draws upon data from the Central Statistics Office (CSO), the major statistical body in Zambia, and the Jesuit Centre for Theological Reflection (JCTR), a prominent local, non-state actor that conducts cost of living surveys in Lusaka and other towns across Zambia. The interrogation was conducted within the framework of defining poverty as a multi-dimensional phenomenon, which incorporates other welfare indicators such as shelter and water and sanitation. This article further interrogates the basic form and characteristics of the CSO’s extreme and overall poverty lines in relation to the JCTR’s cost of living findings. It also uses anecdotal evidence from select high-density (low-income) areas of Lusaka.
One major argument of this paper is that it is misleading to use the same bundle of food needs and the same approximated nominal cost of food in different areas without taking into account the actual costs of food and non-food items that are commodified in the different regions (rural and urban). Specific to the Zambian case, there is significant disparity between what makes up the food poverty line and the food budget share in rural and urban areas. Therefore, to base the poverty line on a national average for food costs underestimates urban poverty and is likely to overestimate rural poverty. Even for those areas that have similar baskets of food items and non-food goods, a further adjustment needs to be made for different price levels in the different settlements.
The official national food poverty line for 2006 was K275,751 for a household of six people. This represents the estimated expenditure level at which a typical Zambian reaches the pre-determined mean food energy requirement of 2,100 calories per person per day. For a slightly different bundle of food items, but also equivalent to 2,100 calories per person per day, for an average family of six in Lusaka, the cost of the JCTR’s BNB for 2006 was K476,250. In 2010, the CSO figure was K435,574 while that of the JCTR in Lusaka was K931,300. This paper found the JCTR BNB to be a better reflection of the budget shares that are typical of urban households. There is a strong case for differentiating between rural and urban poverty measurements by adjusting for cost of living differences and allowing price indices to differ by region over time.
Similarly, to obtain the upper poverty line that takes into account the non-food requirements of individuals/households, the CSO factors these in at 39 per cent and 34 per cent of the food poverty line in 2006 and 2010, respectively. Once factored in, the overall poverty line (reflecting food and non-food items) reaches K365,468 and K581,583 for 2006 and 2010, respectively. The JCTR’s data show that the cost of essential non-food items alone in Lusaka was K966,100 in 2006 and K1,966,130 in 2010, more than double the cost of basic food alone for each year. The main reason for the much higher cost of essential non-food items in Lusaka is the high cost of a decent house in a planned settlement area. However, this paper argues that the low non-food allowance used by the CSO is far too small for any urban area in Zambia, especially when taking into account the cost of adequate size housing.
It is important to note that the true cost of living is much higher than has been discussed in this paper, as urban households face significant costs for transport as well as for other household needs such as education and health. Undoubtedly, a better definition and a more precise method for measuring poverty in Zambia are called for in order to facilitate appropriate poverty reduction interventions.
Footnotes
Annex
JCTR Basic Needs Basket, Lusaka(December 2010)
1.
Chen, S and M Ravallion (2012), “An update to the World Bank’s estimates of consumption poverty in the developing world”, World Bank, Washington DC, 6 pages.
2.
There are two poverty lines in Zambia: “extreme” poverty is the inability of a household to meet basic nutritional requirements even if their consumption basket is defined to include food alone; “overall” poverty, on the other hand, is the inability of an individual/ household to meet non-food needs, while meeting basic minimum food requirements.
3.
Booth, C (1892), Life and Labour of the People of London, Macmillan, London, 256 pages; also Rowntree, B S (1901), Poverty – A Study of Town Life, London Macmillan, 437 pages.
4.
Wratten, E (1995), “Conceptualizing urban poverty”, Environment and Urbanization Vol 7, No 1, pages 11–38.
5.
Townsend, P (2006), “Chapter 1: Introduction”, Compendium of Best Practices in Poverty Measurement, Expert Group on Poverty Statistics, Economic Commission for Latin America and the Caribbean Group, Rio de Janeiro, pages 15–28.
6.
Ravallion, M (2008), “Poverty lines”, in L Blume and S Durlauf (editors), The New Palgrave Dictionary of Economics, second edition, Palgrave Macmillan, London, 7,344 pages.
7.
Chen, S and M Ravallion (2008), “The developing world is poorer than we thought, but no less successful in the fight against poverty”, Policy Research Working Paper No 4703, World Bank, Washington DC, page 10.
8.
See reference 4.
9.
Sen, A K (1999), Development as Freedom, Oxford University Press, Oxford, page 75.
10.
See reference 9, page 87.
11.
Mitlin, D and D Satterthwaite (2013), Urban Poverty in the Global South: Scale and Nature, Routledge, London and New York, page 25.
12.
Kanbur, R and L Squire (2001), “The evolution of thinking about poverty: exploring the interactions”, in G Meier and J Stiglitz, Frontiers of Development Economics: The Future in Perspective, Oxford University Press, Oxford, pages 183–226.
13.
See reference 4.
14.
15.
16.
Ndulo, M and D Mudenda (2004), “Trade policy reform and adjustment in Zambia”, 24 pages, accessed 14 January 2012 at
17.
Chibuye, M (2009), “Understanding seasonality implications on quality of life through the innovative JCTR rural basket: the case of select rural areas of Matushi, Saka and Malama of Zambia”, Seasonality Revisited International Conference, 8–10 July 2009, Institute of Development Studies, Brighton, UK.
18.
Satterthwaite, D (2004) “The underestimation of urban poverty in low- and middle-income nations”, Poverty Reduction in Urban Areas Series, Human Settlements Working Paper No 14, page 8.
19.
20.
21.
See reference 15, page i.
22.
Nsemukila, B (2001), “Poverty and food security indicators in Zambia: analysis of household survey data”, Workshop on Strengthening Food and Agricultural Statistics in Africa in Support of Food Security and Poverty Reduction Policies and Programmes, 22–26 November 2001, Pretoria, South Africa.
23.
Ravallion, M (1998), “Poverty lines in theory and practice”, Living Standards Measurement Study, Working Paper No 133, 53 pages.
24.
See reference 15.
25.
These shares have been calculated by the author using 2006 LCMS raw data. For presentation purposes, only the top 15 food items, on which urban households spent the largest food budget share, have been reflected in the table.
26.
Refined maize flour.
27.
See reference 23.
28.
Deaton, A (1997), The Analysis of Household Surveys: A Microeconometric Approach to Development Policy, Johns Hopkins University Press, Baltimore and London, page 283.
29.
See reference 28, page 143.
30.
![]() , Satellite Homes Report. First Quarter, Jesuit Centre for Theological Reflection (JCTR), Lusaka, 3 pages. Satellite homes research is monthly qualitative research conducted since 2005 in high-density areas of Lusaka, namely Matero, Chainda, Linda, Chipata Compound, Kanyama Compound and Garden Compound, and also includes interviews with different randomly selected respondents in the same areas.
, Satellite Homes Report. First Quarter, Jesuit Centre for Theological Reflection (JCTR), Lusaka, 3 pages. Satellite homes research is monthly qualitative research conducted since 2005 in high-density areas of Lusaka, namely Matero, Chainda, Linda, Chipata Compound, Kanyama Compound and Garden Compound, and also includes interviews with different randomly selected respondents in the same areas.
31.
See reference 23.
32.
See reference 15, page 180.
33.
See reference 15, page 159.
34.
35.
36.
See reference 19.
37.
Tipple, G (2012), Zambia Urban Housing Sector Profile, UN−Habitat, Kenya, 205 pages.
38.
39.
See reference 30.
40.
See reference 11, page 41.
42.
See reference 41, page 51.
44.
Dagdeviren, H (2008), “Waiting for miracles: the commercialization of urban water services in Zambia”, Development and Change Vol 39, No 1, pages 101–121.
45.
This volume is taken as an approximation for the minimum standard that a household needs each day; see reference 11, page 64.
46.
See reference 35.