
Abstract
This paper establishes a connection between reciprocal form and force diagrams and edge cable-supported membrane structures under isotropic stress. While various form-finding techniques exist for tensile membrane structures, reciprocal diagrams provide an intuitive graphical approach that is particularly effective during early design stages. The study introduces the foundational concepts of reciprocal diagrams, outlines their construction for membrane and cable elements, and explores their application to isotropically stressed membranes. The relationship between form and force diagrams is analyzed, highlighting the similarities between different graphical conventions. A method for three-dimensional form-finding is presented, starting with planar equilibrium informed by force densities and iteratively updating these densities to achieve isotropic stress. Several case studies are discussed, demonstrating the method’s capability to accurately calculate geometry and stress distributions compared to reference solutions. This work contributes to the field by offering a clear, visual approach to form-finding in membrane structures, combining graphical methods with computational techniques to simplify design and analysis processes.
Keywords
Introduction
From the pioneering work of Frei Otto to computational modeling methods, the topic of membrane form-finding has advanced significantly. Physical models, like those of Otto, are intuitive and effective but can lack efficiency and precision. 1 This is complemented by numerical methods, which are faster and more precise. However, one may quickly lose sight of the interplay between form and force, as it becomes buried in the formulation of finite elements or the abstract task of prescribing force densities, as noted by others.2,3 The authors are therefore motivated to refocus on the task of membrane form-finding, primarily through the use of reciprocal diagrams. In the field of graphic statics, Maxwell’s construction of 2D reciprocal diagrams 4 is a powerful tool for its clear presentation of form and force of an equilibrium system. The idea has been implemented in recent work in funicular vault structures, 5 tensile membrane under vertical loading, 6 and optimal trusses, 7 among many others. This paper focuses on the reciprocal diagram construction of tensile membranes subjected to isotropic stress. Typical features such as edge cables and ridge/valley cables (further referred to as ridge cables for simplicity) are addressed within the same form and force diagrams. The thereby informed force densities are used to linearly solve equilibrium shapes in an iterative manner, for the convergence to prescribed isotropic stress.
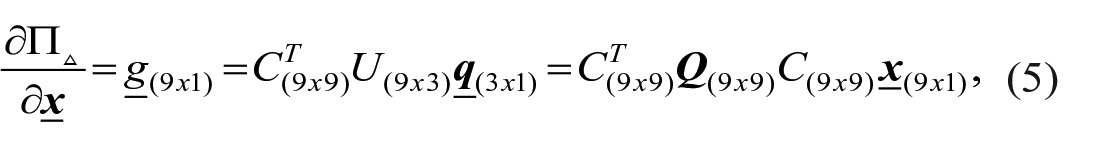
The current paper is organized as follows. The first part reviews the basic concepts of reciprocal diagrams, 8 Frei Otto’s edge cable technique, 9 and the Force Density Method (FDM) developed by Linkwitz et al. 10 and Schek. 11 Relevant membrane form-finding methods are also briefly discussed. The second part extends Otto’s technique to include ridge cables. By lumping membrane element stress at nodes, membrane patches are represented as 1D elements, making a complete construction of planar reciprocal diagrams, that is, finding 2D equilibrium, feasible.
The third and final part of the paper addresses the determination of 3D equilibrium. Two scenarios are differentiated: vertical lifting, which preserves horizontal equilibrium, and an iterative procedure to achieve isotropic stress or minimal surfaces. Several case studies are conducted and compared with analytical or finite-element results, demonstrating good geometrical agreement and convergence to isotropic stress in membrane patches.
In the form and force diagrams, blue is used for compression and red for tension edges. Green indicates boundary conditions such as anchoring forces or constraints. Black lines are used for construction purposes unless otherwise specified.
Reciprocal diagrams
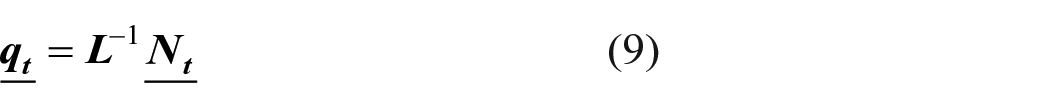
The application of reciprocal figures in graphic statics is a powerful tool for the clear presentation of form and force in equilibrium. The 2D form and force diagrams share the same number of edges and can be constructed at any chosen angle. 8 Commonly used constructions include the parallel (Cremona convention) and orthogonal (Maxwell convention) methods. This paper adopts the latter, as it preserves the relative positions of corresponding edges, enabling an intuitive interpretation of the diagrams (Figure 1).
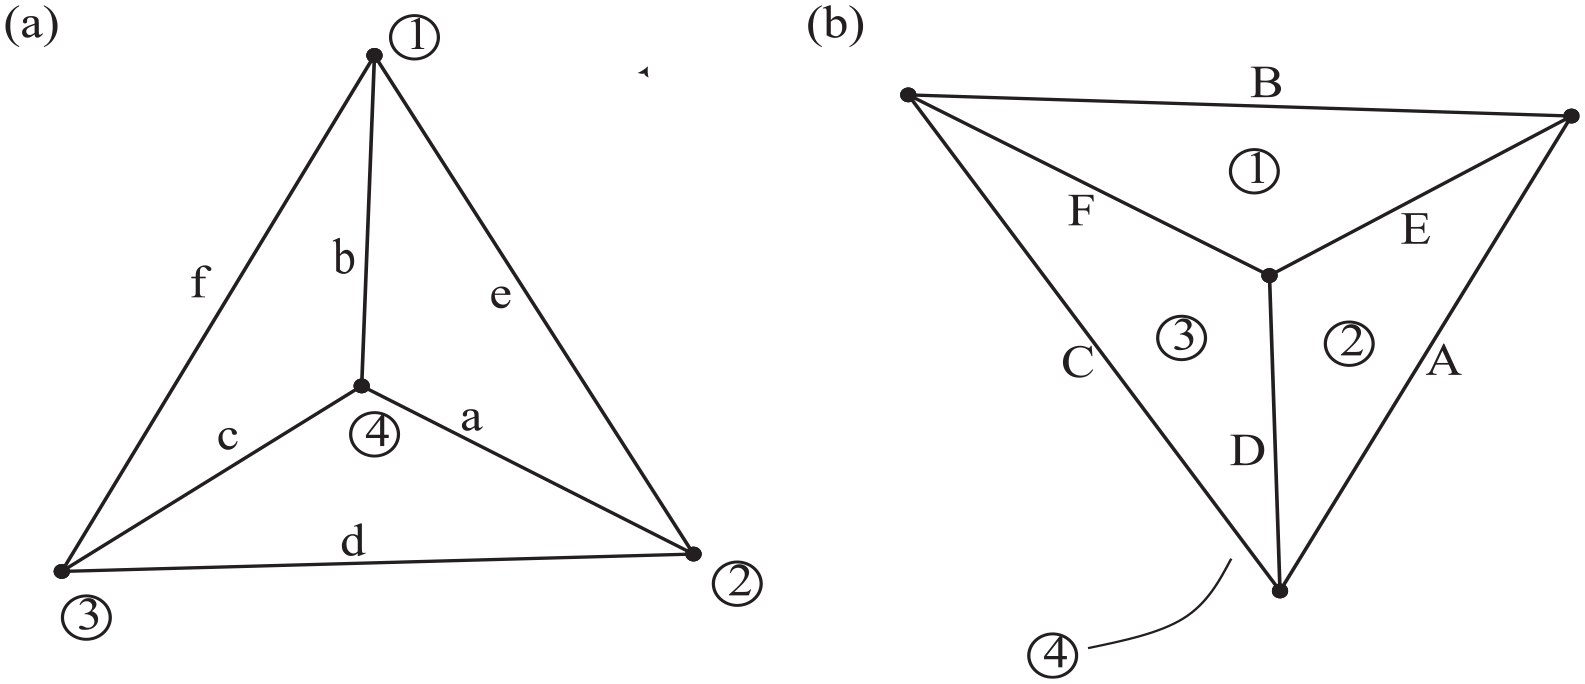
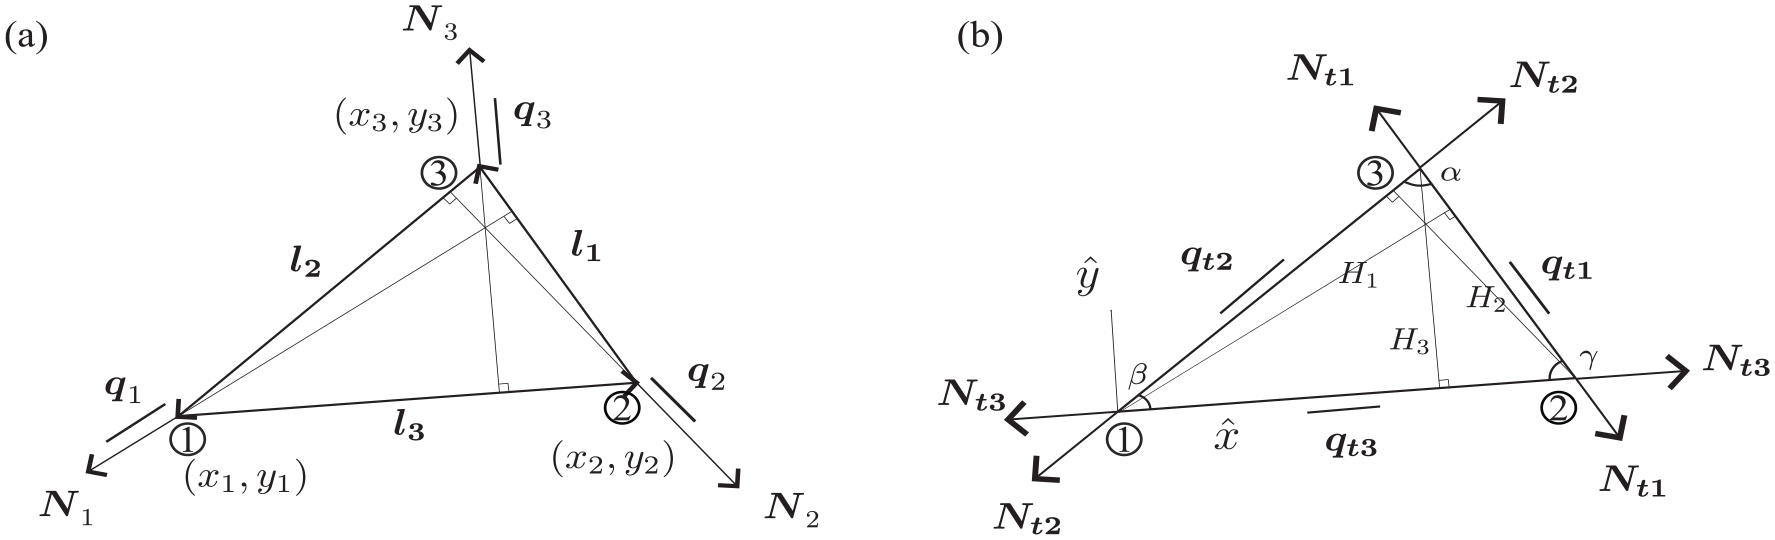
Reciprocal diagrams of a self-stressed truss following Maxwell convention: (a) form diagram and (b) force diagram contain pairs of edges that are reciprocal to each other. The close polygons found in force diagram denote equilibrium in corresponding nodes in form diagram, for example, force edges E, D, and A in triangle ② in (b) denote equilibrium of node ② connected by form edges e, d, and a in (a).
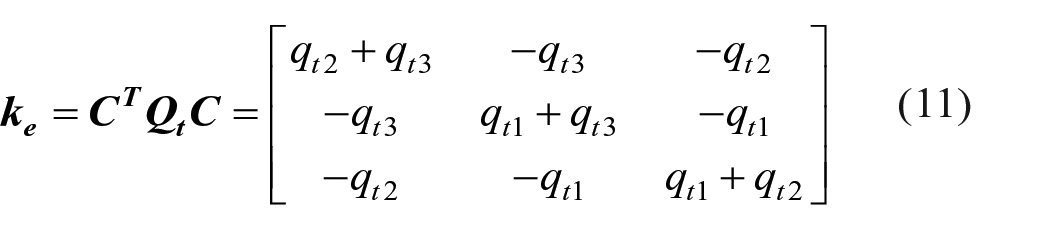
Membrane edges of a planar isotropic stress field
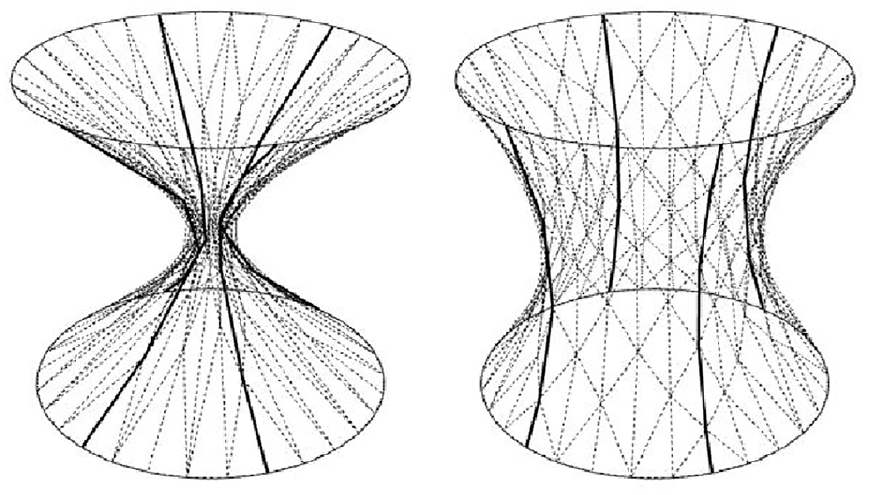
Considering a planar membrane with isotropic stresses, meaning identical principal stresses without shear, the bending-free edges, materialized as edge cables, exhibit arc profiles. Such a planar stress field is also referred to as hydrostatic, similar to a soap film. 12 This analogy originates from Frei Otto’s research on retractable membrane roofs, 9 which inspired the authors to explore the correlation with reciprocal diagrams (see Isotropic Stressed Membrane Patches Section).
In the case of anisotropic stress, where one dominant direction is perpendicular to the span of an edge, the cable profile instead follows a parabolic shape. The difference between the arc and parabola profiles diminishes as the sag-to-span ratio
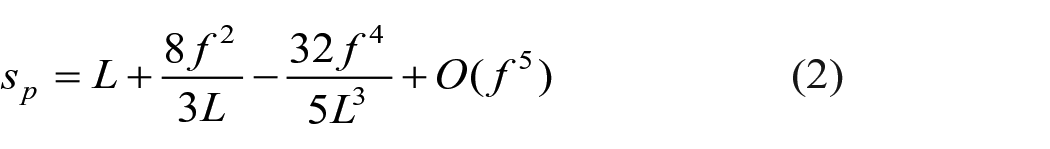
In this paper, we primarily focus on form-finding for isotropic stress fields, which are spanned by arc-profiled edge cables. Unlike planar equilibrium, the form and force of edge cables in 3D are non-trivial and, to the authors’ knowledge, were not addressed in Frei Otto’s planar constructions (Figure 2).
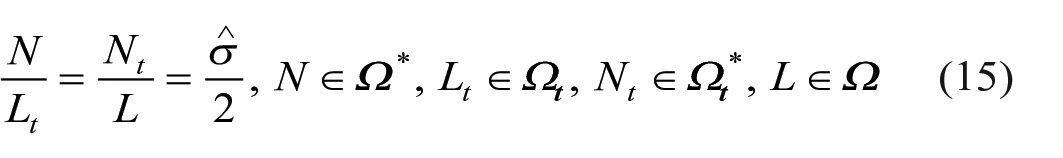
Edge representations by arc and parabola: (a) geometries of different rises (sag to span ratio of 10%, 20%, and 30%) and (b) isotropic versus directional membrane stress conditions. Black dot represents the center and focal point respectively.
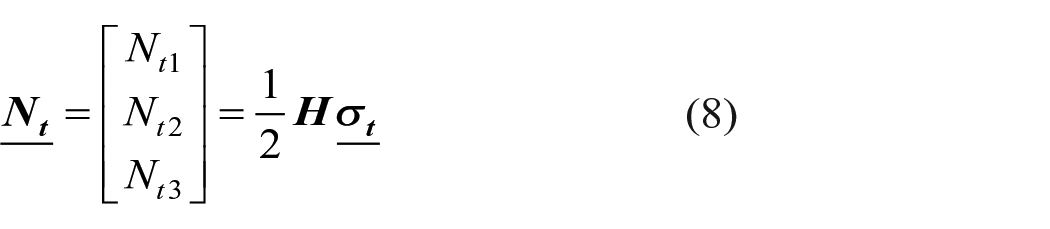
Force density method
The force density method (FDM) is a form-finding technique initially developed for cable net structures, such as the Olympic Stadium roof in Munich. 11 The form, that is, the 3D coordinates of free nodes, can be determined linearly based solely on equilibrium conditions, given the anchor point positions, external loads, and force densities in the net. In the absence of external loads, for example, for an unloaded prestressed net with m branches and n nodes, the linear equation of FDM is expressed as:
with
Geometrically, Schek 11 pointed out two theorems: a net of minimum lengths sum is one of constant forces (Theorem 1) and a net of minimum lengths square sum is one of constant force densities (Theorem 2).
For computational implementation or more specifically when considering boundary fixations, it was found convenient to not eliminate rows or columns of matrix
Review of relevant membrane form-finding methods
Numerical methods for membrane form-finding have been advanced remarkably by the work of Singer, 14 Maurin and Motro, 15 Pauletti,3,16 and Bletzinger and Ramm 17 among others.
Singer’s and Pauletti’s force density method for membrane
Both Singer 14 and Pauletti 16 extended the concept of force density for membrane structures.
Singer
14
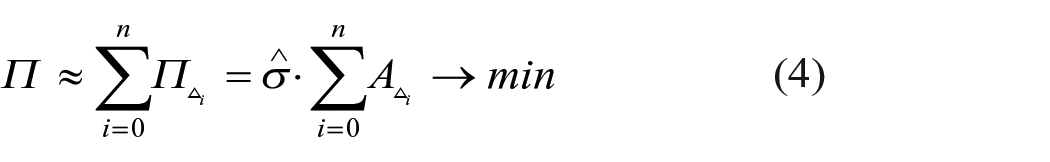
took the minimal surface as a starting point: minimizing surface area
The linear part derived from equation (4) is identical to FDM formulation. For one triangular element:
The term
Lumping of element stress on nodes as: (a) Singer’s nodal forces and nodal force densities, or along edges as (b) Pauletti’s natural forces and natural force densities, noticing local
Pauletti
16
used the concept of natural force
Scaling natural stress
Scaling natural force by edge length inverse
Finally, assembly of the element stiffness matrix with standard force density procedure gives:
The same transformation yielding natural force density was in fact also given by Singer 14 with different angle definition (but same as Argyris et al. 18 ).
Bletzinger’s updated reference strategy
Bletzinger and Ramm
17
developed the method of updated reference strategy (URS) on the basis of differential geometry and continuum mechanics. URS modifies the stationary condition by homotopy mapping. That is, rewriting stationary condition as combination of Cauchy
When

Planar reciprocal diagrams for membrane structures
Despite the advancements in numerical methods, the process of finding the equilibrium of tensile membranes remains somewhat opaque, particularly when cable elements are involved. Unlike forces or geometry, force densities are more challenging to interpret physically. Therefore, we seek approaches that are potentially more intuitive, focusing on reciprocal diagrams. The construction of three types of building elements edge cables, ridge cables, and membrane patches under isotropic stress is presented.
Isotropic stressed membrane patches
Singer
14
provided a proof that the nodal forces in a triangular element of isotropic stress
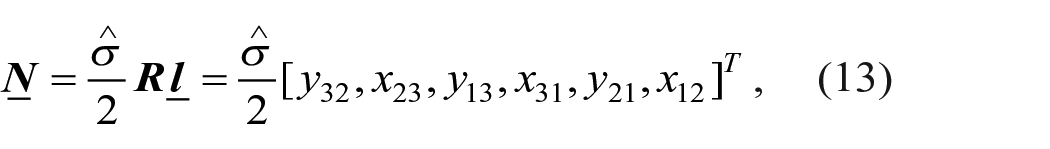
(a) Nodal force of an isotropic stressed triangle and (b) when
The same can be reached using the equilibrium matrix

with kinematic matrix
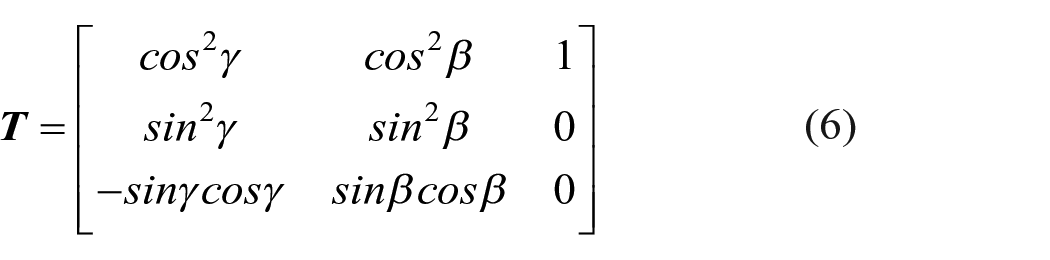
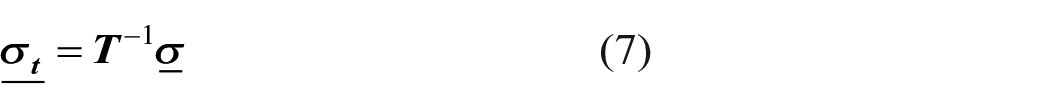
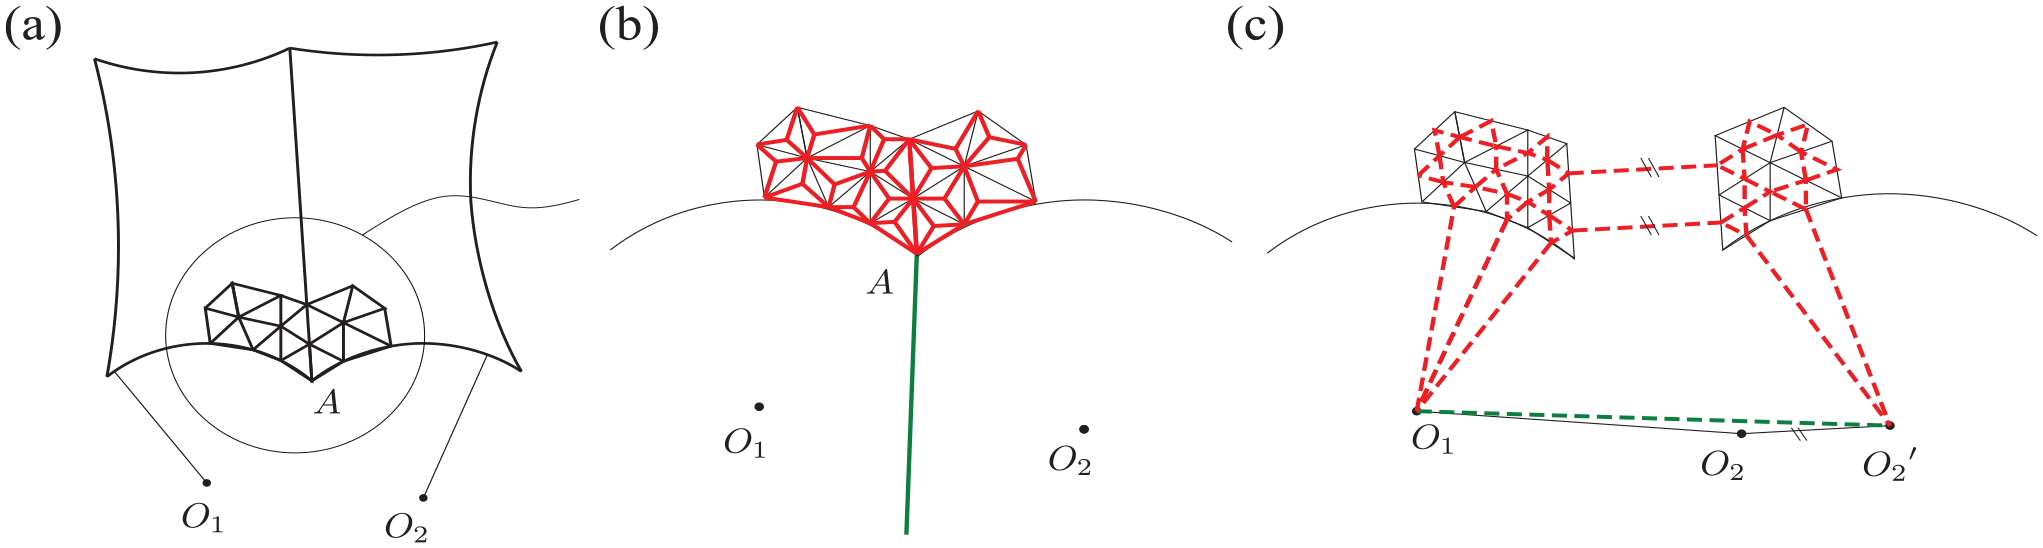
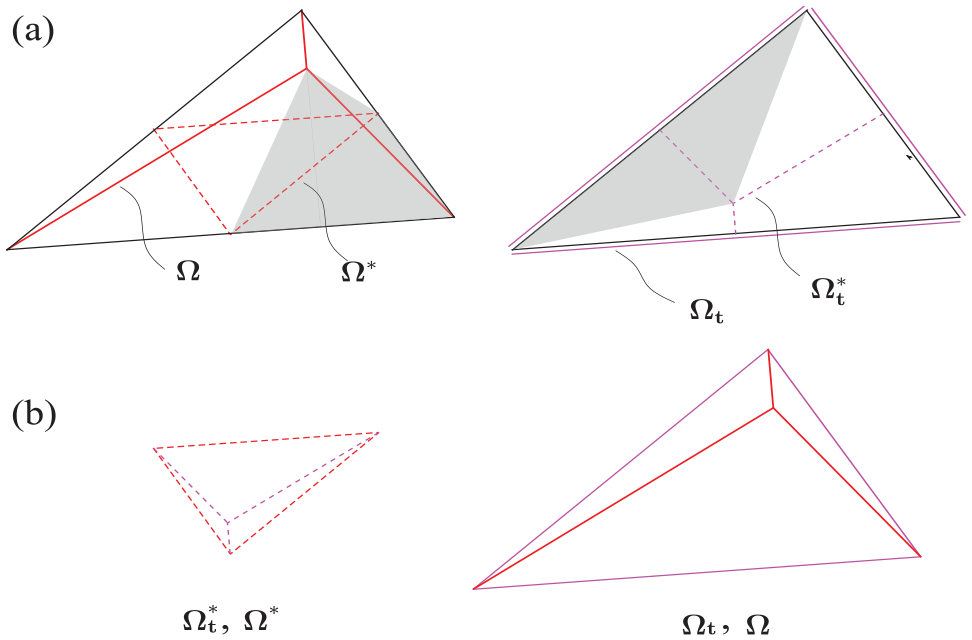
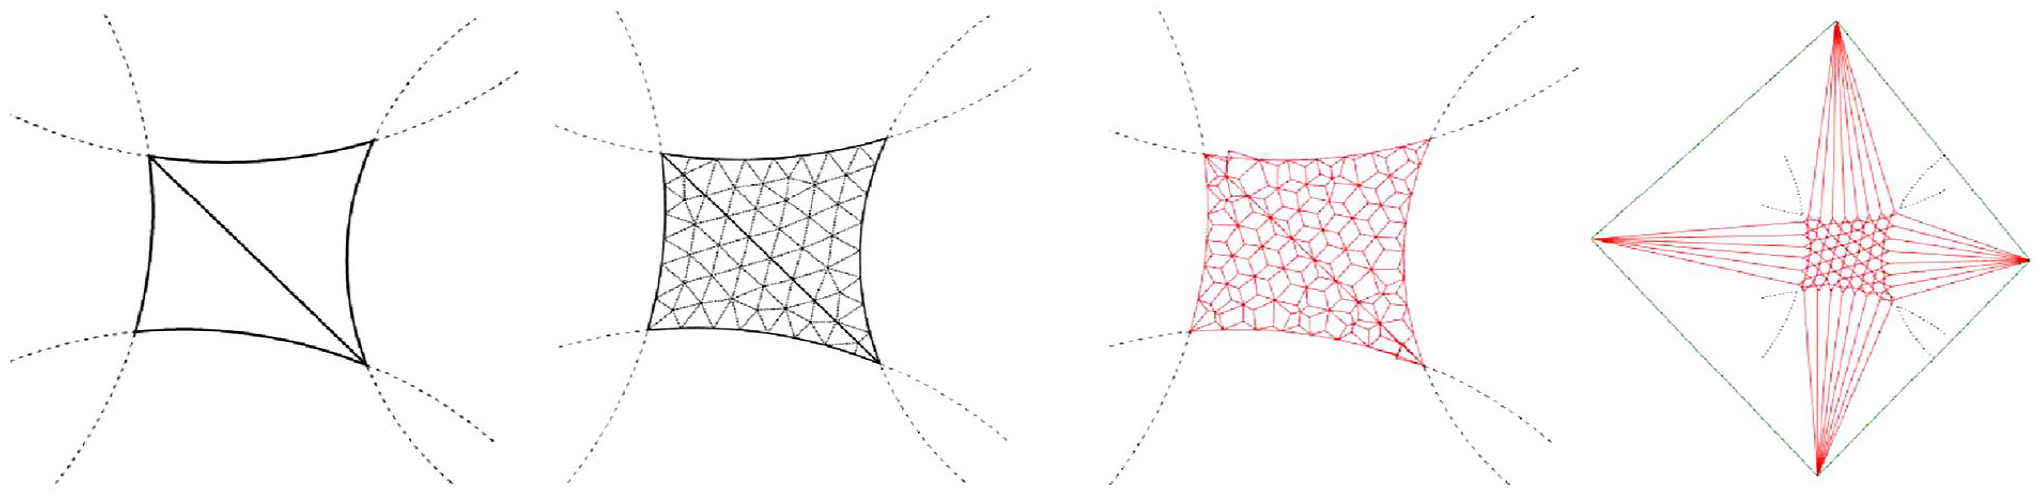
Inspired by this notion, reciprocal construction can be done as shown in Figure 4: when isotropic stress is unity, the force diagram of this triangular face is simply its medial triangle and the corresponding form diagram is obtained by connecting the orthocenter of this face to its three vertices. The isotropic stress is effectively lumped onto three 1D elements which belong to a primal diagram
It is worth noting that the above construction results in three tension edges due to the acute angles. An obtuse angle corresponds to a compression edge, with the orthocenter positioned outside the triangle. In the special case of a right triangle, only two meaningful tension edges are present, as the third edge vanishes and is not included in the branch-node matrix. However, this scenario is rarely encountered in practical implementations (Figure 5).
(a) In an orthogonal triangle, only two meaningful form edges arise and (b) in an obtuse triangular where the orthocenter sites outside, the form edge through the obtuse vertex corresponds to a compression force.
Edge cables and the anchoring force polygon
In the following we consider a membrane corner anchoring two edge cables, as shown in Figure 6. As discussed, when the stress field is isotropic, the edges follow arc profiles. The well-known formula for hydrostatic pressure,
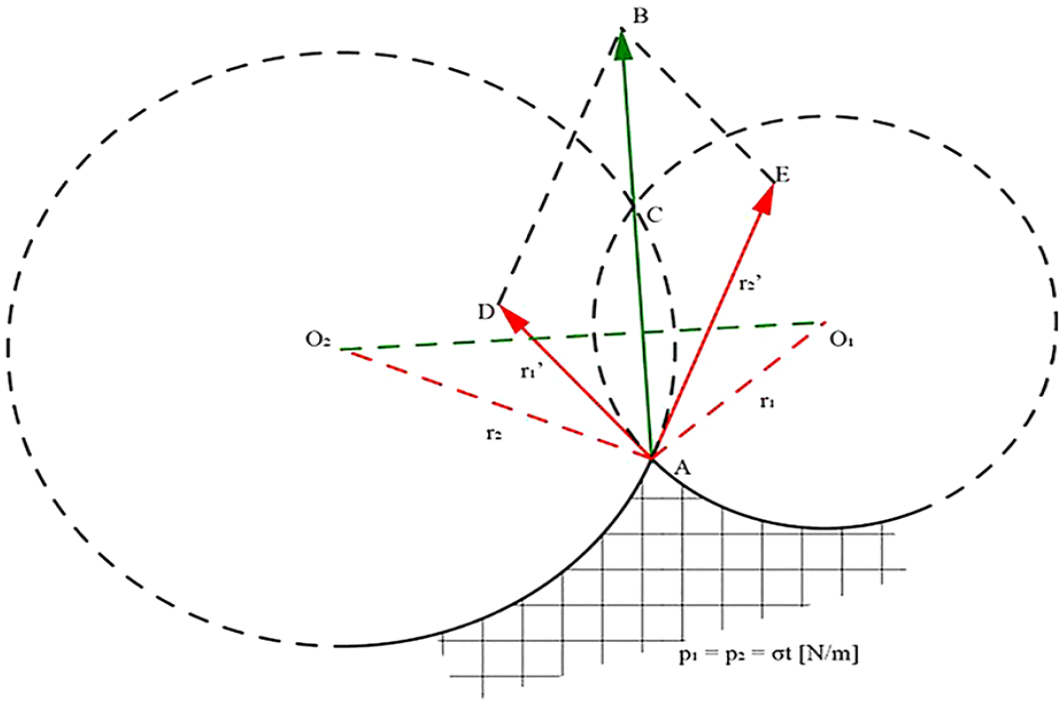
Graphical solution of anchoring force of two edge cables of arc profiles at an anchor point A, with an isotropic stress field of unity.
It is important to note that the form edge
Using this approach, an anchoring force polygon (green dashed lines) can be constructed by simply connecting the centers of a series of edge cables spanning an isotropic stress field of unity. The amplitude and direction of the planar anchoring forces at these anchor points are determined graphically. This means that, given specific design boundaries—such as architectural requirements (e.g. the position of anchor points) or mechanical constraints (e.g. allowable anchoring forces) one can adjust the positions and/or radii of the arc profiles to achieve initial alignment in the plan. Figure 7 demonstrates such applications, with anchoring force amplitudes at all five anchors confined to (b) 50 kN and (c) 30 kN, respectively, by varying edge cable radii while keeping the anchor positions unchanged.
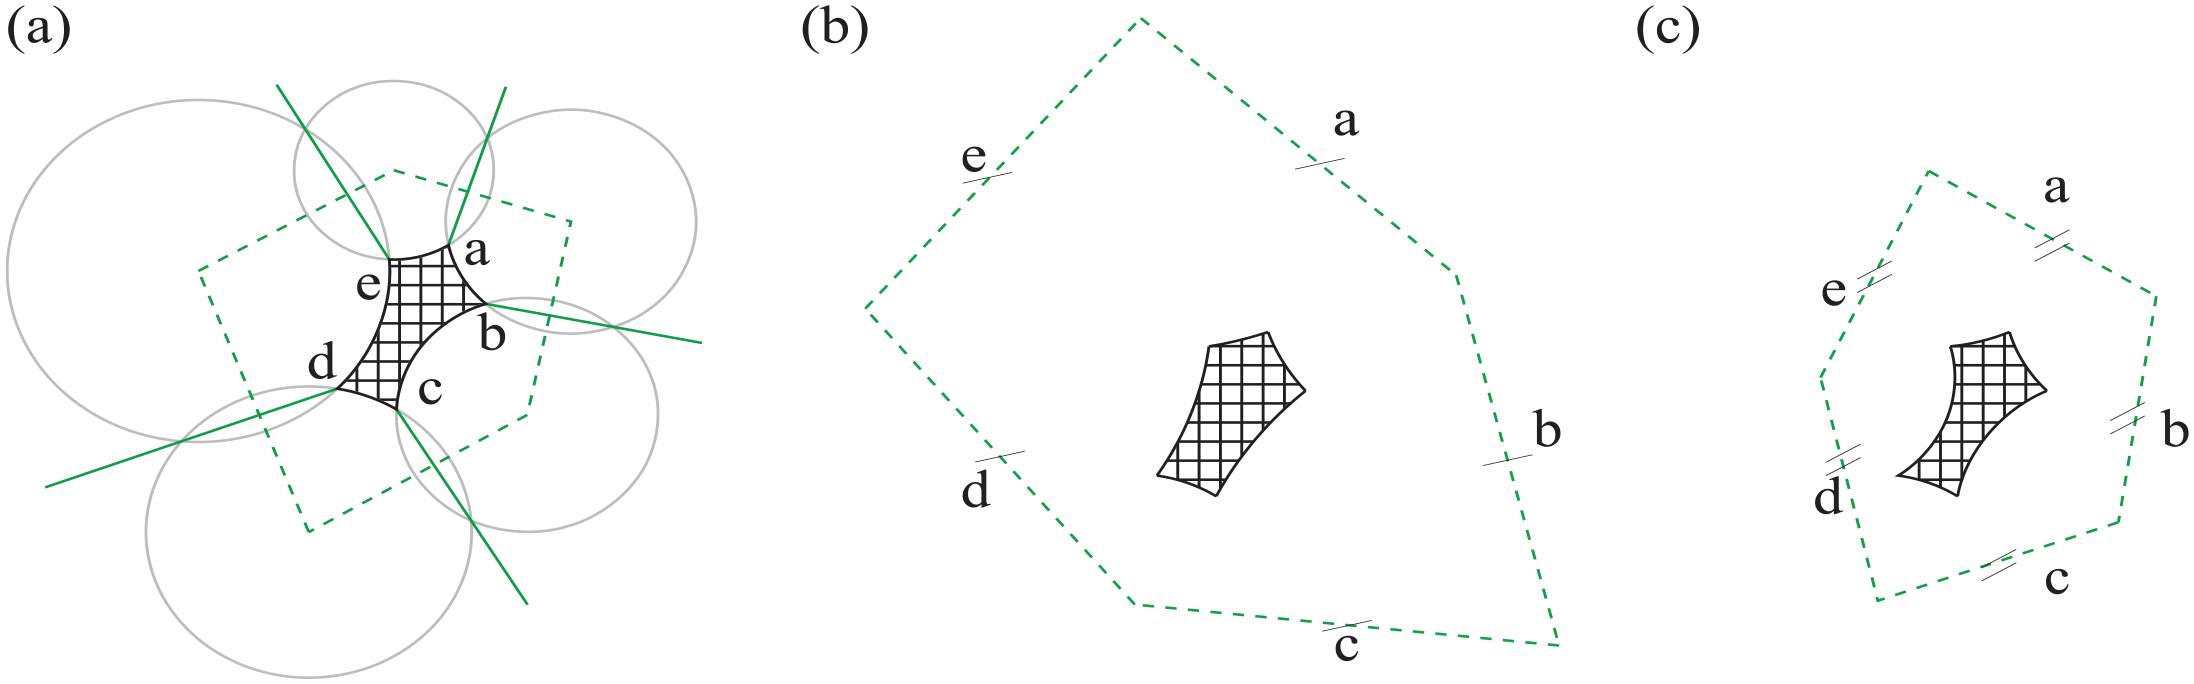
(a) Anchoring force polygon (green dashed) of a planar isotropic stress field of unity spanned by edge cables of arc profiles. Keeping anchor positions unchanged and optimizing edge cable radii for certain anchoring forces, (b) 50 kN, and (c) 30 kN, ±1%.
Ridge cables
In addition to the two edge cables at an anchor point, as discussed in the previous case, a ridge cable is often introduced. This is a cable spanning within a membrane patch that can be used to adjust the membrane shape pulling it upward in the case of a valley cable or downward as a ridge thereby enriching the design possibilities for membrane structures.
The construction of reciprocal diagrams for ridge cables is achieved by “shifting” the diagrams apart. This shift physically corresponds to the fact that the additional forces in the ridge cables must be anchored separately from those of the edge cables. The equilibrium is now represented by a quadrilateral force polygon, as shown in Figure 8(b), instead of the force triangle in Figure 8(a). It is important to note that the added ridge cable does not have to be collinear with the existing anchoring cable. In other words, the addition of a ridge cable may change the direction of the previous anchoring force.
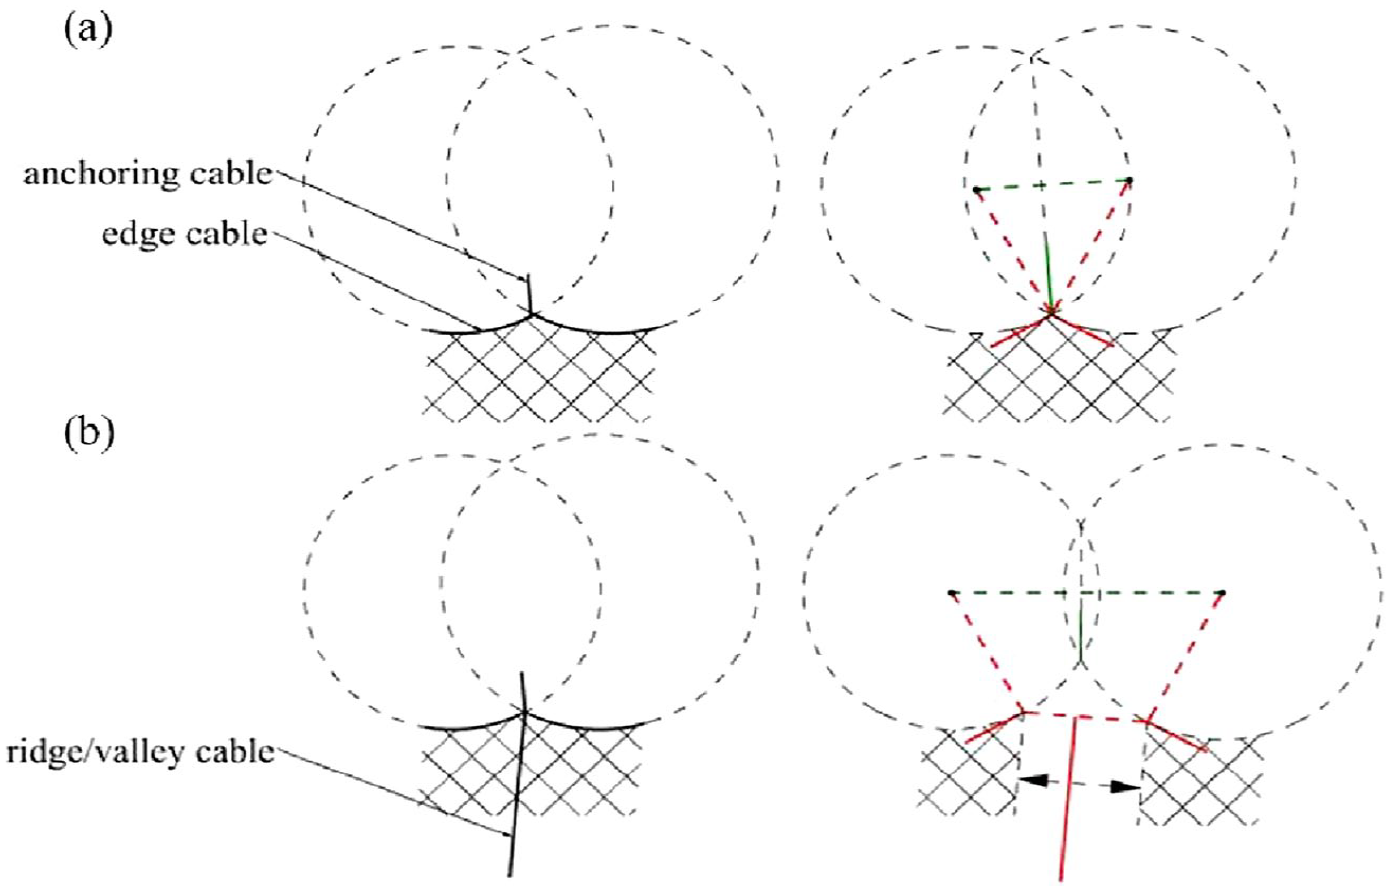
Reciprocal construction of a ridge cable in addition to two edge cables at one anchor point: (a) without ridge cable and (b) with ridge cable.
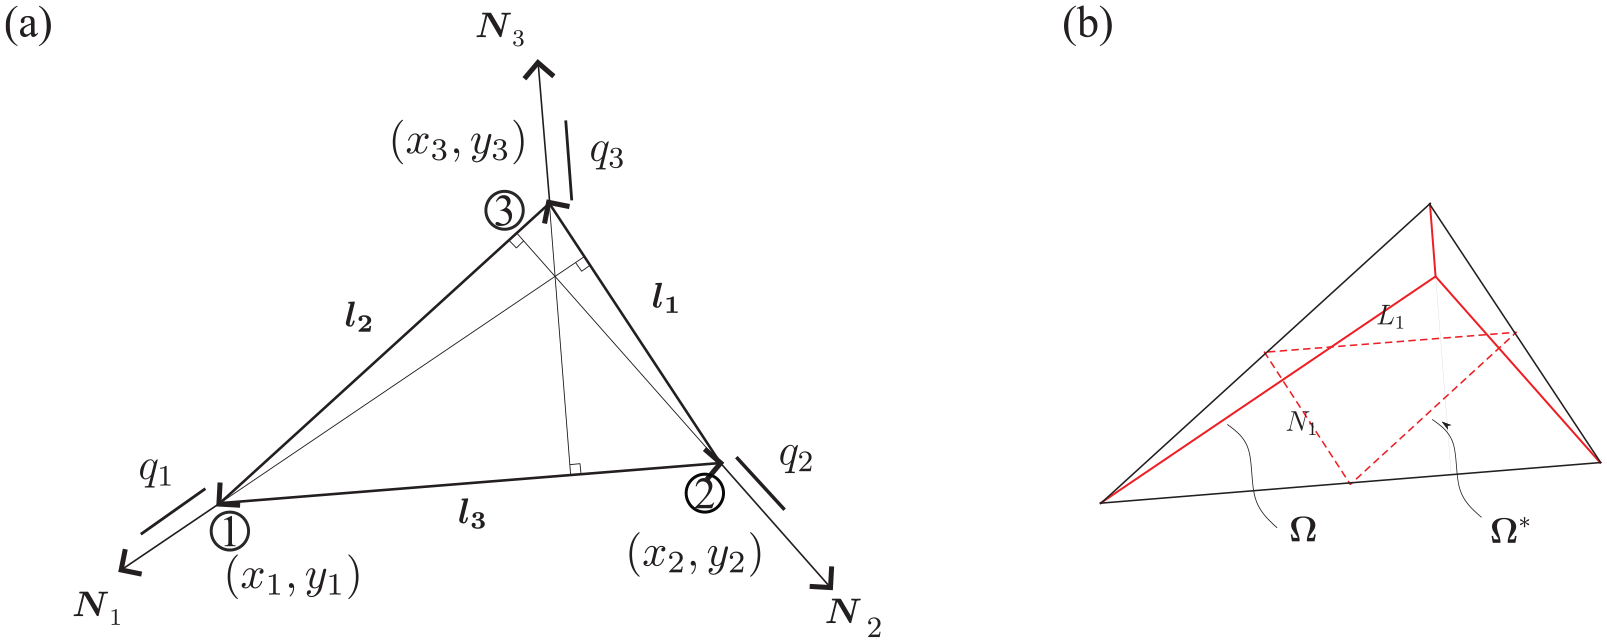
Compatibility of features
Until now the construction for three components, namely edge cables, ridge cables, and membrane patches are described. Their form and force edges do not overlap and can be constructed in one diagram given a discretization which embeds the cable elements. Maxwell’s drawing convention allows a clear reading of diagrams for the adjacency of edge pairs.
The form edges of cable elements sit always on the tri-mesh edges (since they are embedded), whilst the form edges for membrane patch sit always off the tri-mesh edges. This simplifies computational implementation of the method since no special topological or geometrical manipulation on a tri-mesh discretization is needed.
Regarding the force diagram, the compatibility (denoting equilibrium) is naturally given during the construction of close force polygons. For edge cables, their force edges share a “pole” that is, the center of their arc profiles (before discretization). For patches, the median triangles denote the internal equilibrium of the corresponding tri-mesh faces. For ridge cables, the choosing of pretension forces are subjected to the designer, given the summation of these additional forces do not violate condition of equilibrium.
The “shifting” effect in the force diagram caused by the ridge cables is in a similar fashion as that of creases in a funicular vault as described by Rippmann.
20
New form and force edges are introduced in the diagrams, Figure 9. The “shifting” amplitude correlates to the pretension in the introduced ridge cable. Force edge
Compatibility of membrane features in the reciprocal diagram construction: colored solid lines for form edges and colored dashed lines for force edges. Introducing ridge cables shifts the force diagram apart. (a) Discretization of a anchoring corner, (b) form diagram and (c) force diagram.
Reciprocal diagram drawing following natural forces style
Revisiting the idea from Argyris, Singer, and Pauletti, another style of drawing reciprocals was found recently. 21 Some additional notes are appended herein.
The above discussed drawing of
(a) Two styles of drawing: nodal force (left) and natural force (right) and (b) parallel redrawing of forces diagrams (left) and form diagrams (right). One’s form diagram is similar to the other’s force diagram:
Two observations were made. First, the two styles share similarity: One’s form diagram is similar to the other’s force diagram namely,
A 3D form-finding and comparison of results
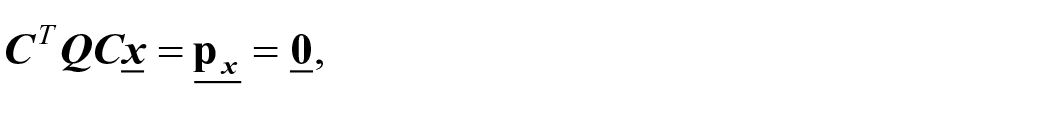
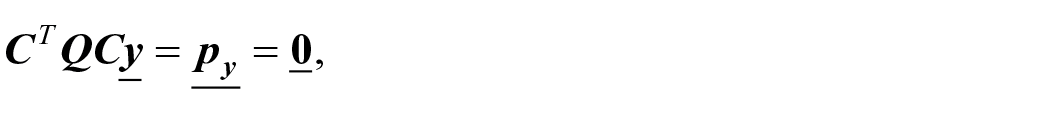
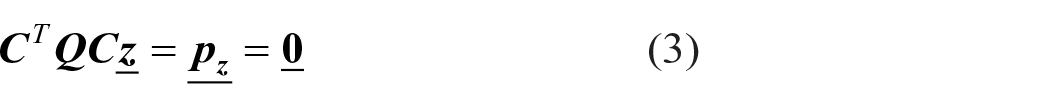
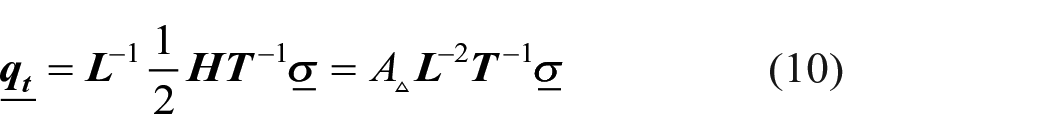
The planar equilibrium described by the constructed form and force diagrams defines a set of force densities for the given network of 1D elements, which is statically equivalent to a planar isotropic stress field. When non-zero Z-coordinates are assigned to anchor points, the Force Density Method (FDM) computes the coordinates of the network in 3D equilibrium, as shown in equation (3).
Two approaches are differentiated here: first, solving only the Z-coordinates (since the XY-planar equilibrium has already been established), and second, allowing for XY-displacements in subsequent iterations. The first approach preserves the prescribed horizontal equilibrium, while the second aims to achieve convergence to isotropic stress.
By solving only
Form-finding with only vertical displacement is a practically meaningful approach, as it preserves the planar equilibrium when projected back. This is particularly useful in cases where the force direction in the initial plane is of primary importance, and achieving isotropic stress is less critical.
The procedure described above, illustrated schematically in Figure 11, was implemented in Python within Rhino3D® 7. Matrix operations were handled using NumPy 1.24.2. 22 via the “remote procedure call” mechanism provided by the COMPAS framework 1.17.5. 23 Reference geometries were obtained using Kiwi3D!. 24
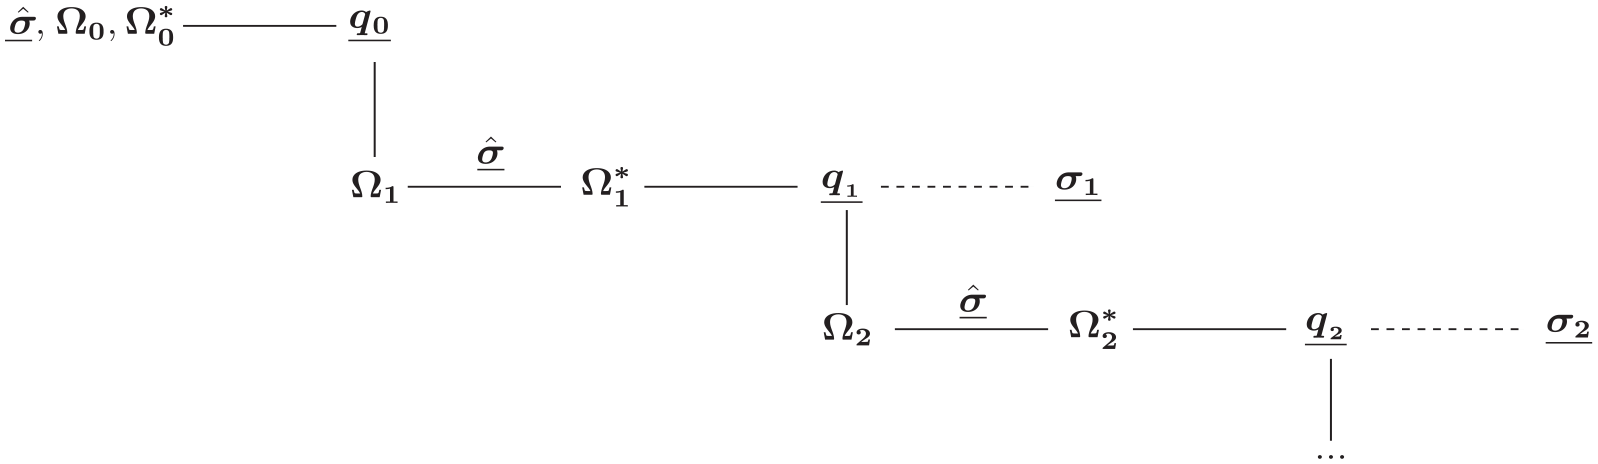
Schematic flowchart of computational implementation. Each row is one iteration. Imposing the isotropic stress
Catenoid
The catenoid is a minimal surface formed by the revolution of a catenary and can be analytically defined in cylindrical coordinates as
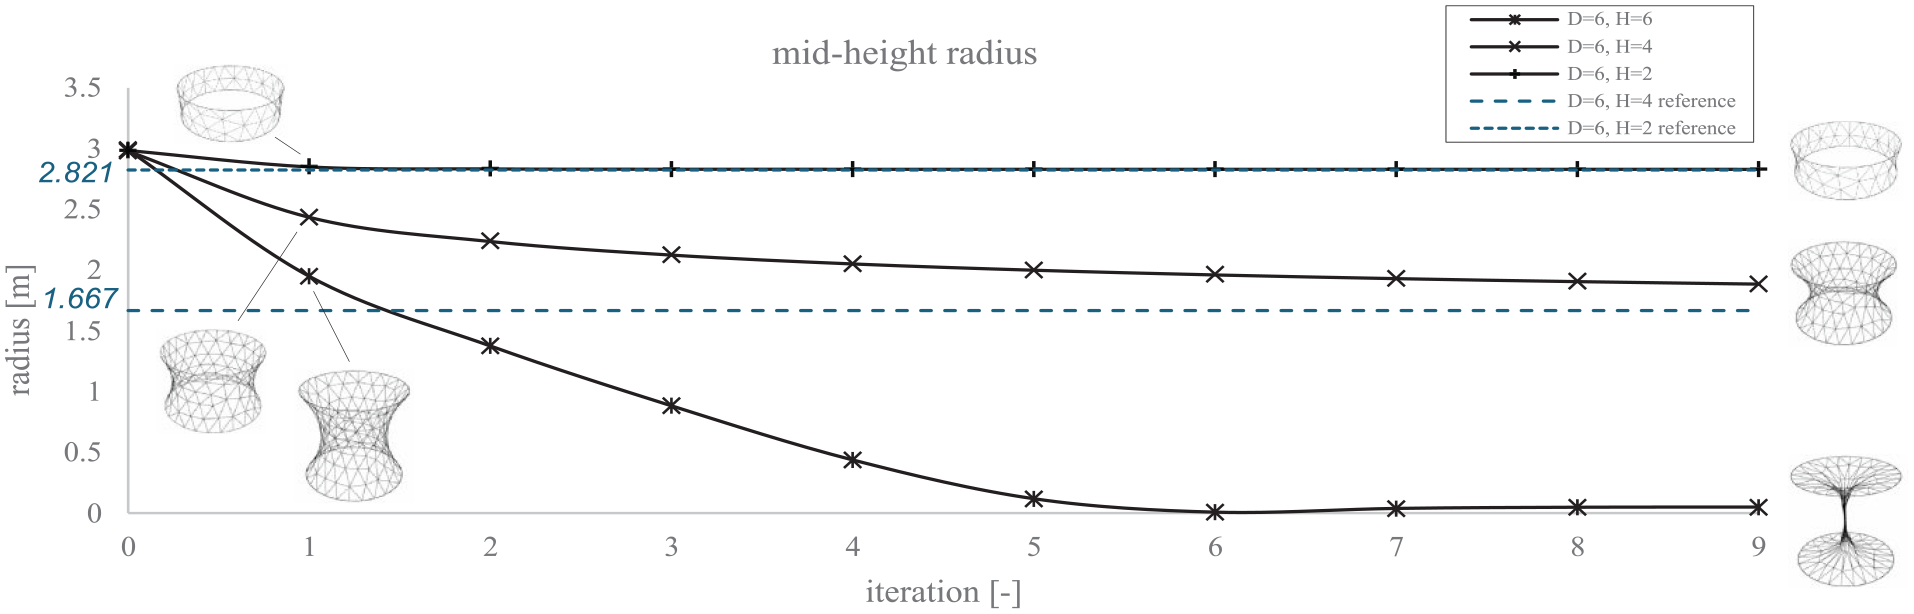
Mid-height radii converging to reference values (blue dash lines) with three geometry setups.
(a) Form edges and (b) force edges of catenoid “D6H4,” iteration no. 5.
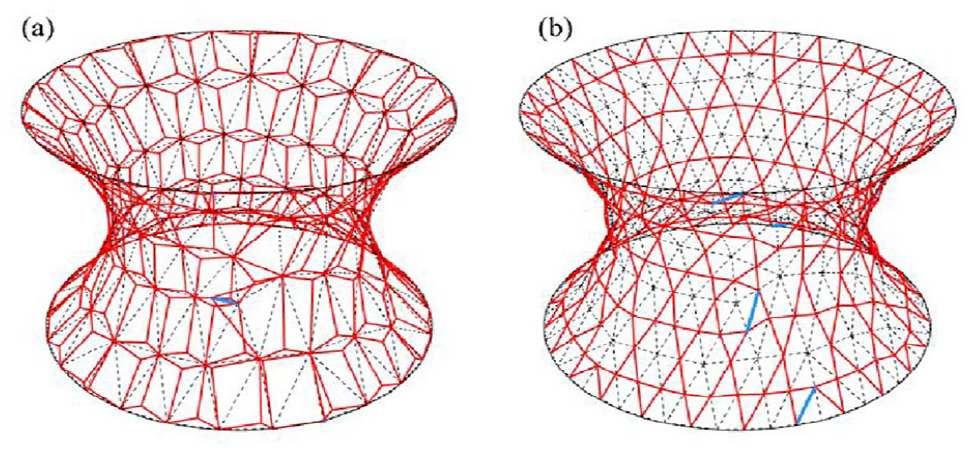
It is well known that minimal surfaces cannot be achieved for all boundary conditions, such as when the rings are too far apart. In engineering practice, ridge or valley lines can be used to address this issue. 25 The following case implements four ridge lines with a prestress of 5 kN on the “D6H6” boundaries (ring diameter of 6 m and a distance of 6 m between the rings). The membrane prestress is an isotropic stress of 1 kN/m (Figure 14).
Applying ridge cables on “D6H6” catenoid. Cable force of null resulting in a collapsing minimal surface (left) and 5 kN prestress geometry (right).
A 4-point sail
The following example of a 4-point sail is designed to further demonstrate the construction of planar reciprocal diagrams (Figure 15), with a ridge line implemented. The results are compared with the Kiwi!3D program. 26 The sail features a grid of approximately 9 m. The “shifting” of the force diagram is resulted from assigning an 8 kN prestress to the ridge cable (Figure 16).
Left to right: Prescription of edges cables (arcs) and a ridge cable (line); tri-mesh discretization; construction of form diagram and force diagram (zero prestress assigned to ridge cable).
Assigning 8 kN prestress in ridge cable shifts the planar force diagram apart.
Compared with the reference geometry, we observed a decreasing difference in height, from 26 mm to 13 mm, 6 mm, and finally 5 mm (maximum value of all nodes) across the 1st to 4th iterations, respectively (Figure 17(a)). Notably, the first iteration, involving a lift from the XY-plane with only Z displacement, produced reasonably good results. This can be attributed to the initial planar equilibrium. From the second iteration onward, XY displacements were also solved, and noticeable XY displacements were observed at the “shrinking” cable boundaries. This occurs because the prescribed cable forces, defined in planar equilibrium, become insufficient in maintaining their XY positions when lifted; thus, more curvature is required.
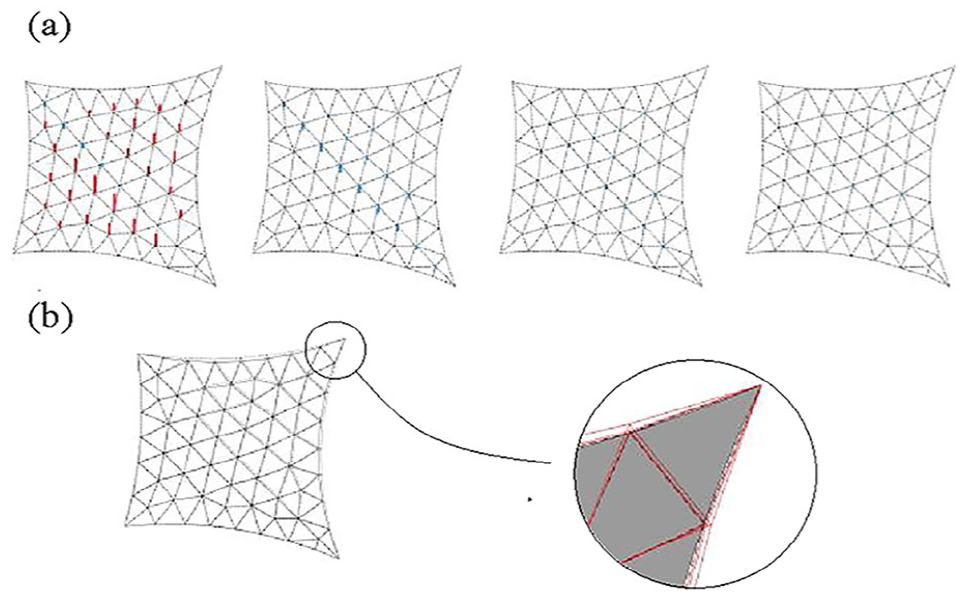
(a) Maximum height differences between calculated and reference geometries, first to fourth iterations. Red and blue lines indicate that reference geometry is lower or higher respectively. (b) In-plane (XY) geometries of edge cables converge toward reference geometry.
Element stress is recovered using equation (10), as plotted in Figure 18. We see the convergence of normal stress
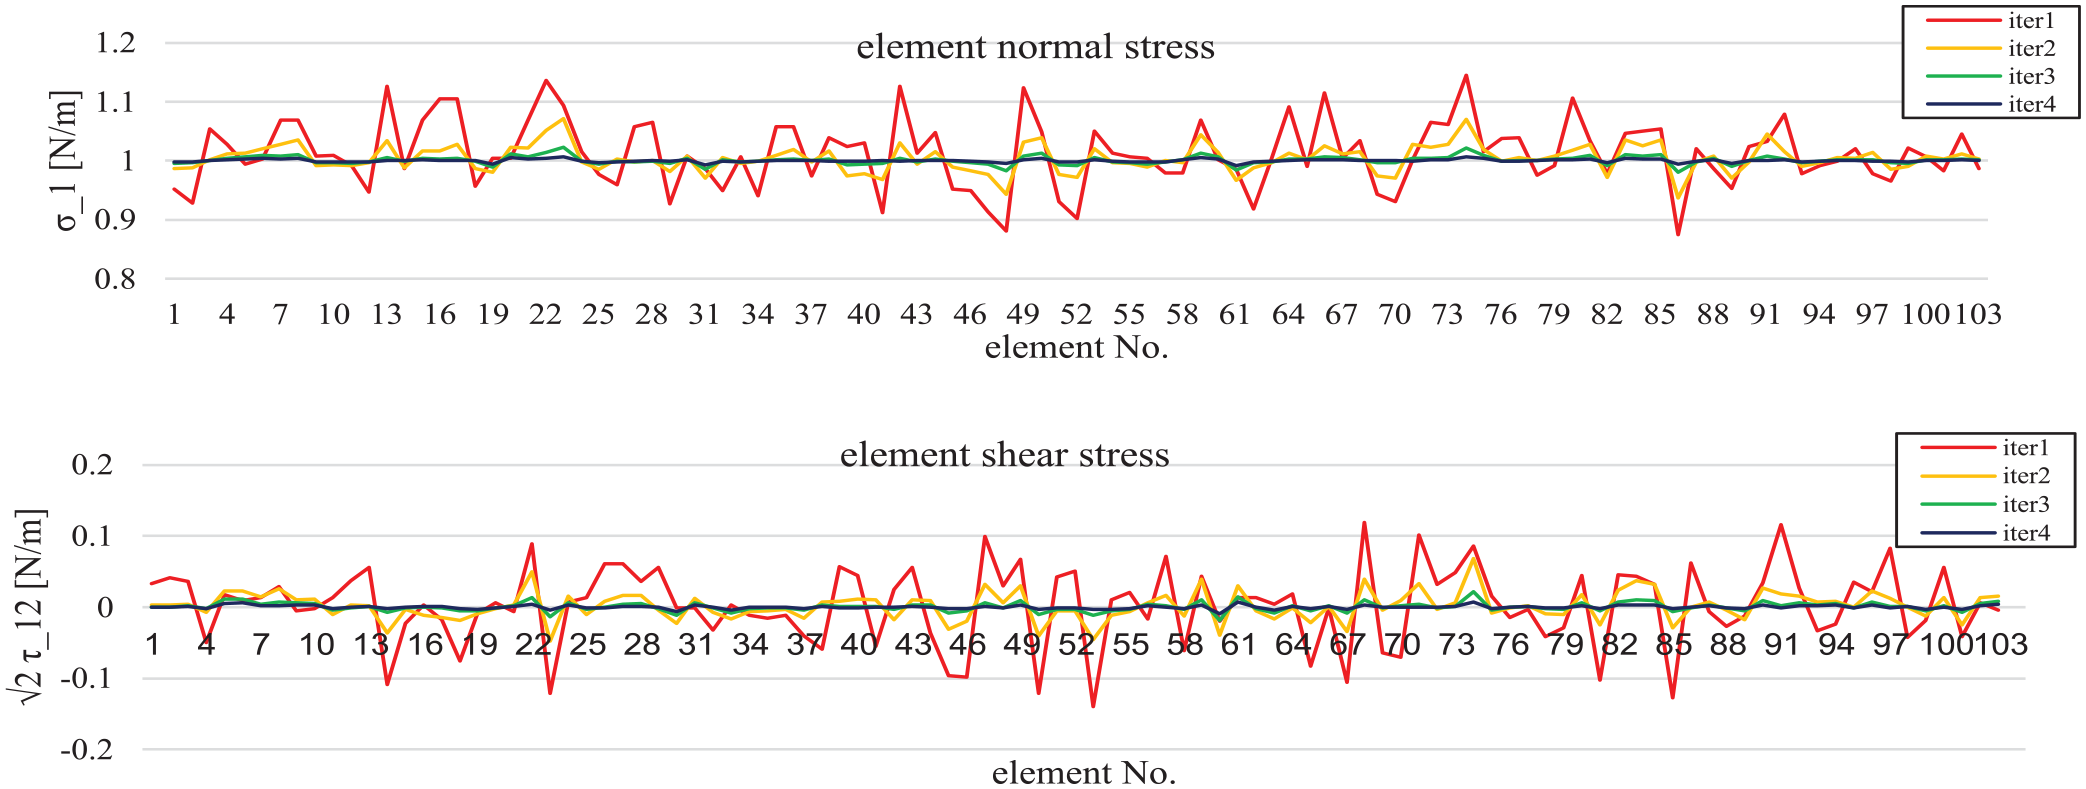
Element stresses: normal stress converges to prescribed 1 kN/m (top) and shear stress vanishes (bottom).
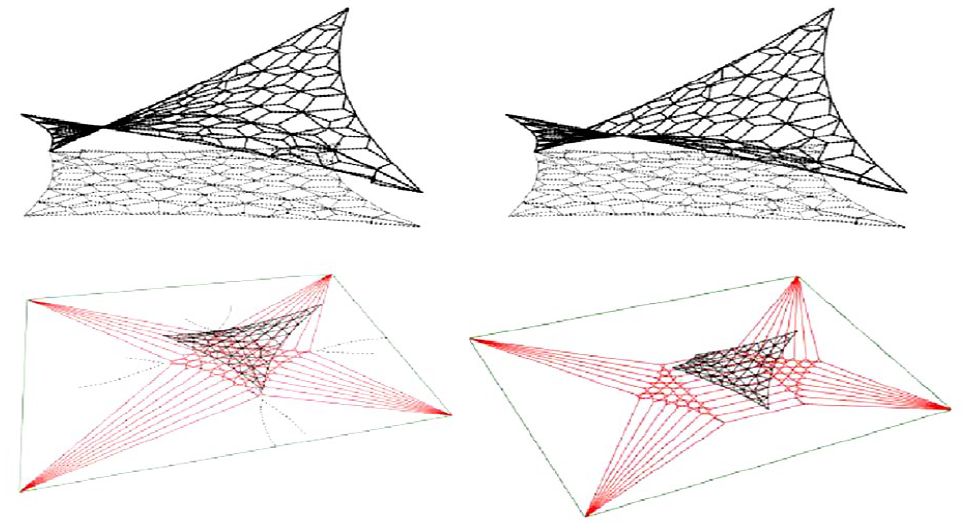
A twin-hypar
The following example of a twin-hypar is adapted from exercise 4 in a “round-robin test,” where several membrane structures were analyzed independently by various parties and the results compared. 27 In this example, a two-patch membrane structure with a 6 m × 6 m grid is anchored by three high points and three low points, with a 4-m height difference. The membrane prestress is 5 kN/m in both the warp and fill directions, and the pretension of the edge cables is 50 kN. A membrane prestress of non-unity does not affect the planar equilibrium finding; it simply scales the forces assigned to the form edges of the membrane patches and edge cables simultaneously, as shown in Figure 19. The difference in Z per iteration is illustrated in Figure 20.
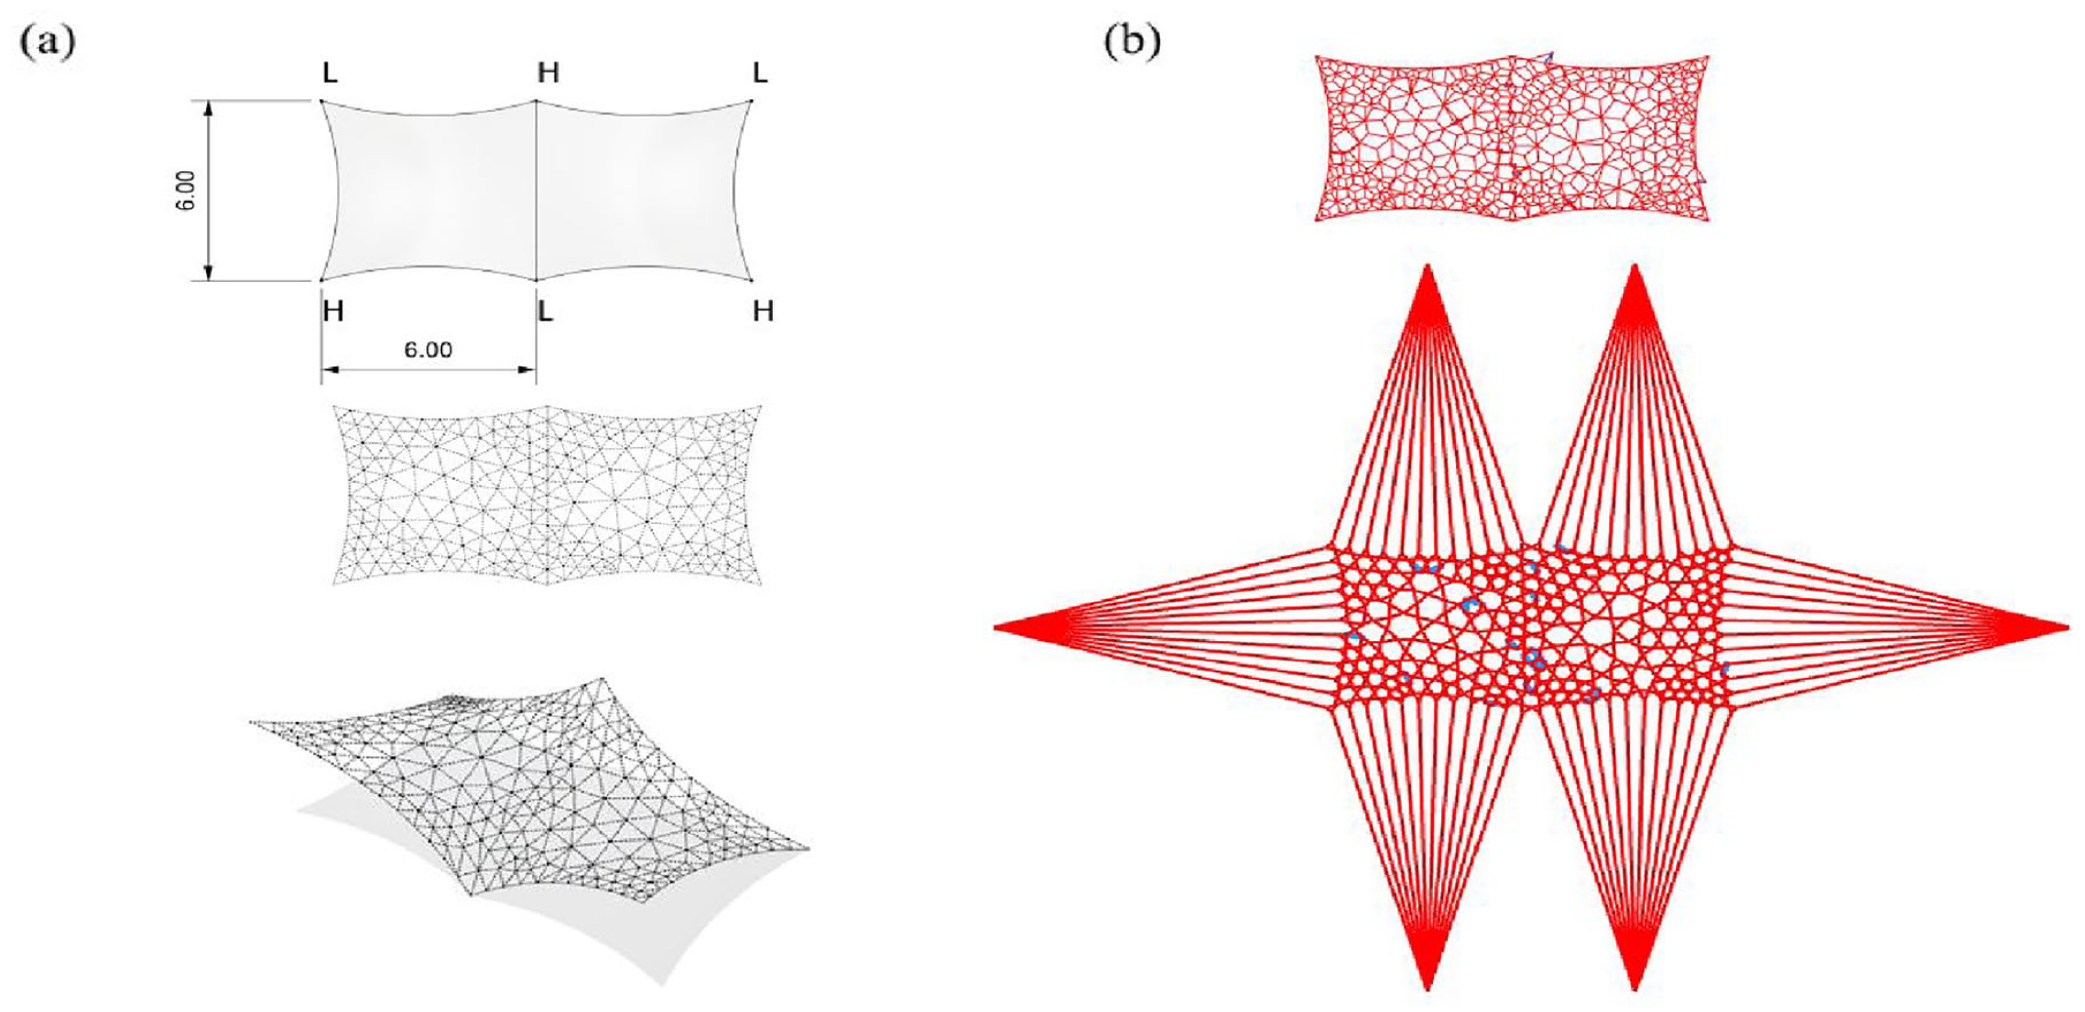
(a) Twin-hypar in plan, initial tri-mesh, and form-finding result of iteration step 4 from top to bottom and (b) initial planar form and force diagrams.
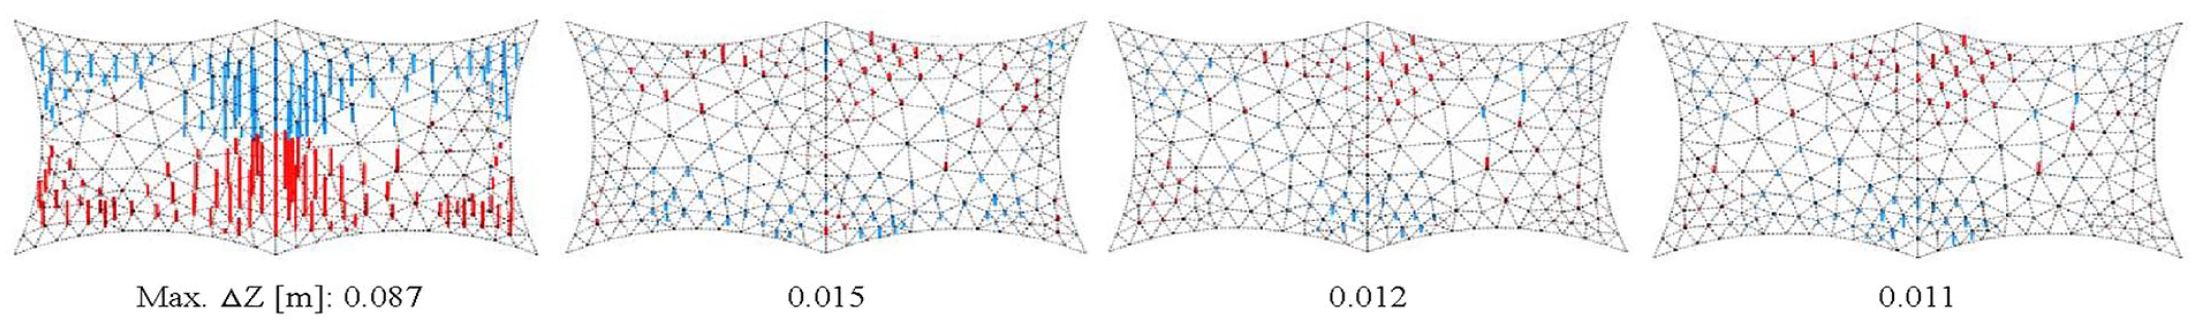
Maximum height differences between reference geometry and FDM results, steps 1–4. Red or blue lines indicate that reference geometry is lower or higher respectively.
Conclusions and future work
This paper introduced a force density-based form-finding method for membranes under isotropic stress fields, spanned by edge and/or ridge cables. The key feature is the use of planar reciprocal diagrams as a starting point to define initial force densities, enabling intuitive consideration of design parameters such as anchoring forces and cable prestress.
Membrane patches, through discretization, were analyzed holistically, with two drawing styles, namely the nodal force approach and the natural force approach, being discussed. Their form and force diagrams share a notable similarity: one’s force diagram corresponds to the other’s form diagram, scaled by a factor of
For achieving 3D equilibrium, the planar geometry is initially lifted (displaced only in Z). preserving the planar equilibrium, for example, the projection of anchoring forces remains unchanged in the XY-plane. In subsequent iterations, the force densities are updated based on the current geometry (form) and the application of the prescribed stress field (force). Convergence of normal stresses to isotropic results and the vanish of shear stress were demonstrated in plots. The agreement between the reference and calculated geometries, in terms of height deviation, was shown to be satisfactory.
For future work, the consideration of anisotropic stress is of significant interest due to its engineering relevance. Exploring its planar and spatial equilibrium through a similar graphical approach, along with the integration of cables, presents an intriguing direction for further research.
Footnotes
Acknowledgements
We thank also Kenryo Takahashi for the discussion on natural force density method.
Declaration of conflicting interests
The author(s) declared no potential conflicts of interest with respect to the research, authorship, and/or publication of this article.
Funding
The author(s) disclosed receipt of the following financial support for the research, authorship, and/or publication of this article: This work was supported partially by the Bundesinstitut für Bau-, Stadt- und Raumforschung, Germany (BBSR) through Zukunftbau project “C³—City Climate Canopy” [SWD-10.08.18.7-21.55].