
Abstract
The diagnosis of osteoporosis using Dual-energy X-ray Absorptiometry (DXA) relies on accurate hip scans, whereby variability in measurements may be introduced by altered patient positioning, as could occur with repeated scans over time. The goal herein was to test how altered postures affect diagnostic metrics (i.e., standard clinical metrics and a newer image processing tool) for femur positioning. A device was built to support cadaveric femurs and adjust their orientation in 3° increments in flexion and internal/external rotation. Seven isolated femurs were scanned in six flexion postures (0° (neutral) to 15° of flexion) and eleven rotational postures (15° external to 15° internal rotation) while collecting standard clinical DXA-based measures for each scan. The fracture risk tool was applied to each scan to calculate fracture risk. Two separate one-way repeated measures ANOVAs (α = 0.05) were performed on the DXA-based measures and fracture risk prediction output. Flexion had a significant effect on T-score, Bone Mineral Density (BMD), and Bone Mineral Content (BMC), but not area, at angles greater than 12°. Internal and external rotation did not have a significant effect on any clinical metric. Fracture risk (as assessed by the image processing tool) was not affected by either rotation mode. Overall, this suggests clinicians can adjust patient posture to accommodate discomfort if deviations are less than 12 degrees, and the greatest care should be taken in flexion. Furthermore, the tool is relatively insensitive to postural adjustments, and as such may be a good option for tracking risk over repeated patient scans.
Keywords
Introduction
Bone health is typically assessed using dual-energy X-ray absorptiometry (DXA) scans to measure bone mineral density (BMD). Osteoporosis is a degenerative disease that is characterized by low bone mass, which may lead to a high risk of fracture. 1 Currently, osteoporosis (and corresponding hip fracture risk) is diagnosed based on a “T-score” calculated from DXA scans, where T-score is representative of how far below the average healthy young adults BMD is, in standard deviations (SD). BMD, T-score, and bone mineral content (BMC) are important metrics when diagnosing patients with osteoporosis. 2 Clinicians rely heavily on these metrics to track the progression of osteoporosis, their risk of fracture and bone health as well as determine the appropriate treatment for their patients. 3 New techniques are focusing on expanding beyond typical DXA measures (BMD, T-score) to better predict fracture risk through advanced image processing techniques to extract information about femur geometry and BMD distribution,4–6 with work from our group having shown that this substantially improves risk assessments.6,7 This new technique has correctly predicted 78% of fractured cases compared to 36% when using T-score and 32% when using Fracture Risk Assessment Tool (FRAX). 6 While these tools show great promise, they may be more affected by altered projections than singular measures such as BMD.
The diagnosis and tracking of osteoporosis using DXA relies on accurate scans, where regular follow-ups are usually required to monitor the progress of patients and guide clinical decision-making. Patients undergoing a DXA scan may have limited mobility, pain, and discomfort due to other health challenges, and as such they may shift their position after it has been set by the technologist/clinician. Positioning patients is a vital component of producing an accurate DXA image to allow for proper diagnosis and treatment. 8 The effect of hip positioning on DXA measures has been investigated previously using both patients and cadaveric femurs.9,10 These studies showed that femoral internal/external rotation and flexion had a significant effect on BMD measurements; however, these were investigated only in large increments (5–15°) with limited number of specimens. While important, posture changes of this magnitude may be more readily identified visually. No known previous study has investigated smaller adjustments, which may be more difficult to identify. As such, their potential effect on DXA measures (both standard metrics and new image processing algorithms) needs to be understood.
The objective of this study was to evaluate the effect of small hip rotations in each independent axis of motion on overall DXA outcomes as well as the change in fracture risk prediction using an image processing fracture risk algorithm, all compared to the neutral posture using ex vivo femurs.
Methods
A device was designed and built to support cadaveric femurs in a DXA scanner and independently adjust their posture in two axes (i.e., flexion/extension and internal/external rotation) in 3° steps (Figure 1). A 15 cm deep clear bucket filled with water simulated the attenuation of muscle and fat. 11 The device was designed to be height-adjustable so that the femur was at a constant distance above the water (i.e., immediately above the water surface). Seven isolated fresh-frozen cadaveric femurs were used (5M/2F, age 59.9 ± 11.9 years). Each femur was potted distally at the mid-diaphysis in a circular tube using dental cement (Denstone Golden, Heraeus Kulzer, South Bend, IN, USA). Specimens were thawed for 4-5 h before DXA scans were taken using a Hologic Discovery A system (Hologic, Inc., Marlborough, MA, USA). Each specimen was scanned in six flexion postures from 0° (neutral) to 15° of flexion in 3° increments, and in 11 rotational postures from 15° external rotation to 15° internal rotation12,13 in 3° increments, for a total of 16 images per specimen (i.e., 112 total images). The two motions (i.e., flexion and internal/external rotation) were independently investigated. Neutral was defined as the femur diaphysis and neck being parallel to the DXA table, confirmed visually. The motion of extension was excluded due to the inability of patients to extend their hip while supine. Four DXA-based measures (Total BMD, Total T-score, Total bone mineral content (BMC), and Total area) were collected for each scan, and patients were diagnosed as “Normal,”“Osteopenia,” and “Osteoporosis,” based on total and femoral neck T-score (according to World Health Organization (WHO)). 1
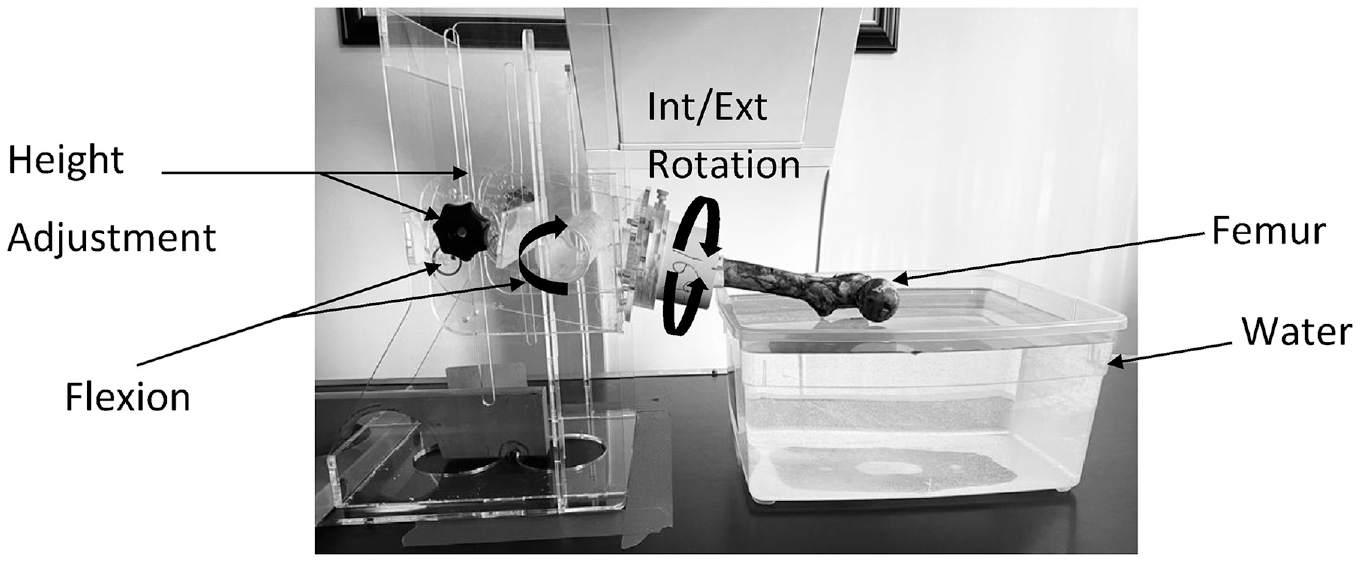
Experimental setup. Each cadaveric femur was secured in a potted section of tube at the mid-diaphysis, and positioned in either neutral, flexed, or rotated posture. A bucket of water was placed under the proximal femur to represent attenuation of soft tissues, and the jig was height adjustable to maintain the proximal femur the same distance off the test bed for each scan. The isolated femur in the figure is flexed (9°).
The novel image processing algorithm is described in detail in Jazinizadeh et al.6,7 The algorithm uses Statistical Shape and Appearance Modeling (SSAM) which averages the coordinates of the landmarks for each femur in the training set.6,7 This algorithm was previously trained using a large clinical dataset. 6 Principal component analysis (PCA) was then applied to create a shape and appearance template model.
In the present study, 19 landmarks were manually placed on each scan by one author based on anatomical features. Scans were applied to the SSAM algorithm to determine the main modes of variation from the hip DXA scans that produces an output that can be characterized by the shape and density features of the femur. Logistic regression was then applied to predict the probability of fracture using the following independent variables: weight of the main modes of variation (i.e., output of the SSAM), and the total BMD values. 6 For each specimen and posture this process was followed, resulting in an output of probability of fracture for each image in the present study. The algorithm was previously trained by applying any output of 50% (or 0.5) probability of fracture or greater, a label of “high-risk,” otherwise cases were assigned as “low-risk.” 6
Repeatability of the DXA scanner and the set-up of the rotational jig were assessed separately using a single specimen measured three times. To measure the repeatability of the DXA scanner a single specimen was imaged three consecutive times (without moving between scans). To measure the repeatability of the rotational jig, the specimen was measured three times where the jig was disassembled and specimen re-aligned each time. The coefficient of variation (CV) was calculated for each DXA outcome for the two repeatability assessments. A one-way repeated measures ANOVA (α = 0.05) was used to determine the effect of flexion and rotation separately on each DXA outcome measure with post-hoc Fisher’s Least Significant Difference (LSD) test. Also, a second one-way repeated measures ANOVA (α = 0.05) was used to determine if the predicted fracture risk significantly changed from neutral with flexion and rotation angles analyzed separately (also with post-hoc Fisher’s LSD test). For each repeated measures ANOVA, a Mauchly’s test of sphericity was conducted to determine if the assumption of sphericity was met. If Mauchly’s test of sphericity was violated, the degree of freedom was corrected using Greenhouse-Geisser (ε < 0.75) or Huynh-Feldt (ε > 0.75) estimates of sphericity. All statistical analyses were performed using IBM SPSS Statistics (Version 27). A pairwise comparison was also conducted to identify any individual effects between the independent variables.
Results
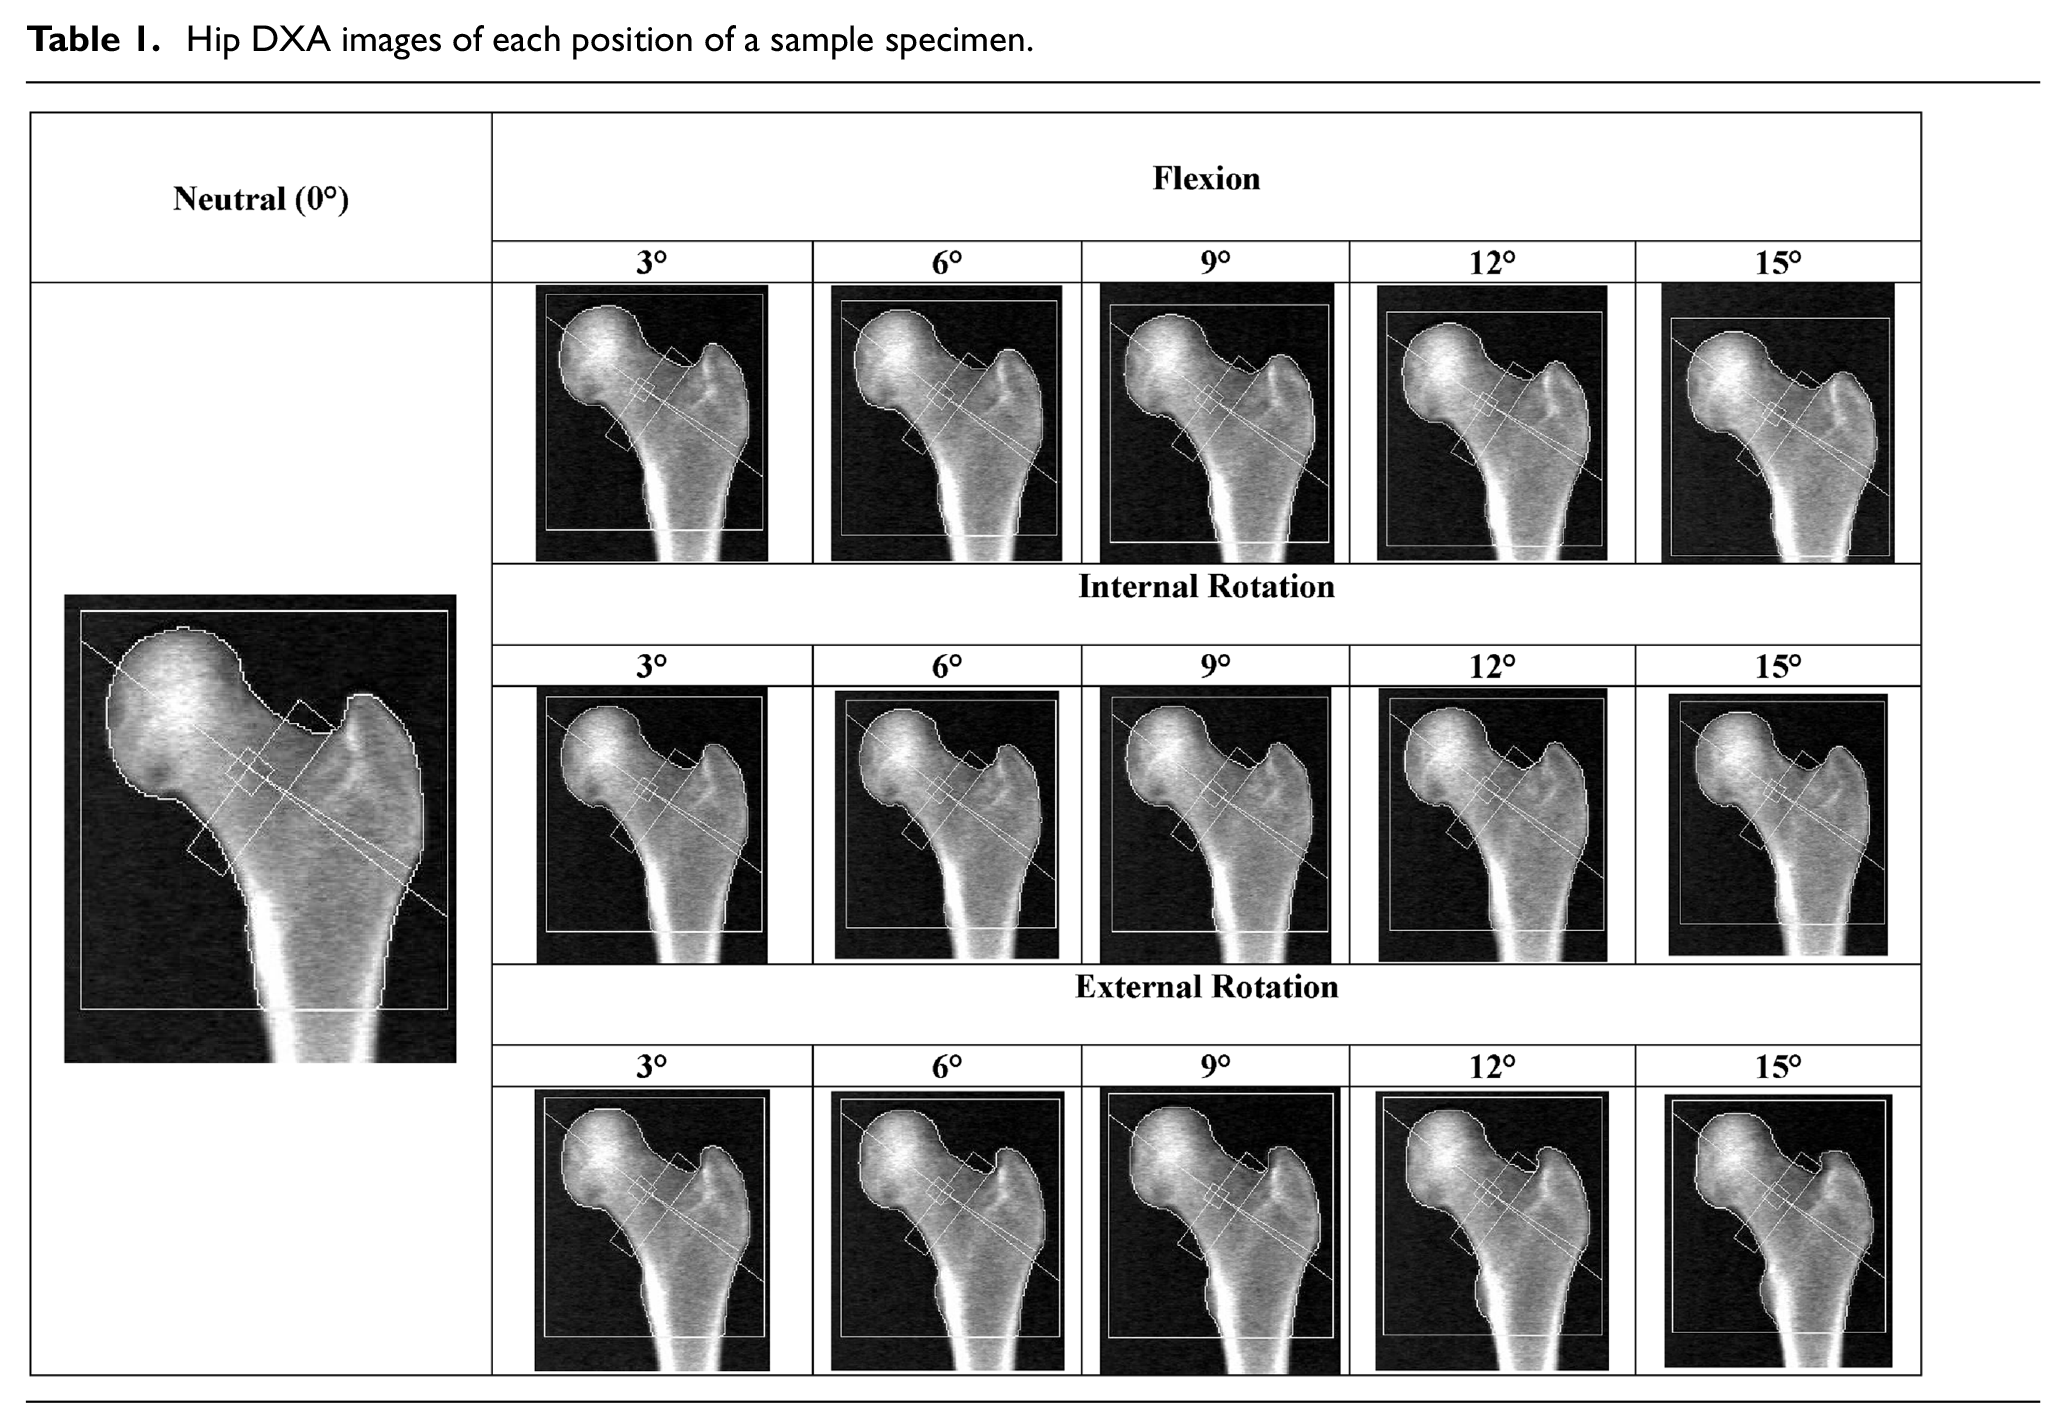
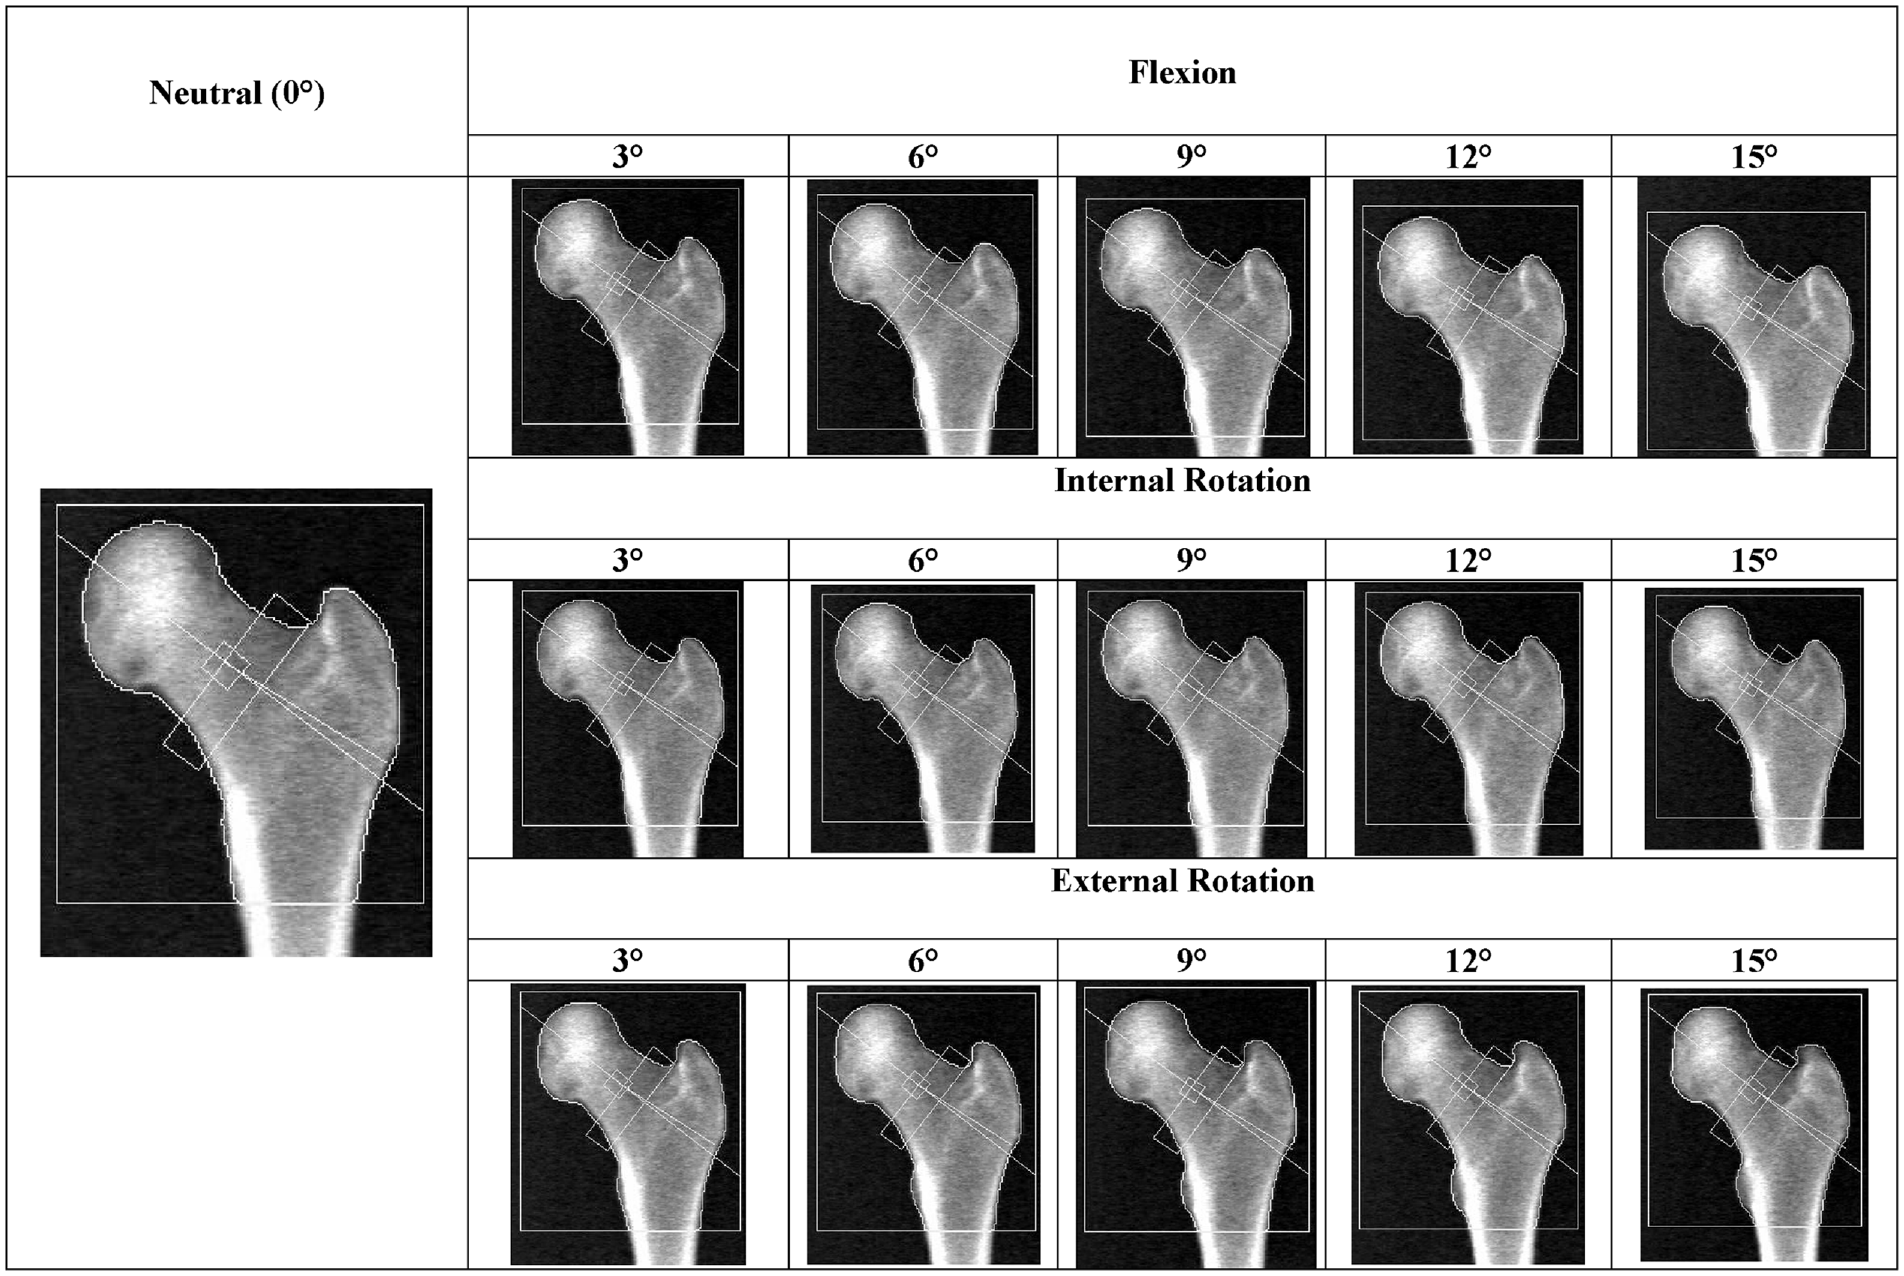
DXA scans were collected for each specimen for all 16 different postures (Table 1). All DXA outcomes for the repeatability tests had a coefficient of variation (CV) less than 4%. For the repeatability of the DXA scanner, T-score had the highest CV at 3.9% which was calculated using the following three T-scores, −1.5, −1.5, and −1.4. BMD had the second highest CV at 0.43%. For the repeatability of the rotational jig, the maximum CV was 2.6% (BMC).
Hip DXA images of each position of a sample specimen.
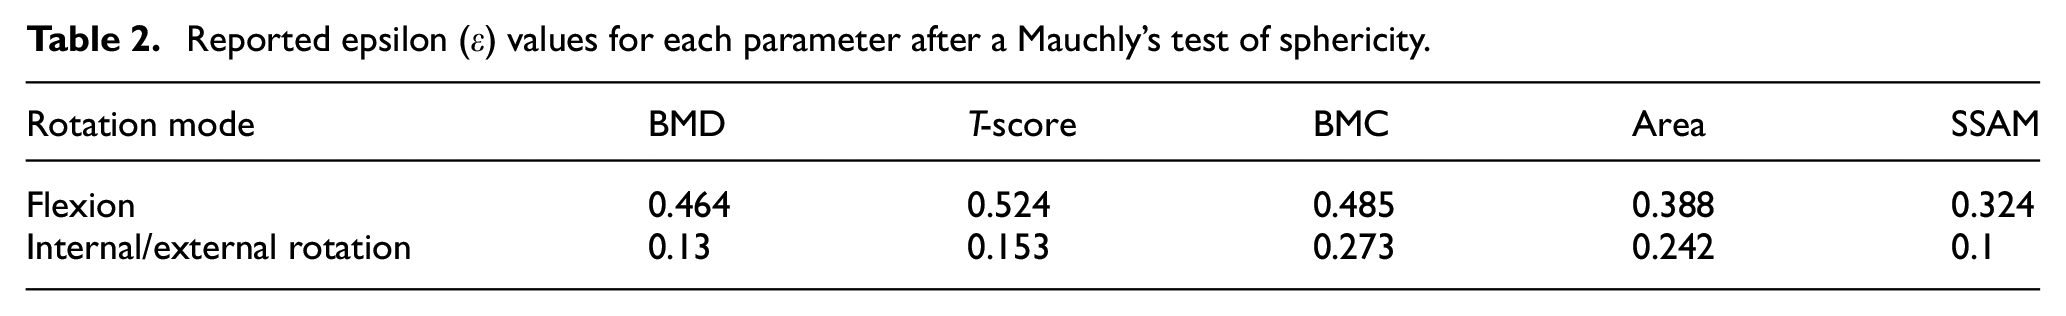
For all DXA parameters in the flexion axis tests the assumption of sphericity was met; however, all DXA parameters in the internal/external rotational axis had this assumption violated. Hence, for the parameters that showed a violation the degree of freedom was corrected using Greenhouse-Geisser (ε < 0.75) or Huynh-Feldt (ε > 0.75) estimates of sphericity (Table 2).
Reported epsilon (ε) values for each parameter after a Mauchly’s test of sphericity.
Flexion angle had a significant effect on T-score, BMD, and BMC, while no effect on area was observed (p = 0.014, p = 0.003, p = 0.041, and p = 0.334, respectively) (Figure 2). Total BMD was significantly higher at 15° (p = 0.017) than at neutral. Total T-score was also significantly higher at 15° (p = 0.047) than at neutral. Other pairwise differences were identified (i.e., 9° was significantly different than 3°); however, no other angles were significantly different from neutral. Finally, Total BMC was significantly different from neutral at 12° and 15° (p = 0.004 and p = 0.02, respectively). To allow visualization on a subject-specific level, changes in DXA measures for each specimen was also plotted (Figure 3).
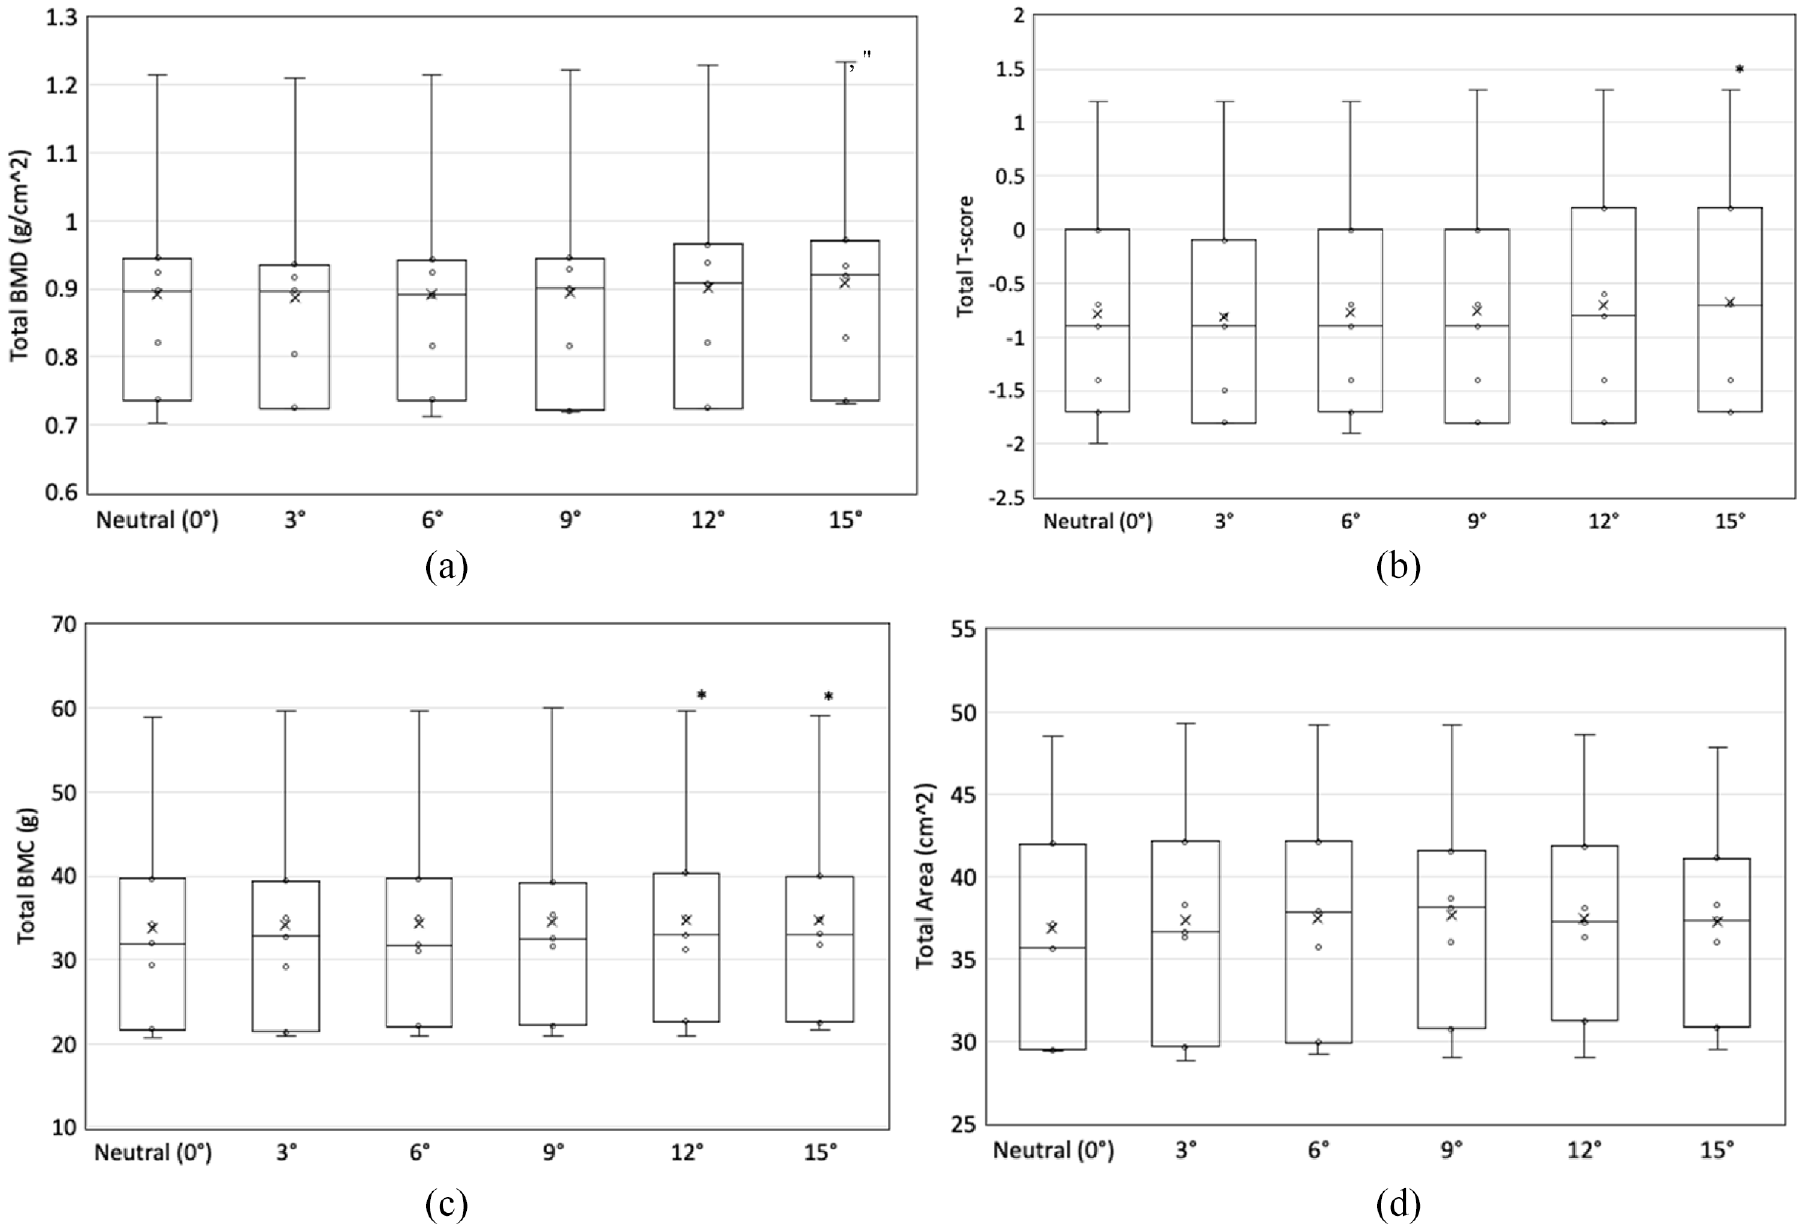
The effect of flexion angle on DXA measures: (a) BMD, (b) T-score, (c) BMC, and (d) area.
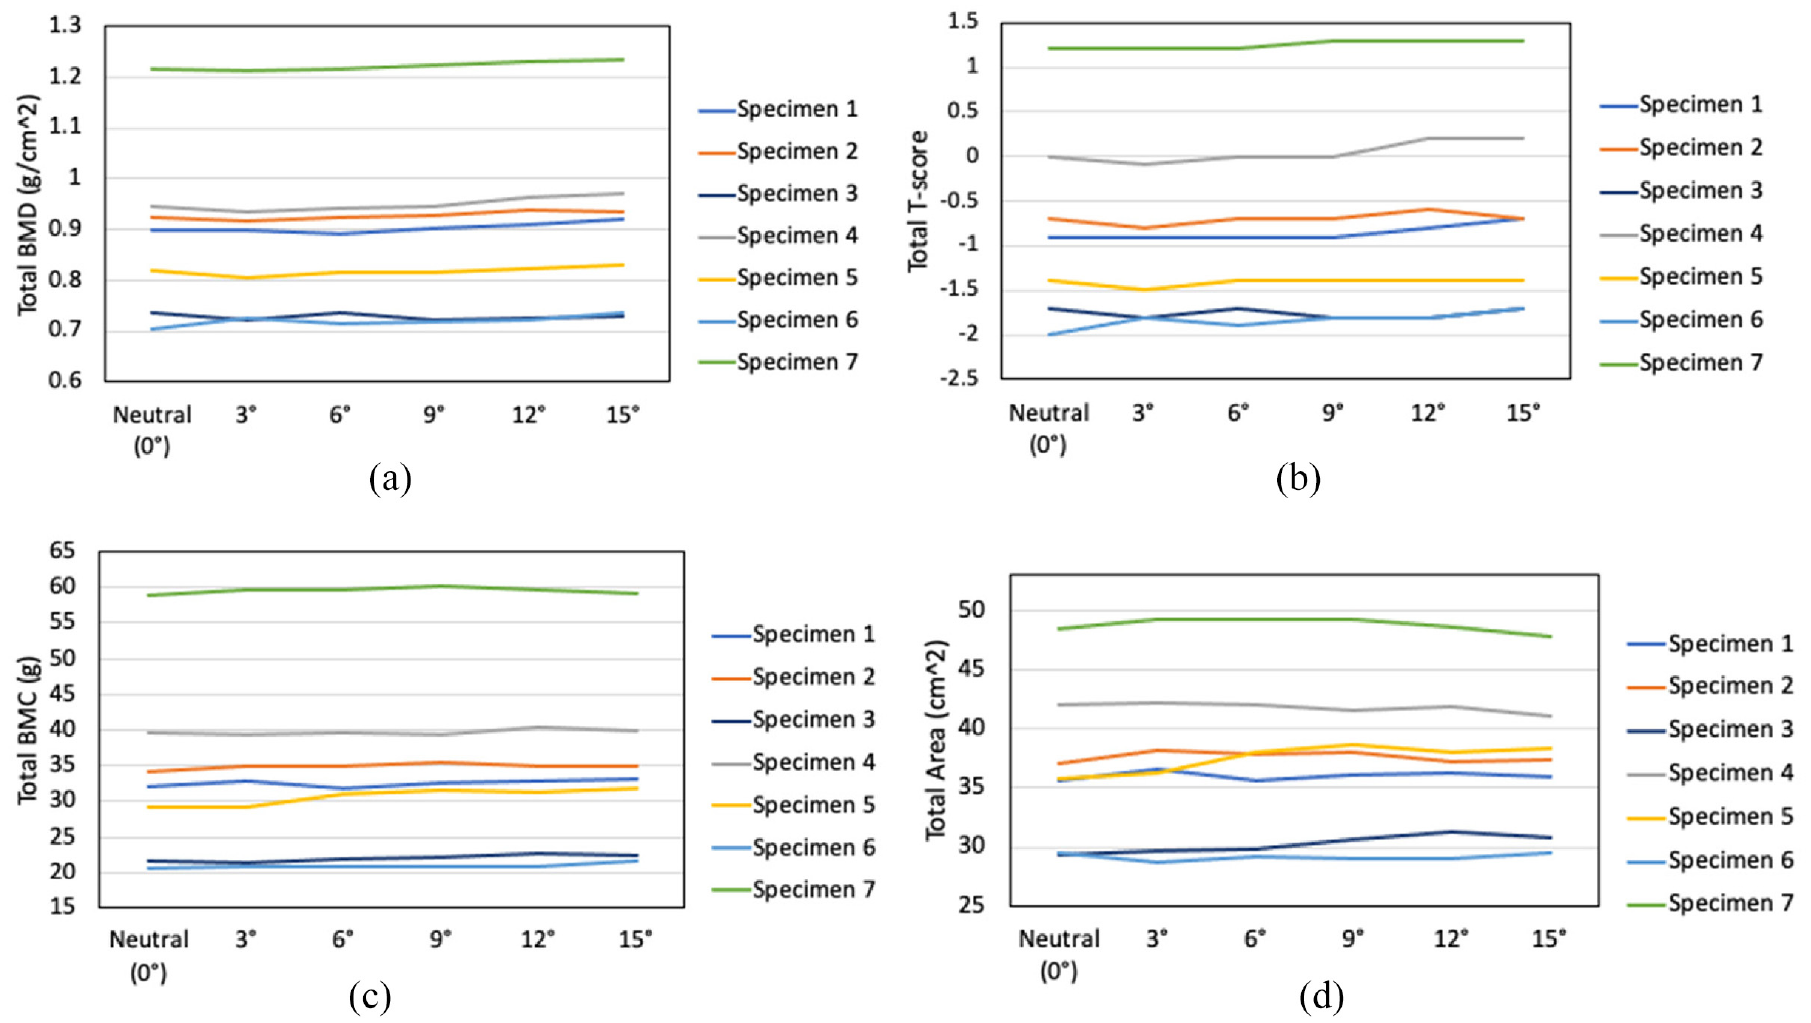
Changes in DXA measures with flexion angle for each specimen: (a) BMD, (b) T-score, (c) BMC, and (d) area.
Internal and external rotation angles did not have a significant effect on BMD, T-score, BMC or area (p = 0.149, p = 0.165, p = 0.359, and p = 0.199, respectively) (Figure 4). To allow visualization on a subject-specific level, changes in DXA measures for each specimen were also plotted (Figure 5).
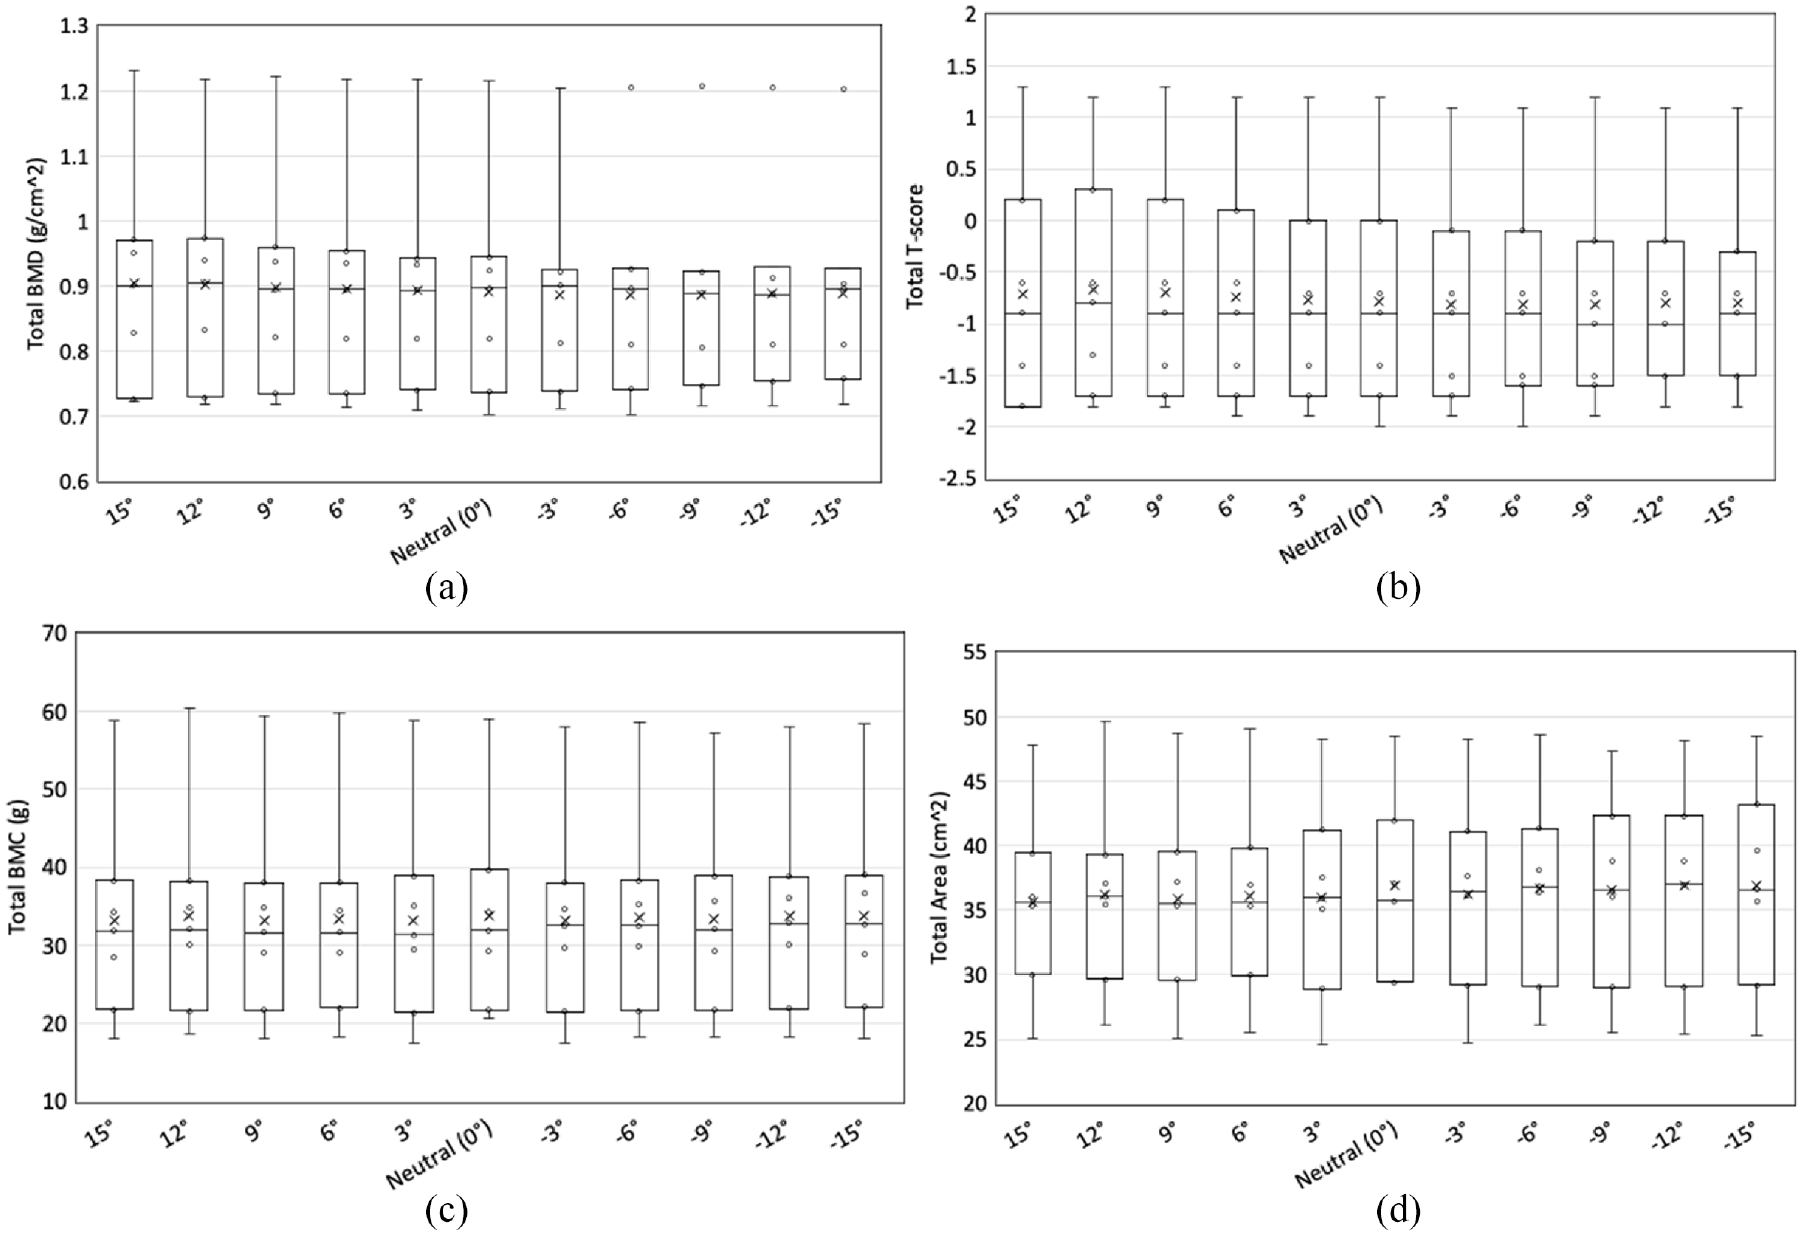
The effect of rotation angles on: (a) BMD, (b) T-score, (c) BMC, and (d) area. The positive posture values represent internal rotation and the negative posture values represent external rotation.
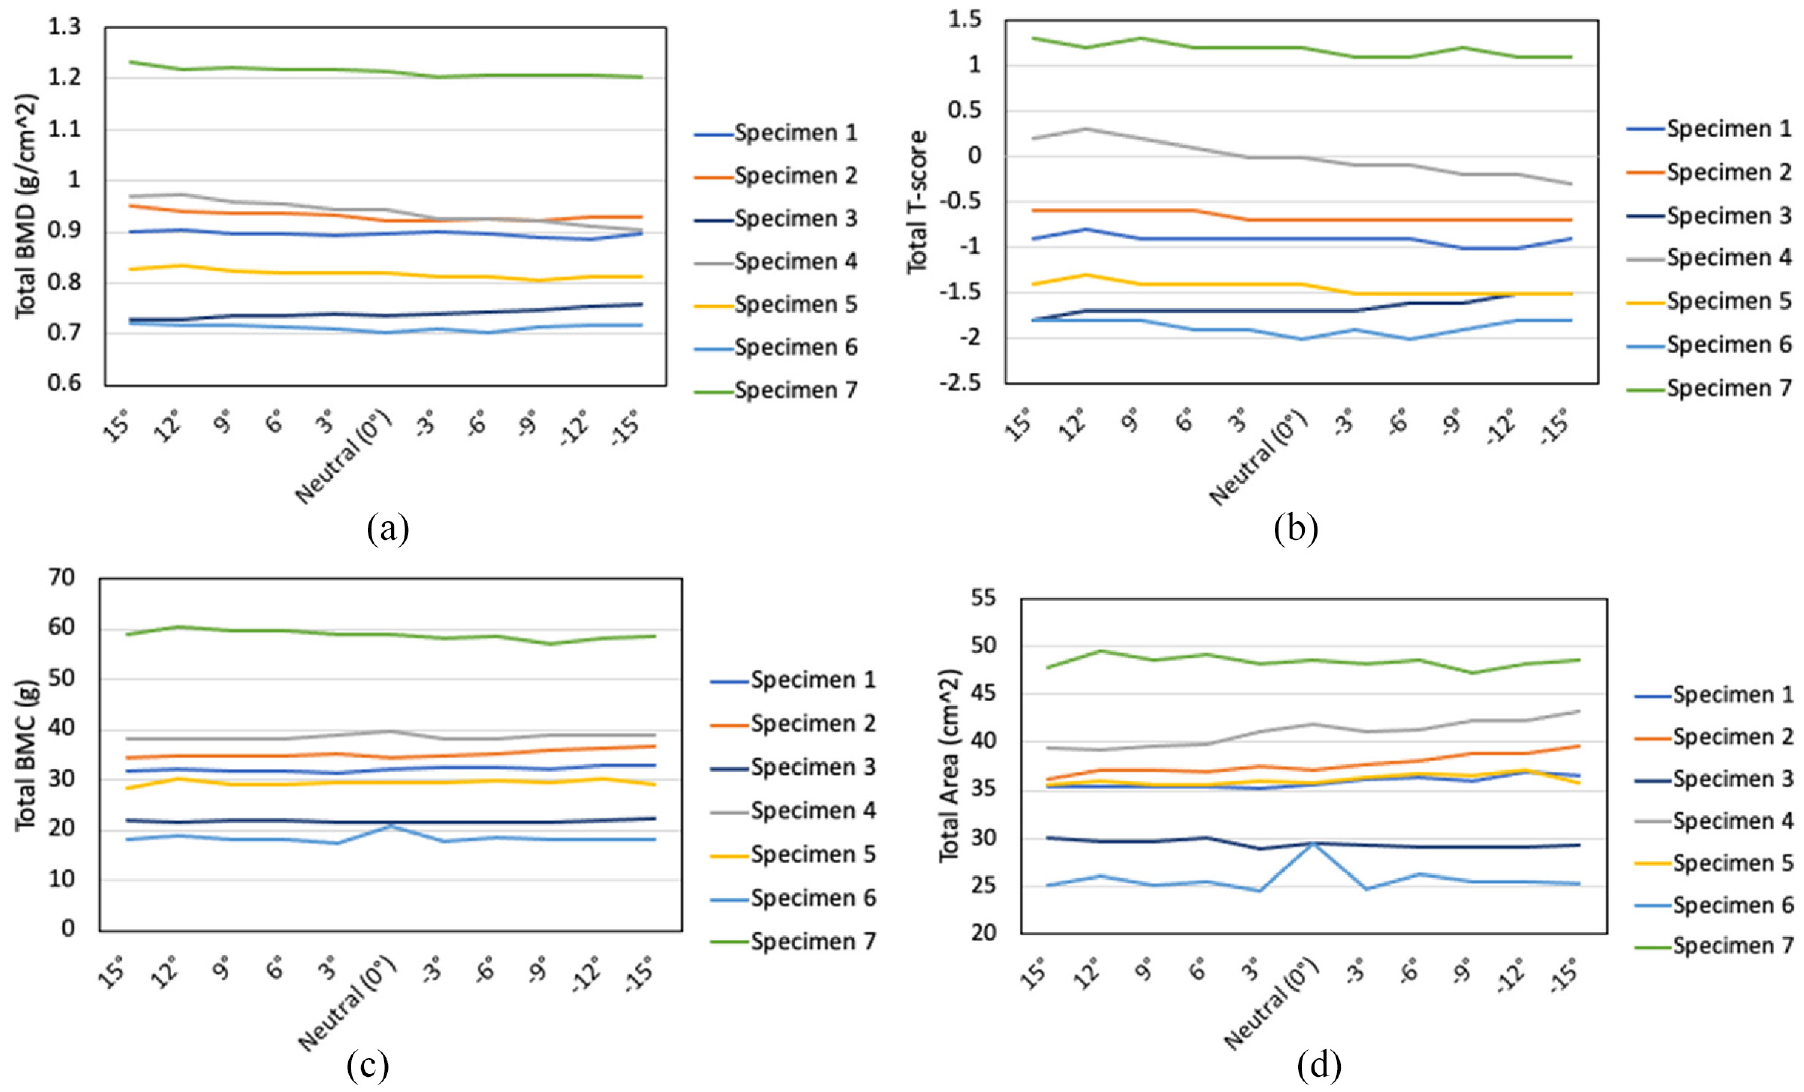
Changes in DXA measures with rotations angles for each specimen. The positive increment values represent internal rotation and the negative posture values represent external rotation: (a) BMD, (b) T-score, (c) BMC, and (d) area.
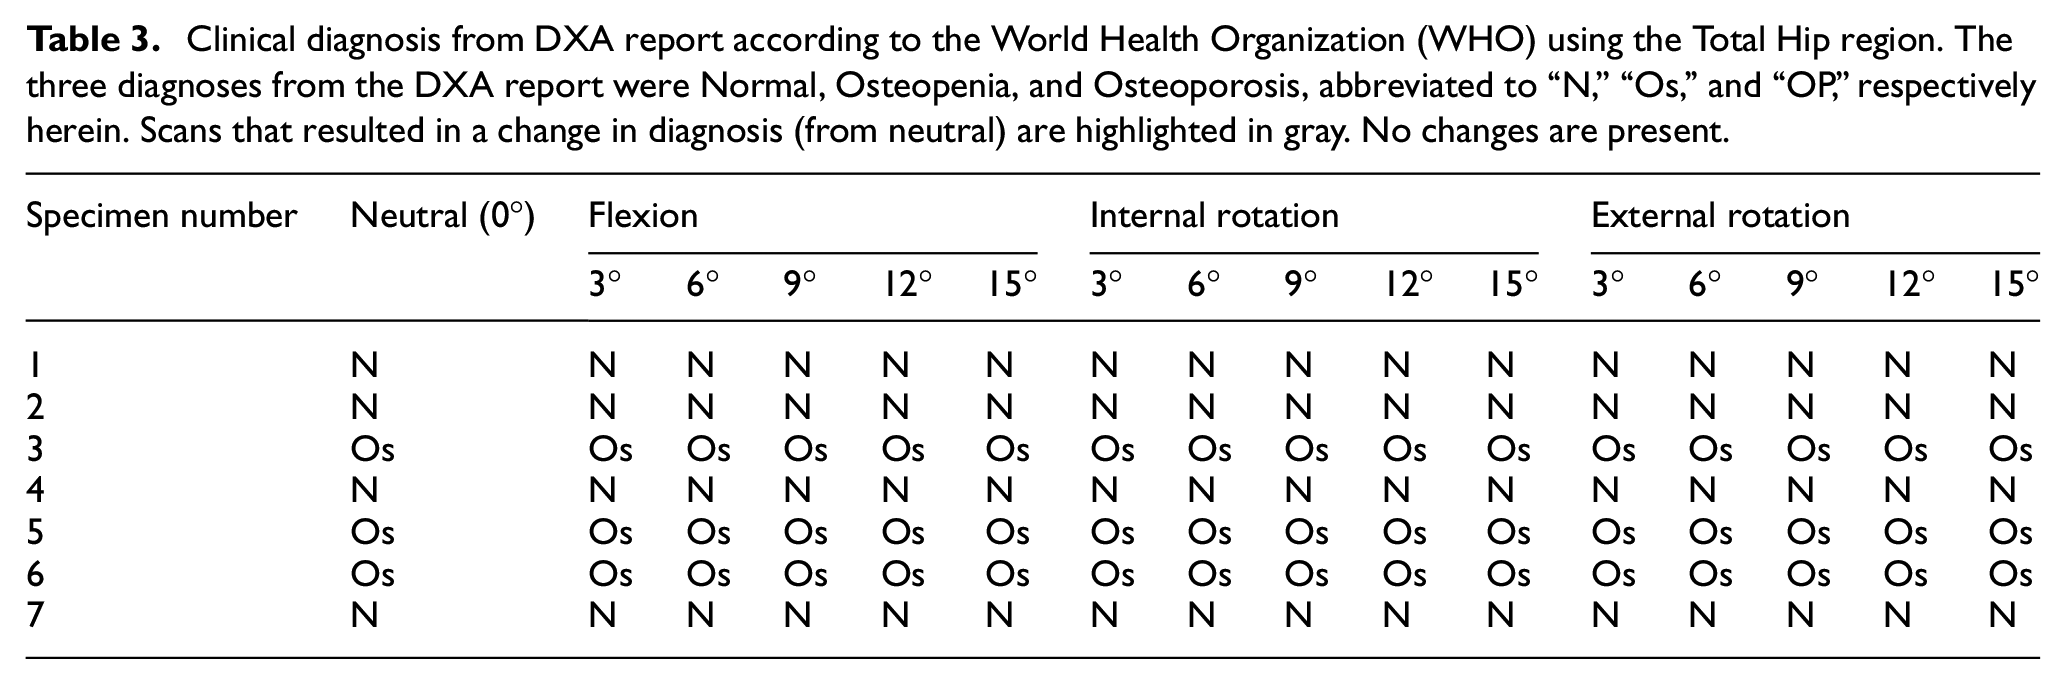
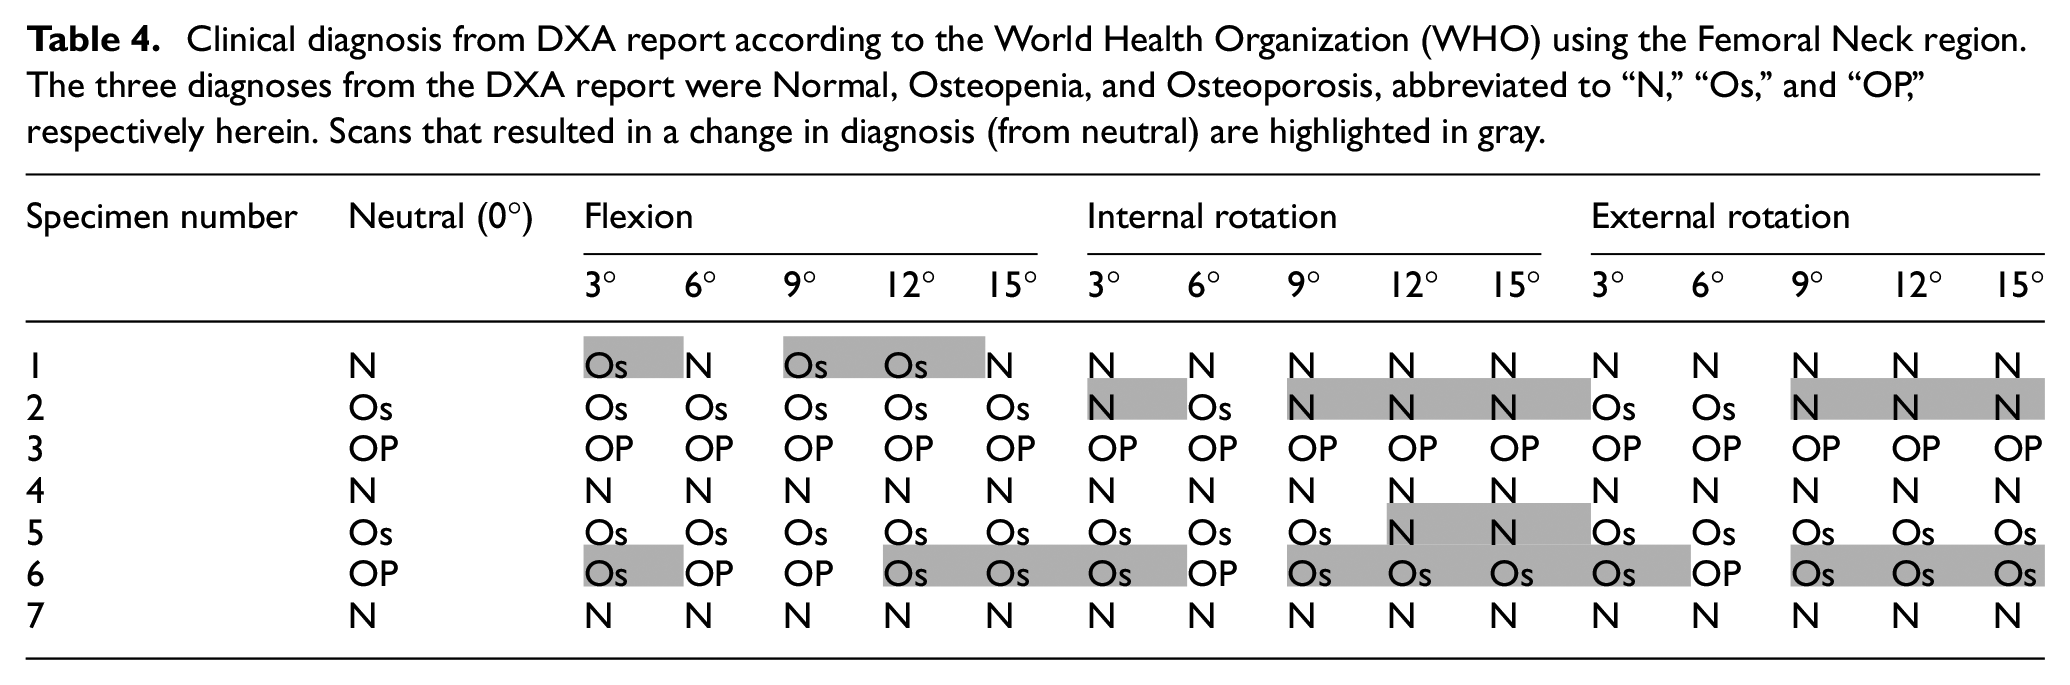
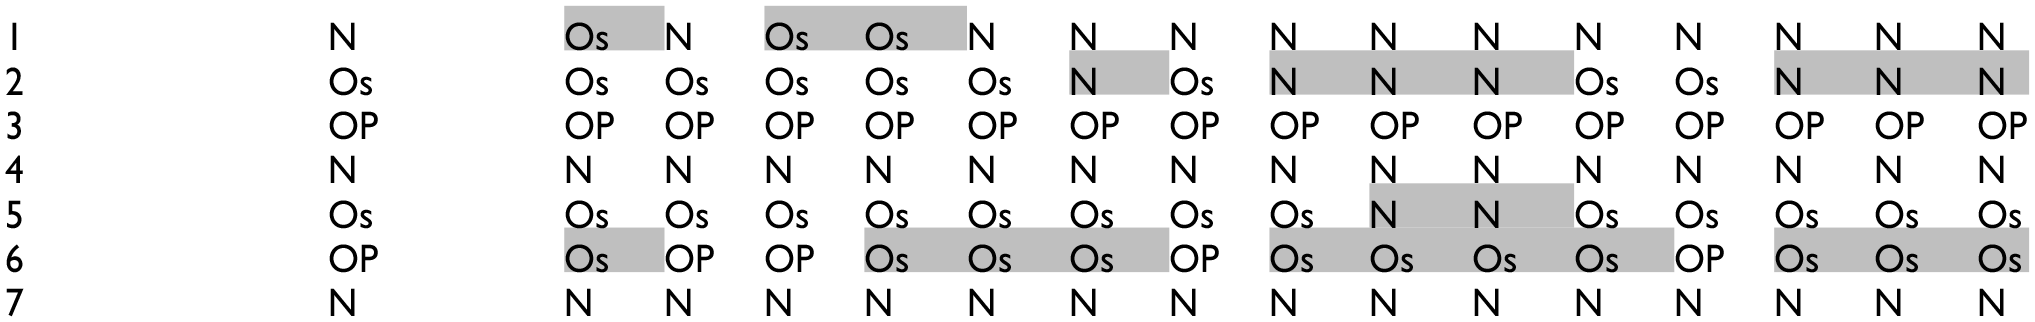
Since total T-score, BMD, BMC, and area were used in the analysis, for each specimen, scans where their clinical diagnosis changed from neutral were identified using the total hip region (Table 3). The diagnosis was not affected by any of the three motions (flexion, internal rotation, and external rotation). Additionally, the clinical diagnosis using the femoral neck region was also identified (Table 4). Interestingly, the diagnosis was affected by all three motions (flexion, internal rotation, and external rotation), and appeared to be subject-specific, as it affected four of the seven specimens only when using femoral neck region.
Clinical diagnosis from DXA report according to the World Health Organization (WHO) using the Total Hip region. The three diagnoses from the DXA report were Normal, Osteopenia, and Osteoporosis, abbreviated to “N,”“Os,” and “OP,” respectively herein. Scans that resulted in a change in diagnosis (from neutral) are highlighted in gray. No changes are present.
Clinical diagnosis from DXA report according to the World Health Organization (WHO) using the Femoral Neck region. The three diagnoses from the DXA report were Normal, Osteopenia, and Osteoporosis, abbreviated to “N,”“Os,” and “OP,” respectively herein. Scans that resulted in a change in diagnosis (from neutral) are highlighted in gray.
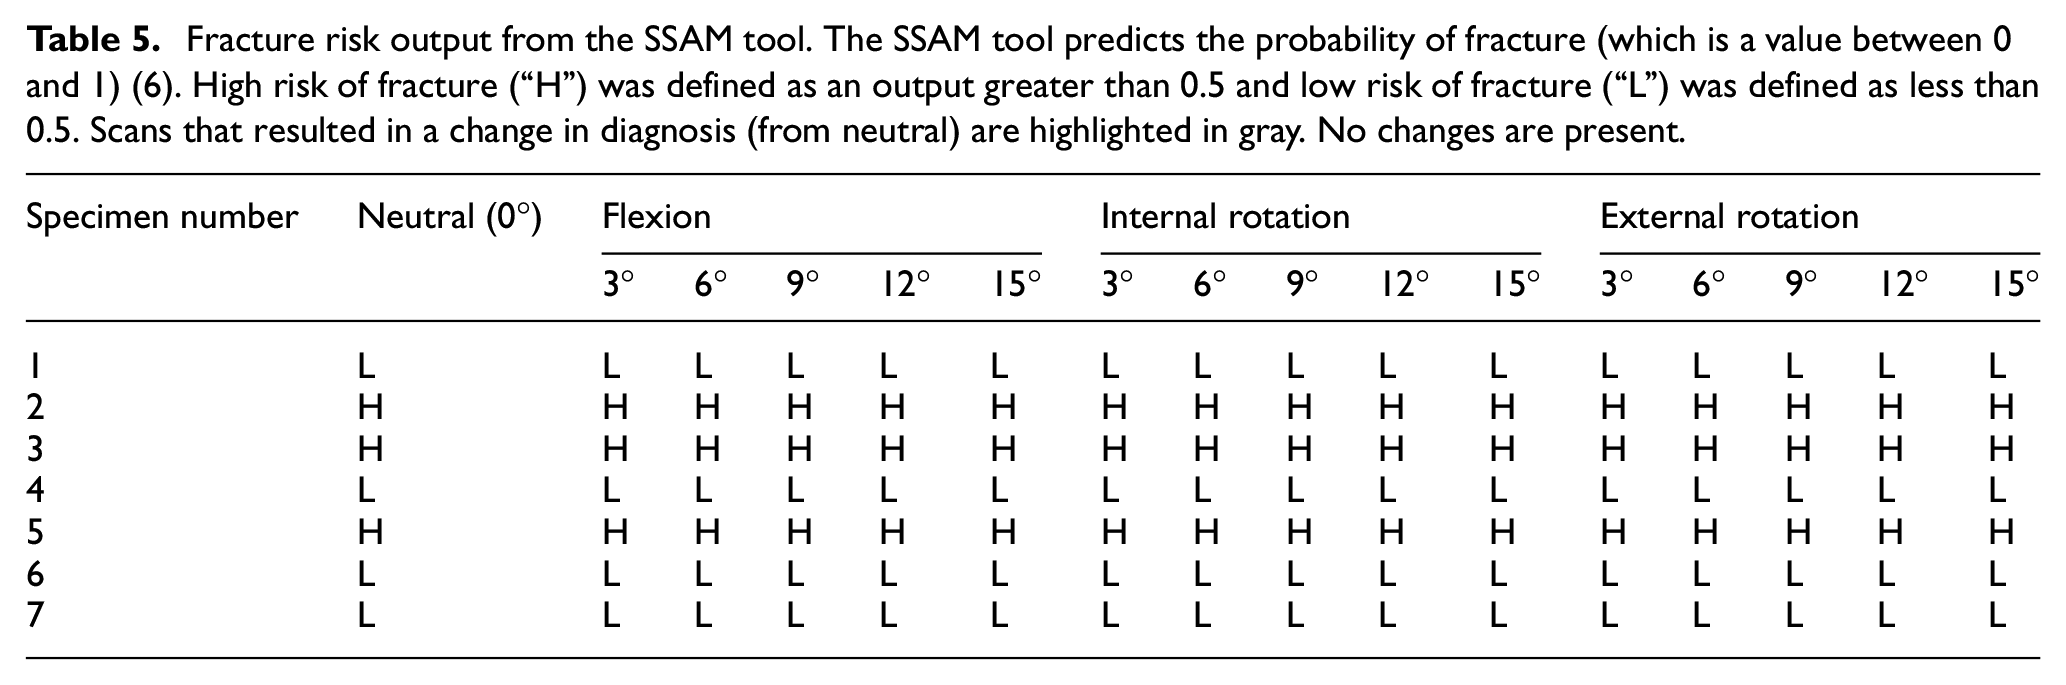
When comparing the neutral risk to altered postures, for the output of the SSAM algorithm, it was not affected by flexion or internal/external rotation (p = 0.279 and p = 0.356, respectively) (Table 5). Changes in posture had minimal effect on the assessed fracture risk, with maximal change of 0.0015 (0.15%) when internally rotating by 12°.
Fracture risk output from the SSAM tool. The SSAM tool predicts the probability of fracture (which is a value between 0 and 1) (6). High risk of fracture (“H”) was defined as an output greater than 0.5 and low risk of fracture (“L”) was defined as less than 0.5. Scans that resulted in a change in diagnosis (from neutral) are highlighted in gray. No changes are present.
Discussion
The overall goal of this study was to assess if different femur positions affect DXA-based metrics including a recently developed fracture risk prediction algorithm. 7 When a patient undergoes a DXA scan, they are positioned by the clinical staff to orient the femur in a specific posture (straight, with 15–25° of internal rotation). 12 This may deviate based on the experience of the person doing the positioning, or patient limiting factors such as pain especially patients who may have mobility or health challenges (e.g., hip arthritis). 14 Inconsistency in patient positioning during DXA scanning has been reported to be one of the dominant factors affecting the repeatability of DXA-based finite element models, 15 and this is a prevalent problem, where out of 113 hip and spine DXA reports, 61 hips and 94 spines were improperly positioned. 16 To prevent this improper positing of the hip, specific principles have been established. 12 However, due to the limited range of motion or pain of patients, this may cause slightly altered positioning during DXA scans. In some cases, certain health challenges such as hip osteoarthritis may limit movement in more than one plane (flexion and rotation combined) restricting optimal positioning. This may have an even greater effect on clinical measures and should be investigated further. This study primarily focuses on initially investigating which independent motion had the largest influence, as this would assist with positioning guidelines.
A better understanding is needed of how much small changes in positioning affect the outcome of novel diagnostic approaches such as the fracture risk algorithm, to fully appreciate the errors that may be associated with them. Therefore, this study did not examine how accurate the fracture risk prediction was for each specimen, but rather provided an indication of the sensitivity of the algorithm as the femur position changed from neutral posture to other angles.
Flexion was shown to have a significant effect on T-score, BMD, and BMC, yet area was not affected. This demonstrates that for these key clinical metrics, smaller flexion adjustments (potentially to accommodate patient pain or discomfort) can be facilitated without compromising the assessments; however, larger postural changes (such as 15°) should be avoided. As T-score is used to classify patients as osteoporotic, care should be taken in consistent positioning of the femur (particularly in flexion) during diagnostic scanning. The results of the present study agree with those of recent work that found that at angles larger than 9° flexion, changes in BMD were 1.8% larger than the neutral BMD magnitude. 17
Internal and external rotation did not have a significant effect on any of the clinical metrics in the present study. Previous research on this has had conflicting conclusions, where a recent study found that BMD was very minimally altered by hip rotation, 17 yet in contrast, significant changes in BMD and BMC were found for internal rotation (10°) and in BMC and area during external rotation (10°). 18
Total BMD, T-score, BMC, and area were used herein. After a DXA scan, the software automatically detects the regions of interest such as the total hip and the femoral neck. However, in the present study it was observed that as posture changed, the projection of the hip slightly changed, making it difficult for the software to detect the femoral neck. This necessitated the DXA technologist to correct the neck region for each scan, whereas the total hip region remained automatically detected. As such, total hip was the focus of the present analysis as it eliminated any potential effect from the technologist while also investigating the changes in clinical diagnoses in the femoral neck. There are also advantages to using total hip over the femoral neck 19 as it has been noted to evaluate the entire hip which includes a larger area of trabecular bone, which is known to be more sensitive to change than cortical bone that is in the femoral neck. Total hip also helps increases in measurement accuracy. 19
Clinical decision-making is largely governed by classification into osteopenic or osteoporotic status. The average T-scores were not affected by small postural changes, this held true for all specimens as no specimens were misdiagnosed while using the total T-score diagnosis. Interestingly, diagnosis using the femoral neck T-score showed that this did not hold true for all specimens. Four of the seven specimens had been “misdiagnosed” at large angles when compared to neutral. This demonstrates how more care should be taken when positioning patients since femoral neck is more sensitive to changes and can impact patients’ clinical care. The differences in BMD measurements between the two sites have been investigated previously 19 and found that total hip and trochanter regions are far better than the femoral neck region and concluded that the total hip region was preferred. However, in the past femoral neck was mostly used and preferred for diagnosis. 19 The femoral neck diagnosis from this study, most likely affects patients who are close to the thresholds. There were two other specimens that were impacted, that had a larger difference compared to neutral. This difference may be due to the way the projection of the hip appears when scanning at 15° flexion compared to neutral, which is the result of DXA providing a 2-dimensional (2D) scan. As such, the present study agrees with previous study, 19 in that the total hip should be used, as it seems less sensitive to postural changes.
The fracture risk tool was relatively insensitive to both flexion or rotation (i.e., internal and external) on fracture risk prediction output (when compared to neutral). This provides further support for adoption of this algorithm as a clinical tool, as it may prove to be more robust than current clinical metrics. The results presented were only classified into “high” and “low” assessments based on their fracture risk prediction, the results demonstrate that the fracture risk prediction did not change from neutral. However, a more granular assessment might be needed to identify some key differences. This is important as this provides a degree of flexibility when patients are positioned to be scanned, without hindering their clinical outcome.
Small increments of 3° were assessed in this study, this was to investigate smaller increments not previously studied, for a wide range of outcome metrics. Angles less than 3° were not considered due to resolution issues with identifying and quantifying these increments. The maximum range that was tested in each motion was 15°; angles larger than 15° were not considered due to the unrealistic clinical application. Patients may shift their positions during a DXA scan; however, angles larger than 15° are likely visible to the DXA technologist. Similarly, certain motions were excluded from being tested (e.g., extension) due to the ability of actual patient motion that can be done on a DXA bed during a DXA scan in a clinical setting. However, adduction and abduction were also excluded as well since DXA is a 2D projection, so therefore the image will be unaffected by those particular motions in the plane of imaging. Isolated cadaveric femurs were used over patient participants because of the ability to position them at exact increments with a higher degree of control and is in line with previous work in this field. 10 In addition, receiving repeated DXA scans for a research study (even given the relatively low radiation levels) could pose a health risk for patients. However, this study still provides valuable findings as each specimen served as its own control where the main focus was on the change from neutral rather than the actual raw values themselves.
In order to remain consistent throughout the study, each scan was compared to its neutral posture as control, therefore any changes in the measures would be consistent across all scans. Using isolated femurs provided an advantage, allowing focus on just a relative comparison. The repeatability of the DXA scanner and the entire set-up was very good, with CV less than 4% for all measurements, supporting that differences noted herein were the result of posture and not of test setup. Additionally, T-score is a derived result from BMD, therefore the CV of T-score should be similar to BMD. However, for the DXA scanner, T-score measured a CV at 3.9% and BMD at 0.43%. This is due to the substantial significant digit differences (i.e., precision) between T-score and BMD. T-score is reported with one significant digit where slight changes in T-score will heavily impact the CV. Whereas BMD is reported to three significant digits, which is a more accurate representation of the CV for the DXA scanner for both BMD and T-score.
There were some limitations when conducting this study that should be acknowledged. In this present study, isolated femurs were used, and as a result there was no pelvis overlap and surrounding soft tissue. Water bath has been previously used in cadaveric studies to simulate the attenuation of soft tissue. 11 However, as patients move through a range of postures the thickness and composition of soft tissue overlaying the hip may change slightly, which was not reflected in the constant use of a water bath. Given the small increments used herein, this would likely have a slight effect. Also, during scanning, the jig was adjusted such that each femur was always placed with the femoral head right above the water line. This was in an effort to not affect the projection, but may have introduced some small errors as it had to be set manually for each posture. In addition, the scans were taken sequentially (all in one day) so the results may not be completely reflective of a patient returning for an annual DXA scan at the clinic, who may have other anatomical changes over this timeframe (e.g., weight gain, injury). Finally, the fracture risk tool 7 was trained using clinical scans, 6 which could have altered the algorithm modes, when applied to isolated femurs (due to the presence of the pelvis in the training scans). However, as has been mentioned previously, the focus of the present study was on changes from neutral, not the absolute assessments, and as such each femur serving as its own control likely reduced the effect of many of these factors.
DXA is an important tool as it guides clinical treatment. However, patients may alter their posture between scans due to a limited range of motion or pain, which can affect the precision and add variability to one’s diagnosis. Overall, this study sought to identify any effect to both DXA metrics and fracture risk probability output as posture changes by small increments of 3°. The results from the present study suggest that clinicians can be less worried about changes that are less than 9° as there was no effect on either the fracture risk tool or standard DXA outcomes and could form the foundation of enhanced patient positioning guidelines for clinicians. These data can lead to enhanced guidelines on how precisely patients should be positioned for consistent scanning to prevent misdiagnoses, with the end goal being to ensure accurate diagnoses during clinical practice.
Footnotes
Acknowledgements
The authors would like to thank Glen Walencik (DXA technologist) with help scanning the specimens at the Hamilton Osteoporosis Clinic, as well as Adam Steacy for his help with designing and building the positioning jig.
Declaration of conflicting interests
The author(s) declared no potential conflicts of interest with respect to the research, authorship, and/or publication of this article.
Funding
The author(s) disclosed receipt of the following financial support for the research, authorship, and/or publication of this article: This research was supported by the Canadian Institutes of Health Research (CIHR) grant [number PJT-180543].