
Abstract
Osteoporosis, a common bone disease in older adults, is associated with low bone mineral density (BMD) and an increased risk of fractures. While fracture risk is often assessed using T-scores derived from dual-energy X-ray absorptiometry (DXA) scans, these measures are not fully effective in identifying individuals at greatest risk. To address this, a Statistical Shape and Appearance Modeling (SSAM) tool was previously developed to analyze femur shape and BMD distribution and demonstrated superior fracture risk prediction compared to T-scores using hip DXA scans exported in JPG format. The present study aimed to evaluate whether changes in DXA-imaging protocol (hip protocol vs. High-Definition Instant Vertebral Assessment (IVA-HD)) may influence the image and the SSAM tool’s fracture risk predictions. The effect of image file type (JPG vs. PNG) was also explored, as native formats such as Digital Imaging and Communications in Medicine (DICOM) cannot be readily exported or saved in large databases. DXA scans from 36 subjects and seven cadaveric femurs were analyzed across four imaging conditions (file types and imaging protocols). Structural Similarity Index Measures (SSIM) quantified image differences, and Bland-Altman plots assessed agreement in fracture risk predictions. Minimal differences were found in SSAM tool outputs across protocols and file types. Higher-resolution scans (IVA-HD) and lossless file types (PNG) did not improve the accuracy of risk predictions compared to the standard hip protocol in JPG format. These findings suggest that the SSAM tool is robust to variations in imaging conditions, supporting its use with standard DXA imaging protocols and file formats.
Keywords
Introduction
Osteoporosis is a common bone disease in older adults associated with low bone mass. 1 It is clinically diagnosed using a T-score from a dual-energy X-ray absorptiometry (DXA) scan. The T-score is calculated as the number of standard deviations (SD) between the bone mineral density (BMD) of the subject under consideration and the average BMD of a healthy young adult. 2 A T-score of −2.5 or lower, representing 2.5 SD or more below the average BMD of a healthy young adult, is indicative of osteoporosis. As osteoporosis is associated with an increased risk of fracture, 1 T-scores, derived from BMD measurements, have been used as metrics for predicting fracture risk and guiding interventions such as anti-resorptive medications. 3 However, these measures are not entirely effective at identifying those at greatest risk of fractures. 4
Recent developments have used image processing techniques to extract more information about the geometry of the femur and the distribution of the BMD from standard DXA scans.5–7 Previous work from our group demonstrated a new technique's effectiveness in predicting fracture.5,8 This tool uses 2-dimensional (2D) statistical shape and appearance modelling (SSAM), which analyses the shape and density distribution of the femur to predict hip fracture risk.5,8 Trained and tested on 192 participants from a longitudinal study named CaMos (Canadian Multicentre Osteoposis study), it correctly predicted 78% of the hip fracture cases, demonstrating superior performance compared to the T-score, which predicted only 36% of the fractured cases. 5
Currently, the clinical standard DXA protocol is referred to as a Standard Hip scan, 9 a widely used scanning protocol to assess proximal femur bone mineral density. This protocol provides a complete DXA report with T-score, BMD, bone mineral content (BMC) and area for all regions specified. 10 An alternative protocol, High-Definition Instant Vertebral Assessment (IVA-HD), provides a rapid, low-dose, single-energy image with double the resolution than the standard hip protocol.9,11,12 Originally, this DXA protocol was developed to identify spine fractures, as these were hard to detect in a regular anterior-posterior (AP) Spine protocol. 11 Due to the high-resolution image obtained using an IVA-HD protocol, this protocol may be useful for applications other than spine assessment. However, in its present form, the IVA-HD protocol does not provide information about BMD (or T-score).
File types also play an important role in the overall quality of the image. Regardless of manufacturer, most medical images are stored in an electronic format called DICOM (Digital Imaging and Communications in Medicine). This allows for easier exchange between hardware platforms.13,14 A DICOM file is not readily usable for analysis, as it contains metadata that includes subject demographic information, acquisition parameters, unique identifiers, as well as the actual image data.13,14 DICOM files also tend to be large as they contain raw (i.e. pixel-by-pixel BMD values), high-resolution data 13 and, as such, are often compressed to reduce the overall file size for long-term storage. There are two main types of image compression, lossless and lossy. 13 Lossless compression (e.g. Portable Network Graphics (PNG) and Tag Image File Format (TIFF) formats) reduces image file size without losing information by employing techniques such as replacing repeated identical values in the dataset with a shorter representation, as in run-length encoding, or other methods that ensure clear decoding while preserving all data. 13 However, this process is computationally intensive and can lead to slower opening of compressed files. 13 Lossy compression (e.g. Joint Photographic Experts Group (JPG) format) achieves higher compression ratios by selectively removing certain data, such as redundant or non-critical information, from the image, thereby further reducing the file size compared to lossless compression. This has disadvantages associated with the image quality, where JPGs are often compressed up to 1/20th of the original image file size. 15 However, for practical reasons, DXA scans are frequently exported to JPG format to reduce storage space, as in longitudinal datasets such as the Canadian Longitudinal Study on Aging (CLSA), which contains approximately 50,000 hip DXA scans. 16
The SSAM tool was developed using clinical standard hip protocol DXA scans in JPG format.5,8 Higher resolution images may provide greater visual clarity and finer detail, which could ultimately improve the accuracy and quality of the shape and appearance models developed using image processing techniques. This may be particularly important for capturing subtle variations in shape and density. As such, it is important to assess whether higher quality images would lead to altered tool performance, which would change the required standard image for future clinical implementation or require re-training on altered images. While raw formats such as DICOM or Neuroimaging Informatics Technology Initiative (NIfTI) provide uncompressed, high-resolution data, the tool does not currently support these formats. This limitation stems from its original design to process widely used image file types like JPG, PNG, and TIFF, as these formats are more accessible for clinical use and facilitate data integration from longitudinal studies and clinical datasets (e.g., CLSA). As a result, the current study focused on evaluating the SSAM tool’s robustness under clinically relevant imaging conditions, testing compressed file types that align with its intended application.
The objective of this study was to evaluate how scanning protocols and file types impact the risk of fracture as assessed using the SSAM tool in order to identify whether improved performance may be obtained by moving to a higher quality source image.
Methods
Ethics approval was received from the Hamilton Integrated Research Ethics Board (HIREB 12949; approved Jul 12, 2021) and all scans performed using a Hologic Discovery A system (Hologic Inc., Marlborough, MA, USA). This study was conducted in two phases (Figure 1), with the first phase using subjects recruited from an osteoporosis clinic. Six subjects (1M/5F, age 69.5 ± 7.7 years), who were scheduled for their regular hip DXA scan (Standard Hip protocol), received a second scan using the IVA-HD protocol. The number of subjects was limited due to the small additional radiation exposure associated with this study. Standard hip DXA scans were obtained for thirty additional subjects (3M/27F, age 64.7 ± 11.3 years), which facilitated the investigation of file types on a larger dataset.
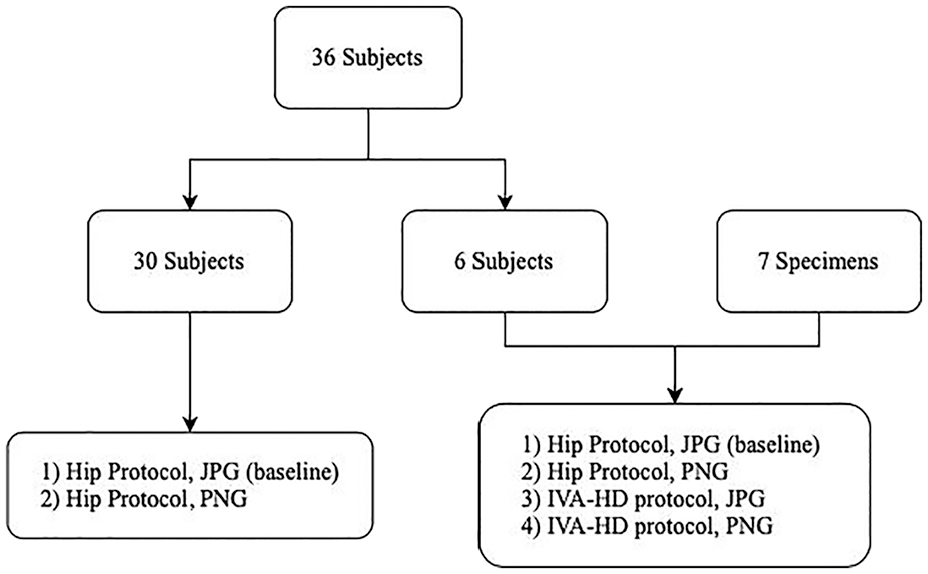
Flowchart demonstrating the number of subjects and specimens in the study, and the image types obtained for each group.
Due to the limited number of subjects receiving scans using both DXA protocols, the dataset was augmented by including cadaveric femurs (second phase). Seven cadaveric femurs (i.e. specimens) (5M/2F, age 59.9 ± 11.9 years) were supported in a horizontal (neutral) orientation over a 15 cm clear bucket filled with water to simulate the attenuation of muscle and fat.17,18 Each femur was DXA scanned using both a standard hip and an IVA-HD protocol.
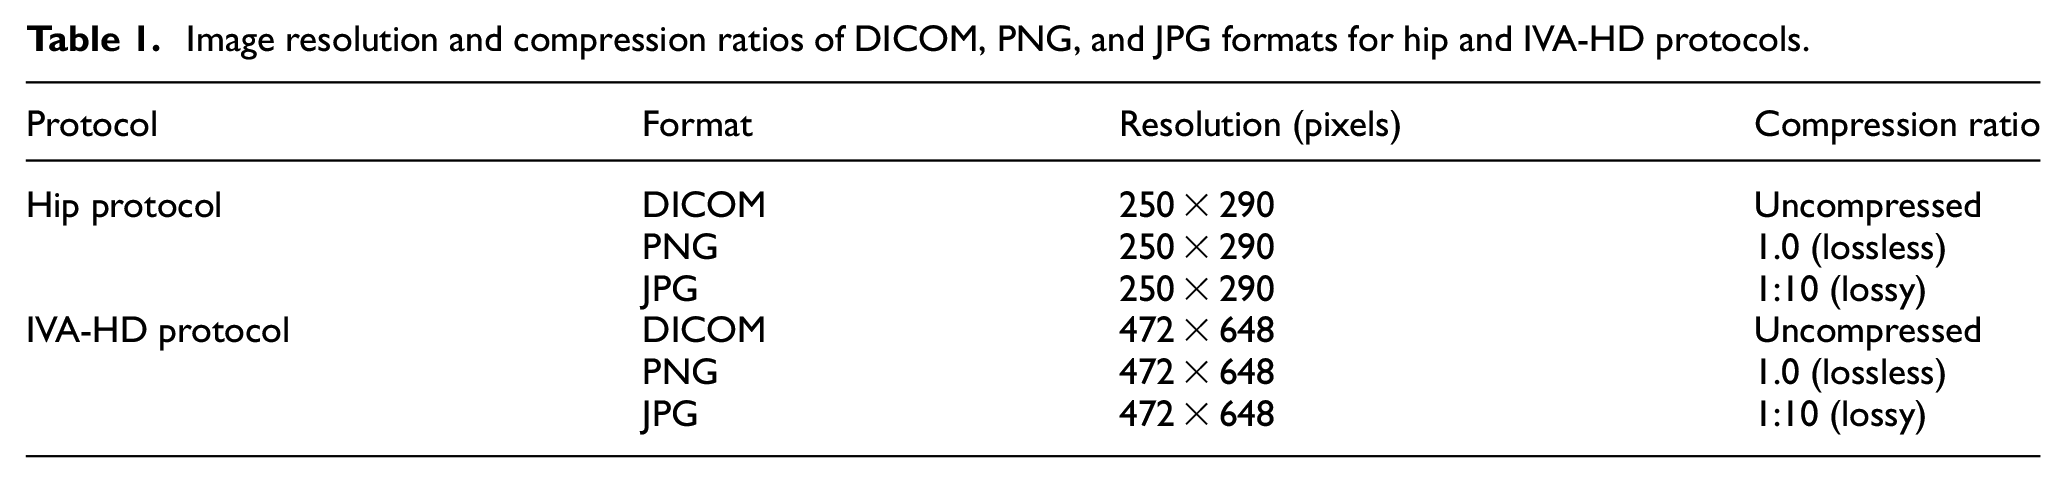
The DXA images used in this study were exported from Horos™ (Horos Project, Geneva, Switzerland), a free and open-source medical image viewer developed by the Horos Project (horosproject.org). Horos was also used to anonymize the data prior to export. The images were exported in DICOM format and converted to PNG and JPG formats using MATLAB's Image Processing Toolbox (MATLAB R2020a, MathWorks, Natick, Massachusetts, US). The original uncompressed DICOM images were evaluated with resolutions of 250 × 290 pixels for the hip protocol and 472 × 648 pixels for the IVA-HD protocol. These resolutions, reflecting the image sizes provided by the DXA scanner, were preserved during the conversion to PNG and JPG formats. The MATLAB conversion process applied a 1:10 compression ratio for JPG and a 1.0 compression ratio for PNG (Table 1).
Image resolution and compression ratios of DICOM, PNG, and JPG formats for hip and IVA-HD protocols.
For each DXA scan in both protocols, the pixel-by-pixel BMD values were directly extracted from the scanner and correlated with pixel intensities, forming a visual map of BMD distribution. Subsequently, these maps were converted in two commonly used file formats, JPG and PNG, which are supported by the SSAM tool and frequently used in clinical workflows and large-scale datasets like the CLSA. While raw formats such as DICOM or NIfTI provide uncompressed pixel-by-pixel data, their exclusion from this study was due to substantial challenges in interfacing DXA scanners with MATLAB, where the tool is entirely based, largely because of manufacturers’ proprietary software that limits exporting images in these formats.
To quantify the similarity of images, a metric called Structural Similarity Index Measure (SSIM) was calculated using the MATLAB Image Processing Toolbox (MATLAB R2020a, MathWorks, Natick, Massachusetts, US). This analysis was performed on images derived from two different scanning protocols (hip protocol and IVA-HD) and exported in two different file types (JPG and PNG) for each subject or specimen. SSIM was based on three key measures 19 : luminance, contrast, and structure. Luminance comparison involves assessing the mean and variance of pixel values in each image, measuring their similarity in brightness. Contrast comparison evaluates the similarity in contrast by considering the standard deviations of pixel values. Finally, structure comparison examines the similarity in structure, including patterns and textures, using the covariance of pixel values. These components are combined to calculate the overall SSIM index, which ranges from -1 to 1, where positive one indicates that the two images are identical, zero indicates no similarity, and negative one indicates they are very different (i.e., perfect anti-correlation). 19 This was done on all samples (i.e. 7 specimens and 6 subjects) that had the four scans comparing the following pairs of images: (1) Hip protocol in PNG versus JPG format, (2) IVA-HD protocol in PNG vs. JPG format, (3) Hip protocol in PNG format vs. IVA-HD protocol in PNG format, (4) Hip protocol in JPG format versus IVA-HD protocol in JPG format. Also, Bland-Altman plots were created to compare the SSIM of each newly investigated image type (hip protocol in PNG, IVA-HD protocol in JPG, and IVA-HD protocol in PNG) to that from hip protocol in JPG format.
The SSAM tool was applied to each image as designed in previous work.5,8 In summary, the first step was to establish a template model using training data, which included 189 subjects from CaMos. Landmarks were placed on the contour of the proximal femur in all training images. The x and y coordinates of the landmarks across the entire training set were averaged to create a template geometry model representing the mean shape of the proximal femur. Principal Component Analysis (PCA) was then applied to the template geometry model to determine the main modes of variation (Statistical Shape Modeling (SSM)). After, each hip’s geometry was warped into the template model. Pixel values were read from the warped images, normalized, and saved in a matrix. This matrix represented the BMD distribution template model, which was constructed by normalizing the pixel intensity values from the training set images after aligning them to the mean geometry of the proximal femur, following the methodology detailed by Jazinizadeh et al.5,8 This provided a standardized representation of BMD variation that served as a baseline for analyzing the BMD distribution in new scans. PCA was then applied to the pixel intensity matrix to determine the main modes of variation (Statistical Appearance Modeling (SAM)). The main modes of variation were identified by applying PCA to the combined SSM and SAM models to construct the SSAM, representing both the combined geometry and BMD distribution of the hip and proximal femur. The weights of each mode indicated how much it contributed to the overall variability in the proximal femur geometry and BMD distribution.
For each scan obtained in the present study, a similar process was followed, whereby landmarks were placed on the contour of the femur, and the difference between it and the template model quantified. Weights associated with the main modes of variation were then calculated. The SSAM tool includes an rigid registration process during both training and fracture risk assessment. This process aligns each DXA scan to a mean template model using Procrustes Analysis, which corrects for differences in translation, rotation, and scaling. For training, anatomical landmarks on the femur’s shape are identified, and each scan is aligned to the template model by minimizing differences in these landmarks. New scans are similarly aligned to the template during fracture risk prediction, ensuring consistency across all datasets. This registration method standardizes the images, reducing variability due to positional or size differences. 8 Finally, the SSAM tool used logistic regression by including the weights of each main mode of variation from the SSAM and other subject demographic data (i.e. age and total BMD) to determine the fracture risk.5,8 This was reported as a value between zero (i.e. 0%) (no risk) and one (i.e. 100%) (high risk).
The standard hip protocol JPG images were used as the reference for this study because the SSAM tool was originally developed and tested by Jazinizadeh et al.5,8 using this format. Bland-Altman plots were also created to compare the predicted fracture risk of each newly investigated image type (hip protocol in PNG, IVA-HD protocol in JPG, and IVA-HD protocol in PNG) to that from baseline images (hip protocol, JPG format).
Results
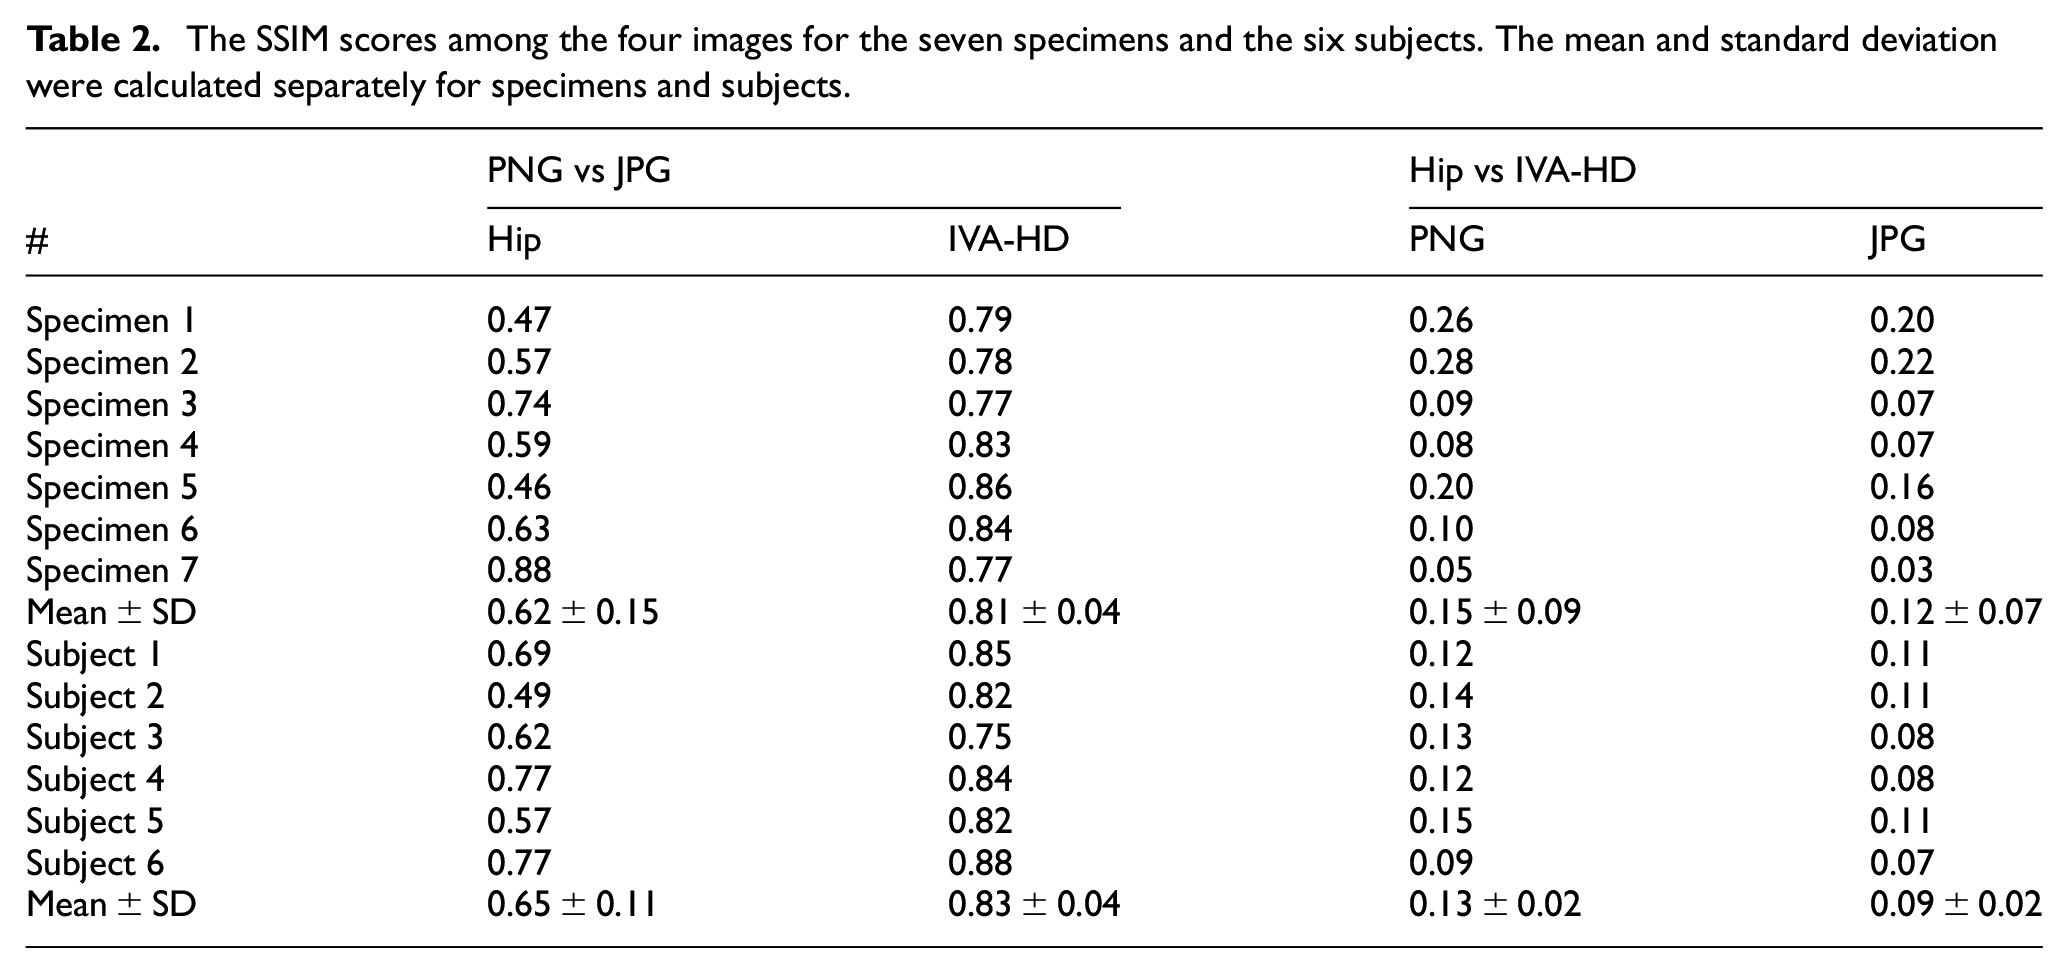
Four image types were obtained for seven femurs (i.e. specimens) (Figure 2) and six subjects (Figure 3). The SSIM score showed substantial differences among the four images (Table 2). The SSIM was the lowest (indicating lowest similarity) for images within different protocols, and this was the same for both specimens and subjects. The SSIM was highest (indicating greatest similarity) for images within the same protocol, and this was the same for both specimens and subjects. The SSIM of the PNG format was slightly higher than that of JPG, by an average of 0.03 for specimens (0.15 ± 0.09 for PNG vs. 0.12 ± 0.07 for JPG) and 0.04 for subjects (0.13 ± 0.02 for PNG vs. 0.09 ± 0.02 for JPG). While this represents a modest improvement in image similarity, the differences remained minimal overall.
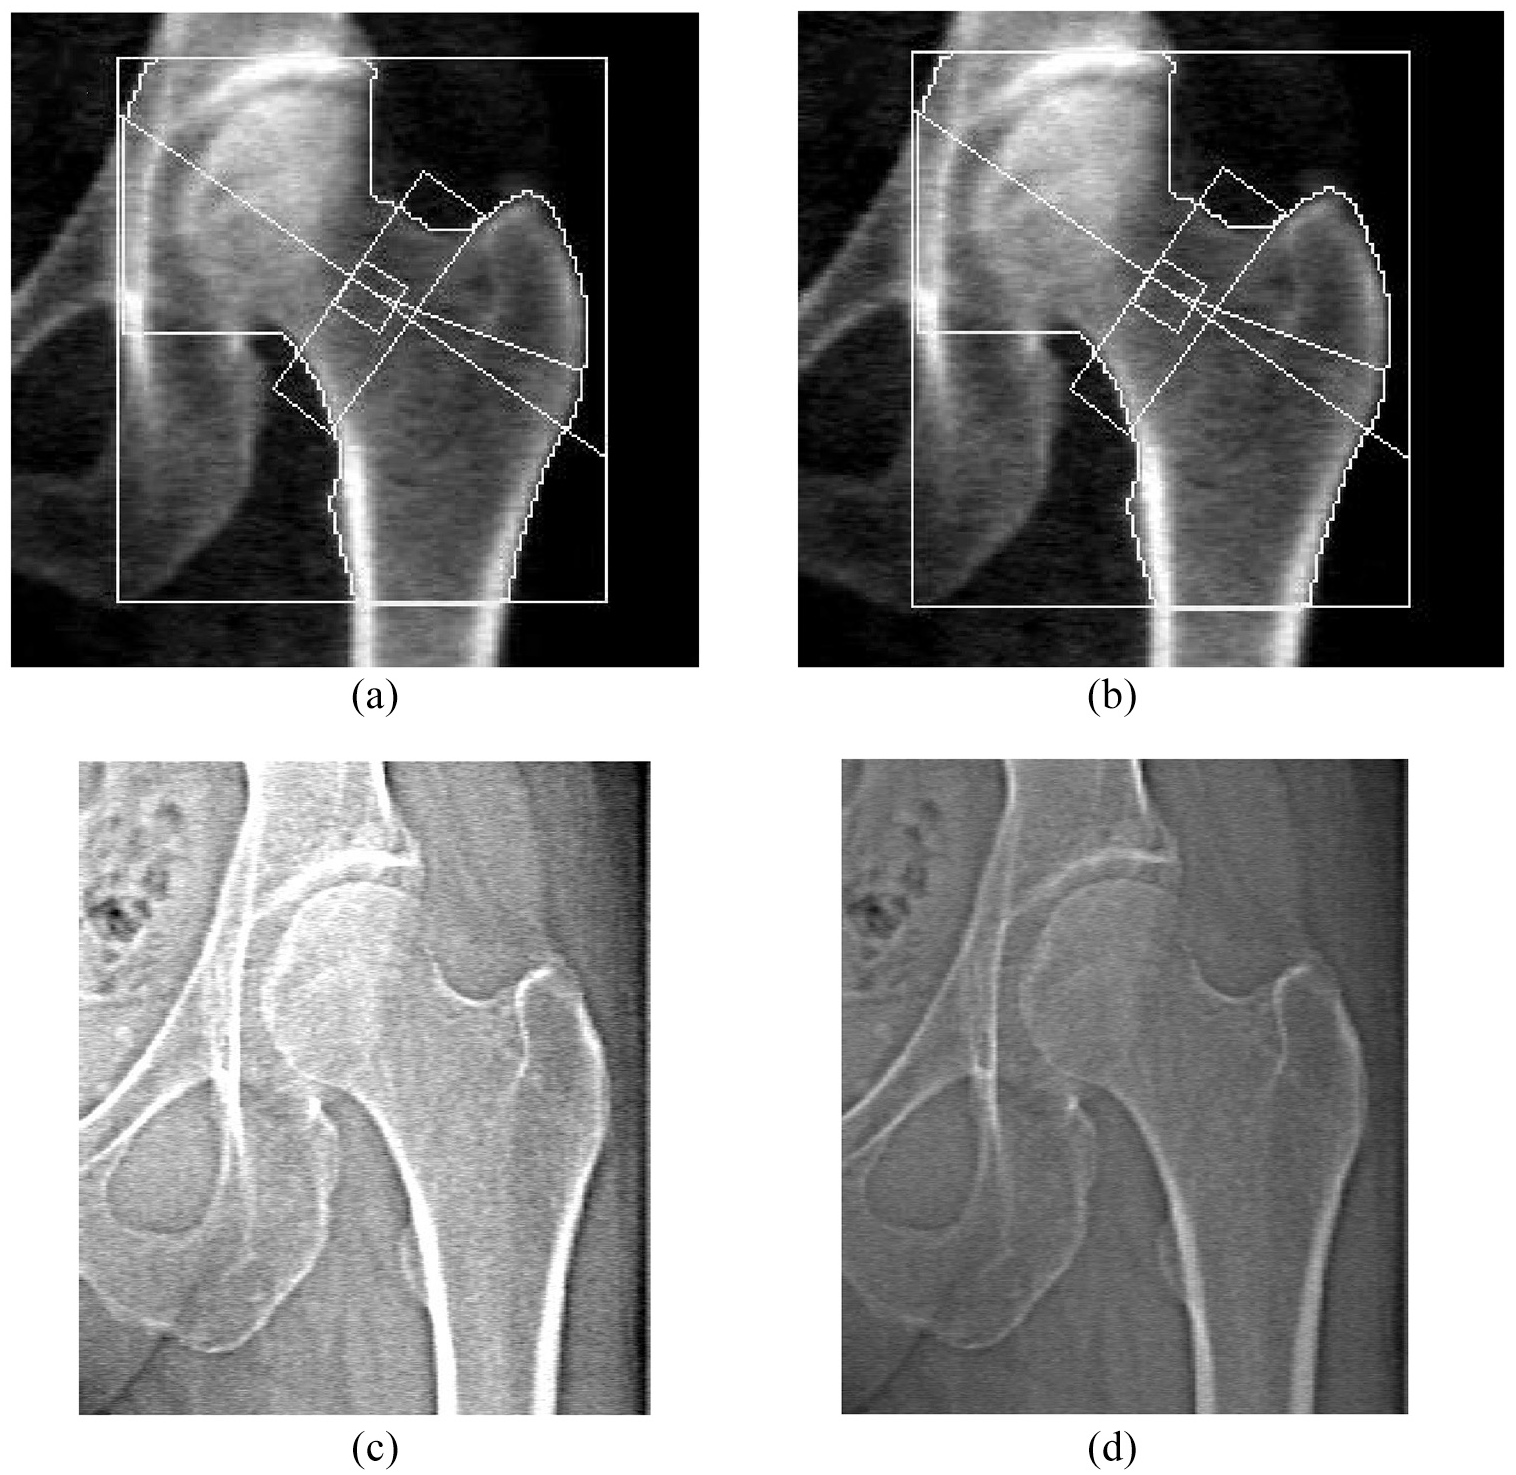
A visual representation of the four image types that were assessed for an example femur (“Specimen 4”): (a) Hip protocol in JPG format, (b) Hip protocol in PNG format, (c) IVA-HD protocol in JPG format, and (d) IVA-HD protocol in PNG format. Images (c) and (d) were cropped to display regions comparable to those in images (a) and (b).

A visual representation of the four image types that were assessed for an example subject (“Subject 3”): (a) Hip protocol in JPG format, (b) Hip protocol in PNG format, (c) IVA-HD protocol in JPG format, and (d) IVA-HD protocol in PNG format. Images (c) and (d) were cropped to display regions comparable to those in images (a) and (b).
The SSIM scores among the four images for the seven specimens and the six subjects. The mean and standard deviation were calculated separately for specimens and subjects.
The Bland-Altman plots quantified the agreement of Structural Similarity Index Measure (SSIM) scores across different imaging protocols and file formats. In the comparison between Hip protocol JPG and Hip protocol PNG (Figure 4(a)), the mean difference was negligible (0.01), with narrow limits of agreement (±0.03), indicating high consistency between these two formats. Both specimens and subjects showed minimal variability, with no significant outliers, suggesting that compression differences between JPG and PNG formats did not substantially affect the SSIM scores.
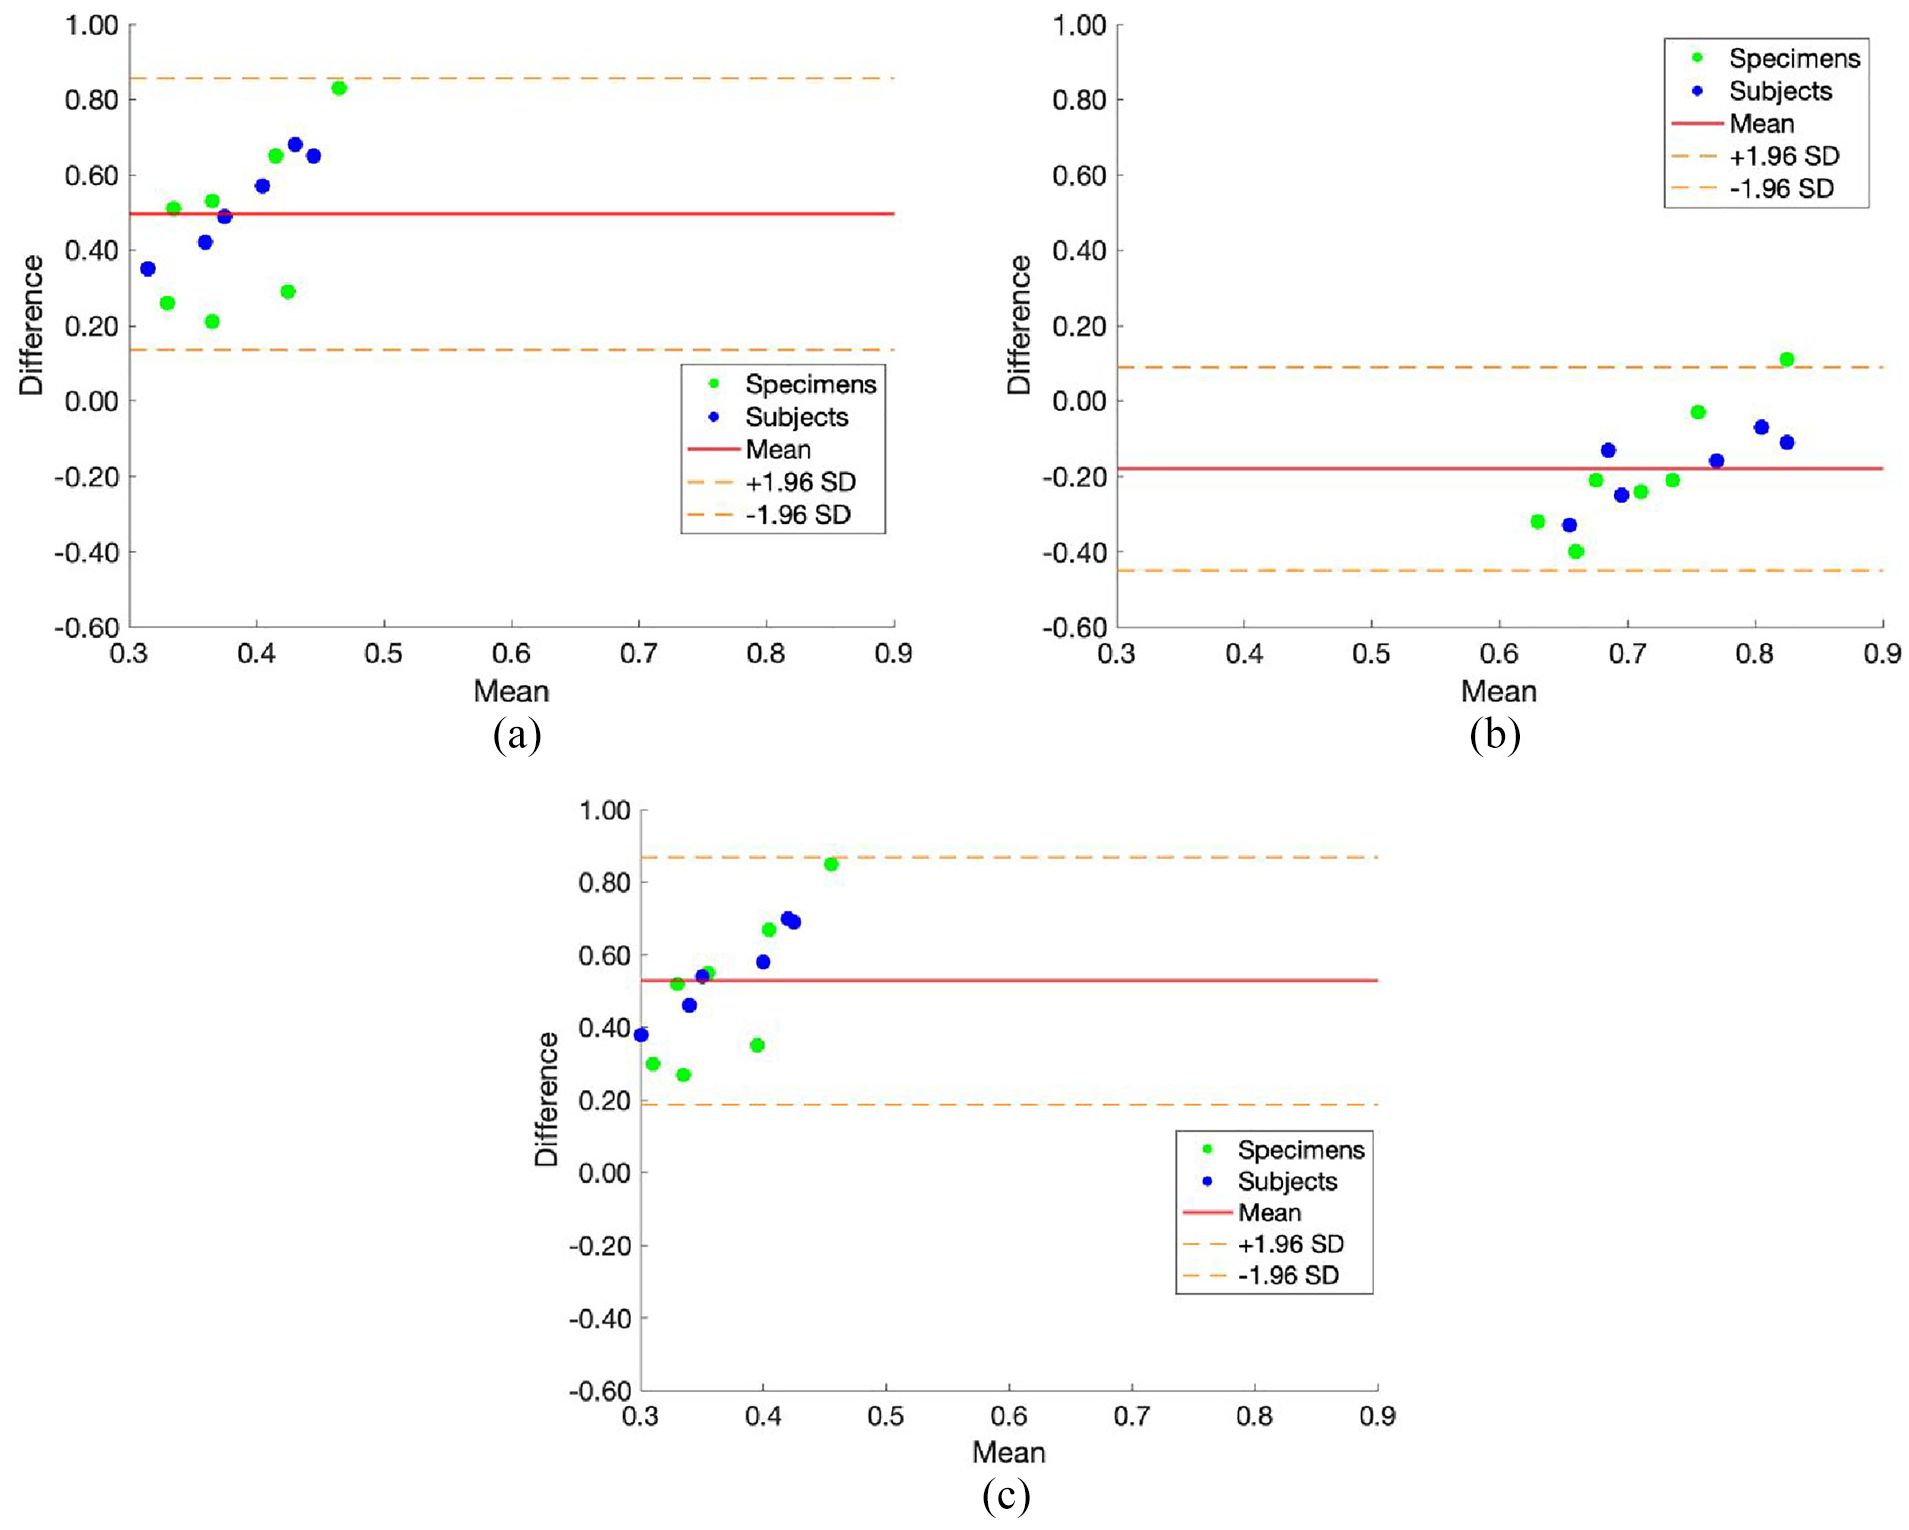
Bland-Altman plots illustrating the differences in Structural Similarity Index Measure (SSIM) scores across different imaging protocols and file formats. The three plots represent: (a) Hip protocol JPG versus Hip protocol PNG, (b) Hip protocol JPG versus IVA-HD protocol JPG, and (c) Hip protocol JPG versus IVA-HD protocol PNG. Data points distinguish between specimens (green dots) and subjects (blue dots). The solid red line indicates the mean difference, while the dashed orange lines represent the limits of agreement (±1.96 SD).
When comparing Hip protocol JPG with IVA-HD JPG (Figure 4(b)), the mean difference increased slightly to −0.10, with broader limits of agreement (±0.20). This result reflects the increased variability introduced by the higher resolution of the IVA-HD protocol (472 × 648 pixels) compared to the Hip protocol (250 × 290 pixels), although the agreement remained within acceptable bounds. Specimens and subjects exhibited similar patterns of variability, indicating that the observed differences were systemic and not specific to either group.
Finally, the comparison between Hip protocol JPG and IVA-HD PNG (Figure 2(c)) yielded a mean difference close to zero (0.02) with limits of agreement similar to those observed in the Hip protocol PNG comparison (±0.03). The findings suggest that PNG’s lossless compression effectively preserved the benefits of the IVA-HD protocol’s higher resolution. Across all comparisons, the results demonstrated that the SSIM differences between protocols and formats were minor.
For all specimens (cadaveric femurs), the SSAM tool output registered each scan as high risk (Table 3), and the fracture risk was overall not affected by file type. The absence of the pelvis and surrounding tissues in the scans, combined with the use of water to simulate soft tissue, impacted fracture risk assessment as it may not fully replicate the X-ray attenuation characteristics of living bodies. Consequently, comparisons were performed with each specimen serving as its own control. For “Specimen 5,” the IVA-HD protocol in JPG format produced a very slightly lower risk (0.9998), which was only 0.02% lower than the 1.0 risk determined using the baseline hip protocol with JPG format. Notably, the only salient donor characteristic identified for “Specimen 5” that differed from the other specimens was its substantially higher T-score of 1.2.
Total T-score and osteoporosis medication status for each specimen and subject. The predicted fracture risk output of the SSAM tool ranging from zero (i.e. 0%) (no risk) to one (i.e. 100%) (high risk) is reported for each image. (a) refers to the isolated femurs and (b) refers to the subjects. “Hip” denotes hip protocol, “HD” denotes “IVA-HD” protocol and “_JPG” or _PNG denotes the file type to which the protocol was exported. Cells with “N/A” denote those that did not undergo IVA-HD protocol scans. “Med” and “Non-med” denotes medicated and non-medicated.
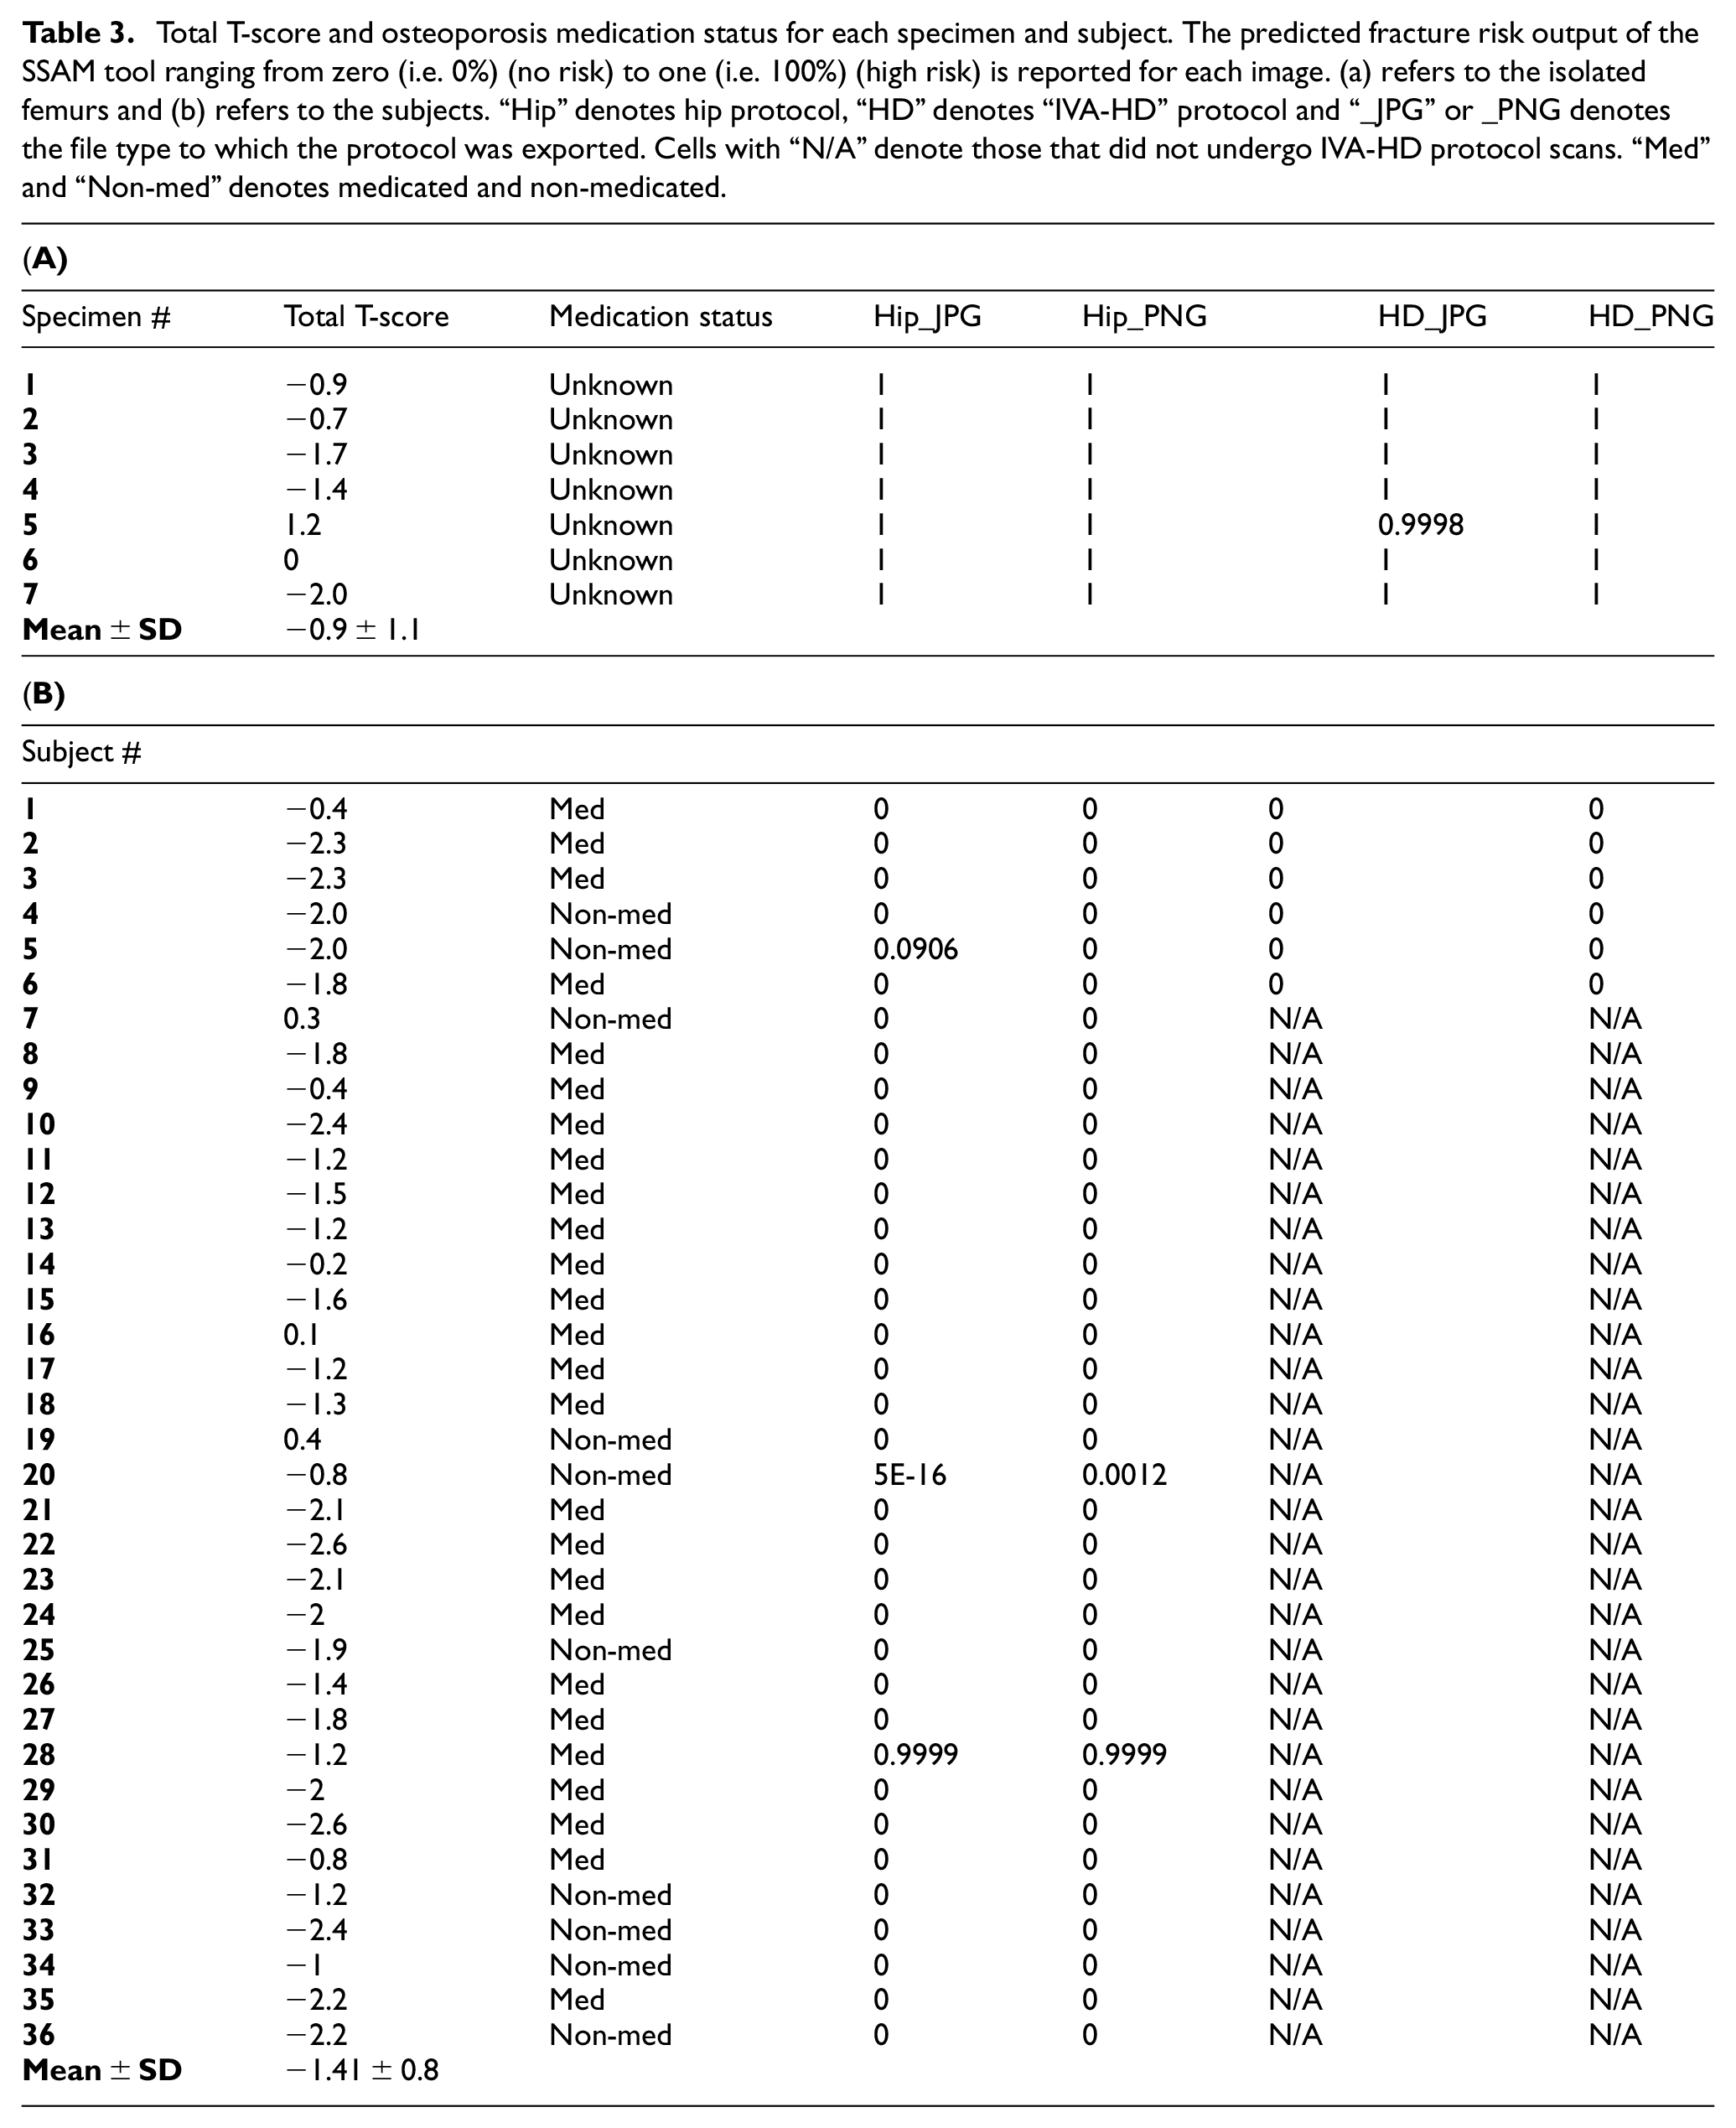
The vast majority of the thirty-six subjects had osteopenia (i.e. low bone density), but two subjects were osteoporotic. Most of the subjects (26 out of 36) were on some form of osteoporosis medication, and all types of these osteoporosis medications were combined in the analysis, with only 10 subjects not taking any medication (Table 3).
For the six subjects who received the additional IVA-HD scan, all of them registered as low risk, which is particularly interesting given the wide range of T-scores they had (Table 3). One of the six subjects, “Subject 5,” exhibited a change in fracture prediction from the hip protocol in JPG format (baseline). “Subject 5” remained low risk for all four images; however, this subject’s assessed fracture risk dropped from 0.09 (or 9%) at baseline to 0 (or 0%) for the other three images (i.e. Hip_PNG, IVA-HD_JPG, and IVA-HD_PNG). There were also no salient characteristics identified about Subject 5, in comparison to the other subjects.
Finally, for the 30 additional subjects whose scans were used to compare file types, all except one (“Subject 28”) registered low risk (Table 3). This subject was classified as high risk, and this was unaffected by protocol or file type. One other subject “Subject 20,” had a slight increase of 0.0012 (or 0.12%) in fracture risk probability when comparing Hip protocol in JPG format to PNG format.
A Bland-Altman plot demonstrates agreement between two quantitative measurements by displaying the mean difference on the y-axis and the average of the two methods on the x-axis. The plot includes limits of agreement, representing the range within which 95% of the differences between the measurements fall. In an ideal plot, data points should cluster closely around zero on the y-axis, indicating minimal bias. Narrow limits of agreement should be present, suggesting a high level of agreement. 20
For the Bland-Altman plots, the data for the specimens and subjects were merged in order to create effective plots with an increased sample size. Since the SSAM tool uses logistic regression, the fracture risk probability result will usually lie closer to zero (no risk) or one (i.e. 100% high-risk). For this reason, multiple subjects had similar predictions and overlapped on the Bland-Altman plots (Figure 5).
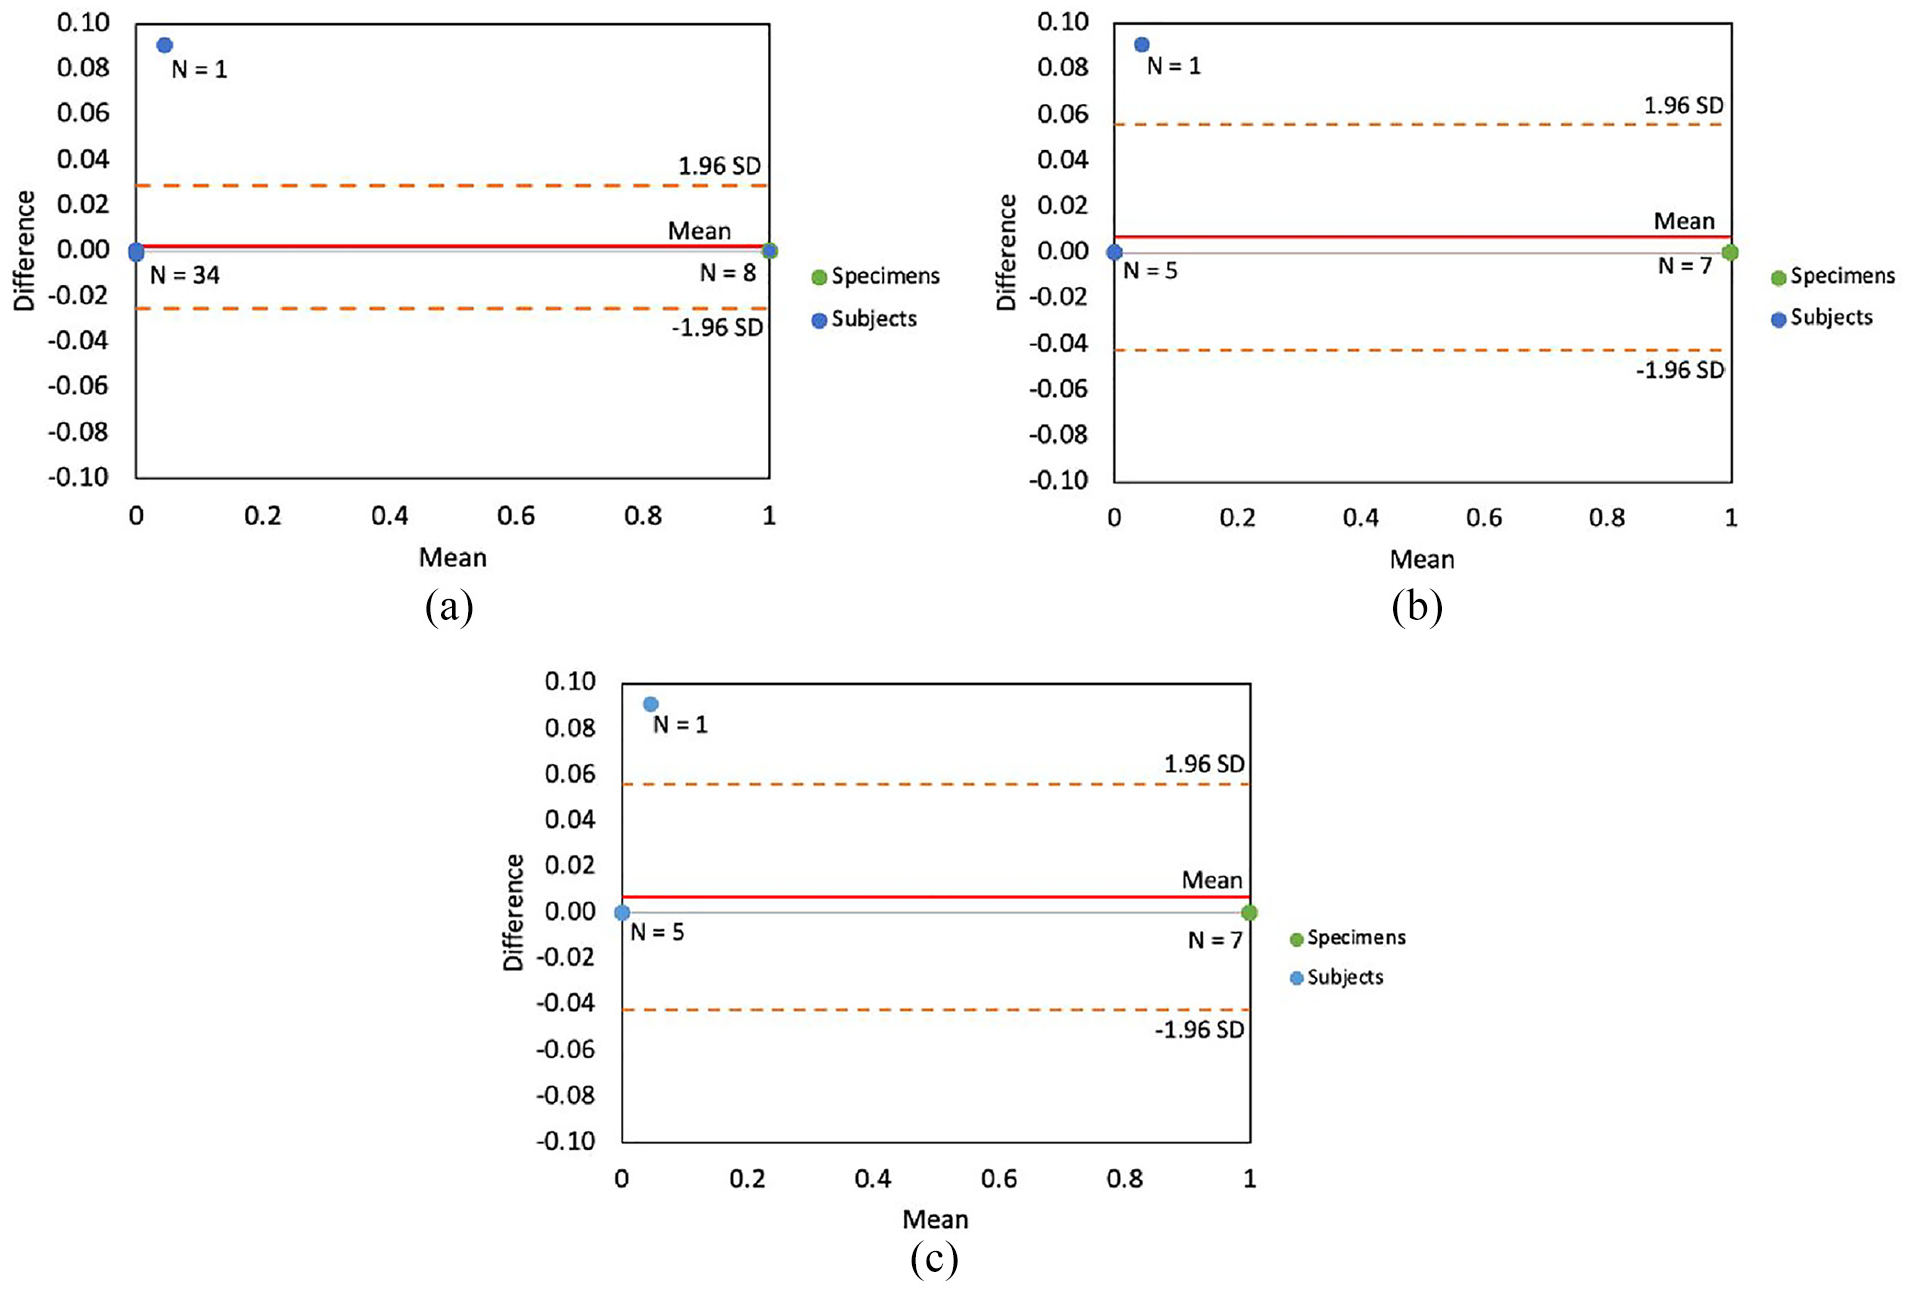
Bland-Altman plots illustrating differences between the baseline image, hip protocol in JPG format and (a) hip protocol in PNG format (N = 36 subjects & 7 specimens), (b) IVA-HD protocol in JPG format (N = 6 subjects and N = 7 specimens), and (c) IVA-HD protocol in PNG format (N = 6 subjects and N = 7 specimens).
When comparing Hip protocol in JPG to Hip protocol in PNG, the risks showed excellent agreement (Figure 5(a)), with a mean of 0.002 (red). The SD was very small, with limits of agreement (orange) of 0.029 and −0.025. Only Subject 5 fell outside the 95% (1.96 SD) limits of agreement, while all other subjects were close to the average difference, indicating minimal variability and differences between the calculated fracture risk of the two images.
When comparing Hip protocol in JPG to IVA-HD protocol in JPG, the fracture risk also showed excellent agreement (Figure 5(b)), with a mean of 0.0069 (red). The SD was larger (in comparison to Figure 5(a)), with limits of agreement (orange) of 0.056 and −0.042. The limits were larger due to the single outlier having a greater influence (as a result of the smaller sample size). Since the assessed risk did not change between file types for the IVA-HD scans, the Bland-Altman plots were thus identical when comparing Hip protocol in JPG to IVA-HD protocol in PNG (Figure 5(c)).
Discussion
Overall, the aim of this study was to assess the impact of scanning protocols and file types on fracture risk assessment using the SSAM tool.5,8 The goal was to determine if enhanced performance could be achieved by transitioning to a higher quality image. With the tool developed using a clinical standard protocol (Hip protocol) and a widely used file type (JPG), differences found in higher quality images could lead to a change in the required standard of imaging care for future clinical implementation or require retraining on altered images, a significant challenge due to limited availability of these types of scans. The analysis highlighted differences in image resolutions between the hip protocol (250 × 290 pixels) and the IVA-HD protocol (472 × 648 pixels). These resolution differences, along with the effects of compression in JPG format, did not significantly impact the fracture risk predictions made by the SSAM tool. It is worth noting that the hip protocol produced smaller images with a focus on the hip joint, which might theoretically enhance the detection of subtle variations in bone geometry or density. However, within the tested resolutions and formats, the SSAM tool demonstrated robustness to variations in image quality. Future research could examine the impact of resolutions beyond the tested range, particularly by comparing these protocols to advanced imaging modalities such as QCT or synchrotron CT, which offer far greater detail. Despite notable differences in image dimensions and quality, the IVA-HD protocol produced results comparable to the hip protocol, suggesting that higher-resolution scans had limited influence on the assessed fracture risk.
The nature of the JPG file type is a compressed file, which provides a lower-quality image than other file types and has a smaller size. 15 This file type is also easily and commonly exported from a DXA machine. The choice to evaluate compressed file types (JPG and PNG) reflects the SSAM tool’s current design and its clinical applications. Given that JPGs are the standard export format for DXA scans in longitudinal datasets like CLSA, this study aimed to assess the tool’s robustness within these practical constraints. While uncompressed formats like DICOM or NIfTI offer higher fidelity, the SSAM tool was originally developed and validated using compressed formats.5,8 This design choice limits its ability to directly analyze raw medical images, which could introduce additional variability or insights into fracture risk assessment. Future development of the SSAM tool to support uncompressed formats would enable a more comprehensive evaluation of its performance across a wider range of imaging conditions, potentially enhancing its adaptability to other clinical and research settings.
The SSIM highlighted the quantitative differences between protocols and file types. Protocol had a larger effect on image agreement than file type. Subjects showed higher similarity scores across file types, suggesting movement during scans. Specimens had consistent scores, indicating minimal movement and highlighting protocol differences. This is unsurprising given that there may have been differences in positioning. To ensure that differences were not due to scanning area, the images were aligned and resized for SSIM analysis, ensuring a direct comparison of the same area. Additionally, these scans were taken separately, unlike file types that were derived from one scan and exported in multiple ways. While SSIM is widely used for comparing image similarity,21,22 it has some limitations when applied to medical images. 23 Some of these include the insensitivity of the luminance term in the SSIM calculation to regions with high or low intensities, and the underestimation of the variance and structure terms near hard edges. 23 For all DXA images, the pixel-by-pixel BMD values were exported from the DXA scanner and subsequently converted to JPG and PNG, allowing true pixel values to be compared instead of “fake” gray scale values.
The Bland-Altman plots further underscored the robustness of SSIM scores across imaging protocols and formats, reinforcing the consistent performance of the SSAM tool under different imaging conditions. The negligible mean differences observed between Hip protocol JPG and PNG, as well as Hip protocol JPG and IVA-HD PNG, indicate that lossless compression (PNG) effectively preserves image quality, even when transitioning from the lower resolution of the Hip protocol (250 × 290 pixels) to the higher resolution of the IVA-HD protocol (472 × 648 pixels). The slightly larger variability in the comparison between Hip protocol JPG and IVA-HD JPG suggests that the increased resolution of the IVA-HD protocol introduces subtle differences in image structure captured by the SSIM metric. However, these differences remained within acceptable bounds, indicating that neither resolution nor compression significantly compromises the SSAM tool’s ability to analyze images. These findings demonstrate that while SSIM is a valuable metric for evaluating image similarity, it may not fully capture the clinical relevance of subtle variations in image quality or compression artifacts.
Subject recruitment (and thus sample size) was one of the main challenges faced in this study. General clinical protocol is to scan patients using the hip protocol, and adding an IVA-HD scan does introduce a small increase in radiation. 9 As such, the subjects receiving extra scans was limited to six. Additionally, the study population included more females than males, reflecting the higher prevalence of osteoporosis in this group. While this demographic aligns with the target population for osteoporosis screening, it introduces potential sex-related bias in BMD values. However, the SSAM tool considers additional factors, such as femur shape and density distribution, which are independent of BMD alone. This reduces its sensitivity to sex-related differences in BMD. Future studies with a more balanced sex distribution would further validate the tool's robustness.
To increase the sample size without health risk concerns, seven cadaveric specimens were also scanned. This had the notable advantage of ensuring no movement between protocol scans, which could have been a factor in subjects. However, nearly all cadaveric specimens were classified as high risk for fracture (Table 3), which contrasts with the lower fracture risk scores observed in most living subjects (except for Subject 28). This discrepancy reflects potential bias introduced by the study design. Cadaveric specimens were scanned without a pelvis and with water attenuation to simulate soft tissue, which may not fully replicate the X-ray attenuation characteristics of a living body. Additionally, the SSAM tool was trained on data from living subjects, making it more sensitive to their anatomical features. Many living subjects were also on osteoporosis medications, which likely contributed to their lower fracture risk scores. This approach, while acceptable for preliminary analysis and in line with previous imaging studies 24 , may not fully capture the nuanced variability in fracture risk across populations. However, the use of each specimen as its own control allowed for consistent evaluation of file type and protocol effects across a wider range of scans, ensuring reliable comparisons regardless of absolute risk magnitude. Future work should include a broader subject pool, including both medicated and non-medicated individuals, to validate the tool’s robustness. Furthermore, the study design (whereby images were compared for each subject) facilitated a relative comparison, whereby any bias offset likely would have affected all images for that specimen equally.
A large number of subjects (thirty-six) participated in this study for the hip protocol JPG versus PNG comparison. They predominantly included older, osteoporotic patients who have been on osteoporosis medications, aligning well with the target population for which the tool is designed. This demographic composition, while beneficial for the tool’s applicability, resulted in a higher number of patients being assessed as zero risk due to their medication status. Since this tool uses logistic regression, most results with a zero or a one contained an actual output value around 1 × 10⁻³⁰ or 0.99 (a non-terminating decimal). This demonstrates that the calculated fracture risk for the subjects and specimens varied minimally, with different input images.
Fracture risk, as determined by the SSAM tool, was not affected by file type or protocol for most subjects. However, when comparing PNG and JPG in the hip protocol, two subjects showed changes in fracture risk compared to the baseline. One of these subjects (Subject 20) changed slightly (0.0012 or 0.12%), while Subject 5 had the largest change. This subject’s assessed fracture risk dropped from 9% in the baseline format to 0%; however, this remained as low risk. The reason for this change is unclear, as nothing abnormal was noted in this subject’s demographic information or clinical history in comparison to the other subjects (Subject 5). Also, given the low T-score and non-medical status of “Subject 5,” the presence of some degree of risk is not unexpected. One subject and one specimen were affected when comparing the IVA-HD protocol (both formats) to the baseline. One specimen (Specimen 5) had a decreased fracture risk of 0.02% when comparing baseline to IVA-HD protocol in JPG format. The same subject as before (Subject 5) was also affected when comparing the IVA-HD protocol (both formats) to baseline. This difference in “Subject 5” may be due to subject movement between the repeated scans, where the subject’s position may not have been the same for each scan. However, this was not evident in the SSIM score for “Subject 5,” as the scores for each image were similar to those of the other subjects.
Interestingly, despite “Subject 4” and “Subject 5” having similar T-scores and medication statuses, they exhibited different risk levels. The observed differences between Subjects 4 and 5 raise important questions about the potential nuances of the SSAM tool’s analysis. Both subjects were classified as low risk across most protocols and file types, but Subject 5 exhibited a change in fracture risk prediction with JPG images and was significantly outside the limits of agreement in the Bland-Altman analysis. The JPG compression method could exacerbate these differences by slightly altering pixel values, particularly in regions with high contrast or fine details it cannot account for all anatomical variability or distortions introduced by lossy compression. While a rigid registration technique was used in the development of the SSAM tool, an additional rigid registration step to align successive scans to a common reference frame was not performed in this study, which is a limitation. However, the scans were conducted immediately in sequence, so the expected movement was minimal to none. Additionally, Subject 4 and Subject 5 may differ in other demographic or clinical factors not included in the logistic regression model, such as physical activity level, previous fracture history, or bone quality. These factors, which influence fracture risk beyond T-scores or BMD distribution, could lead to discrepancies in the predictions. Also, the discrepancy between T-scores and fracture risk scores in Table 3 highlights the multifactorial nature of the SSAM tool's predictions. The variation reflects the tool’s design, which incorporates factors beyond BMD—such as medication status, femoral shape, and density distribution—to provide more nuanced predictions. These findings underscore the tool’s capability to integrate diverse clinical factors rather than relying solely on T-scores.
Bland-Altman analysis is a useful method for evaluating biases in mean differences between two techniques. 20 These plots were chosen to address the small sample size while still enabling comparison of each image type to the baseline. 25 This technique effectively identifies real differences between any two techniques without the need for additional statistical methods. When comparing the hip protocol in JPG format to the same protocol in PNG format, the two file types yielded similar results. As previously mentioned, the one subject fell outside the 95% limits of agreement. This plot demonstrated that using a higher-quality file type like PNG provides results comparable to the original technique, suggesting that using PNG for the SSAM tool may be possible, but not necessary.
When comparing the baseline technique to the IVA-HD protocol in both JPG and PNG formats, both plots showed that the mean difference between the baseline technique and each of the two separate techniques was close to zero. As before, all subjects except one (Subject 5), for both file types, were close to the mean difference, indicating no significant differences between the techniques as they produced similar results to the baseline. Also, all subjects (except ‘Subject 5’) were within the 95% limits of agreement for both techniques (IVA-HD in JPG and PNG format). If this subject were not included in the analysis, the results would indicate perfect agreement among the three images. The results from both file types for the IVA-HD protocol were identical, possibly due to the higher resolution of IVA-HD being less affected by the lossy compression of JPG. Taken together, these results suggest that the IVA-HD protocol is unnecessary for this tool (in either format) as it yielded the same results as the baseline image. Similarly, the use of a higher quality file type in the hip protocol did not improve the fracture risk outcome of the SSAM tool, and as such may be considered unnecessary, which is encouraging for the use of large datasets (such as the CLSA).
For this study, as previously mentioned, all DICOM files were converted to PNG instead of TIFF due to the similarities between the two formats. PNG was selected over TIFF due to its widespread use in clinical workflows and its compatibility with the SSAM tool, which was developed and validated using commonly available DXA file formats.5,8 While both PNG and TIFF are lossless formats, PNG files are more accessible in clinical and research contexts due to their smaller size and faster processing time, with minimal impact on image quality. To confirm the equivalence of the two formats, a hip DXA image was converted from DICOM to both PNG and TIFF separately. These images were then directly subtracted to identify any differences. The result was a zero array, indicating that the two file types are equivalent. Therefore, PNG was used in this study, and these findings would equally apply to TIFF.
The lack of impact of variations observed in Table 1, Figures 2 and 4, and T-scores on the SSAM model’s fracture risk classification can be attributed to the fundamental design of the SSAM tool. The model combines statistical shape and appearance modeling with logistic regression, focusing on geometric and density-based features extracted from the images. These clinically significant risk factors, such as BMD, femoral geometry and BMD distribution, are central to the tool's design, ensuring that fracture risk predictions remain consistent despite minor variations introduced by differences in file format, compression, or resolution. This consistency highlights the robustness of the SSAM model for clinical applications. Previous studies5,8 have demonstrated that factors such as prior fracture history, age, and total BMD—key determinants of fracture risk—are integral components of the SSAM model's logistic regression framework. Among these, prior fracture history typically plays a significant role in risk prediction and may have a greater impact than variations in image quality or protocol. It is important to note that this study was not intended to revalidate the accuracy of the SSAM tool, as its predictive performance has already been tested and reported.5,8 Instead, this study focused on assessing how changes in file type and protocol—such as the use of lossy versus lossless compression (JPG vs PNG) and variations in resolution between the Hip and IVA-HD protocols—affect the model’s input features. While these imaging variations may influence SSIM scores and highlight differences in image quality, they do not alter the core geometric and density-based features extracted by the SSAM tool for fracture risk prediction. This resilience is attributable to the model's design, which aligns and processes images to ensure consistent feature extraction, regardless of input variability.
These findings have important clinical implications. The easiest and most accessible image storage format is JPG, 15 and almost all DXA scans are exported in that format. Also, hip protocol is the only one clinicians use when assessing the hip’s bone density. As such, a tool that requires the use of an IVA-HD protocol to achieve the best result would substantially restrict its clinical implementation. This tool was developed and tested on a hip protocol in JPG format because of how accessible hip DXA scans were in that format from clinicians and longitudinal databases. The fact that the SSAM tool performs the same when using other higher quality images is an asset indicating this tool can be clinically adopted without additional scans or work.
While this study found that higher-resolution DXA scans (IVA-HD protocol) had minimal impact on fracture risk predictions using the SSAM tool, this conclusion is specific to the tool’s reliance on 2D DXA imaging. Advanced imaging modalities such as QCT, micro-CT, and synchrotron CT offer superior resolution and could reveal subtle structural features of bone that may further improve fracture risk assessment. However, these modalities are less feasible for routine clinical use due to higher radiation exposure, cost, and limited availability. Our findings emphasize the robustness of the SSAM tool within the context of DXA-based clinical imaging, where the practicality and accessibility of such protocols are key considerations. Future studies could explore how advanced imaging technologies might complement or enhance the performance of the SSAM tool in research or specialized clinical settings.
Conclusions
The present study assessed the sensitivity of a novel fracture prediction model developed for use with DXA imaging. While differences in image quality and protocol were identified, these variations did not significantly affect the fracture risk predictions made,5,8 suggesting potential applicability for clinical use with standard DXA imaging. The results of this study provide a foundation for using the SSAM tool across different DXA scan protocols and file types, supporting its future integration into clinical practice.
Footnotes
Acknowledgements
The authors would like to thank Glen Walencik (DXA technologist) for helping to scan the specimens at the Hamilton Osteoporosis Clinic.
Author Contributions
AA: study design, data collection & analysis, interpretation, manuscript writing. FJ: tool development, manuscript review. JA: data collection, interpretation, manuscript review. CQ: study design, interpretation, manuscript review.
Declaration of conflicting interests
The author(s) declared no potential conflicts of interest with respect to the research, authorship, and/or publication of this article.
Funding
The author(s) disclosed receipt of the following financial support for the research, authorship, and/or publication of this article: This research was supported by the Canadian Institutes of Health Research (CIHR) grant [number PJT-180543].
Ethics Approval and Consent to Participate
Granted by Hamilton Integrated Research Ethics Board 12949.
Consent for publication
Not applicable.
Availability of Data and Materials
The datasets used and/or analysed during the current study are available from the corresponding author on reasonable request.