
Abstract
Instrumented implants are a promising approach to further improve the clinical outcome of total hip arthroplasties. For the integrated sensors or active functions, an electrical power supply is required. Energy harvesting concepts can provide autonomous power with unlimited lifetime and are independent from external equipment. However, those systems occupy space within the mechanically loaded total hip replacement and can decrease the life span due to fatigue failure in the altered implant. We previously presented a piezoelectric energy harvesting system for an energy-autonomous instrumented total hip stem that notably changes the original implant geometry. The aim of this study was to investigate the remaining structural fatigue failure strength of the metallic femoral implant component in a worst-case scenario. Therefore, the modified hip stem was tested under load conditions based on ISO 7206-4:2010. The required five million cycles were completed twice by all samples (n = 3). Additionally applied cycles with incrementally increased load levels up to 4.7 kN did not induce implant failure. In total, 18 million cycles were endured, outperforming the requirements of the ISO standard. Supplementary finite element analysis was conducted to determine stress distribution within the implant. A high stress concentration was found in the region of modification. The stress level showed an increase compared to the previously evaluated physiological loading situation and was close to the fatigue data from the literature. The stress concentration factor compared to the original geometry amounted to 2.56. The assessed stress level in accordance with the experimental fatigue testing can serve as a maximum reference value for further implant design modifications and optimisations.
Introduction
Total hip arthroplasty is a common treatment for hip joint-related diseases and the standard therapy when conservative measures are exhausted. 1 Demographic changes in the growing world population as well as the increased use of implants in younger patients lead to a rising number of total hip arthroplasties.2,3 Despite the actual low revision burden the absolute number of failed implants will increase proportionally to the number of primary arthroplasties. 2 Thus, a longer service life of implants is required as revision surgeries come with the risk of additional complications and a decrease in the patient’s quality of life4,5 as well as an increase of the economic burden.6–8 This highlights the necessity of further developments with regard to continuously improving the clinical outcome. Research in the field of instrumented implants is a promising approach to reduce deficits and increase the options of treatment. Sensors for diagnostic functions can monitor implant stability, implant loosening or wear to support clinical decisions for possible counteractive measures. Recording the patients’ activity and implant loading allows for an individual retrospective analysis in case of implant failure. It may also provide relevant daily life load data for implant development. Beside passive sensors, active functions can be used for direct therapeutic measures such as electrical stimulation to promote bone growth and implant stability.9–12 For most sensors and actuators, the question of an optimal power source arises. In the beginning, energy and data transmission was realised by percutaneous wires,13–15 which came with the obvious risk of infection. The use of telemetry and batteries allowed wireless measurements.16,17 Drawbacks of batteries (finite lifetime and risk of leakage) where overcome by external power transmission via inductive coupling.12,18,19 However, the requirement of external equipment for this method limits is use to a temporary application in a clinical or laboratory environment. Hence, to address these shortcomings energy harvesting represents a promising solution. Instrumented implants would benefit from an autonomous energy supply, rendering replacement of a power source unnecessary and allowing for continuous operation during daily life.
We previously presented an energy harvesting concept for a load-bearing total hip replacement. 20 A schematic of the new proposed concept is shown in Figure 1. The loads acting on the implant are transmitted through the hip stem and the ultra-high-molecular-weight polyethylene (UHMW-PE) housing to a multilayer piezoelectric element. Thereby physical activity generates voltage as previously described by us in more detail. 20 The piezoelectric element functions as a power source for any instrumentation; however, as a self-powered sensor the output voltage can also directly be related to the implant loading.
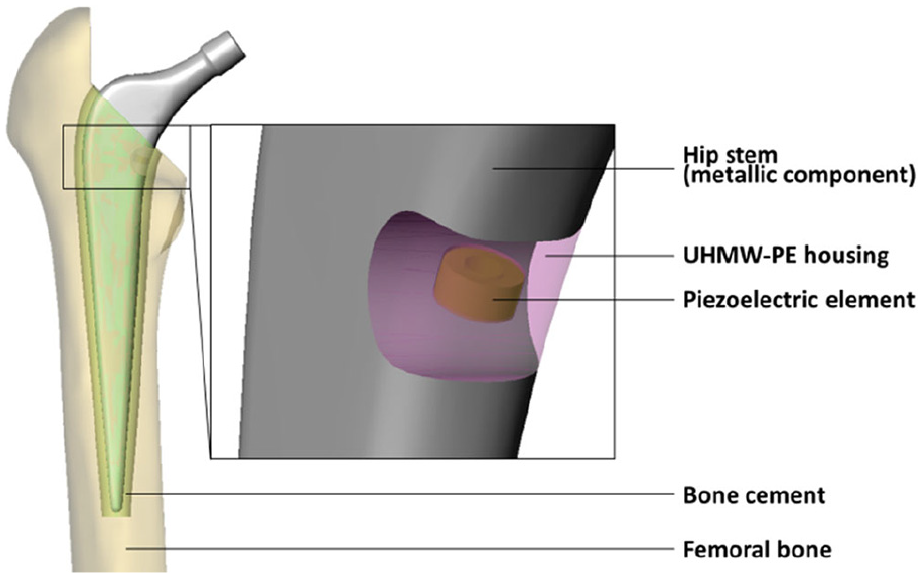
Energy harvesting concept, integrated in the hip stem (with detail of modified implant geometry). UHMW-PE housing in transparent view.
Like any other instrumentation system (sensors, circuitry, transmission units, etc.), the energy harvesting system requires space. Orthopaedic load-bearing implants that have been used in humans for in vivo joint force measurements were modified in relatively unloaded regions, that is, primary along neutral axes, to maintain the implant safety.19,21–23 In contrast, it is inherent in our design concept that the piezoelectric element is placed in a mechanically loaded area to transmit the necessary forces for generation of power. Therefore, a cavity to house the energy harvesting system was introduced. However, this notably changes the cross-sectional area in the hip stem and alters the flow of forces. It is likely to impair the structural fatigue failure strength of the implant. Previous numerical simulations of a physiologically based loading situation revealed that, compared to the unmodified geometry, stress concentrated at the cavity base. 20 In this study, a worst-case loading situation, simulating the proximal implant loosening, was used to evaluate whether the safety of the mechanically loaded metallic hip stem component was sufficient. 21 The endurance testing conducted may prove the applicability of the new concept and is based on the standardised procedure of ISO 7206-4:2010. 22 In order to study the implant loading in more detail, the fatigue experiments were accompanied by a finite element analysis (FEA) to evaluate the maximum stress and strain levels and the load distribution. The finite element model was validated by a quasi-static experiment.
Materials and methods
Quasi-static and fatigue testing
The modified geometry of the hip stem, based on our previous work, 20 was milled from an original hip stem (Exeter V40, size 37.5 mm N°3, Stryker, Howmedica Osteonics Corp, Mahwah, New Jersey, USA) by an external manufacturer (Figure 2). A V40 cobalt-chrome head of 32 mm diameter with the maximal allowed offset of 8 mm was selected. For validation of the FEA, a linear strain gauge (DMS 1.5/120 LY15, Hottinger Baldwin Messtechnik GmbH, Darmstadt, Germany) was applied to the lateral hip stem region at the cavity level. For the placement of the strain gauge in a reproducible way and in accordance with the FE model, an additive manufactured template based on the CAD geometry was used to transfer the centre and measuring direction axis of the sensor. The position was based on preliminary simulation results, reconciling the requirement of a preferably homogenously loaded area with a location near the region of interest. The cavity base itself with the expected stress concentration is not suitable for strain gauge application due to the high curvature.
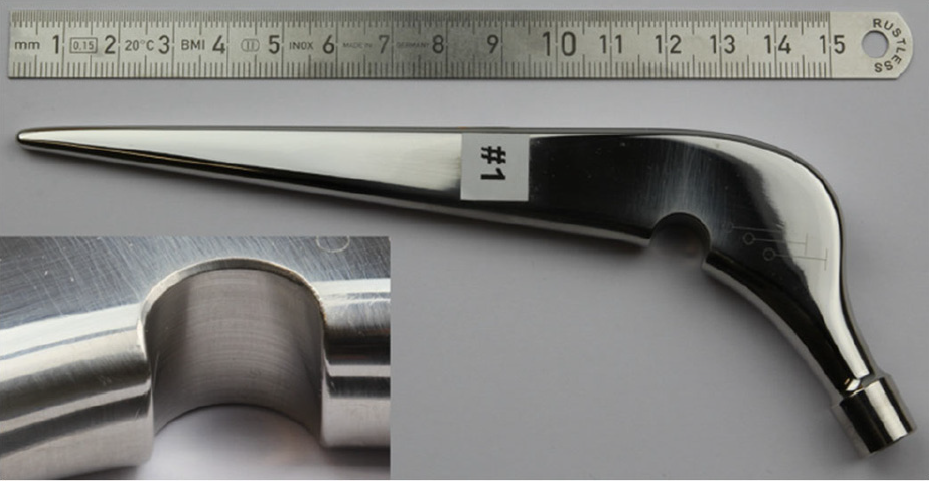
Modified implant geometry with detail of the milled cavity. The new surface showed a rougher structure from milling and polishing than the original mirror finish.
The testing was conducted based on the ISO standard 7206-4:2010. 22 The hip stem specimen was oriented (α = 9°, β = 10°) within a specimen holder with the help of an align fixture. Subsequently, a filled casting resin (RenCast® FC 52/53 Isocyanate/FC 53 Polyol, filler DT 082; Young’s modulus of 2.4 GPa; Huntsman Advanced Materials GmbH, Basel, Switzerland) was filled up to the embedding level for potting (80 mm distance to the head centre). The specimen was placed under an electrodynamic uniaxial testing machine (LTM 5, ZwickRoell GmbH & Co. KG, Ulm, Germany equipped with a 5 kN load cell). A ball ring, held in position by soft springs, was integrated between the head and the actuator to prevent the transmission of lateral forces.
For validation purposes, the maximum force of 2300 N was applied stepwise within 10 increments in a quasi-static experiment while measuring the strains with the strain gauge. At each load level, the force was held for 5 s. This experiment was repeated three times. The strains were averaged over the holding time of each increment and over the three specimens. The following fatigue testing was conducted with a sinusoidal load of maximum 2300 N with R = 0.1 at a frequency of 10 Hz for 5 million cycles. After successful completion of the test, a repetition of another five million cycles was allowed, followed by an incremental increase of the loading level (+300 N for one million cycles per increment, R = 0.1) to induce fracture. During the fatigue testing, the specimen was unloaded every 5000 cycles to allow self-recentring of the ball ring by the soft springs. Figure 3 shows a schematic of the testing procedure.
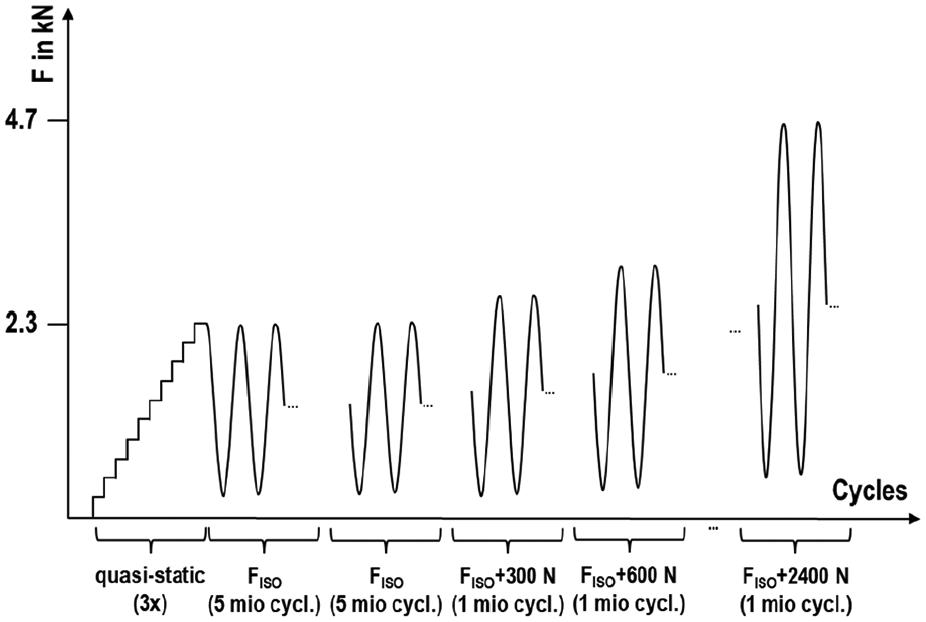
Schematic of the testing procedure. The quasi-static testing for validation purpose was followed by the fatigue testing based on ISO 7206-4:2010 (twice, if no fracture for the first run) and then continued with successively increased load levels to force failure until 4.7
The whole experiment was conducted for three specimens. Figure 4 displays the overall test set-up.
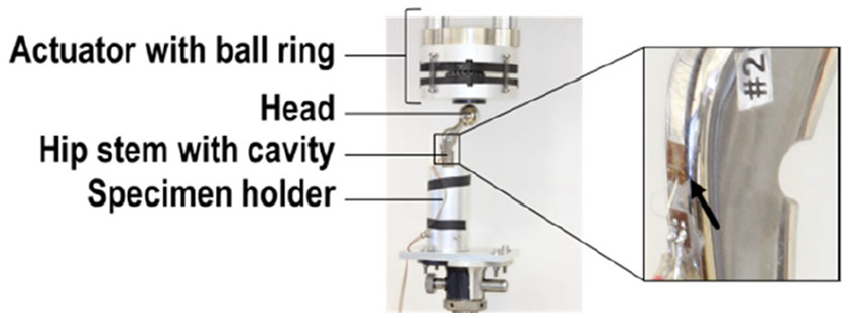
Test set-up and detail of the hip stem with modification and the applied strain gauge (arrow).
Finite element analysis
The finite element model reproduced the quasi-static testing procedure. The geometry was generated in SolidWorks 2018 (Dassault Systèmes, Vélizy-Villacoublay, France) and imported to ANSYS V18.2 (Ansys Inc, Canonsburg, Pennsylvania, USA). Only the modified hip stem and the embedding material were considered. For the representation of the strain gauge measure grid, a surface patch was constructed on the lateral stem area (see Figure 5, detail) together with a centred, local coordinate system with the x-axis pointing in the measuring direction.
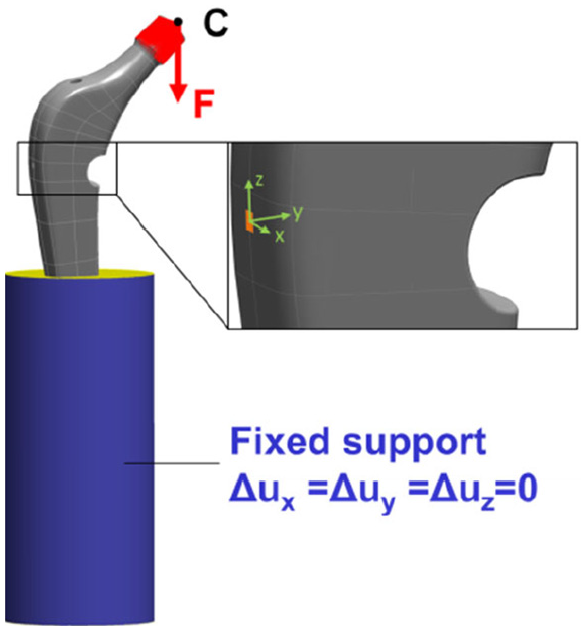
Boundary conditions and loading of the FE model (femoral head centre pt. C with the force distributed on the taper’s outer surface, and fixed support in blue), detail of the strain gauge measuring grid with local coordinate system.
The force was applied to a remote point, representing the head centre point C (pt. C) and was distributed to the taper’s outer surface. The loading was in direction of the cylinder axis of the embedding material. The outer surface of the embedding material was fully constrained, apart from the top area. Figure 5 shows the loading and boundary conditions.
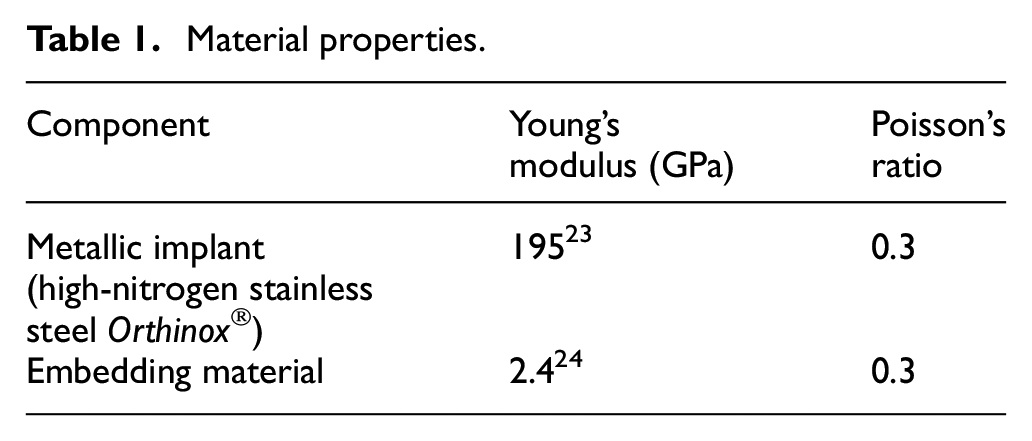
A symmetric frictional contact (µ = 0.3) was defined between the hip stem and the embedding material. Both components were meshed with quadratic solid tetrahedral elements. The strain gauge was approximated by a single linear shell element. The final mesh density was based on a mesh independence study with converging results for all reported output parameters. Linear-elastic material behaviour was assumed, with Poisson’s ratio of ν = 0.3. All material properties are listed in Table 1.
Material properties.
For calculation of a stress concentration factor, we accordingly performed a simulation of the original design without cavity.
A sensitivity analysis was performed to identify the influence of the input parameters on the stress and strain results. The Young’s moduli of the implant and embedding material were altered by ±2.5%. With regard to the potting process, different embedding levels (±1 mm) and deviations in the alignments (±3° for α and β) were considered. Additionally, the head centre pt. C was moved ±0.5 mm along the neck axis. Main imprecision is hypothesised to result from the strain gauge application. To account for geometric deviations between simulation and experiment, anterior, posterior, proximal and distal displacement of ±0.5 mm from the original position were simulated, as well as a rotation of the measuring direction about the local coordinate system by ±3°.
Results
Quasi-static testing and FE-model validation
The average measured strain value at the maximum force level amounted to 614 µm/m (standard deviation of 19 µm/m, equals 3% of the maximum). The strain rose nearly linearly by around 61 µm/m for each load level increment.
The percentage deviation of the simulated strain gauge was ≤13.1% at each load level compared to the average strain values for the three specimens. The maximum difference occurred at 2300 N (92 µm/m). Figure 6 shows the linear regression between the experiments and the FE simulation with a very high coefficient of determination (R2 = 0.997). The slope of 0.8686 reflects the above-mentioned percentage deviation.
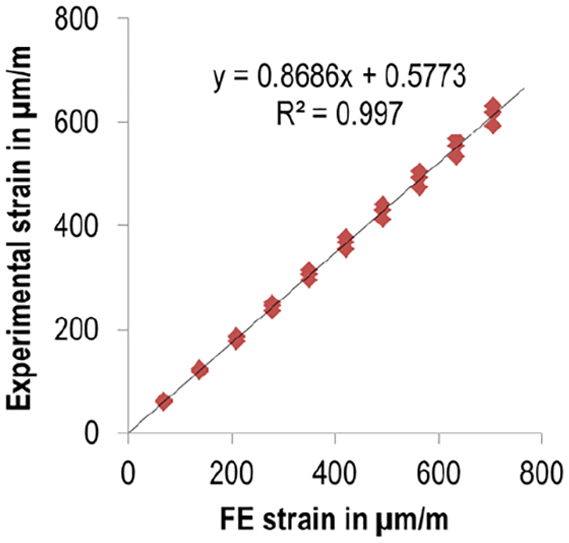
Linear regression results between FE data and experimental strain gauge values. To each numerical result, three experimental strain values were assigned according to the number of tested specimens.
FE loading distribution and sensitivity analysis
For the hip stem, several local load concentrations were found (since stress and strain strongly correlated for the linear-elastic material behaviour, only the latter is shown in Figure 7 for convenience).
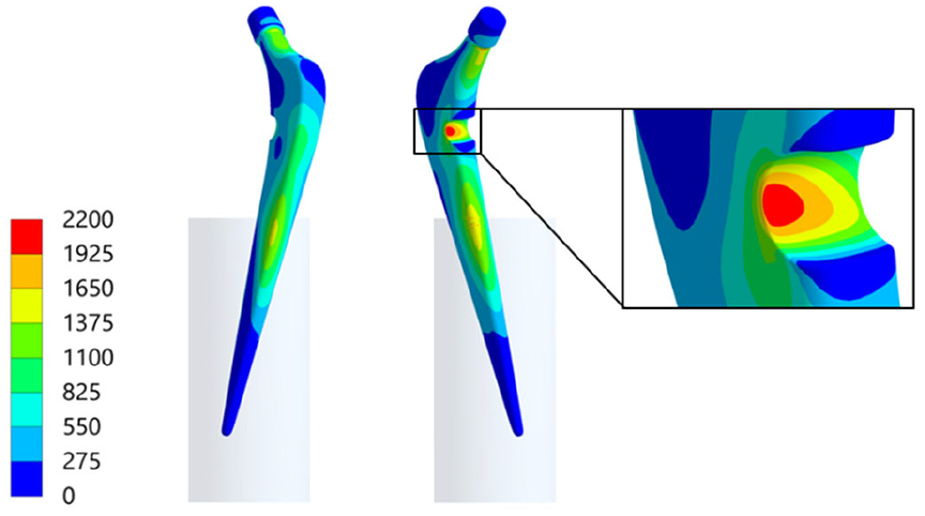
Von Mises strain distribution (µm/m) for the hip stem with load concentration at the cavity ground.
Local load concentrations occurred at the anterior and lateral hip stem region near the embedding level. Due to the change of contact situation, the local singularity led to non-converging stress and strain results. Further load concentrations were located at the upper and lower neck at the transition to the taper. For the lower position, it amounted to 1797 µm/m (respectively von Mises stress of 349 MPa). At the cavity base, the maximum strain value was 2137 µm/m (respectively 417 MPa). It was slightly shifted to the lateral side in the region of the highest overall loading gradient. In contrast, the opposed side where the strain gauge is located showed notably more uniform strain distribution. For the original design, the maximum von Mises stress in the region where the cavity would be located amounted to 163 MPa. Thus, the changed geometry resulted in a stress concentration factor of 2.56.
For the sensitivity analysis, the loading in the cavity base was reported as von Mises stress in order to compare to fatigue data for metallic implant materials from the literature, which is usually reported as stress. The strain gauge position and orientation had no influence and are therefore not shown in Figure 8. No parameter notably changed the stress in the cavity base. The percentage deviation for all was<0.2%, except for the position of the head centre pt. C. The latter had an influence of >0.8%, which is still small. For the largest distance between pt. C and the taper’s frontal surface, the maximum stress amounted to 420 MPa. All modifications that contributed to an increased stress value sum up to an influence of 1.3% (5 MPa).
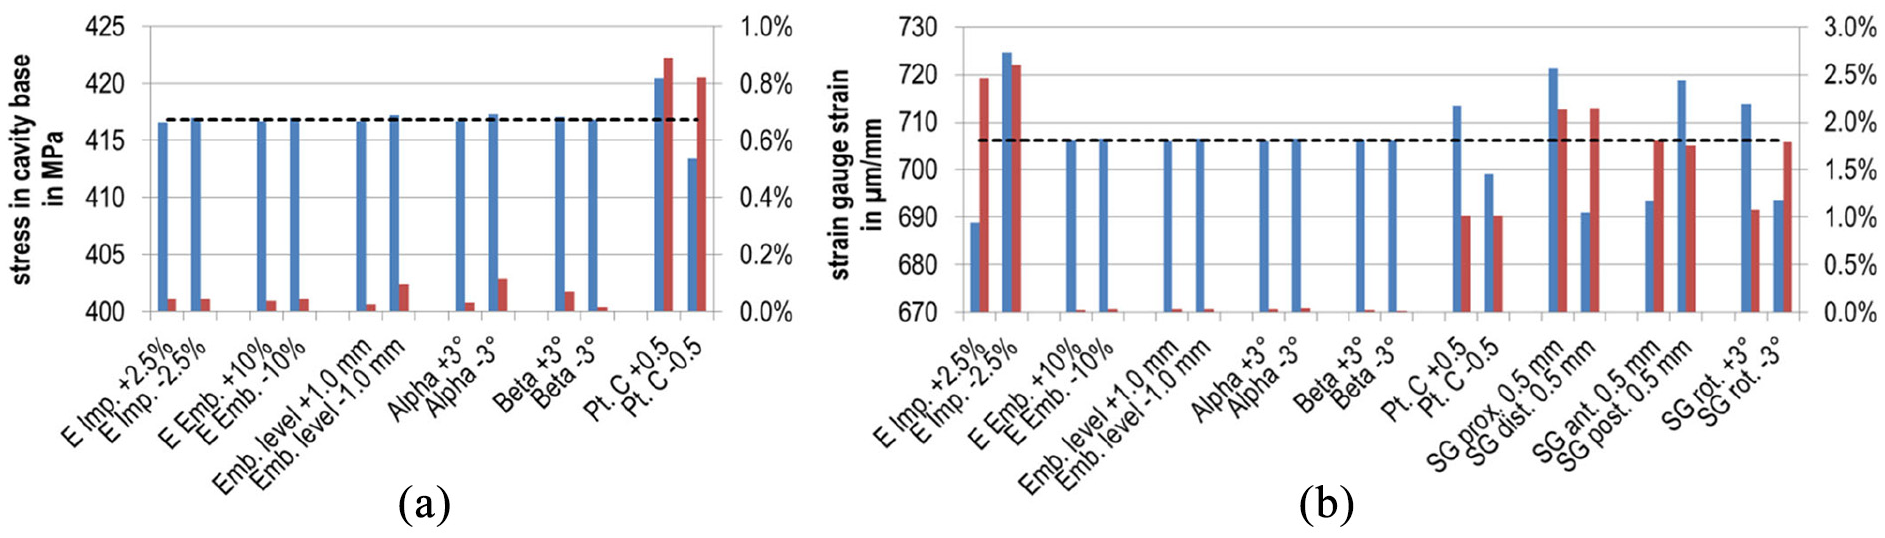
Results of the sensitivity analysis (absolute values in blue and percentage deviation in red). Deviations were relative to the original value of the reference model (dashed line). For convenience, the absolute values of the percentages are shown: (a) von Mises stress maximum at the implant’s cavity base (MPa) and (b) simulated strains for the strain gauge (µm/m). Configuration names according to the changed parameters: Young’s modulus implant material –‘E Imp.’, Young’s modulus embedding material –‘E Emb.’, Embedding level –‘Emb. level’, Angles specified by ISO 7206-4:2010 – ‘Alpha’ resp. ‘Beta’, Displacement of the head centre along the neck axis –‘Position pt. C’, Proximal, distal, anterior or posterior displacement of strain gauge –‘SG prox.’, ‘SG dist.’, ‘SG ant.’ or ‘SG post.’, Rotation of the strain gauge’s measuring direction about the local coordinate system –‘SG rot.’
With regard to the model validation, the strain in the strain gauge was predominantly influenced by the Young’s modulus of the implant material, see Figure 8(b). A change of 2.5% altered the strain by the same value; for a weaker material the maximum strain was 725 µm/m (18 µm/m higher than for the reference model). The change of position of the head centre pt. C still had an influence of around 1%. All other geometrical adaptations as well as the Young’s modulus of the embedding material had an influence below 0.05%. In contrast, displacement and rotation of the simulated strain gauge notably changed the measured strain in the range of 1.1%–2.2%. The deviation for summarising all single parameters contributing to a change in the strain is ±9% (respectively 64 µm/m).
Fatigue-testing
All three specimens passed five million cycles of the testing procedure without fracture or notable plastic deformation. Even the optional repetition and the increase in the magnitude of cyclic loading in eight steps with testing for one million cycles at each level were endured; hence, 18 million cycles in total. Figure 9 shows the measured data for an exemplary specimen. The specified force levels were always attained with no relevant deviations. Small fluctuations are shown in the displacement curve.
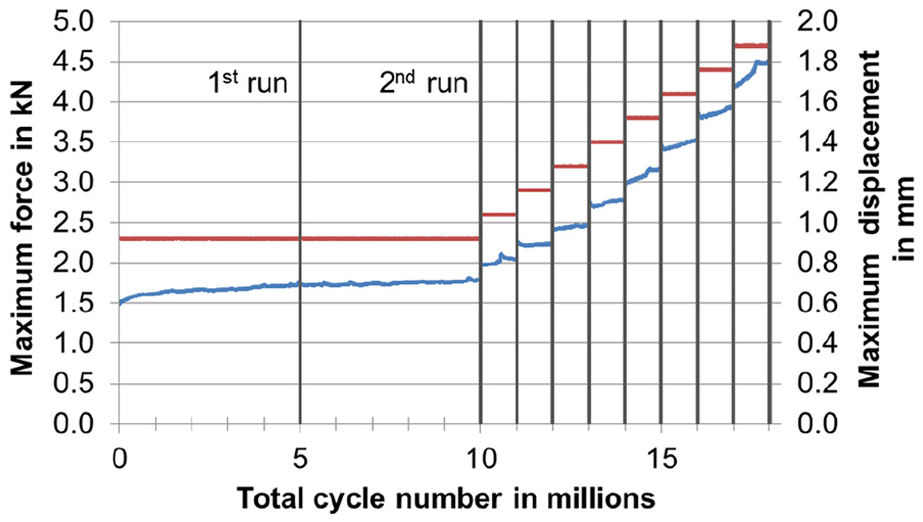
Complete testing for an exemplary specimen (periodically measured maximum values of force in red and displacements of the femoral head in blue). Since the testing was force controlled, the displacement curve showed small fluctuations.
Beyond the testing protocol, we additionally loaded the first specimen in a quasi-static experiment using a uniaxial testing machine (Z050, ZwickRoell GmbH & Co. KG, Ulm, Germany) with an increased test load since no fracture could be effected from the dynamic testing at the load cell force limit (5 kN) at a cycle number of 18 million. The maximum force of 10.1 kN was reached after 4.74 mm of vertical displacement of the prosthetic head. Subsequently, the force decreased. At 17.43 mm of vertical displacement, the experiment was stopped due to large dislocation of the ball ring under the actuator. The hip stem showed strong plastic deformation at the embedding level (Figure 10), however, no fracture occurred.
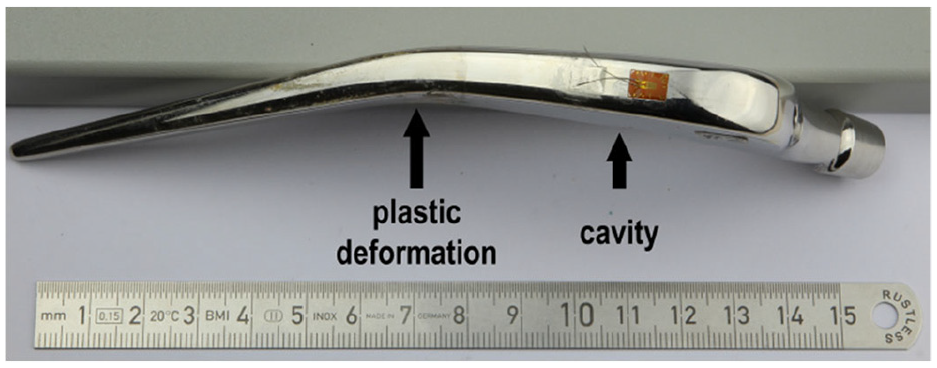
Plastically deformed specimen after quasi-static testing (maximum vertical displacement 17.43
Discussion
A linear strain increase for the strain gauge values, visible both in the experimental and the numerical data, was observed, since no stress hot spot exceeded the yield strength Rp0.2 of 436 MPa 25 and thereby only linear-elastic material behaviour occurred and for the numerical simulation, only linear elasticity was defined. Furthermore, the detected deformations of the implant were negligible, that is, relevant structural stiffness changes may not occur. A coefficient of determination of nearly 1 (Figure 6) confirmed the correlation between the experimental and numerical data, thus supporting the validity of the numerical model. However, the pronounced deviation between the maximum strain values must be considered. With regard to the summarised deviation of 64 µm/m, when all parameters from the sensitivity analysis are taken into account, only around two-thirds of the deviation from the experiment (92 µm/m) can be explained. The variations for the implant material’s Young’s modulus and the position of the head centre pt. C were rather low, however stronger effects are possible when assuming higher changes. It was correctly hypothesised that the maximum influence on the measured strain results from the strain gauge positioning. Nevertheless, further effects with influence on the simulated strain may exist that could not be addressed within the sensitivity analysis. Particularly the strain gauge application has to be mentioned since gluing on the polished hip stem surface is delicate. Incomplete moistening with glue or thick adhesive layers will alter the measured strain. The slight curvature of the hip stem additionally complicates the gluing process. This curvature was also neglected in the FE modelling of the strain gauge by a single shell. In the end, the origin of the 13.1% divergence between the numerical and experimental results could not be resolved exclusively. Since the small standard deviation confirms the reliable experimental results, the mentioned percentage deviation should be considered when discussing fatigue data on basis of the simulation results. However, the values of the FE analysis were higher than the measured strains and thereby a rather conservative estimation.
The simulated strain and stress distribution within the implant revealed several locations prone to fatigue damage and therefore enhanced general understanding of the loading situation. This demonstrates that supplementary finite element analysis can deliver additional knowledge compared to ISO 7206-4:2010 experimental fatigue testing which determines only whether the specified test is passed. 26 The particular computed values can be compared to literature data and might serve as a reference in design optimisation processes. For this study, hot spots at the embedding level and for the upper and lower neck were noted, with tensile and compression areas, respectively, at the opposed sides. These findings are in accordance with our previous work for a similar set-up. 26 The stress concentration at the cavity base was expected since the increased deformation is necessary for the functioning of the energy harvesting by transmitting the forces to the piezoelectric element. The high gradient indicates the inexpediency of strain gauge application and illustrates the advantage of FEA. The stress maximum of 417 MPa increases the stress locally by 254 MPa compared to the original design from the manufacturer. The stress maxima exceed the maxima of our previous numerical investigations for a physiologically based loading situation, and raised the stress maximum at the cavity base and at the lower neck by nearly 150 and 60 MPa, respectively. 20 The reasons are, predominantly, the increased force acting in the prosthetic head centre, the altered embedding situation and also the absent housing and piezoelectric element which usually would support the structure.
The influence of the maximum stress level by model variations is negligible, as the sensitivity analysis showed. Since the changes related to the strain gauge had only numerical effects (small variations of mesh or time increments), they may be disregarded. The high sensitivity to the position of the head centre pt. C is based on altering the lever of the acting force. An estimated overall increase for all parameters amounted to 422 MPa. This is below the fatigue data for this material of around 470 MPa (high-nitrogen stainless steel (Orthinox®), at 107 cycles, 10 Hz, in Eagle’s medium at 37°C) reported in the literature, 25 but with the same stress ratio of R = 0.1 which is typical for implant loadings.22,27 It is important to note that this value depends on various parameters, for example, manufacturing, heat treatment, surface finish, size, and so on and can, therefore, yield only approximate evaluations. Thus, the remaining margin of around 50 MPa between the simulated maximum stress at the cavity base and the fatigue value from literature is small also with respect to FE model deviations from the quasi-static testing. This highlights the relevance of our experimental investigations.
The fatigue testing was based on the procedure of ISO 7206-4:2010. In particular, the implant alignment, embedding, force specifications and cycle number were in accordance. We applied the largest head offset allowed for the present hip stem design, leading to the highest possible lever and thereby a worst-case loading. However, the hip stem size was selected with regard to our previous study 20 but configurations with smaller bodies or longer necks are available. A further limitation was the use of a reduced sample size of only three instead of six samples.
Advanced research will be required to evaluate the need of different energy harvesting system geometries for different hip stem sizes and the influence on the structural fatigue failure strength. All of our three samples completed the prescribed number of load cycles and also a second run. Since no implant fracture occurred for the additional load steps at higher forces, the required cycle number was accomplished 3.6 times in total. Therefore, the design changes to the metallic implant component can be considered as safe with regard to fatigue. Additional quasi-static testing led to exceeding of the implant material’s yield point. The plastic deformation occurred mainly at the embedding level and not in the cavity region, as to assume for the original implant geometry. It indicates the more critical loading at this latter position. We want to emphasise that no crack or fracture propagated from the modified area even if the surface finish was impaired in comparison with the original condition by the manufacturing process. In general, a rougher surface decreases the structural fatigue failure strength. 28
Conclusion
Research for energy-autonomous instrumented implants mainly focusses on the development of new concepts. Nevertheless, basic implant functionalities must be guaranteed. Within this study, we analysed a modified hip stem for integration of a piezoelectric energy harvesting system by experimentally investigating the structural fatigue failure strength within a standardised testing procedure. By means of finite element analysis we correlated the experimental results with a numerically calculated stress level. This value may serve as reference for implant modifications with regard to further instrumentation or design adaptation. These should aim at increased load transmission to the piezoelectric element in order to optimise for higher output of electrical energy.
In future studies, we plan to investigate the energy conversion and fatigue behaviour of a fully assembled total hip implant system.
Footnotes
Acknowledgements
The authors would like to thank Mr Mario Jackszis and Mr Danny Vogel (Department of Orthopaedics, Rostock University Medical Center) for technical support. Further thanks to Mr Christian Polley (Chair of Microfluidics, University of Rostock) for additive manufacturing of the template for the strain gauges positioning. We also gratefully acknowledge the funding of the Deutsche Forschungsgemeinschaft (DFG).
Author contributions
H.L. and D.K. designed the study. H.L. prepared and carried out the experiments with support from D.K.. H.L. made the simulations. H.L. wrote the manuscript in consultation with D.K. and R.B.. D.K. and R.B. supervised the work. All authors discussed the results, provided critical feedback and commented on the manuscript.
Declaration of conflicting interests
The author(s) declared no potential conflicts of interest with respect to the research, authorship, and/or publication of this article.
Funding
The author(s) disclosed receipt of the following financial support for the research, authorship, and/or publication of this article: This research is funded by the Deutsche Forschungsgemeinschaft (DFG, German Research Foundation) – SFB 1270/1 – 299150580.
Ethical approval/patient consent
Not applicable. This article does not contain any studies with human or animal subjects.