
Abstract
This study investigates the dynamic-stall process over a pitching NACA 0018 wing at a Reynolds number of 160,000 using the detached-eddy simulation (DES) technique and proper orthogonal decomposition (POD). The aim is to employ POD as an energy-ranked framework for interpreting DES-resolved coherent structures in a representative unsteady flow around an oscillating wing. Our results show that the pre-stall flow is characterized by an organized leading-edge flow state and relatively regular trailing-edge vortex activity. As the angle-of-attack increases, separated-flow unsteadiness intensifies and the upstream shear layer loses its compact attached-bubble character. Near stall onset, the leading-edge separated structure enlarges and transitions into the dynamic stall vortex (DSV), generating a broad suction footprint over the suction surface and a rapid deterioration in aerodynamic loading. The POD results indicate that the first few modes contain the dominant large-scale coherent structures associated with the leading-edge and trailing-edge dynamics, whereas higher-order modes reflect progressively weaker, more wake-dominated small-scale unsteadiness. These findings clarify the sequence linking shear-layer development, large-scale vortex evolution, and modal energy distribution during transitional dynamic stall. The study also highlights the limitations associated with the present quasi-three-dimensional spanwise extent and the use of a single pitching amplitude and reduced frequency.
Keywords
Introduction
Examining interactions of high-speed fluid flows with oscillating bodies, such as wings and blades, and the resultant vortex dynamics is is critical for many engineering systems, such as horizontal- and vertical-axis wind turbines, rotor crafts, unmanned aerial vehicles (UAVs). 1 The influence of the underlying unsteady flow mechanics is significantly high as these systems continuously undergo dynamic stall during their operations. This phenomena involves the birth, growth, detachment, and shedding of large-sized flow structures, with the massive flow separating from the wings, 2 and it greatly affects the magnitudes and fluctuations of aerodynamic loadings, including lift, drag, and moments, leading to structural fatigue and degradation in the performance of relevant engineering systems. Specifically, the interactions between laminar-turbulent flow transitions, separation bubbles, and leading-edge vortices become prominent for vertical-axis wind turbines (VAWTs),3,2 where Reynolds number (Re) could be of the order of ∼ 105 or even higher. Adequate handling of these challenges in wind and hydro based energy systems demand more research investigations into the governing vortex dynamics around oscillating bodies to improve their next-generation designs.4–6 Lee et al. 7 provided detailed insights into boundary layer transition, separation, and reattachment phenomena during dynamic stall, emphasizing the role of the leading-edge vortex (LEV). William et al. 8 highlighted the importance of incorporating hysteresis effects in predicting lift coefficients during pitching maneuvers, which is a crucial aspect of dynamic stall studies. High-fidelity pitching-airfoil simulations by Visbal et al. 9 and detailed analysis on stall onset by Miotto et al. 10 similarly emphasized the importance of formation of the leading-edge vortex formation and the associated preceding and subsequent events during stall. In the context of wind-energy applications, Le et al. 2 further highlighted that the formation and shedding of large-scale dynamic-stall vortices were central to the load fluctuations and performance penalties observed in operations of VAWTs. In real VAWTs, a blade experiences additional complexities, including rotational effects, dynamic inflow, and wake-blade interactions. The present study can be interpreted as providing fundamental physical insight into dynamic stall relevant to VAWT aerodynamics, rather than as a direct full-scale representation of flows around a blade of an operational VAWT.
While advancements in computational techniques and supercomputing facilities enable us to perform highly-resolved simulations, the cost associated with direct numerical simulations for moderate/high Reynolds numbers is still enormous. With the uncertainness associated with simulations through unsteady Reynolds-averaged Navier-Stokes (URANS) equations, large-eddy simulations (LES) became a viable option in such scenarios. For instance, Visbal et al. 9 used LES to analyze the formation of dynamic stall vortices on a pitching airfoil. However, the computational cost can still be significantly reduced by employing blended RANS-LES simulations techniques or detached-eddy simulations (DES) 11 without losing substantial resolution of key coherent features in high-speed flows. Therefore, it is gaining popularity in the community of high-speed aerodynamics. It is a numerical modeling approach used to simulate turbulent flow with a greater accuracy than traditional methods in scenarios where complex eddies and unsteady aerodynamics are present. 11 DES is a hybrid method combining the strengths of RANS in near-wall regions with those of LES in capturing motion of large-scale eddies in separated flows. 11 From a more specific physical standpoint, DES behaves like RANS in regions close to solid boundaries, where the flow is predominantly attached and the turbulence length scales are relatively small. However, when the flow “detaches” or separates from these boundaries, 12 leading to large-scale turbulent structures, DES transitions into its LES mode, resolving these larger scales directly. 13 This approach is particularly beneficial for investigating the aerodynamic performance of blades of VAWTs, where the flow is inherently unsteady and massively separated. By resolving the large turbulent structures and their interaction with the blade’s surface, DES can provide detailed insights into the flow mechanisms that govern the starting and steady-state performance of pitching blades/wings. With Shur et al. 12 providing the foundations, Wang et al. 14 compared DES with URANS approaches and demonstrated the superiority of DES in capturing the flow features around oscillating airfoils at low and moderate Reynolds numbers (Re ∼ 105). Geng et al. 15 employed URANS and LES to explore sensitivity to turbulence modeling parameters, identifying significant hysteresis effects and dynamic stall features. Additionally, Hand et al. 16 demonstrated the effectiveness of using DES for predicting unsteady forces on vertical-axis wind turbines (VAWTs), further validating its capability in situations involving the dynamic stall phenomenon. Despite all these recent research investigations, no effort was dedicated to understand the occurrence and evolution of dynamic stall phenomenon at transisitonal Reynolds numbers (Re > 105). Since most of the engineering systems mentioned earlier undergo dynamic stall at Re > 105, it becomes imperative to deeply examine unsteady vortex dynamics around them to discover its strong link with these rotating or oscillating bodies undergoing dynamic stall. In this context, our present work is targeted to uncover the nature of dynamic stall process over an oscillating wing at Re = 1.6 × 10⁵, where the pitching wing serves as a simple model for a blade of a VAWTs. 17
In addition to using traditional flow visualization techniques to understand vortex dynamics around oscillating objects, modal decomposition methods, such as proper-orthogonal decomposition (POD) and dynamic mode decomposition (DMD) techniques are very powerful in terms of extracting high-energy modal components of complex flow fields. The POD method provides a mathematical framework for breaking down flows into their orthogonal modes ranked by their energy contributions. 18 This decomposition highlights dominant flow features, enabling a deeper understanding of the flow dynamics 19 while reducing the complexity of the data, especially for understanding dynamic stall phenomenon of wings or blades of VAWTs. 20 Prior investigations into dynamic stall predominantly used RANS or URANS approaches, which showed delayed vortex shedding, limiting insight into coherent vortex structures under unsteady motion. 21 As the novel contribution of this work, we employ DES to perform high-fidelity simulations for flows around an oscillating (pitching) wing instead of using a static airfoil previously used in DES-related studies.22,23 It is important to highlight that static configurations cannot produce or capture the inherently unsteady separation and dynamic stall vortex.22,23 Our simulations are conducted at a higher Reynolds number of Re = 160, 000 that comes under a transitional regime, where laminar separation bubble bursting and Kelvin–Helmholtz shear-layer instabilities emerge.24,9,25 To extract and analyze the energy-dominant flow structures and their temporal evolution, we employ Proper Orthogonal Decomposition (POD) on the velocity fields obtained through our simulations. The POD technique is a well-established modal decomposition technique for extracting the most energetic structures from unsteady flow fields. The contribution of the present work lies in the application of POD to DES-resolved dynamic stall process over a pitching NACA 0018 wing at moderate/transitional Re, with emphasis on the energetic organization of the dominant coherent structures and their role in stall-related developments in the flow field. Specifically, we apply POD to analyze the flow field around a pitching NACA0018 wing, with a special emphasis on energy-based partitioned modes among leading- and trailing-edge vortices and shear layer instabilities. Along with the vortex dynamics around the pitching wing, visualization tools, including Q-criterion and contours of the flow velocity and vorticity, provide additional context for interpreting these modes and their relations with the overall vortex dynamics.
Computational methodology
Geometry & kinematics
In this work, a pitching wing is employed to model an oscillating blade of a VAWT. The primary objective here is to explore the changes in vortex dynamics that arise during the wing’s motion, particularly how the leading-edge vortices and trailing-edge vortices (TEVs) behave instantaneously. Given that the scope of this study is centered on the analysis of these vortical structures, a relatively simple oscillatory motion is prescribed for the wing that performs pitching around an axis located at a distance of 0.25c from the leading edge. Here, c denotes the chord of the wing. Previous studies showed that a simple sinusoidal pitching motion was widely used to study dynamic stall because it reproduced the essential unsteady vortex phenomena observed in and aligned with experimental results. For example, Mallik et al.
26
performed hybrid RANS/LES (DDES) simulations for flows around a NACA 0012 airfoil undergoing light dynamic stall. Furthermore, Wang et al.
27
confirmed that a single-frequency pitching motion was sufficient to produce the vortex dynamics (shear layer roll-up and vortex shedding, etc.) associated with dynamic stall. Some key investigations also demonstrate that periodic pitching generated the characteristic leading-edge vortex and the subsequent shedding process that defined dynamic stall.
28
Given the validity, this approach enables a more straightforward analysis of the underlying fluid dynamics, making it easier to isolate the influence the birth and growth of vortices around the wings on aerodynamics lift and drag forces during the pitching motion. Therefore, the kinematics of the wing is mathematically described below:

Governing equations, turbulence modelling & numerical schemes
We perform our numerical simulations around a NACA-0018 wing at Re = 160, 000, where the flow undergoes transitional behavior that produces the shear-layer instabilities, vortex roll-up, merging, and shedding characteristic of dynamic stall
9
The Reynold number is defined as
We solve the following incompressible forms of the continuity and Navier-Stokes equations using OpenFOAM, which is an open-source finite-volume method based computational solver.

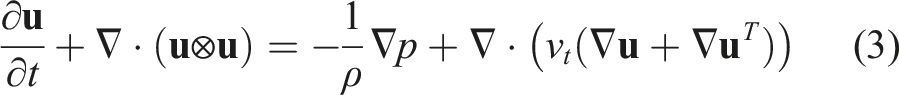
Figure 1 shows that we specify a Dirichlet (uniform value) condition for velocity at the inlet and zero-gradient (Neumann) for the pressure. The outlet boundary employs a pressure outlet condition to simulate the outflow, whereas the top and bottom boundaries are defined with a slip boundary condition. Over the wing’s surface, the velocity is subjective to no-slip boundary condition while computing pressure using a zero-gradient condition. The boundary condition applied at the front and back planes (spanwise direction) are set to be cyclic (periodic) given that this simulation involves an infinite aspect ratio. An isometric view of the flow domain around a pitching wing.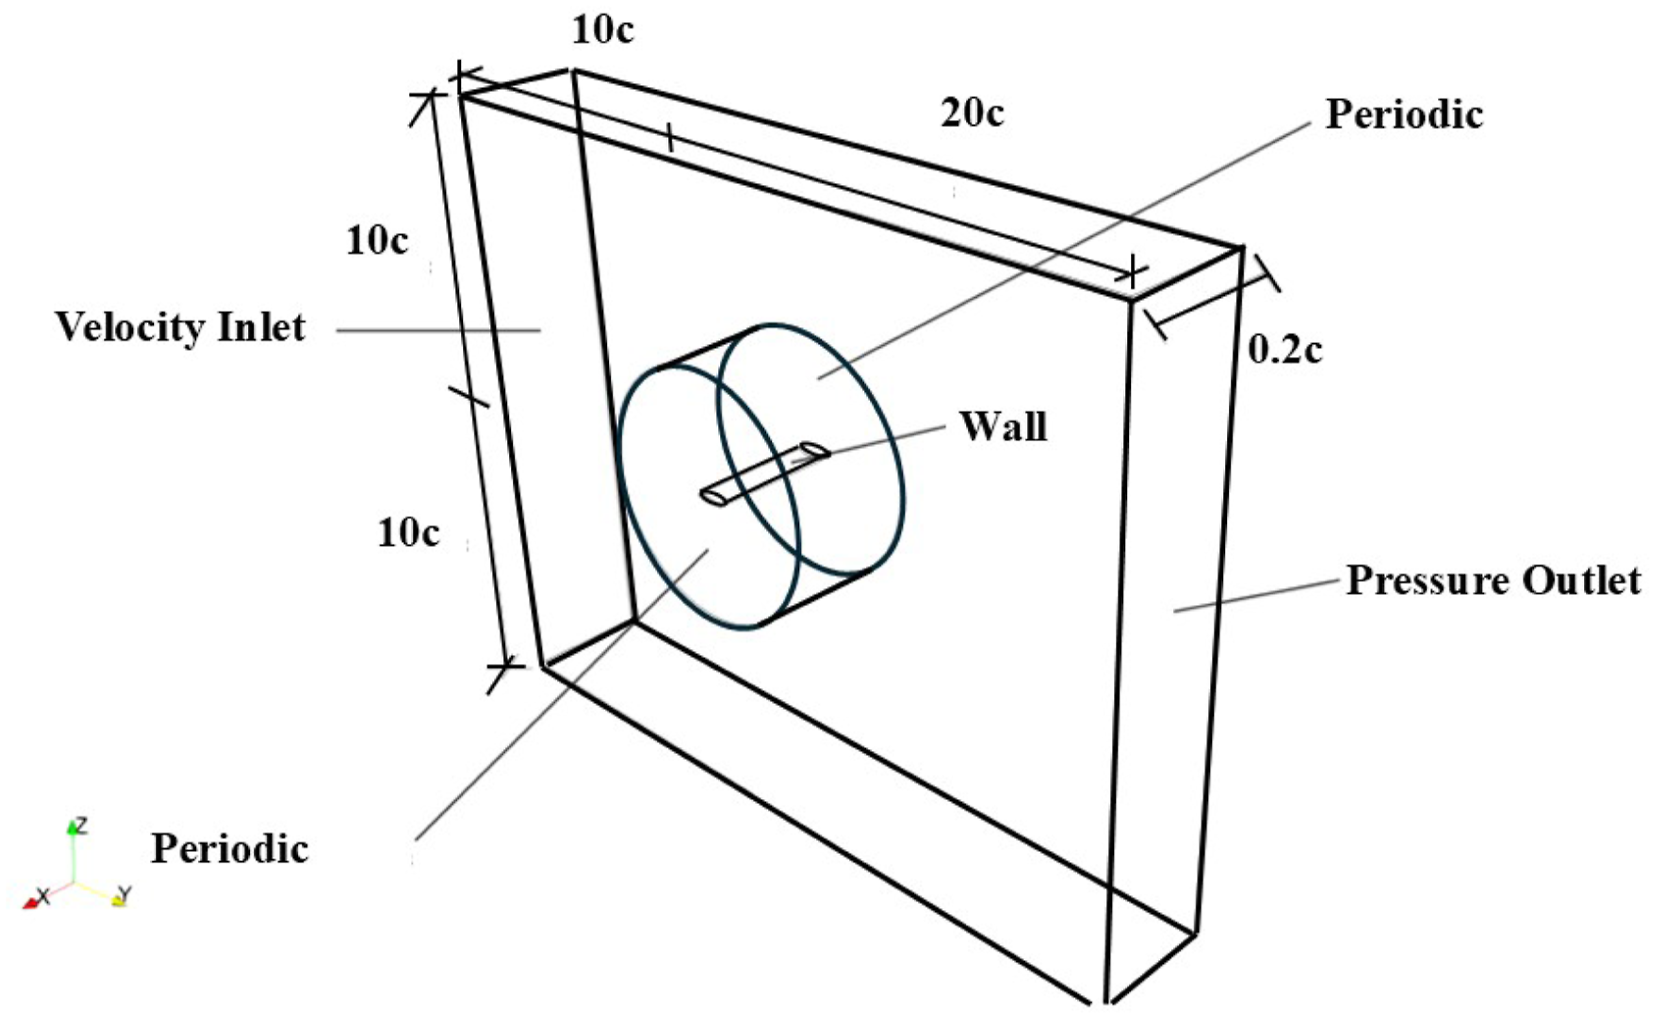
Detached Eddy Simulation (DES) and its variants (DDES, IDDES) are well-suited for unsteady flows around airfoils at Re ∼ 160, 000, where flow separation and vortices are formed and shed for the stall phenomenon. At this Reynolds number, the boundary layer may transition and separate, which single-equation RANS models struggle to predict, whereas DES can resolve large unsteady eddies in separated regions. Wang et al.
27
compared RANS versus DES for a NACA 0018 airfoil (Re 160k) at high incidences. Their DES (SST-DES) captured the unsteady stall vortices and yielded much more accurate forces than steady or unsteady RANS. Similarly, Sun et al.
35
achieved good agreement with experimental results for onset of stall and loading curves predicted deep stall on a thick airfoil (Re ∼ 200k). To ensure the precision and consistency requirement of DES, we discretize the flow domain using a structured grid for better control on the sizing of the mesh in different regions, and computational effectiveness
36
and accuracy.
37
Using ANSYS ICEM-CFD, the grid is refined through an iterative process carefully, while focusing on areas susceptible to higher levels of flow activity and gradients, as exhibited in Figure 2. Our strategy ensures that even the flow features are fully resolved in our simulations. An isometric view of the mesh closer to the surface of the NACA 0018 wing.
To ensure convergence, numerical accuracy, and the resolution of flow structures in the spanwise direction, guided by previous studies11,38,39 we employ 60 equally-spaced grid nodes over the entire span of the wing.
40
Near the wall, the first cell height is selected such that the non-dimensional wall distance remains approximately y+ less than or equal to 1, supporting proper near-wall treatment of the boundary layer. In addition, the mesh is generated with gradual and smooth transitions from the wing surface into the trailing-edge and wake regions, as presented in Figures 2 and 3. This is particularly important in DES, where abrupt changes in grid spacing can adversely affect the resolved separated flow. In the present work, modelled stress depletion (MSD)
11
and grid-induced separation
41
(GIS) are treated as mesh-design considerations that guided the refinement strategy rather than as separately diagnosed phenomena. (a) A zoomed-in view of the mesh on the trailing-edge of the wing and; (b) a further close-up view of the trailing-edge to show the quality of the grid and the related wall distance.
The momentum equations are resolved via the preconditioned biconjugate gradient method (PbiCGSTAB), while the preconditioned conjugate gradient method (PCG) is utilized to solve the Poisson’s equation. The computational domain is decomposed and processed across 128 CPUs/processors for parallelized simulations, while utilizing the scalability of openFOAM performing the best efficiency at 110k grid per processor.
42
Additionally, The gradient scheme is chosen to be “Gauss cell-Limited 1”, as given below. It limits gradients based on neighboring cell values to enhance stability and maintains first-order accuracy but with a limiter to prevent non-physical values. The basic Gauss linear scheme, shown below, without limitation can result in higher accuracy but at the risk of introducing non-physical values.
Validation & Verification
Since the primary focus of our current work is to investigate changes in vortex dynamics during pitching motion, it is essential that the mesh accurately captures the complex flow phenomena, including vortex shedding, boundary layer separation, and reattachment, while minimizing the associated computational costs. To attain grid-independent solutions, three mesh configurations are tested, each with progressively finer resolutions. The process begins with a coarse grid, having 6.5 million cells, to establish a baseline, followed by medium and fine meshes with increasing numbers of grid cells concentrated around the airfoil surface and in the wake region where vortex structures are formed. The medium and fine meshes are composed of 8.5 million and 10.5 million cells, respectively. Special attention is given to refining the mesh in near-wall regions, ensuring that the boundary layer is well-resolved by using appropriate wall functions or y+ values, typically below 1, as mentioned above.
13
Here, the lift coefficient (C
L
) is the primary metric used to assess convergence of the grid, which is a common approach to verify the validity of the current study, given the confidentiality of the data, such as velocity profile. The global nature, as compared to velocity profiles, of C
L
and C
D
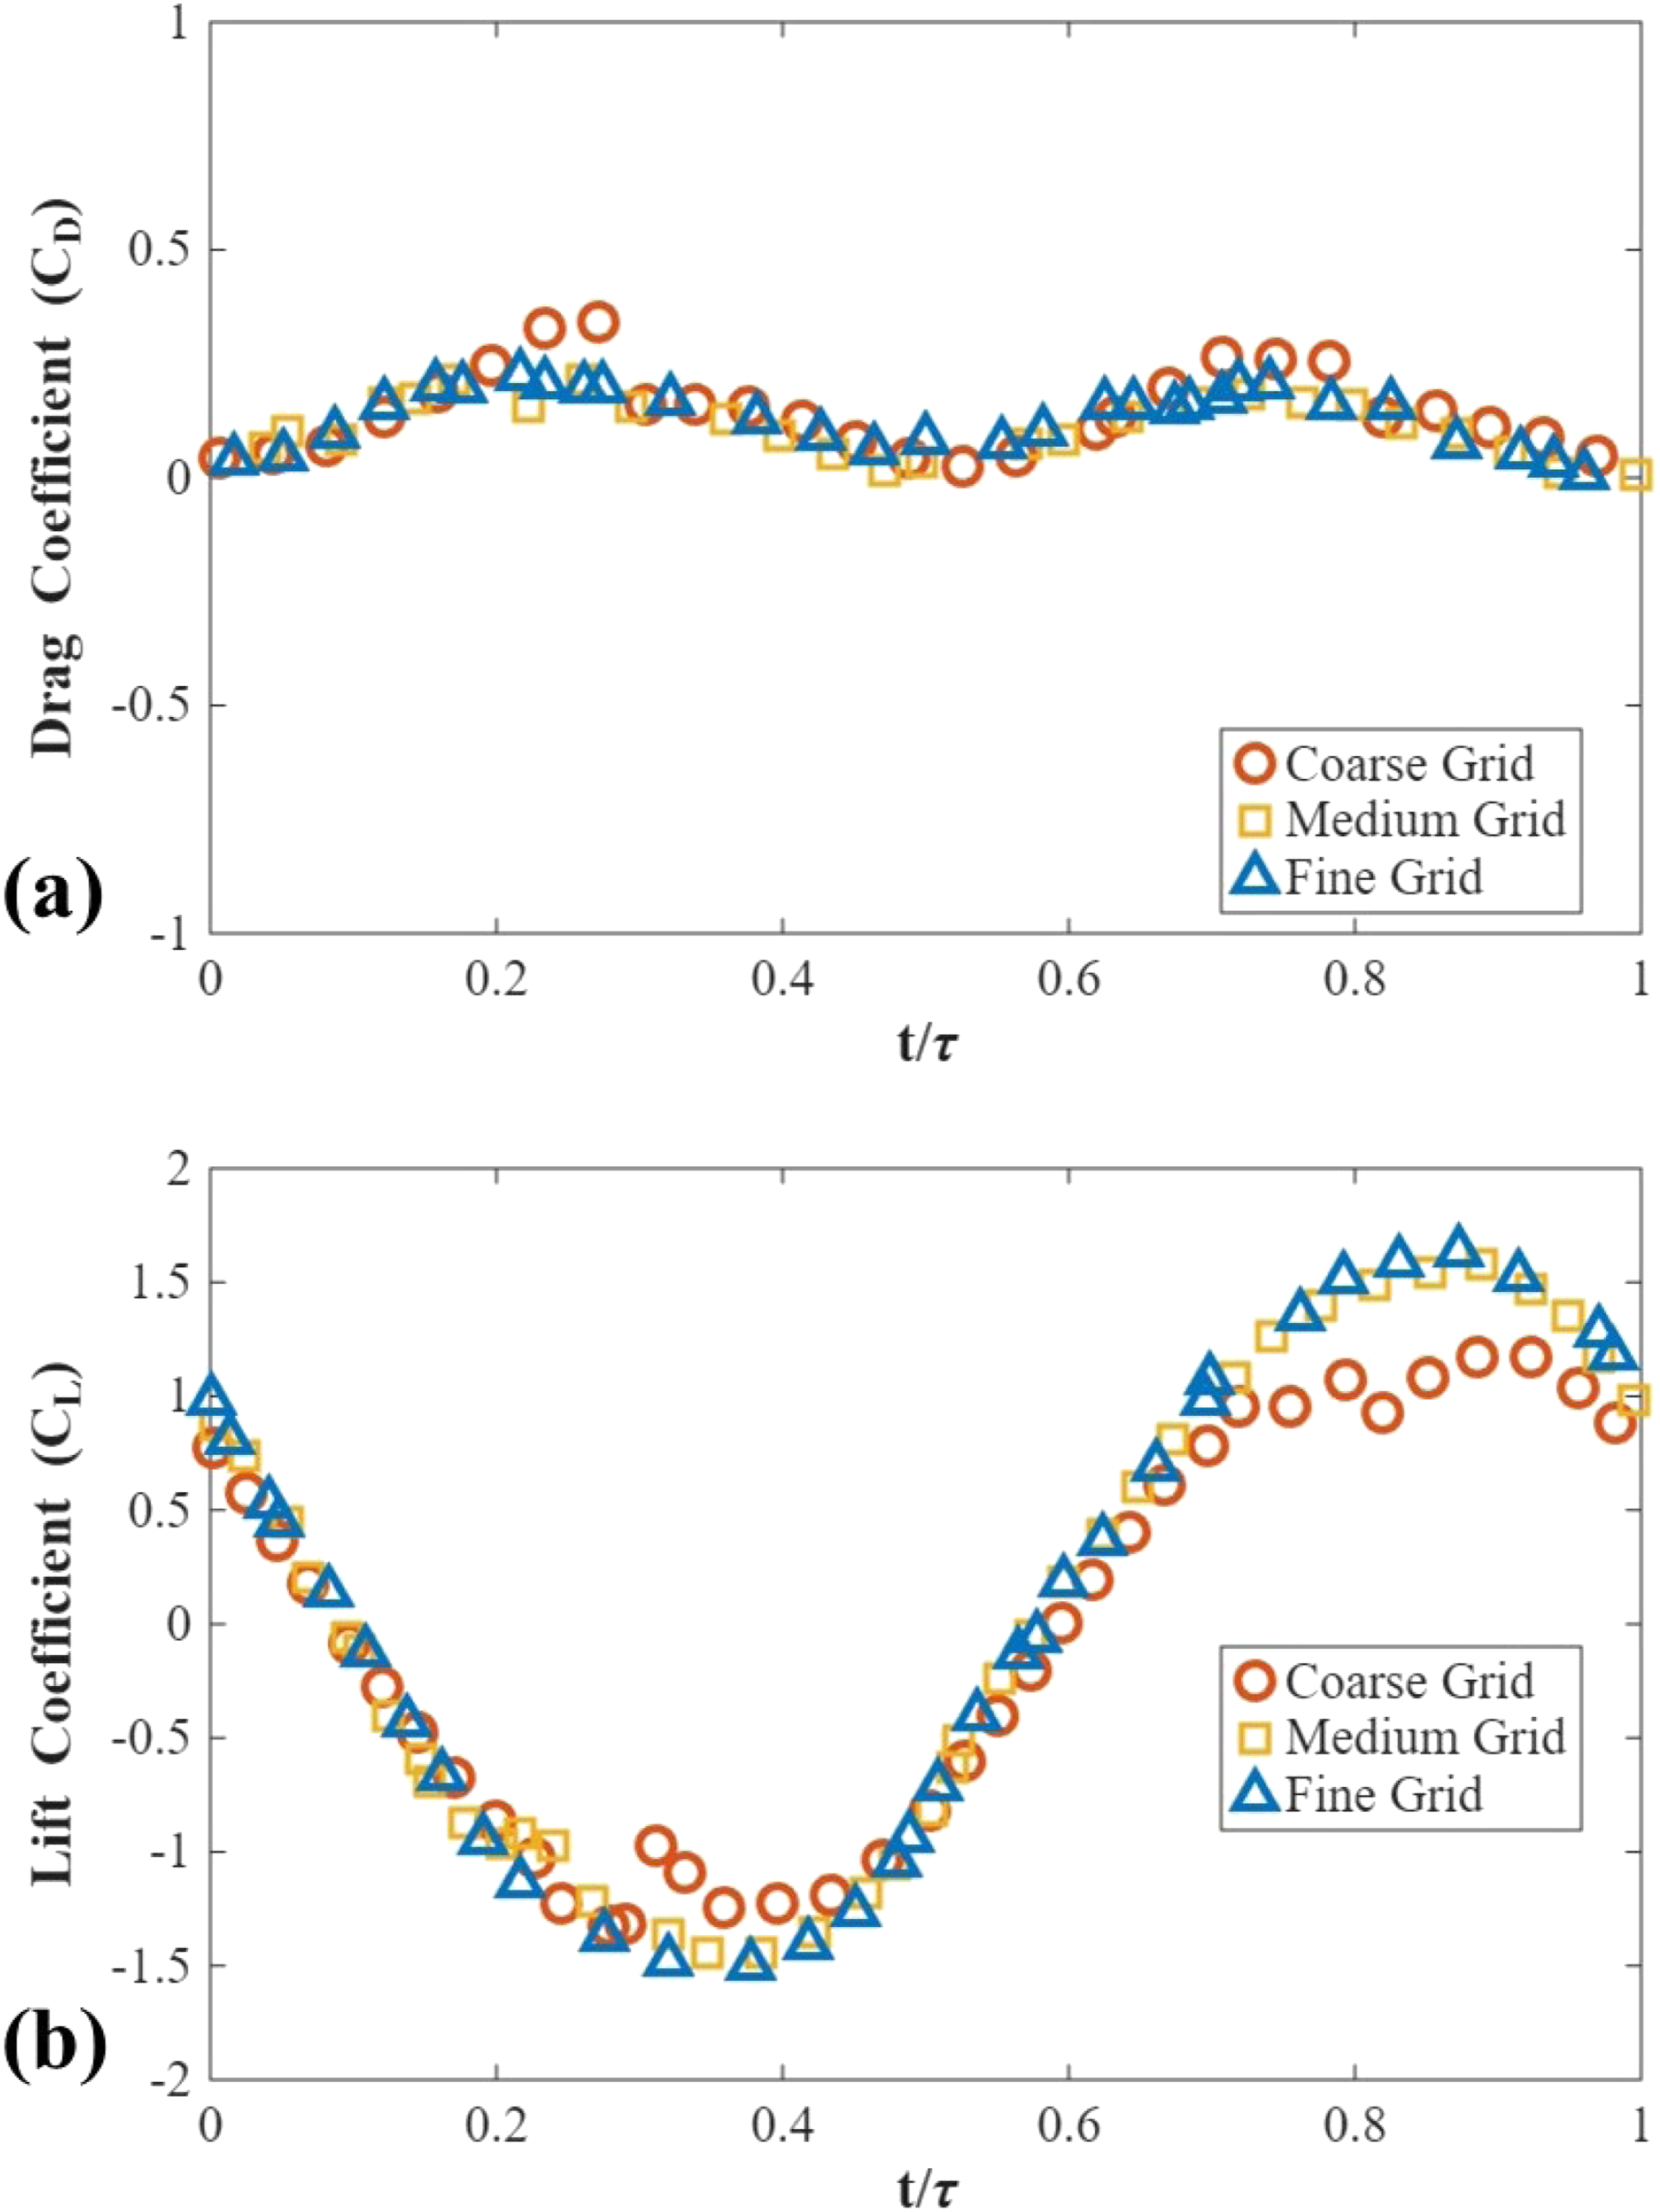
makes them particularly sensitive to overall flow features, such as separation bubbles, laminar–turbulent transition, and large-scale vortical structures, which are precisely the aims for verification and validation to capture the phenomena in our work. As presented in Figure 4(a)., it is evident from the profiles of C
L
that the computational results a significant change when the mesh size is increased, while moving from the coarse to the medium grid. Beyond the medium mesh, the results do not experience a significant change. This final mesh provides a good balance between computational efficiency and accuracy. It ensures that that the results, particularly the behavior of the leading-edge vortices (LEVs) and trailing-edge vortices (TEVs), are not dependent on the grid structure but are instead reflective of the true physical phenomena of interest.
9
Results for the (a) grid-independence study of C
D
and; (b) grid-independence study of C
L
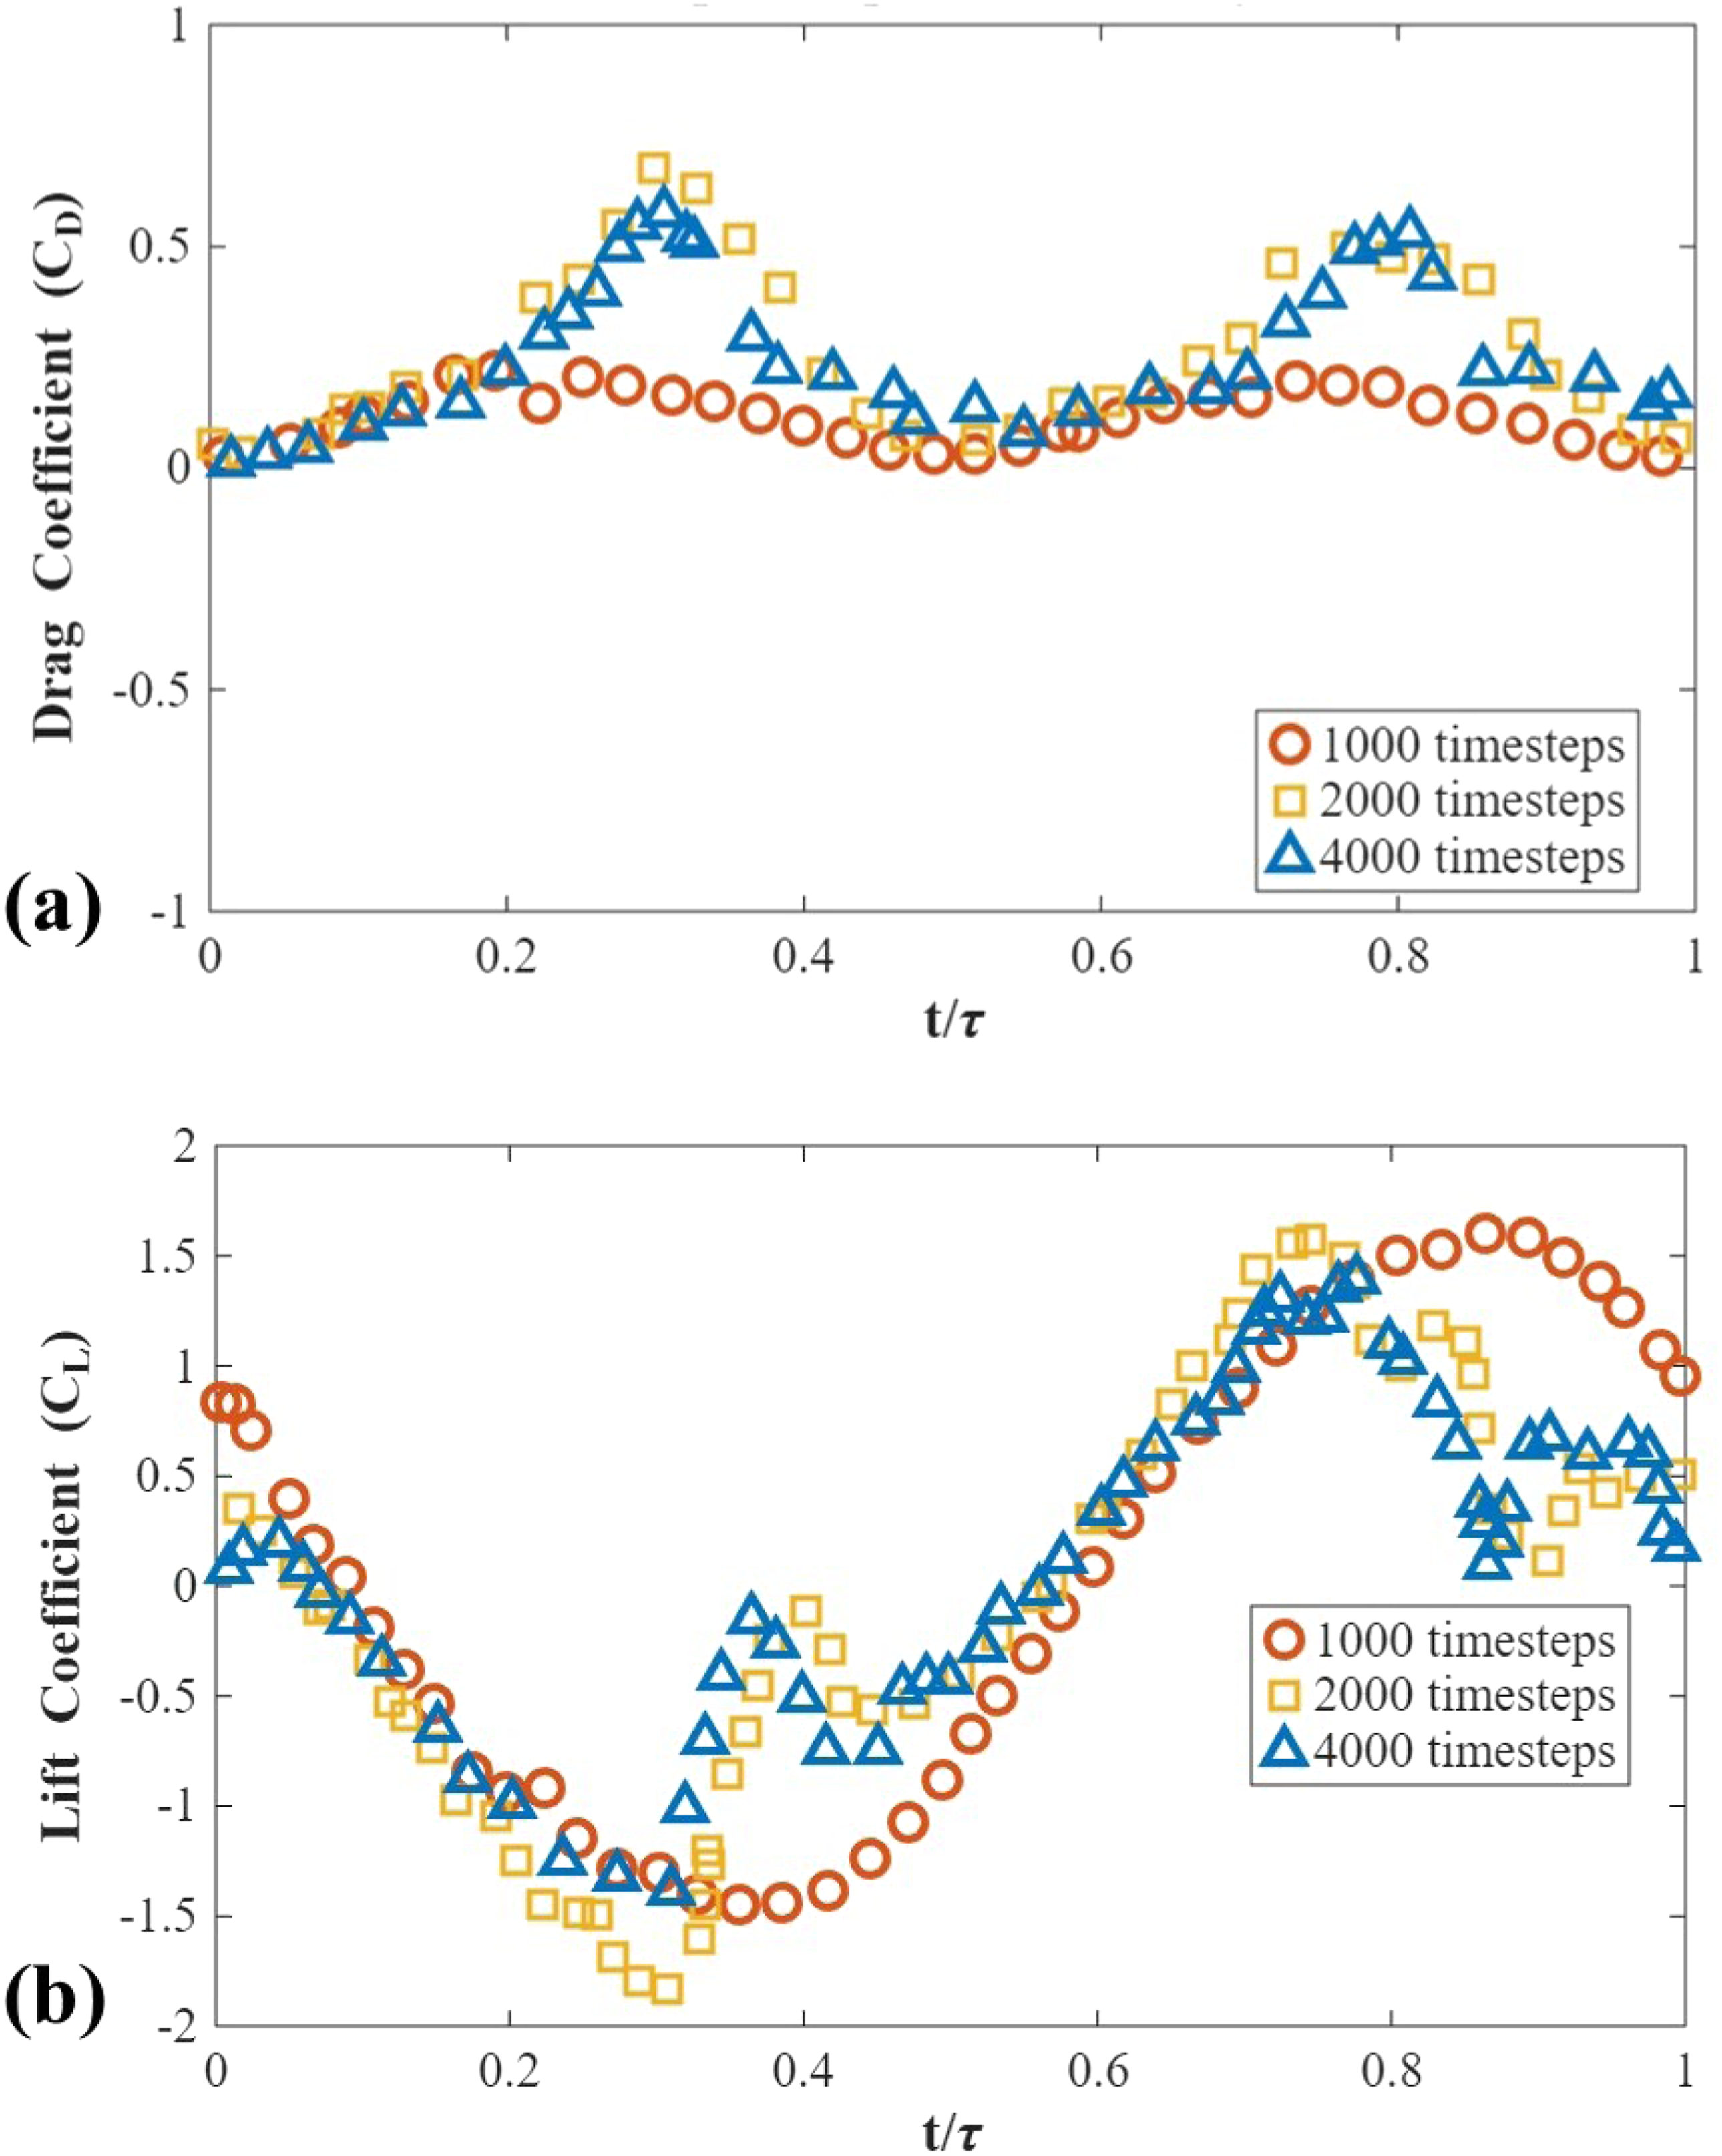
To ensure the accuracy and stability of our simulations, a time step-convergence study is conducted by varying the number of time steps per oscillation cycle as shown in Figure 5(b). These simulations are performed with 1,000, 2,000, and 4,000 time steps per oscillation cycle to evaluate the impact of temporal resolution on the results. The analysis revealed that the case with 1,000 time steps exhibits noticeable discrepancies, particularly in capturing the dynamic stall characteristics and vortex shedding timing, due to insufficient temporal resolution. The case with 2,000 time steps demonstrates a significant improvement, sufficiently matching the results from the case with 4,000 time steps with minor discrepancies in transient flow features, such as the reattachment phase after stall. The differences may be due to the hysteresis effect and nonlinear nature of the turbulent flow around the pitching airfoil at the currently considered very high Reynolds number. The more resolved case with 4,000 time steps per cycle provides slightly smoother and more detailed flow structures. Nevertheless, the improvements are marginal compared to the computational cost incurred. Based on this study, 2,000 time steps in one pitching cycle strikes an optimal balance between accuracy and computational efficiency, making it the baseline for our simulation and validation studies. In our simulation set up, this choice ensures reliable results for comparison of the DES-based results with those from experiments while maintaining manageable computational costs. Results for the (a) timestep-independence study of C
D
and; (b) timestep-independence study of C
L
Validation studies using a NACA 0012 wing remains a cornerstone in advancing our understanding of unsteady aerodynamics, providing critical benchmarks for computational methods. According to Jacobs et al.,
43
while the thickness-to-chord ratio does affect the maximum lift and drag coefficients, the general aerodynamic trends remain comparable, especially at moderate angles of attack. Moreover, according to Abbott et al.,
44
symmetrical airfoils within the same series exhibit similar characteristics in boundary layer transition and flow separation in low-speed, incompressible flows, despite differences in thickness of wings. While acknowledging that variations in thickness can impact certain aerodynamic parameters, the evidence suggests that a NACA 0012 wing can provide valuable insights into the performance of a NACA 0018 wing. Lee et al.
7
conducted extensive experimental investigations, capturing detailed aerodynamic forces and flow structures during pitching and plunging motions of wings. Their work serves as a reliable reference for validating computational methodology. Additionally, Wang et al.
14
employed DES to model the similar cases, demonstrating the capability of hybrid turbulence models to predict unsteady vortex dynamics and wake structures. However, the grid resolution in their study remained limited, particularly in terms of time step size and grid refinements. They performed their simulations using 800 time steps per oscillation cycle. These limitations possibly caused discrepancies between their simulation results and the experimental data, especially in capturing high-frequency dynamics of small turbulent flow structures and the rapid flow transitions during dynamic stall, as shown in Figure 6. Our currently obtained results exhibit significant improvements in comparison to the study of Wang et al. by employing finer resolutions in time steps and more refined grids. This enhancement allows the simulation to run smoother, reducing numerical diffusion and better resolving transient flow features. Consequently, the current DES results show much closer alignment with the experimental data from Lee et al.,
7
particularly in predicting peak aerodynamic forces presented in Figure 6 and capturing the temporal evolution of coherent flow structures.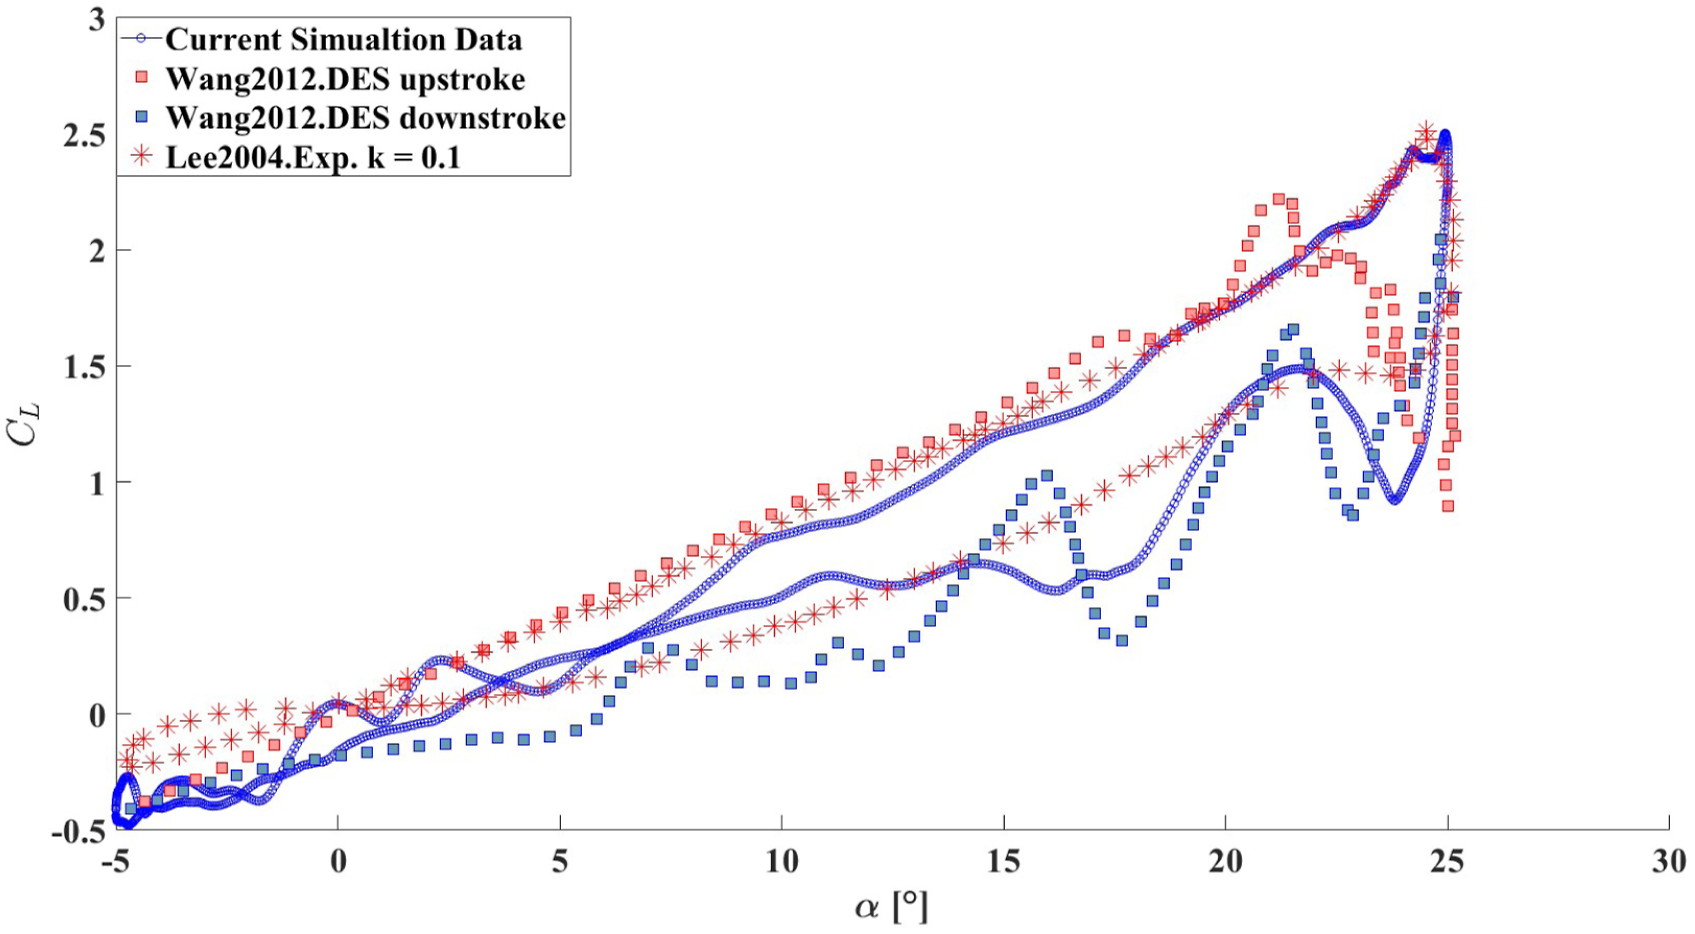
Results and discussion
In this section, the evolving vortex dynamics over a pitching NACA 0018 wing is analyzed and linked to the dynamic-stall process. The discussion combines three-dimensional vortex visualizations, pressure-field evolution, and POD-based modal interpretation to clarify the sequence of separation, vortex growth, convection, and variations in the aerodynamic loading during the pitching cycle.
Vortex dynamics during dynamic stall
The behavior of vortex structures around a pitching airfoil is a critical determinant of its aerodynamic performance and the dynamic stall conditions. Figure 7 shows the formation, transition, and dynamics of coherent flow structures at different stages of the pitching motion of the wing. At the beginning of the upstroke, trailing-edge vortices remain relatively organized, with only mild spanwise disturbances confined to the wake region, as shown in Figure 7(a)). As the wing continues pitching upward, spanwise instability becomes more apparent in the trailing-edge vortex system at 10.46° in Figure 7(b) when the wing continues pitching up. With further increase in angle-of-attack, this unsteadiness strengthens and its influence extends upstream while the wing remains on the upstroke. Near α ≤ 18.4°, beyond a critical threshold, the initially coherent vortex system progressively loses organization and breaks down into more irregular separated structures,as illustrated in Figure 7(d). This process is particularly significant in the dynamic stall phenomenon, as the loss of coherence in vortices amplifies fluctuations in unsteady loads and aerodynamic hysteresis, which are challenging to predict using conventional modeling approaches. Rather than indicating that the trailing-edge instability alone causes dynamic stall, these observations suggest that the stall process emerges from the coupled interaction of downstream unsteadiness, separated shear-layer amplification, and leading-edge separation dynamics. Three-dimensional isosurfaces of Q values at (a) t/τ = 0.573, (b) t/τ = 0.610, (c) t/τ = 0.650, and (d) t/τ = 0.685 where the red- and blue-colored flow structures represent Q = 5000 and 2000, respectively.
At a high Re of 160,000, the presence and evolution of a leading-edge separation bubble (LSB) play a vital role in controlling the pressure distribution over the airfoil surface.
9
The growth of the instability from the trailing part of the wing strongly influences the flow behavior at its leading part.
45
We explain different stages in this process using contour plots of the pressure coefficient (see Figure 8) and Q-values (see Figure 9) around the wing in the mid-plane of the flow field. During the initial phase of the pitching motion, the LSB remains attached to the leading edge, maintaining a high-pressure difference between the upper and lower surfaces due to the sustained boundary layer attachment. As the angle-of-attack increases toward stall onset, the compact LSB enlarges and progressively loses its attached-bubble character. The large low-pressure region shown in Figure 8(c) together with the stronger rotational and shear signatures in Figure 9(c) through the positive and negative values of the Q-value at the solution time of t/τ = 0.723 It is important to point out that positive and negative Q values highlight the flow regions with stronger rotation and shear strain, respectively. By α ≈ 19.4° − 19.7°, (in Figure 9(d)) this leading-edge separated structure has rolled up and evolved into the dynamic stall vortex (DSV), producing large-scale separation over the suction surface. The later-stage vortex over the airfoil should therefore be interpreted as the DSV, or its evolving remnant. This interpretation is consistent with established dynamic-stall literature, in which the compact pre-stall leading-edge separated state loses its attached-bubble character and evolves into a larger convecting DSV as stall onset is approached.
9
Pressure coefficient contour at (a) t/τ = 0.650, (b) t/τ = 0.685, (c) t/τ = 0.723, and (d) t/τ = 0.760. Two-dimensional contours of positive (in red) and negative (in blue) Q values on the mid plane of the flow domain at (a) t/τ = 0.650, (b) t/τ = 0.685, (c) t/τ = 0.723, and (d) t/τ = 0.760.

Before onset of stall, the pressure distributions around the wing in Figure 8(a) and (b) remain relatively regular. More specially, distinct leading-edge suction peaks are observed at these time instants, indicating that the boundary layer is still largely attached to the surface with a LSB present near the leading edge. This bubble maintains favorable pressure gradients, supporting lift generation. Additionally, small-scale surface pressure voids and trailing-edge vortices (TEVs) can be identified in the middle zone of the wing along the chord. These structures maintain a constructive difference in pressure between the upper and lower surfaces, ensuring a stable lift force.
As the airfoil continues pitching up (see Figure 8 at t/τ = 0.723), the flow structure undergoes a rapid transition process. The low-pressure region (shown in Figure 8a–(d)), which previously remain distinct and separated, merge into a single large low-pressure region above the surface of the wing. It occurs as the LEV grows and coalesces with smaller vortical structures, effectively causing low pressure in its surrounding to make the local air flow into this region. Additionally, the collapse of the large pressure difference between the upper and lower surfaces of the wing results in a sudden fluctuation in the aerodynamic load, which can induce undesirable structural vibrations. In Figure 8(d), the airfoil begins pitching downward, and the merged low-pressure zone still remains dominant, and the reattachment of the flow with the wing gets delayed. This evolution of the pressure-field is consistent with the deterioration of suction and the associated loss of aerodynamic loading during dynamic stall, as shown in Figures 4(b) and 5(b) for temporal histories of the lift coefficient history The strong adverse pressure gradient at the leading edge causes complete flow separation, and no coherent high-suction region is maintained on the top surface of the wing.
Further insights are gained from the two-dimensional mid-plane contour analysis of vortex and shear flow structures presented in Figure 9, where Q-criterion is employed to distinguish between coherent vortex regions (Q > 0) and shear-dominated regions (Q < 0). At t/τ = 0.650 (see Figure 9(a)), coherent vortex structures remain prominent near the wing, which is consistent with the relatively organized pre-stall state. As the pitching motion progresses, the leading-edge separated structure expands and the competition between coherent vortical motion and shear-dominated separation becomes more evident. Near stall onset, the influence of downstream shear-layer unsteadiness becomes stronger, and the flow over the upper surface loses its earlier coherent organization. By the later stages shown in Figure 9(c) and (d), the structured leading-edge separated region has evolved into a larger convecting vortex and its fragmented remnants, while the surrounding shear-dominated regions become more prominent. This progression indicates a transition from an organized pre-stall separated state to a more irregular separated flow characteristic of dynamic stall.
Proper orthogonal decomposition analysis
In our study of POD modes here, we carefully extract the data in the cylindrical pitching zone in which the airfoil geometry is located as shown in Figure 1 previously. Specifically, we extract data by first defining a three-dimensional rectangular sampling volume around the airfoil.
15
This box spans from −0.25c to +0.25c in the nodal (z) direction and from −0.25c to +1.5c in the longitudinal (y) direction, all referenced to the airfoil’s origin. At each time step, as the airfoil undergoes its sinusoidal pitch motion, we apply a rigid-body rotation to the entire computational domain, including this rectangular region, so that the box remains aligned with the airfoil’s instantaneous orientation.
46
Finally, velocity and pressure fields are interpolated within this rotated volume for modal decomposition The rectangular domain contains the 60 × 150 × 60 cells in x-, y- and z-directions, respectively. Due to the data-driven nature of the technique, we carefully extract the data according to its angular position and then performing linear interpolation to the inner domain. Even though it is voluntary to make the time-average profile exclusive,
47
the implementation is carried out for better accuracy and flow field kinematics around the wing through a decomposition into a (N
U
+ N
V
+ N
W
) × N
T
matrix. Once the velocity field is adequately aligned, we construct a velocity matrix, where each row corresponds to a spatial location, and each column represents a snapshot in time. The velocity matrix is then subjected to singular value decomposition (SVD) to extract the dominant modes:

The POD technique is employed here as an energy-ranking tool for interpreting the resolved flow structures, where the modal ranking identifies the fraction of fluctuation kinetic energy carried by each mode. The purpose of its employment is to distinguish the dominant large-scale coherent motions from progressively weaker, more fragmented wake-dominated fluctuations in the DES-resolved flow field.

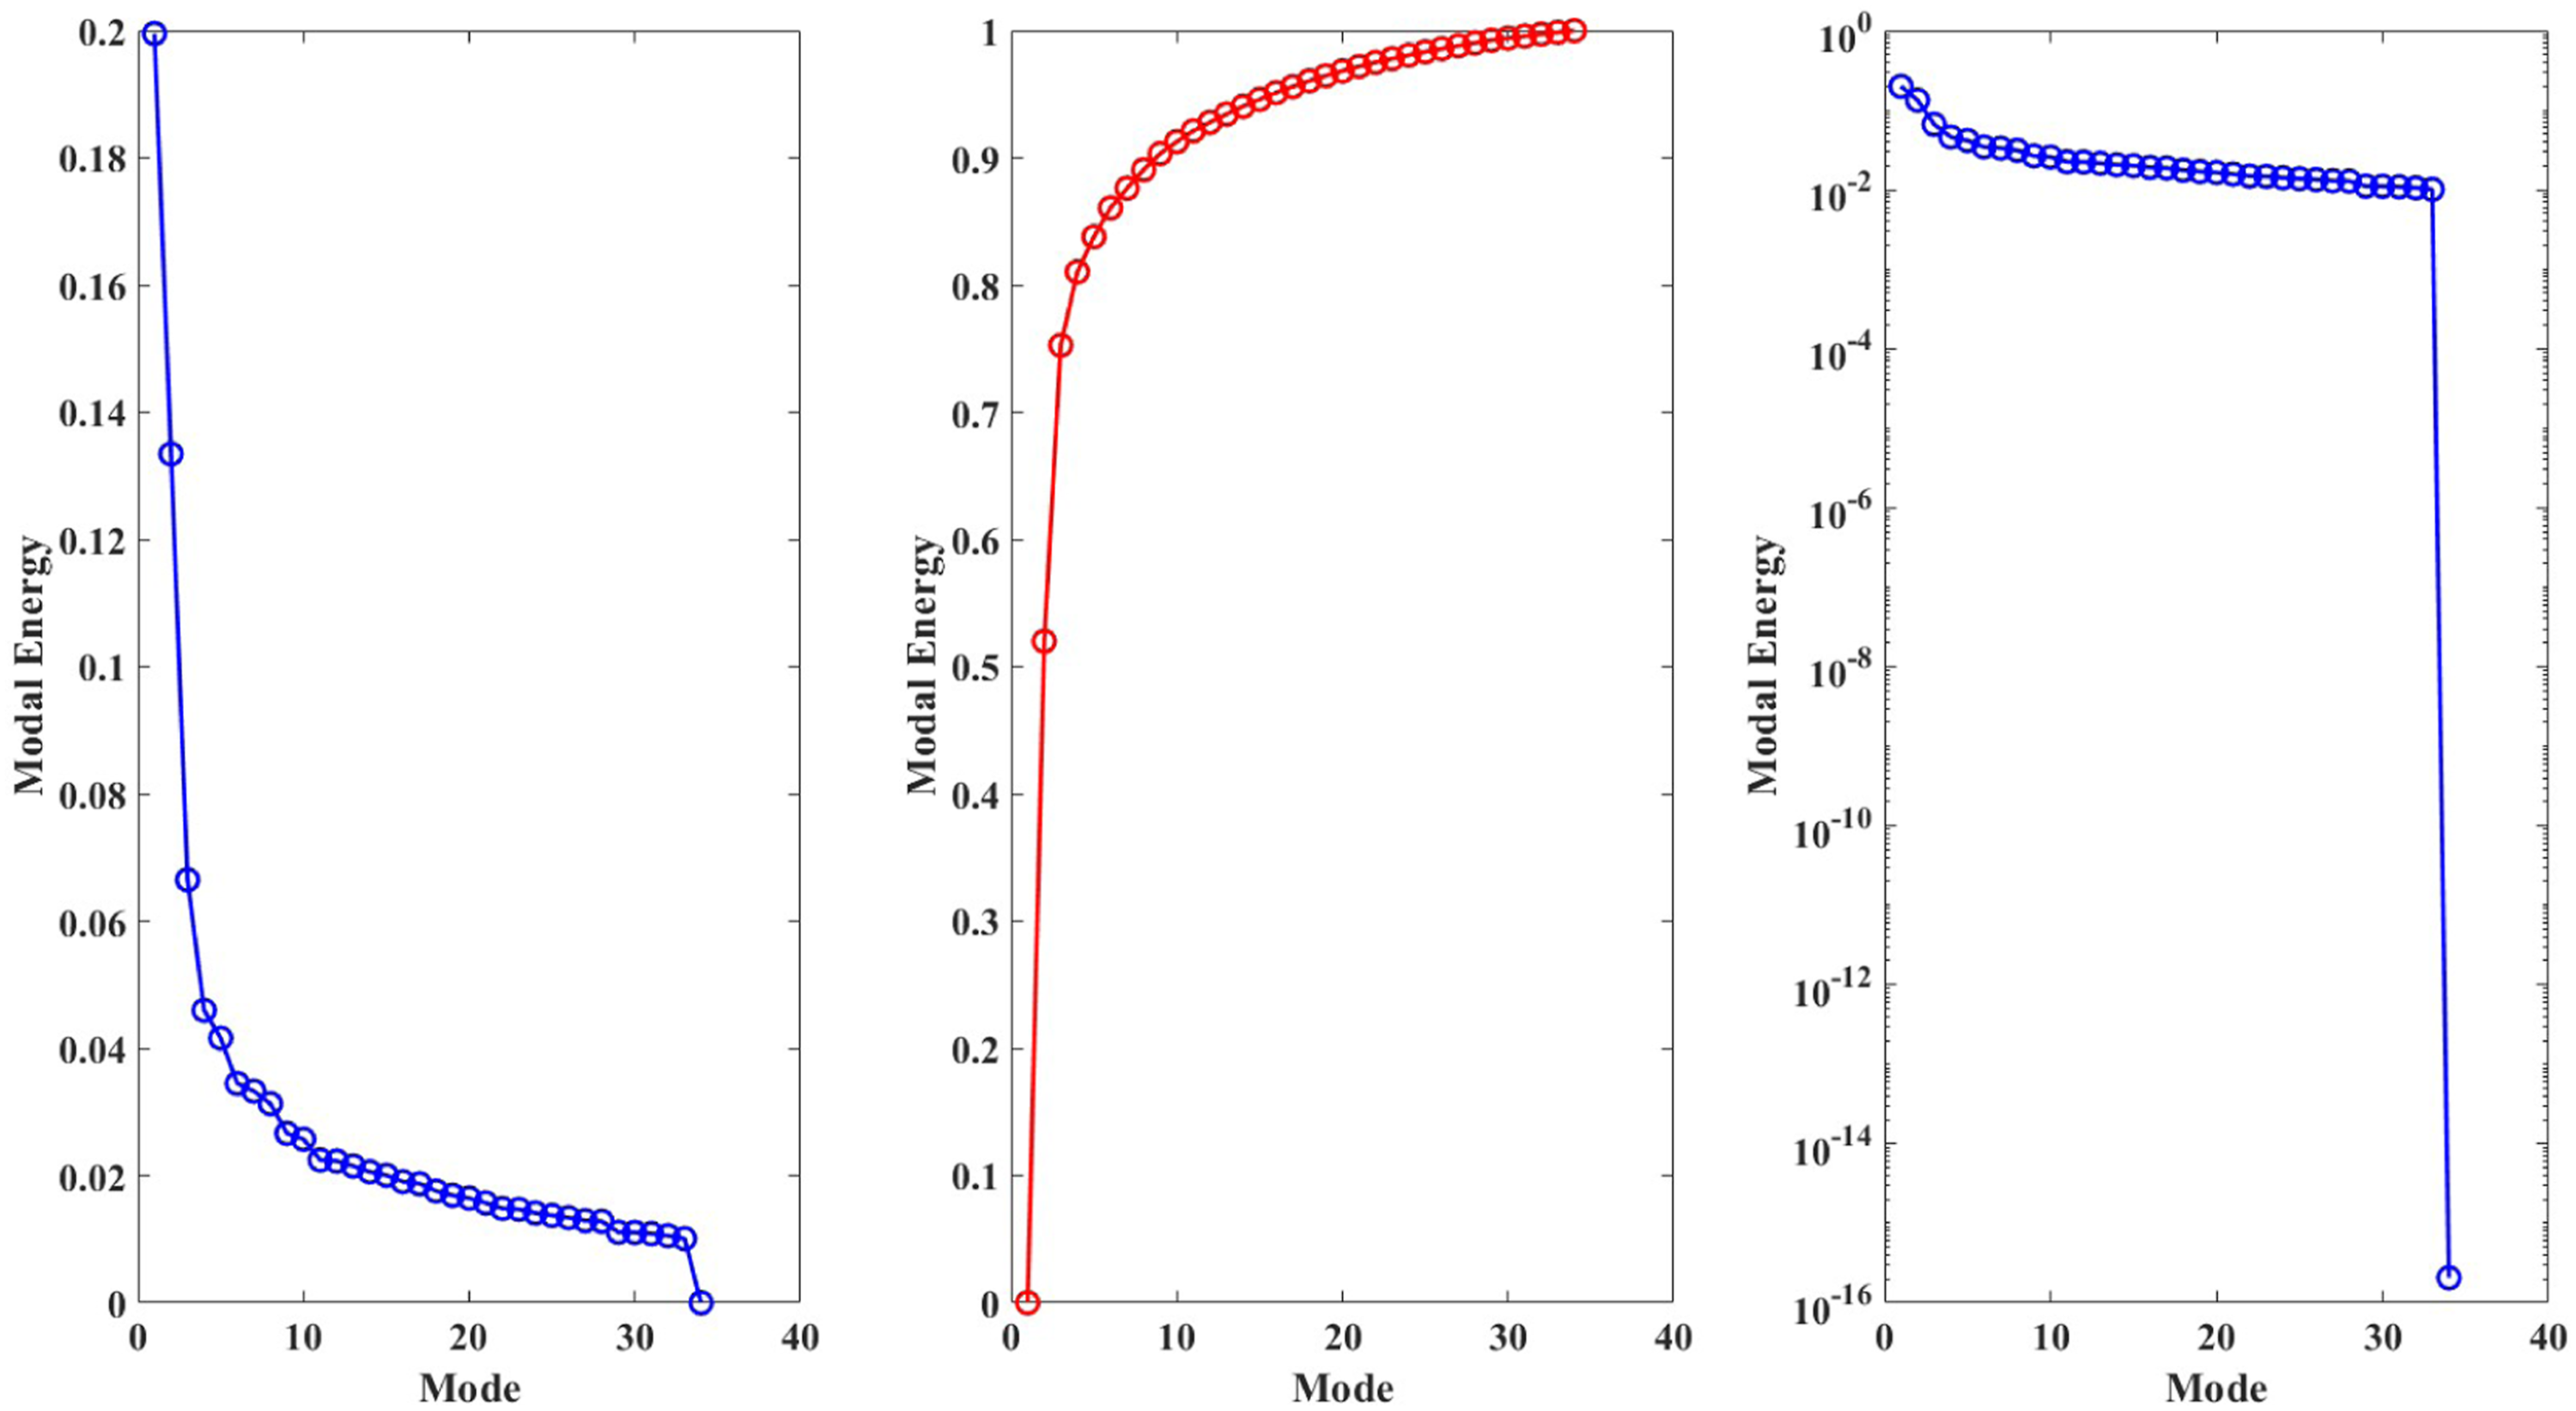
Figure 10 summarizes the energy distribution among the POD modes. For the present transitional Reynolds-number case, approximately the first 15 modes are required to capture about 98% of the fluctuation energy, indicating that although the leading coherent structures dominate the flow, a non-negligible contribution also arises from weaker higher-order unsteadiness. The cumulative modal reconstructions in Figure 11 demonstrates how the cumulative POD reconstruction progressively recovers the resolved flow structures. In Figure 11(a), the reconstruction using Modes 1–3 captures the dominant large-scale leading-edge structure with weaker trailing-edge vortices visible in the full-order instantaneous flow field. Including Modes 4 and 5, (see Figure 11(b)) improves the representation of the trailing-edge vortex features, although some differences in size and placement remain. By the reconstruction including Modes 1–9, the major leading-edge and trailing-edge structures are reproduced much more faithfully, indicating that the additional modes primarily refine the smaller-scale spatial detail rather than altering the dominant large-scale flow organization.
48
Modal energy (left) cumulative energy (middle) and modal energy in logarithm scale (right) and as a fraction of the total energy. Cumulative Modal Reconstruction from (a) Mode 1-3, (b) Mode 1-5, (c) Mode 1-9, and Comparison with the Original Flow (d) at t/τ = 0.450 plotted using iso-surfaces of Q = 2000 coloured by V/V
∞

POD Mode one captures the large-scale vortex formation near the leading edge of the airfoil (see Figure 12(a)), which is the most energetic mode (20%) of turbulent kinetic energy. Physically, this mode reflects the primary organized motion associated with the leading-edge separated region during the pitching cycle. Because the leading-edge flow strongly influences separation onset, suction development, and vortex roll-up, it is expected that this region dominates the low-order modal energy content. The coherence of this structure visualized through three-dimensional iso-surfaces of Q-criterion (stronger vortices in red with Q = 0.5 and weaker vortices with Q = 0.1) highlights the importance of Mode one in forming the flow energy and governing the dynamics at the leading edge. This coherent structure facilitates the initial roll-up of the shear layer, forming the foundation for the development of secondary vortices and wake dynamics. Furthermore, the most intense flow activity, including vortex formation, LSB, and spanwise flow instabilities, occurs on the leading and trailing edges. These regions dominate the kinetic energy of the flow, which are captured as the most energetic modes in POD. Isosurfaces of Q-criterion computed through velocity POD modes 1 − 4 where blue and red structures represent the normalized Q-criterion (Q*) values of 0.1 and 0.5, respectively.
The second mode exhibits the formation of flow features around the trailing edge in Figure 12(b) that also involve some secondary structures in the leading and trailing zones. Compared with Mode 1, the structures represented in Mode two are less spatially coherent and more clearly linked to downstream vortex shedding and wake development (see Figure 12(a) and (b)). This mode, therefore, reflects the organized trailing-edge contribution to the unsteady aerodynamic response, including the structures that later interact with the wake and contribute to oscillatory loading. Consequently, the Q values-based visualizations associated with Mode two show smaller and less coherent structures compared to Mode 1, indicating the downstream propagation and dissipation of these vortices. These TEVs ultimately interact with the wake, contributing to oscillatory forces and the periodic shedding characteristic of unsteady flows.
Mode three to mode six capture progressively finer-scale unsteadiness associated with the separated shear layer and the near-wake region as shown in Figure 12(c)–(f). These structures are more localized and less coherent, indicating that they represent secondary fluctuations superimposed on the dominant large-scale motion, e.g LSB transforming into smaller turbulent bubbles during dynamic stall. The fragmented nature of the vortices in these modes is evident here, which show dispersed and less coherent vortical structures. These shear-layer instabilities, mentioned previously, possibly represent energy cascade to smaller scales, which is a characteristic feature in transition to turbulence.
As the POD mode number increases beyond 27, the visualizations in Figure 13 resolved activity becomes increasingly concentrated in the wake region. It is apparent that that higher-order modes primarily capture wake dynamics and turbulent dissipation, rather than coherent vortex structures near the wing’s surface. These higher-order modes contain substantially less energy than the leading modes and primarily represent weaker, smaller-scale, and less coherent wake fluctuations rather than the dominant near-body structures. This shift implies a transition from dominant aerodynamic features to the finer details of wake turbulence, providing a comprehensive picture of the energy cascade in the wake region. Q-criterion visualizations which are mentioned previously confirmed that, during stall, the flow transitions from coherent vortex structures to large-scale turbulence. The organized shedding of leading-edge vortices in the pre-stall condition breaks down into chaotic, broadband turbulence in the stall phase. It could potentially result as a flow intensifier to increase the spanwise instabilities and the production smaller eddies, which are further discussed in Figures 12 and 16. Isosurfaces of Q-criterion computed through velocity POD modes 27 − 30 where blue and red structures represent the normalized Q-criterion (Q*) values of 0.1 and 0.5, respectively.
Velocity and vorticity contours offer complementary perspectives to the POD analysis, enriching our understanding of the flow field dynamics. The two-dimensional velocity fields reveal prominent flow structures, such as the separation and reattachment zones near the leading and trailing edges. High velocity gradients near the leading edge corroborate the dominant energy contribution of Mode 1, aligning with the initiation of vortex shedding. In contrast, the trailing edge regions display more complex velocity distributions, shaped by the wake interactions and oscillatory nature of the airfoil motion.
Velocity contours shown in Figure 14, particularly the spanwise-velocity components (U), provide a more granular view of the span-wise flow dynamics to help visualize the flow instabilities, especially in the spanwise direction introduced by the trailing edge vortices instabilities mentioned before (see Figure 9(a)–(d)). Not only, these flow-instability characteristics are further confirmed by Q-criterion contours on the middle plane in Figure 16. On the other hand, positive and negative vorticity components, along with the q-criterion contour in Figure 16 gives the perspective to the viewers that when the span-wise instabilities are introduced, the behaviors and coherence of the vorticies on the leading edge and on the surface of the airfoil. Specifically, we find from Mode one to Mode 2, the positive x-vorticity (highlighted in white in Figure 14) is shifted from the leading edge region to the trailing edge region. This transition is accompanied by a reduction in large-scale coherence and by increasing small-scale activity in the wake and these features can be recognized as the indicators of fragmented unsteadiness. It is important to note that spanwise flow instabilities in Modes one and two are lower shown in Figure 14, as the spanwise flow velocity in relative low compared to the higher order modes. The four most energetic modes. Mode 1 (a), Mode 2 (b) Mode 3 (c), and Mode 4 (d) with positive and negative spanwise vorticity (Vx) displayed in white and blue respectively, and overlaid with contours representing streamlines of clockwise and counter clockwise rotation in black and white, respectively.
Velocity contour (see Figure 16) and vorticity contours (see Figure 14) provide a complementary view of the POD results by showing how the modal structures are distributed near the airfoil and in the wake. The low-order modes are associated primarily with coherent near-body structures, especially the leading-edge and trailing-edge separated regions, whereas the higher-order modes exhibit weaker and more fragmented wake activity. In the low-order modes, the spanwise-velocity fluctuations remain comparatively modest, which is consistent with the more organized character of the dominant coherent structures. By contrast, the higher-order modes display increasingly irregular wake patterns and less coherent vorticity organization. This comparison supports the interpretation that the first few modes represent the primary aerodynamic structures governing dynamic stall, whereas the later modes mainly refine the description of secondary wake fluctuations.
In the case of the pitching airfoil, the higher-order modes shown in Figures 15 and 16 are dominated primarily by wake-region activity. These modes represent weaker and more irregular fluctuations, including elongated and fragmented trailing-edge structures influenced by spanwise unsteadiness. Their lower energy content indicates that they are secondary to the dominant near-body structures captured by the low-order modes. Accordingly, the higher-order modes are interpreted as refining the description of wake-dominated fluctuations rather than representing the principal aerodynamic mechanisms responsible for stall onset. As shown in Figures 15, the turbulent intensities are particularly high as presented through Modes 27 to 30, and the spanwise velocity (U*) is highly intensified. However, for a better understanding, the scale of the spanwise velocity color bar are brought down to match the data presented in Figure 14. The process of vortex shedding seen in Figures 15 and 16 captured by each modes are the underlying for wake dynamics exhibiting less kinetic energy than the vortex shedding process near the surface of the wing (see Figures 14 and 16). Last four modes27–30 from POD. Mode 27 (a), Mode 28 (b) Mode 29 (c), and Mode 30 (d) with positive and negative spanwise vorticity (Vx) displayed in white and blue respectively, and overlaid with contours representing streamlines of clockwise and counter clockwise rotation in black and white, respectively.

Conclusion
This study employed detached-eddy simulation and proper orthogonal decomposition to investigate the dynamic-stall process over a pitching NACA 0018 wing at transitional Reynolds number. The results show that the pre-stall flow retains an organized leading-edge state and relatively coherent flow activity at the trailing-edge, whereas continued pitch-up promotes stronger separated-flow unsteadiness, broadening of the low-pressure footprint over the suction surface, and eventual deterioration of aerodynamic loading.
A central clarification of this work relates to examining the distinction between the compact pre-stall leading-edge separation bubble and the much larger leading-edge separated structure that develops into the dynamic stall vortex. The broad suction region observed near stall onset is therefore interpreted as the pressure signature of the evolving DSV.
The POD analysis further shows that the dominant fluctuation energy is concentrated in the first few low-order modes associated with the largest coherent structures near the wing, while higher-order modes are increasingly wake-dominated and less coherent. In this sense, POD provides an energy-ranked interpretation of the resolved flow organization, with higher-order modes indicating progressively smaller-scale and more fragmented wake activity.
The present results provide useful physical insights into dynamic-stall vortex evolution in a representative pitching-wing configuration relevant to unsteady blade aerodynamics. Although the present pitching-wing setup is intentionally simplified, it captures key dynamic-stall mechanisms relevant to aerodynamics of a blade in a VAWT and provides a controlled basis for future studies incorporating rotational and blade-wake interactive effects. Examining the applicability of the findings for a broad range of kinematics of a pitching wings with larger spans sets up the scope of our future work.
Footnotes
Acknowledgment
The computational work and simulations reported here were performed on the supercomputing clusters administered and managed by the Digital Research Alliance of Canada.
Funding
The authors disclosed receipt of the following financial support for the research, authorship, and/or publication of this article: MSU Khalid acknowledges the funding support from the Natural Sciences and Engineering Research Council of Canada (NSERC) through the Discovery grant program. Both authors also pay thanks to MITACS for their support through the Globalink Research Award.
Declaration of conflicting interests
The authors declared no potential conflicts of interest with respect to the research, authorship, and/or publication of this article.