
Abstract
Contact-based profilometers have been the de facto standard in obtaining wheel and rail profiles for the purposes of vehicle-track and wheel-rail interaction studies. Still, they cannot collect profiles in large quantities. This paper explores the potential of laser-based profilometers for wheel and rail profile measurements in vehicle-track dynamic simulations. Comparisons between contact and laser-based profilometers were performed using sample rail profiles measured in the lab. Through contact simulations, contact preprocessing and multi-body dynamics simulations (MBD), differences in contact pressures, forces, and Y/Q were analyzed. The importance of data processing and profile smoothing is also discussed. Axle sum Y/Q showed the smallest differences between the two sets of profiles, with more than 80% of the MBD simulations having less than 10% difference. While far from perfect, the ability of wayside and vehicle-mounted laser profilometers can enable analyses to be performed at a much larger scale. The authors hope this work will lead to an open-minded approach to continue evaluating laser-based profiles in simulations.
Keywords
Introduction
In studying vehicle-track interaction, it is essential to accurately and precisely capture wheel and rail profiles to understand the most realistic wheel-rail contact conditions. Contact-based profilometers such as the MiniProf are widely accepted tools in profile collection. 1 They produce highly accurate and precise measurements. 2 Although the measurements are widely used for detailed studies ranging from wheel-rail forces to contact stresses, wear, and rolling contact fatigue, contact-based profilometers are restricted to controlled environments and targeted areas due to the requirement for manual human interaction. Contact-based measurements are especially impractical for measuring wheelsets in service without stopping trains or taking cars out of service. The speed at which profiles can be measured using contact-based profilometers also limits the number and frequency of samples that can be collected.
The concept of taking rail profile measurements using vehicle-mounted laser scanners emerged in the 1970s. By the 1990s, laser track measurement systems could continuously measure rail profiles at speeds up to 72 km/h.3,4 Since then, railway operators have widely adopted track geometry measurement systems capable of measuring rail profiles, although the usage of such systems has been mainly concerned with measuring track geometry deviations and rail wear.5–7 Wheel profile measurement systems (WPMS) are laser scanner-based wayside devices that take laser scans of each passing wheel at speed and can enable the train operator to collect wheel profiles in significantly higher quantity and frequency than traditional contact-based profilometers. 8 By the early 2000s, several commercially available systems were already on the market. 9 Similar to the laser-scanned rail profiles, WPMS scans have primarily been used to determine wheel wear,8,10–13 and the main interest remains within the sets of dimensions traditionally measured using gauges, such as flange height, thickness, and slope, as well as tread hollowing. Evaluations of WPMS have been conducted to assess the accuracy, repeatability, and reproducibility of wheel profile measurements using analytics and by comparing profiles measured from two systems, where the results show that the wheel-rail contact condition could be significantly impacted by deviations resulting from data quality and deviations between systems.14,15
With the wider adoption of laser scanning technology, an opportunity presents for the railways to assess vehicle-track interaction more comprehensively than before through vehicle-dynamics simulation if the quality of wheel and rail profiles collected using laser-based profilometers is of an acceptable level. While research has continued through recent years into improving the accuracy and reliability of laser-based profilometers16–18 and comparisons have been made between wheels measured from WPD, 15 there seems to be a lack of publicly available information on the direct comparison between the two measurement techniques when used in simulations. This information gap raises the question: could profiles measured by laser scanners be used in simulations to achieve results comparable to those obtained with contact-based profilometers?
This paper reports an investigation by the authors into the inherent utility of laser-based wheel and rail profiles for vehicle-track dynamic simulations, and the trade-offs in accuracy and precision when compared with contact profilometer-based measurements. Rail samples were measured and compared in tandem in the laboratory to compare the two profile measurement technologies. Comparisons include analysis of measurement data points, preprocessing measured profiles for consumption in the multi-body dynamics (MBD) simulation software NUCARS, vehicle dynamics simulation results, and contact patch simulation results using the CONTACT Library for MATLAB.
Profile measurement and processing
There are currently two common types of profilometers for measuring wheel and rail profiles. They differ fundamentally by whether physical contact between the profilometer and the wheel or rail is required.
Contact-based profilometers use physical contact to trace and record the profile of the wheel or rail. A common profilometer used in the railway industry is the MiniProf. It uses a thin measurement wheel mounted on a two-degree-of-freedom mechanical arm that can trace the entire head of the rail or the flange, tread, and rim of the wheel. The measurement wheel is magnetized to ensure constant contact with the wheel or rail during the measurement process. A benefit of the contact-based profilometer is that the measurement wheel can cut through grease and debris buildup to get to the wheel or rail surface. Therefore, the measured profile is not affected by contaminants.
The contact-based nature of this approach also requires the operator to be near the wheel or rail, inspect the condition of the specimen, and remove any contaminants before measurement. The operator can also repeat the same measurement until a satisfactory result has been obtained. Despite its advances in accuracy, the manual operation of contact-based profilometers is relatively time-consuming and requires track time (for rail profile measurements) or the vehicle to be stationary and secured (for wheel profile measurements).
Laser profilometers use the reflection of laser beams to map the surface of wheels or rails to obtain the profiles. As a result, laser profilometers do not require contact with the measured objects and are more versatile in their applications. Laser profilometers can be a handheld device, vehicle-mounted, or permanently installed fixture for wheel and rail profile measurements. It is not uncommon to see a railway company use all three applications of laser profilometers. While laser profilometers allow for gathering many profiles with minimum disruption to railway operations, their lower precision and higher processing requirements often make them less suitable for detailed vehicle dynamics calculations. Laser measurements will also measure anything on the rail or wheel surface, such as grease or leaves, leading to an incorrect profile. This paper intends to explore the “acceptability” of laser profilometer profiles through a series of comparisons against profiles produced using MiniProf, especially in the context of derailment risk in curves.
Profile measurements
For the comparisons between contact and laser profilometer measurements, three sections of worn rail samples were selected from the laboratory at the Institute of Railway Research at the University of Huddersfield. The wear state for each rail sample varied in amount. For each rail section, measurements were taken using the laser profilometer and MiniProf from five different locations.
The contact-based measurements were taken using a standalone MiniProf BT Rail system. The laser profilometer was a Micro-Epsilon scanCONTROL 26xx series laser scanner mounted to a custom rack constructed in the laboratory. Since there was a single laser scanner, it was not possible to capture the whole profile in one scan. Spacers were used to tilt the scanner towards the gauge side to capture the entire gauge face. Since MiniProf measurements were taken perpendicular to the rail base, all measurements were manually rotated and aligned against a design reference profile to achieve a rail inclination of 1:20 before further processing.
Measurement data processing
The processing of raw measurement data from both devices was straightforward. The MiniProf companion software (called Envision) captures and processes the measurements and exports the profile measurements to text-based data files that are widely accepted by third-party software. The Micro-Epsilon laser scanner’s companion software also readily produces text files containing each 2-D coordinate pair.
Upon initial visual inspection of the measurement points, MiniProf profiles appeared relatively smooth. Visually, laser measurements were noticeably noisy and needed smoothing. Otherwise, both devices produced profiles that closely resembled each other. Figure 1 shows the comparisons of one select measurement using each method from each rail. Comparison between raw measurement data using the laser scanner and MiniProf. (a) Comparison between select MiniProf profiles to the reference 56E1 rail profile (formerly BS113 A with a 19.05 mm crown width). (b) Select laser measurements are overlayed on MiniProf measurements, showing the general match between the two methods. (c) Zoomed-in gauge corner showing the difference in smoothness between the laser and MiniProf profiles. The laser profiles are shifted downward by 1 mm for clarity.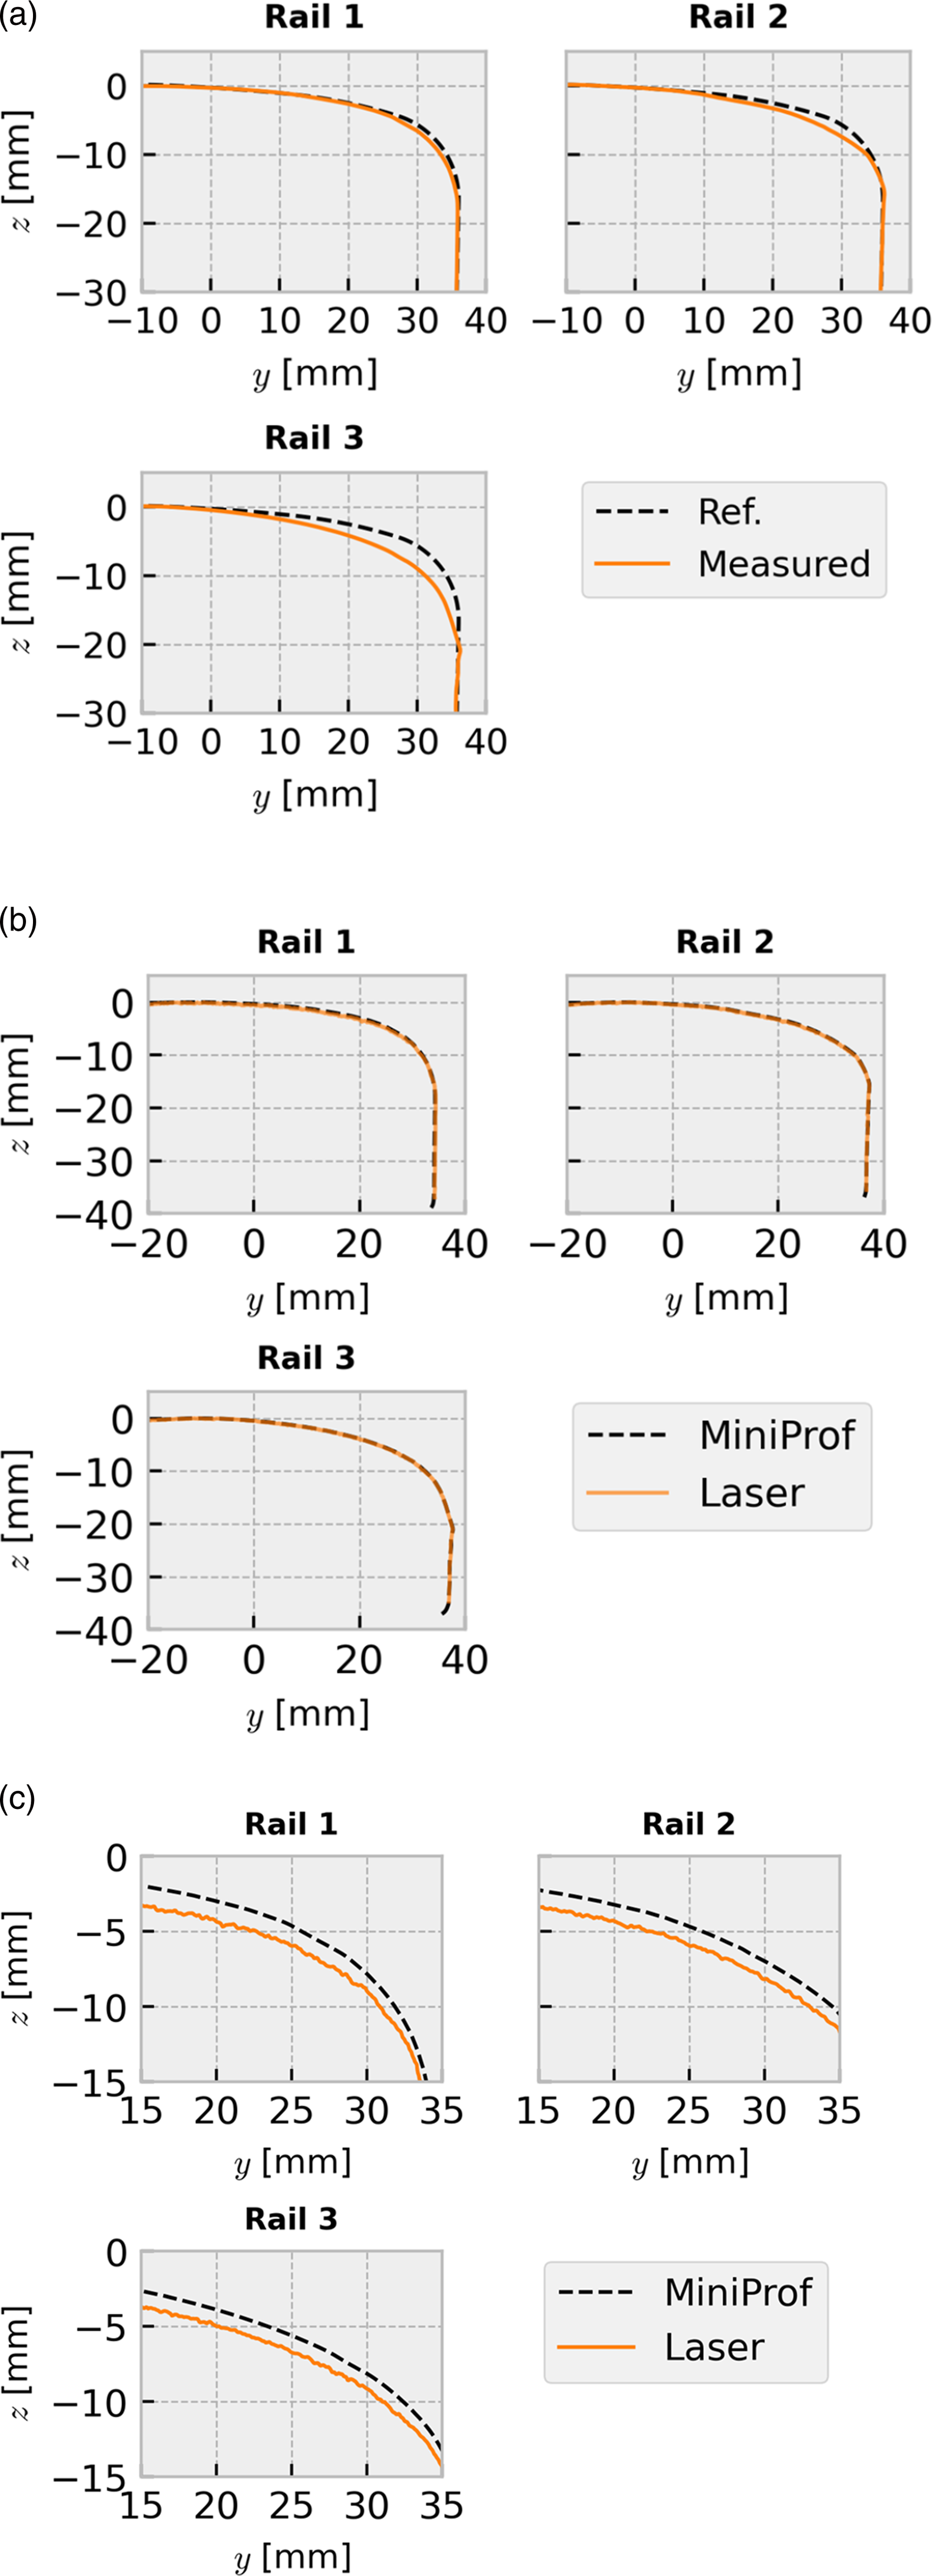
Attempts were made to use the raw laser measurements in the NUCARS contact preprocessor CFIT since it works by fitting a small number of circular arcs that are tangent to each other through the data points.
19
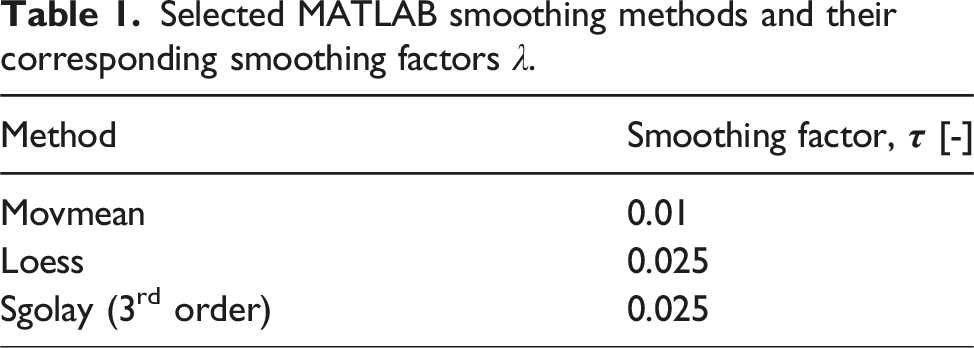
The arc fitting effectively smooths the profile measurements since cusps between arcs are not admitted. However, testing using CFIT with unprocessed laser measurement resulted in incomplete processing of the profiles, most likely due to excessive noise. An additional step was, therefore, required to smooth the laser measurements. Trials were carried out using the MATLAB smoothdata function with smoothing factors ranging from 0.05 to 0.25 in increments of 0.05 using the following smoothing methods: moving mean (movmean), moving median (movmedian), quadratic regression (loess), robust quadratic regression (rloess), and the third-order Savitzky-Golay filter (sgolay).
20
All four methods smooth the data,
Selected MATLAB smoothing methods and their corresponding smoothing factors
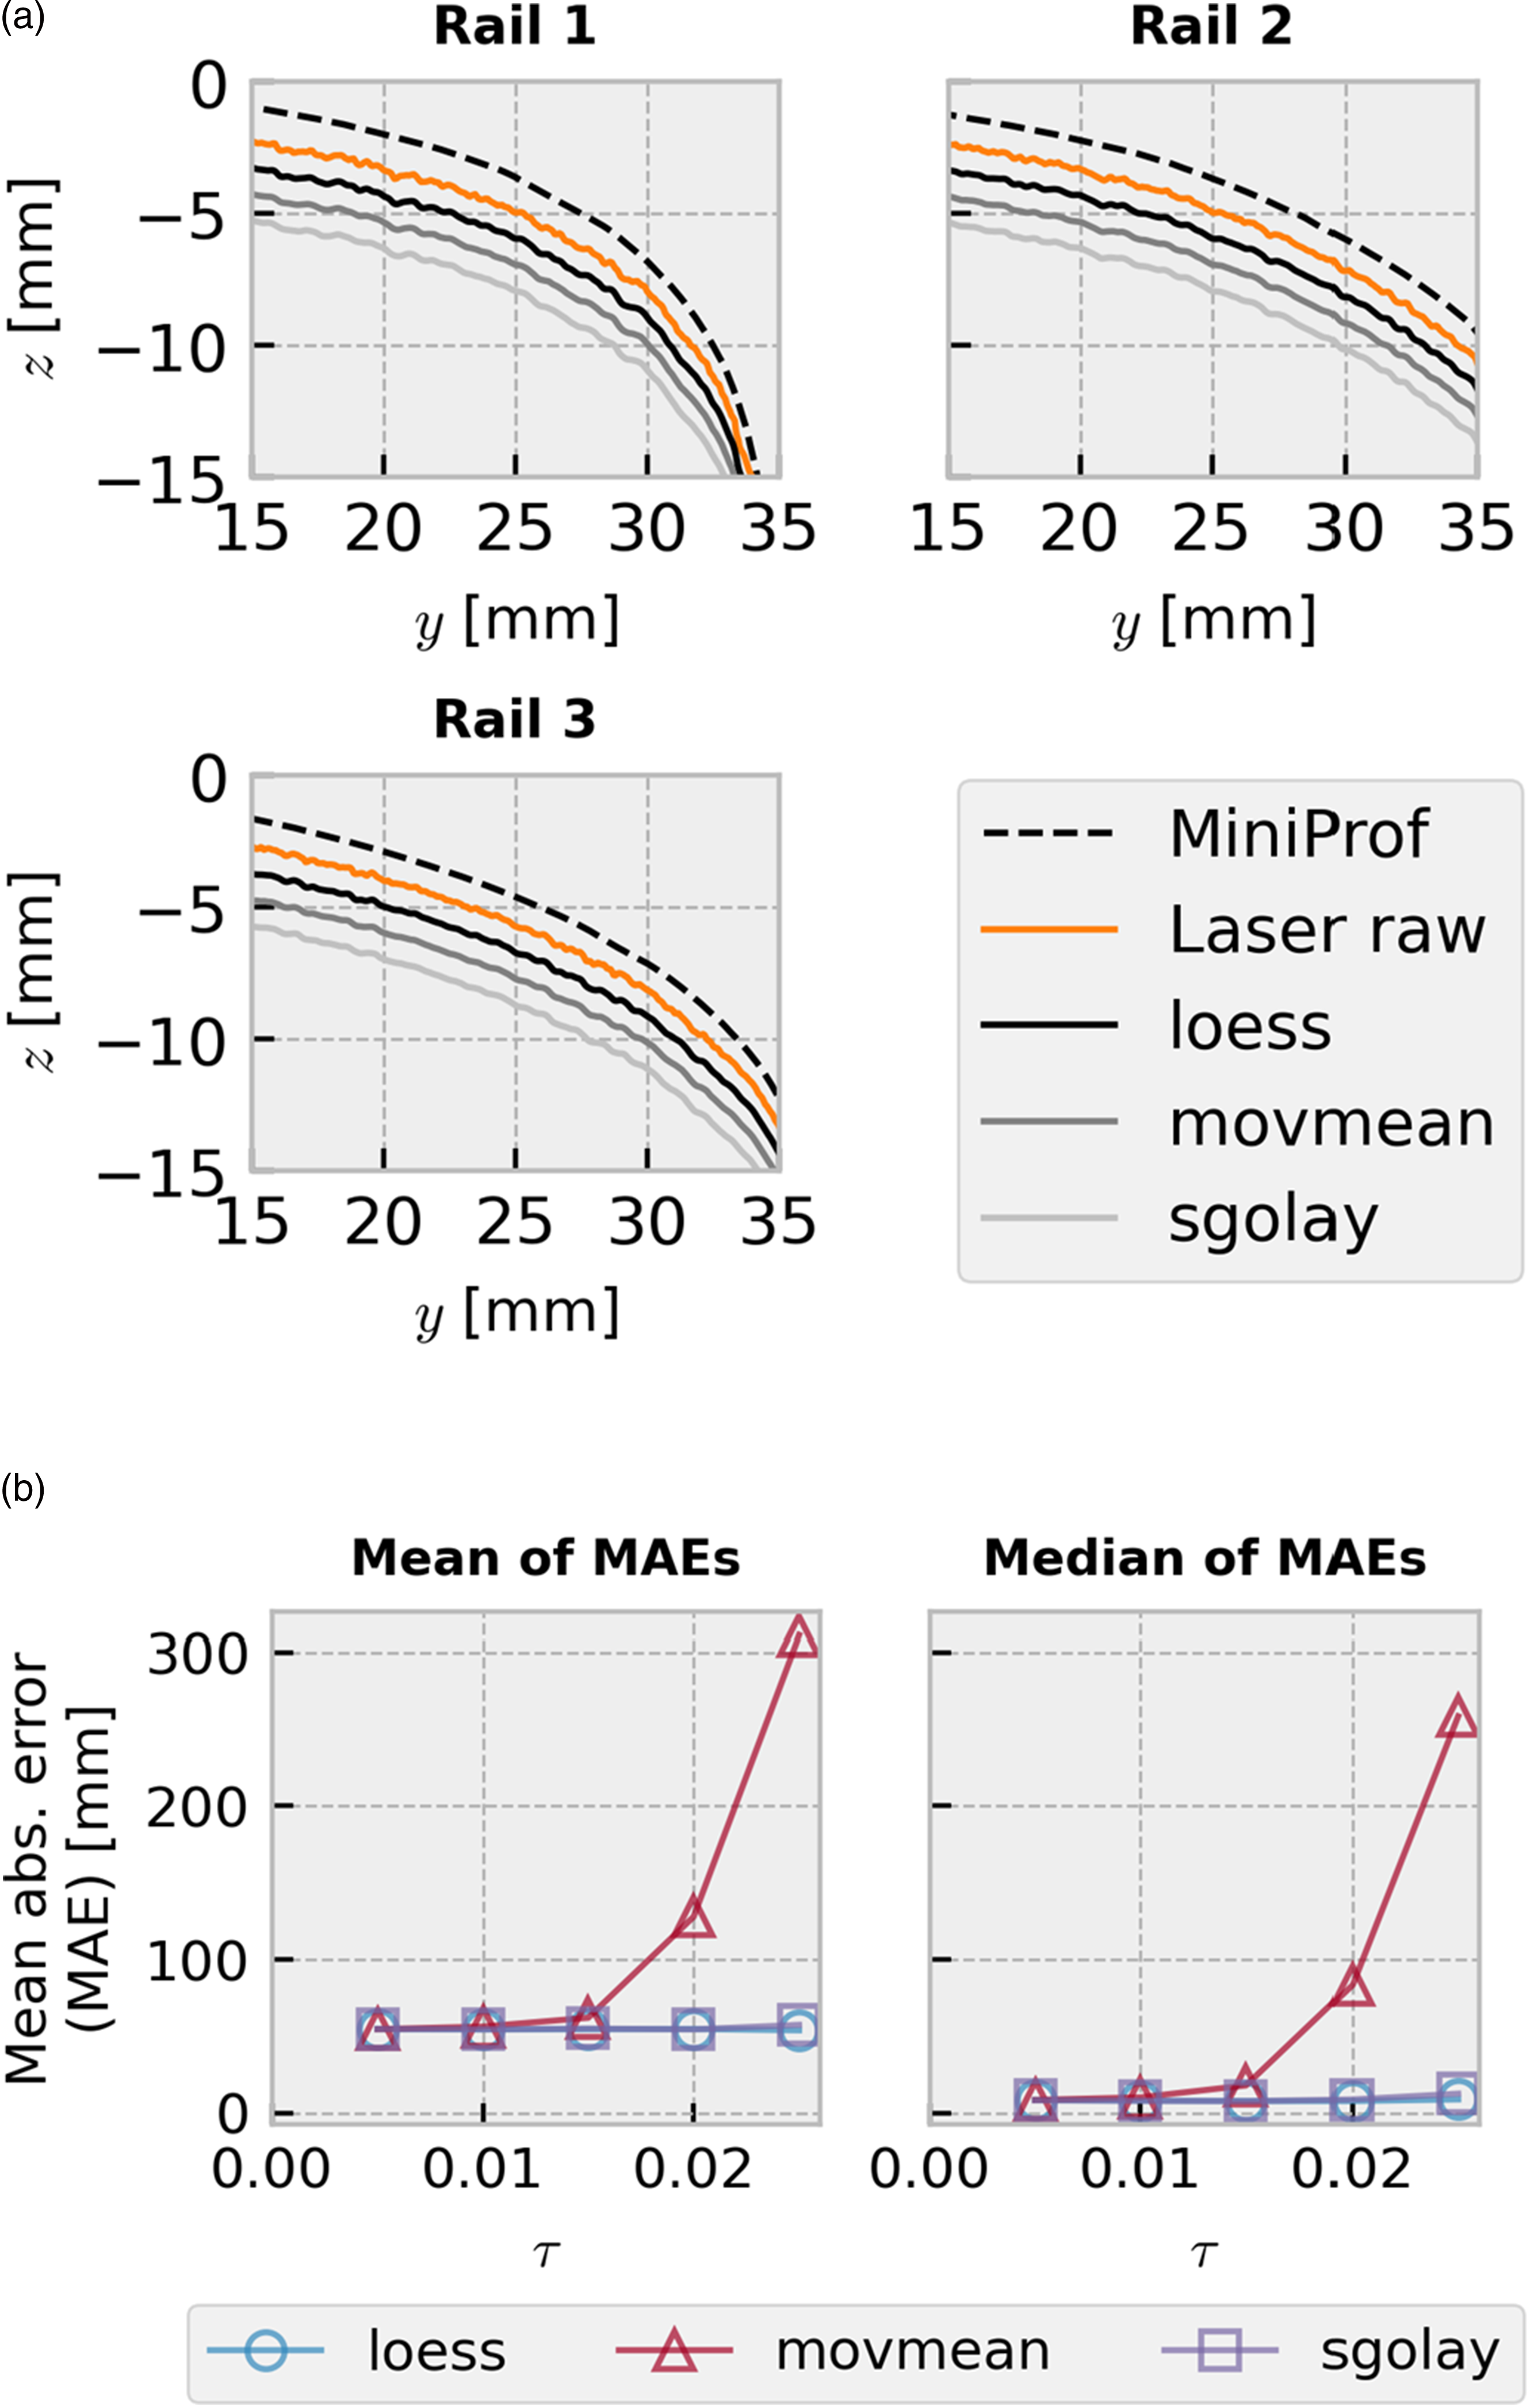
Results from the smoothing of raw laser profile measurements. (a) MiniProf, raw laser, and filtered laser profile measurements for select profiles for each rail (only gauge corner shown, shifted vertically for clarity). (b) Mean absolute errors between all smoothed laser and MiniProf profiles by smoothing method.
Comparisons through simulations
The authors’ interest in wheel and rail profile measurements lies in the insights that can be gained through analyses of the wheel-rail interaction, especially using many measured profiles to assess the quasi-real-time derailment risk and performance given the most current measurable condition of the vehicle and track. While various values could be of interest, the focus is particularly on Y/Q, also referred to as L/V in some settings, for comparison. Y/Q is the ratio between the lateral and vertical forces at the wheel-rail contact interface. It is one of the most assessed metrics by railway operators using vehicle dynamics simulations and is important in quantifying the state of railway equipment and operating conditions Figure 3.21–23 Resultant forces and flange angle at the wheel-rail contact location.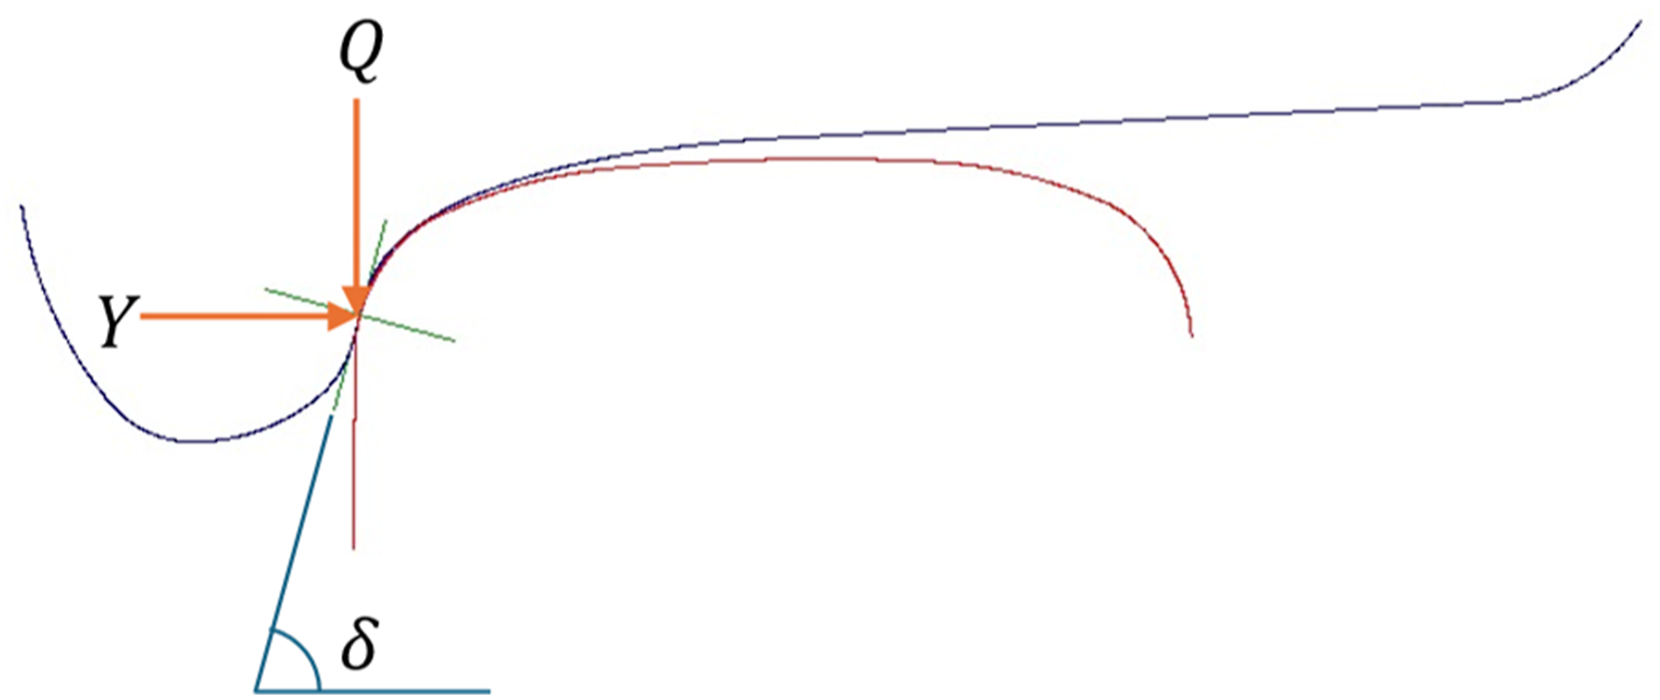
Derailment risk
It is generally accepted to use the Y/Q ratio to quantify derailment risk, which typically involves obtaining Y/Q ratios through MBD simulations and comparing them against their respective thresholds.
23
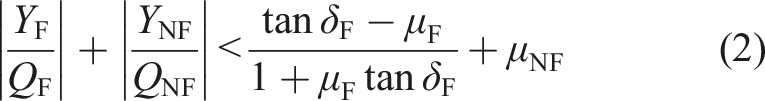
Examples of common Y/Q ratios used include Y/Q for a single wheel, as shown in Figure 3, or an axle, the thresholds of which can be estimated using Equations (1) and (2), respectively.21,22 Both the single wheel and axle sum Y/Q on the leading axle are commonly used to assess the risk of derailments due to flange climb.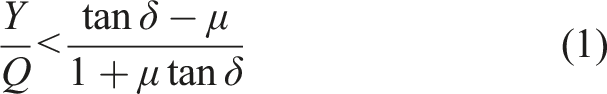
CONTACT Simulations
In many contexts, the goal of studying wheel and rail profiles is to assess metrics such as wear, curving forces, bogie hunting, etc. MiniProf is widely accepted as the de facto standard measurement format for simulation programs, such as NUCARS and CONTACT.19,24 Deviations, as shown in the previous section, can cast doubt on the validity of laser profile measurements, given their differences from the MiniProf measurements. While these concerns are valid, simulation preprocessors often perform additional smoothing to the profiles before calculations are performed, such as the arc-fitting in NUCARS or the smoothing factor specified for CONTACT.
Simulations were carried out using profiles produced by both methods to compare MiniProf and laser profile measurements in more realistic use cases. The differences in local stresses and global forces across the contact patch obtained between both profile measurements are assessed using CONTACT simulations. NUCARS simulations, on the other hand, are used to assess the effectiveness of laser profile measurements in determining derailment risks.
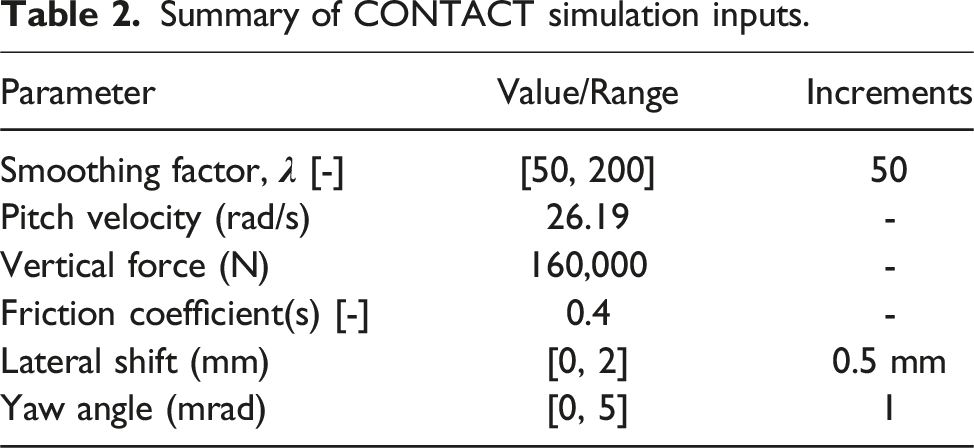
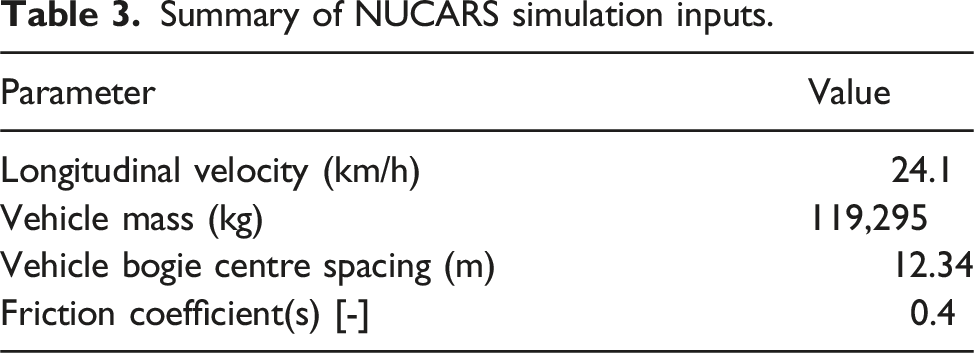
Summary of CONTACT simulation inputs.
Scatter plots of select summary results from using laser profile measurements against MiniProf measurements are shown in Figure 4(a); points that are on the diagonal lines mean that the result from the laser profile matches the MiniProf profile. Figure 4(b) shows the cumulative distributions of the absolute percentage differences between simulation results using laser and MiniProf profiles. The data presented in Figure 4(b) represent up to the 95th percentile of the differences. Since the differences between the three smoothing methods applied to laser profiles were not significant, these cumulative distributions included all three methods. While Figure 4(a) shows the differences between results using laser and MiniProf profiles visually, Figure 4(b) helps quantify these differences. Lastly, the median absolute differences between all simulation results using both measurement techniques are plotted against the smoothing factor in Figure 5. Comparisons of CONTACT simulation results between laser and MiniProf profiles. (a) CONTACT simulation results. A point on the diagonal means the results obtained from simulations using laser and MiniProf profiles match exactly. (b) Cumulative distributions of differences in CONTACT results (≤95th percentile). Median absolute differences (including outliers) in comparison metrics plotted against CONTACT smoothing factor.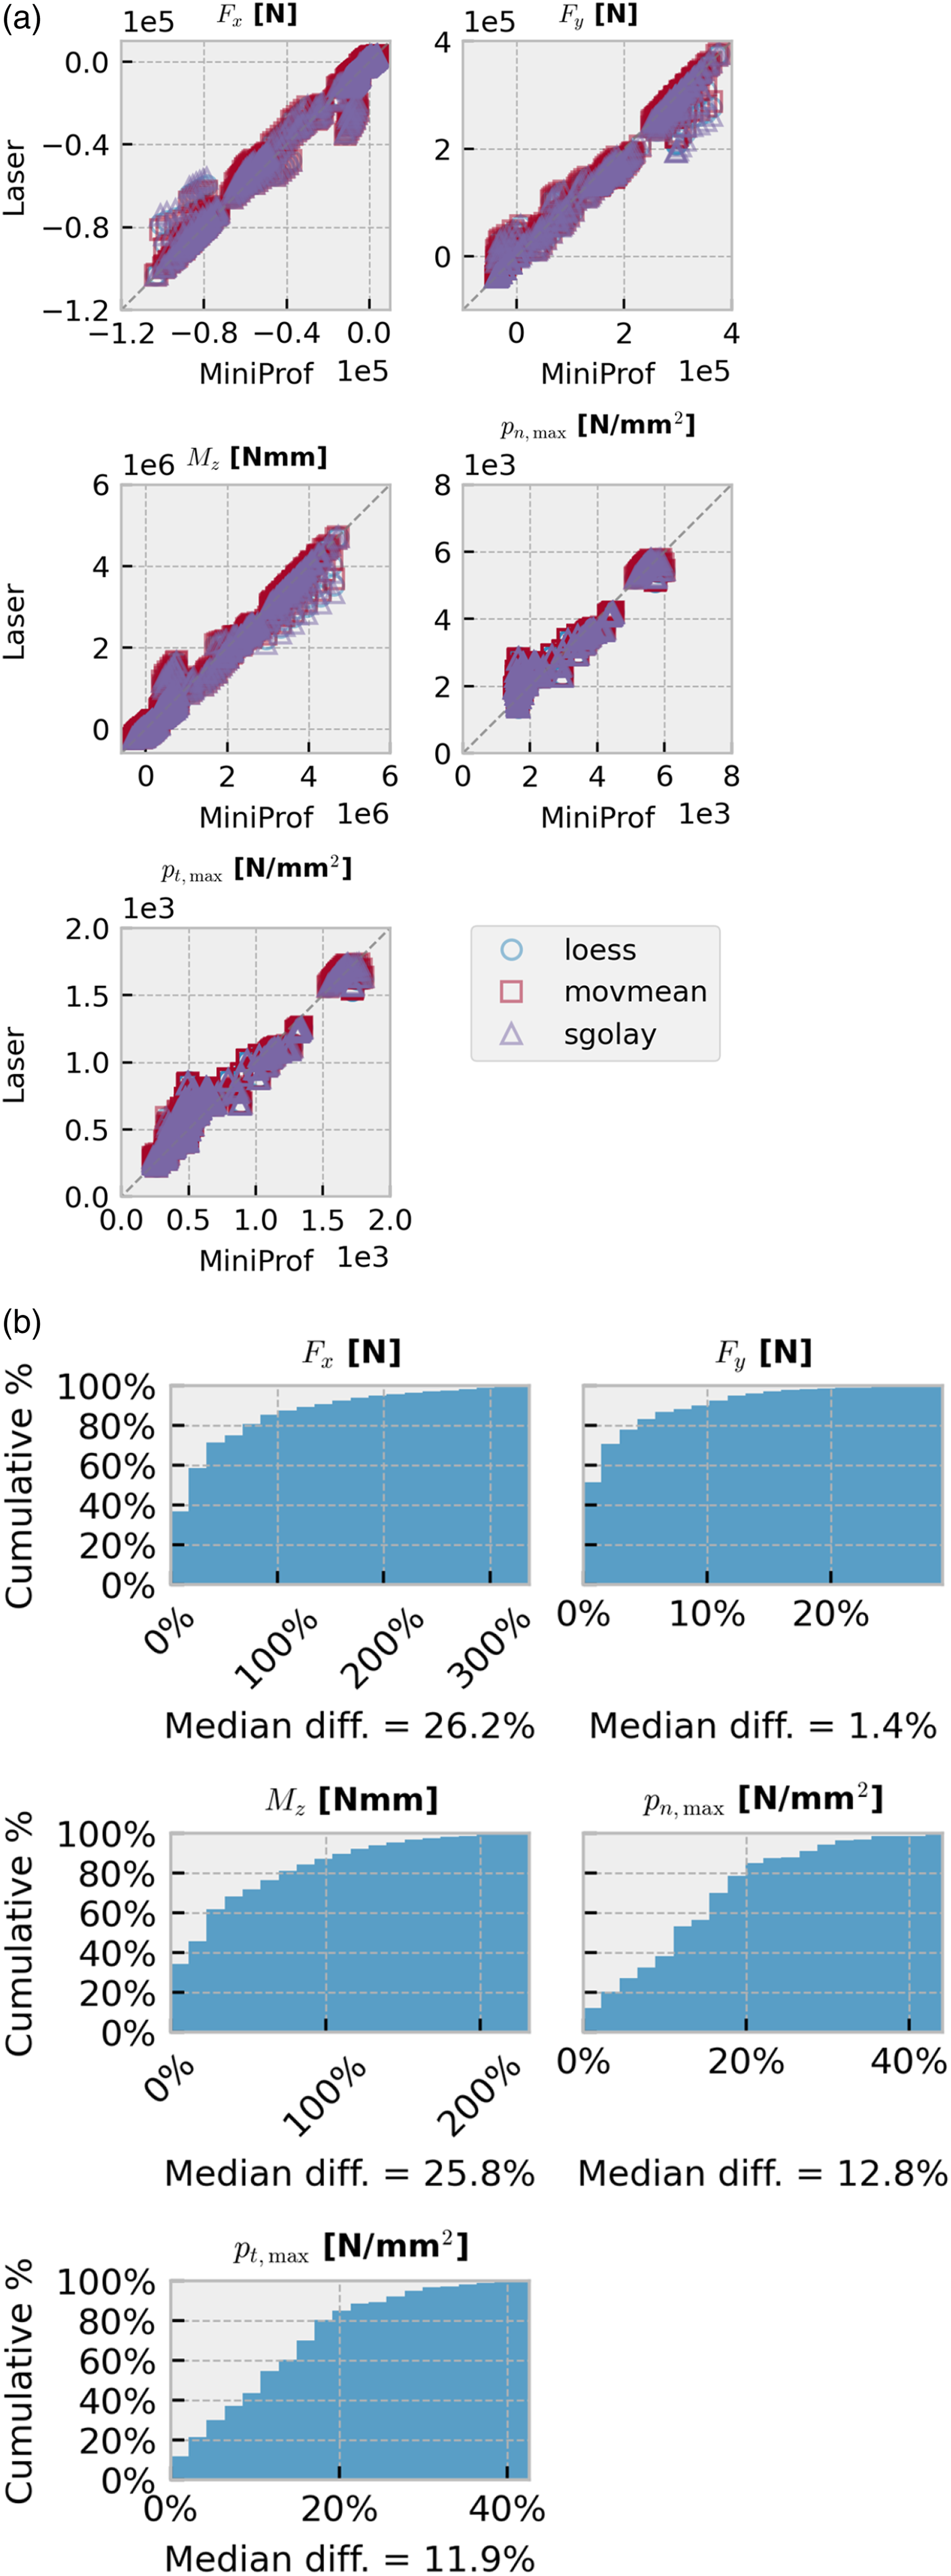
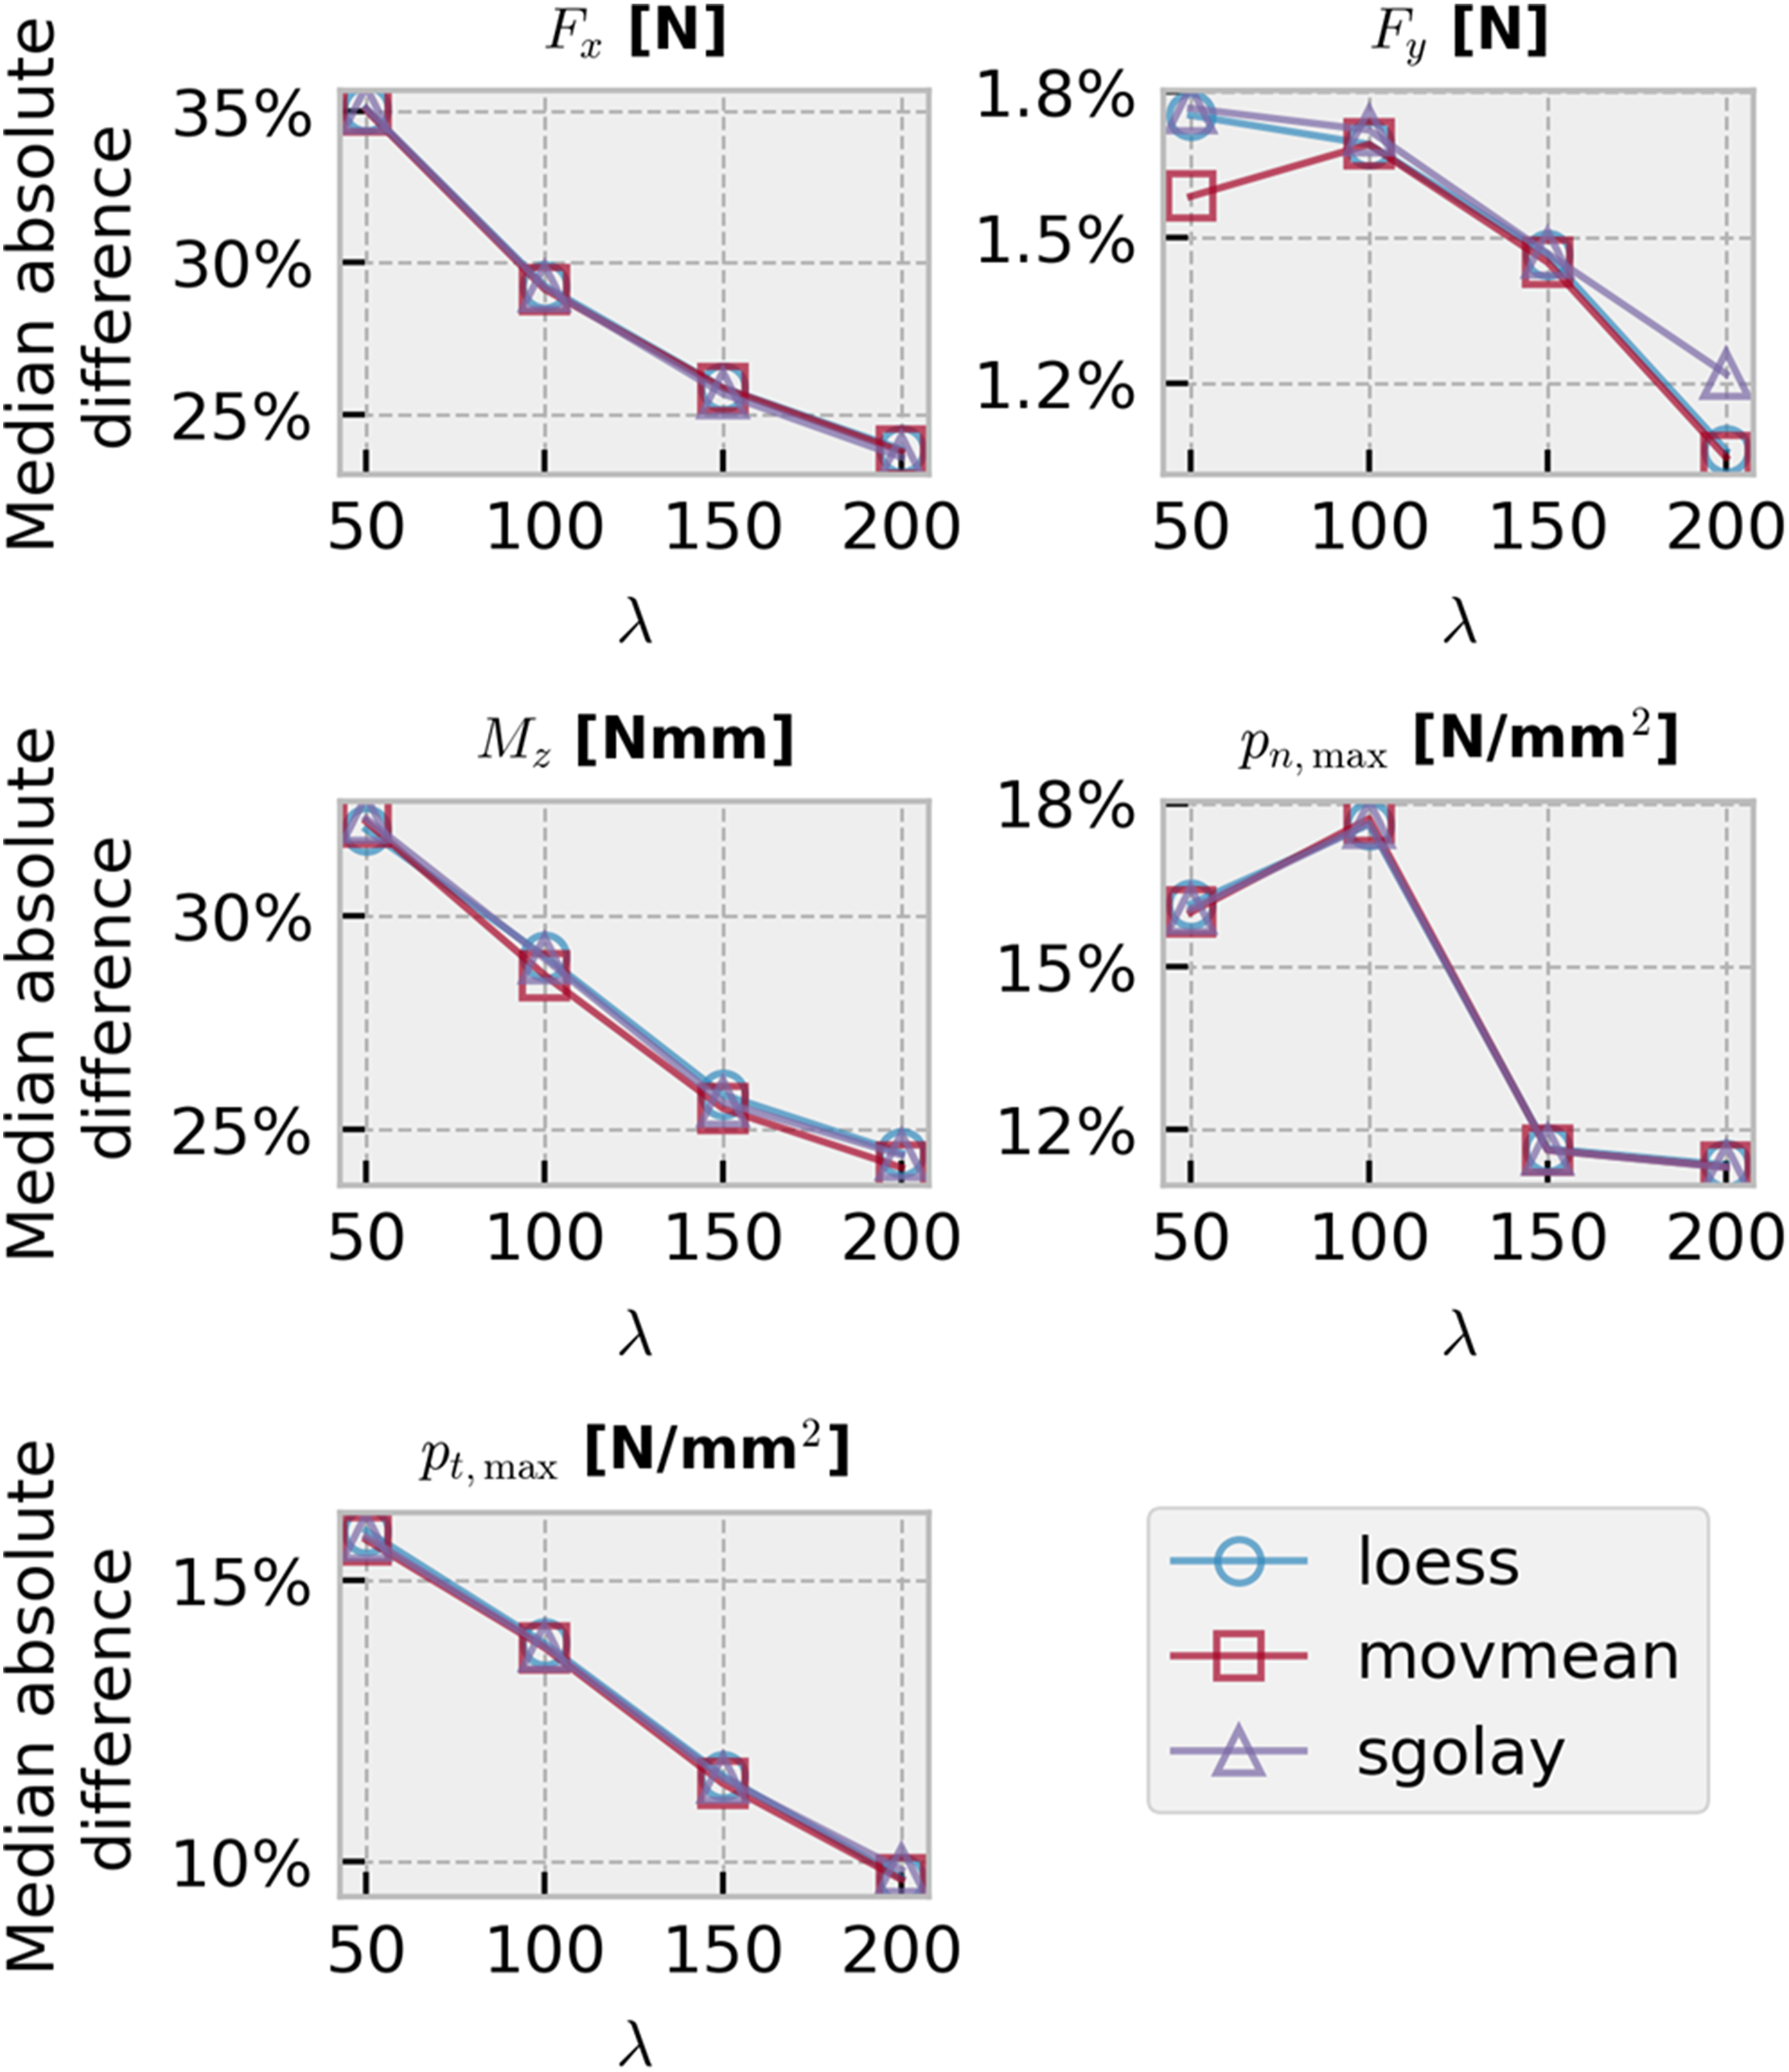
At first glance, without considering outliers, the results from CONTACT simulations appear to have general agreements between laser and MiniProf profiles, as shown by the clustering of points around the diagonals in Figure 4(a). However, the cumulative distributions in Figure 4(b) reveal a somewhat different story. The discrepancies in results for
Although the measurement wheel on MiniProf already applies inherent filtering of small-wavelength roughness, further smoothing is still required in CONTACT, and the appropriate value of
Considering these results, further studies of processing and smoothing are necessary to optimize the laser-measured profiles in CONTACT. A better understanding of the root cause of the differences is especially relevant when it comes to calculating quantities other than the total lateral force.
Having presented the results from CONTACT simulation comparisons in this section, the focus of this paper now shifts towards the results from the wheel-rail contact preprocessor in preparation for MBD simulations and MBD simulations themselves.
NUCARS Simulations
Contact preprocessor
Before MBD simulations can be performed, it is common that a contact preprocessor of the simulation package is required to transform the wheel and profile measurements into a format the simulation code can readily consume. For NUCARS, CFIT and WRCON are the preprocessors. Instead of using the coordinates as measured in the wheel and rail profiles, CFIT processes the profiles by arc fitting. After the profiles have been fitted, they can either be called on directly by the main simulator if the penetration model for wheel-rail contact (a newer method) is selected. Alternatively, they need to be processed further by WRCON to generate a lookup table populated with pre-calculated rigid contact parameters for the main simulator.
CFIT requires the fitted arcs to be tangent to each other. The arc fitting effectively smooths profile measurements. In cases where there are frequent spikes in the measurements, difficulties could be encountered where CFIT would only output an incomplete profile. On the other hand, the arc-fitting process does not require the profile measurement to be perfect and some outliers in the measurements may not affect the outcomes. The following comparisons using WRCON between MiniProf and laser-measured profiles are one test of this hypothesis.
The measured rail profiles are first processed by CFIT using the default settings. The wheel profile is a pre-fitted AAR-1B wheel profile included with the NUCARS installation. The contact parameters are generated using WRCON using mirrored rail profiles for each rail profile at 1435 mm gauge and the AAR-1B wheel profile. The rolling radius difference, Rolling radius difference calculated by WRCON for each measurement and smoothing method.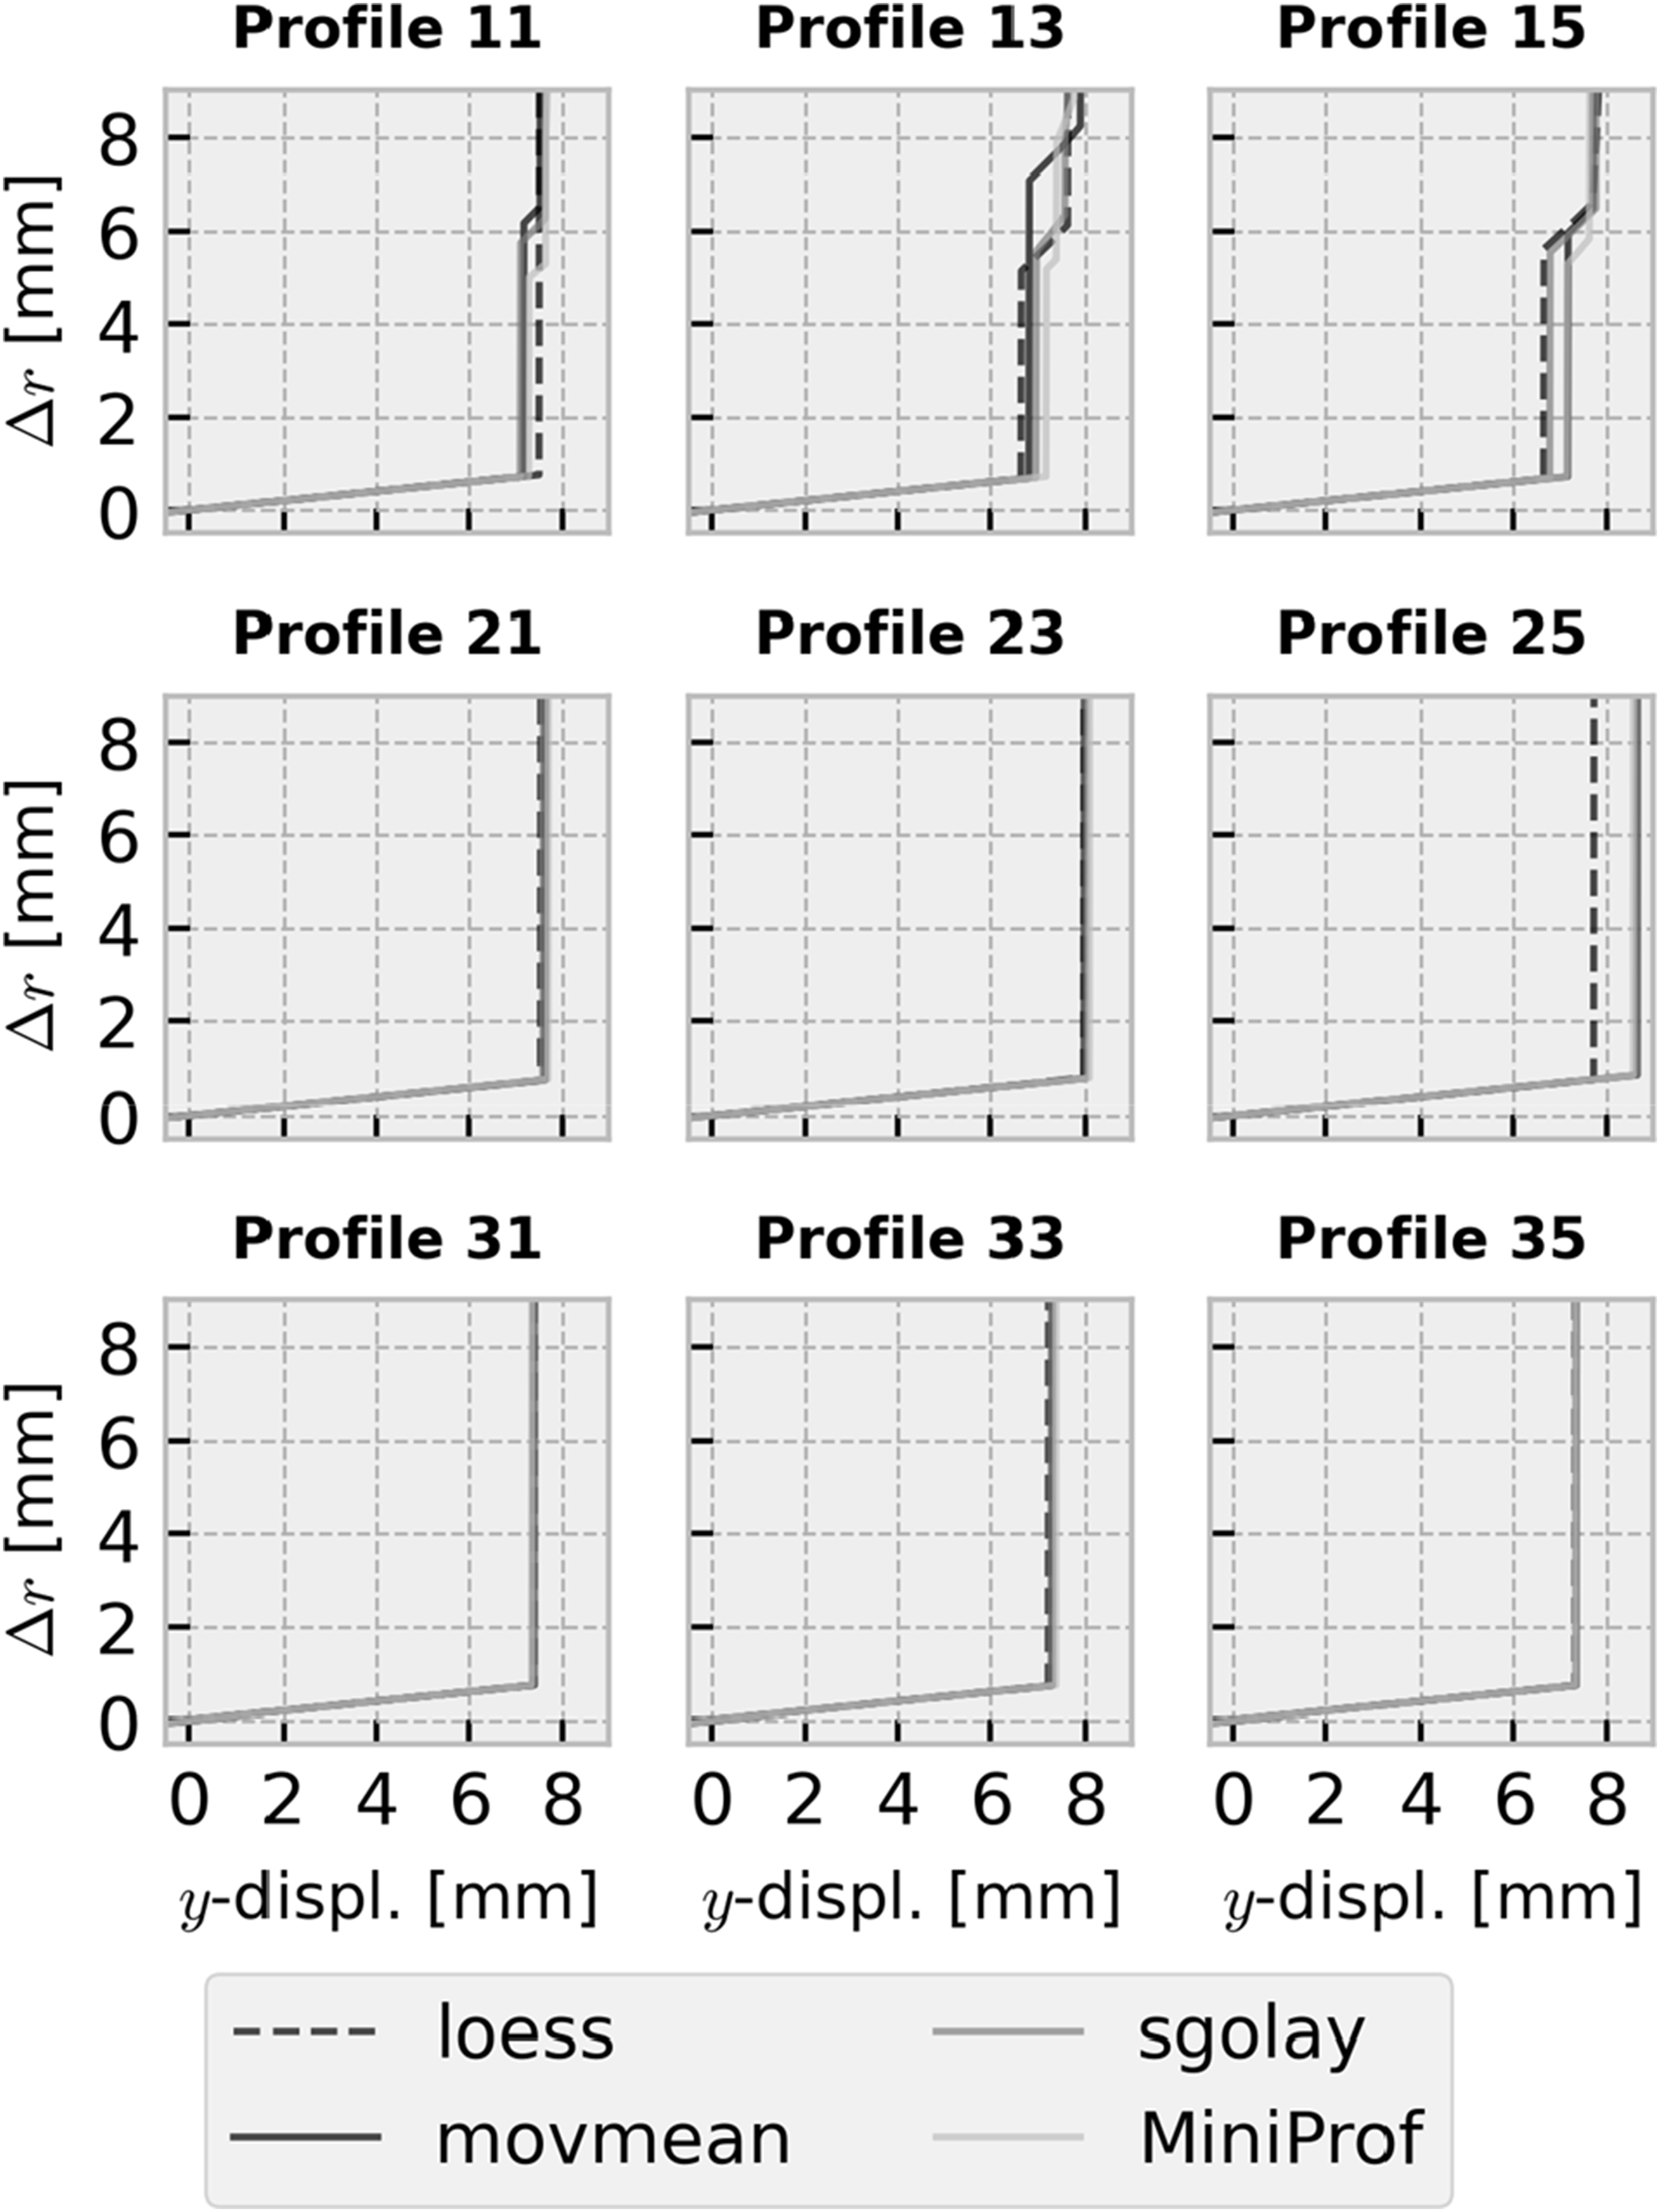
The WRCON results in Figure 6 show close matches for
MBD Simulations
Summary of NUCARS simulation inputs.
For the comparison of the profile measurements and their simulation results, the rigid contact method is used for the ease of comparisons between contact parameters, which are generated separately prior to the simulations.
The resulting simulation Y/Q time histories were first filtered using a 15 Hz lowpass filter, and the sustained maximum single wheel Y/Q and axle sum Y/Q ratios were calculated over a period of 50 ms, as specified by industry standards.
26
Figure 7(a) shows scatter plots of these maximum single wheel and axle sum Y/Q ratios using laser profile measurements vs. MiniProf measurements, while Figure 7(b) shows the distributions of laser/MiniProf result ratios, that is Comparisons of maximum Y/Q ratios between laser and MiniProf profiles. (a) Y/Q comparison scatters. A point on the diagonal means the maximum Y/Q obtained from simulations using laser and MiniProf profiles match exactly. (b) Distributions of ratios between Y/Q ratios from laser and MiniProf profiles under the same conditions. A value of one means the maximum Y/Q obtained from simulations using laser and MiniProf profiles match exactly. Values larger than one means laser profiles resulted in a higher maximum Y/Q ratio. Comparisons of NUCARS simulation results between laser and MiniProf profiles. (a) Cumulative distributions of Y/Q differences.(b) Median absolute differences vs. curvature (chord length = 30.48 m) grouped by smoothing method.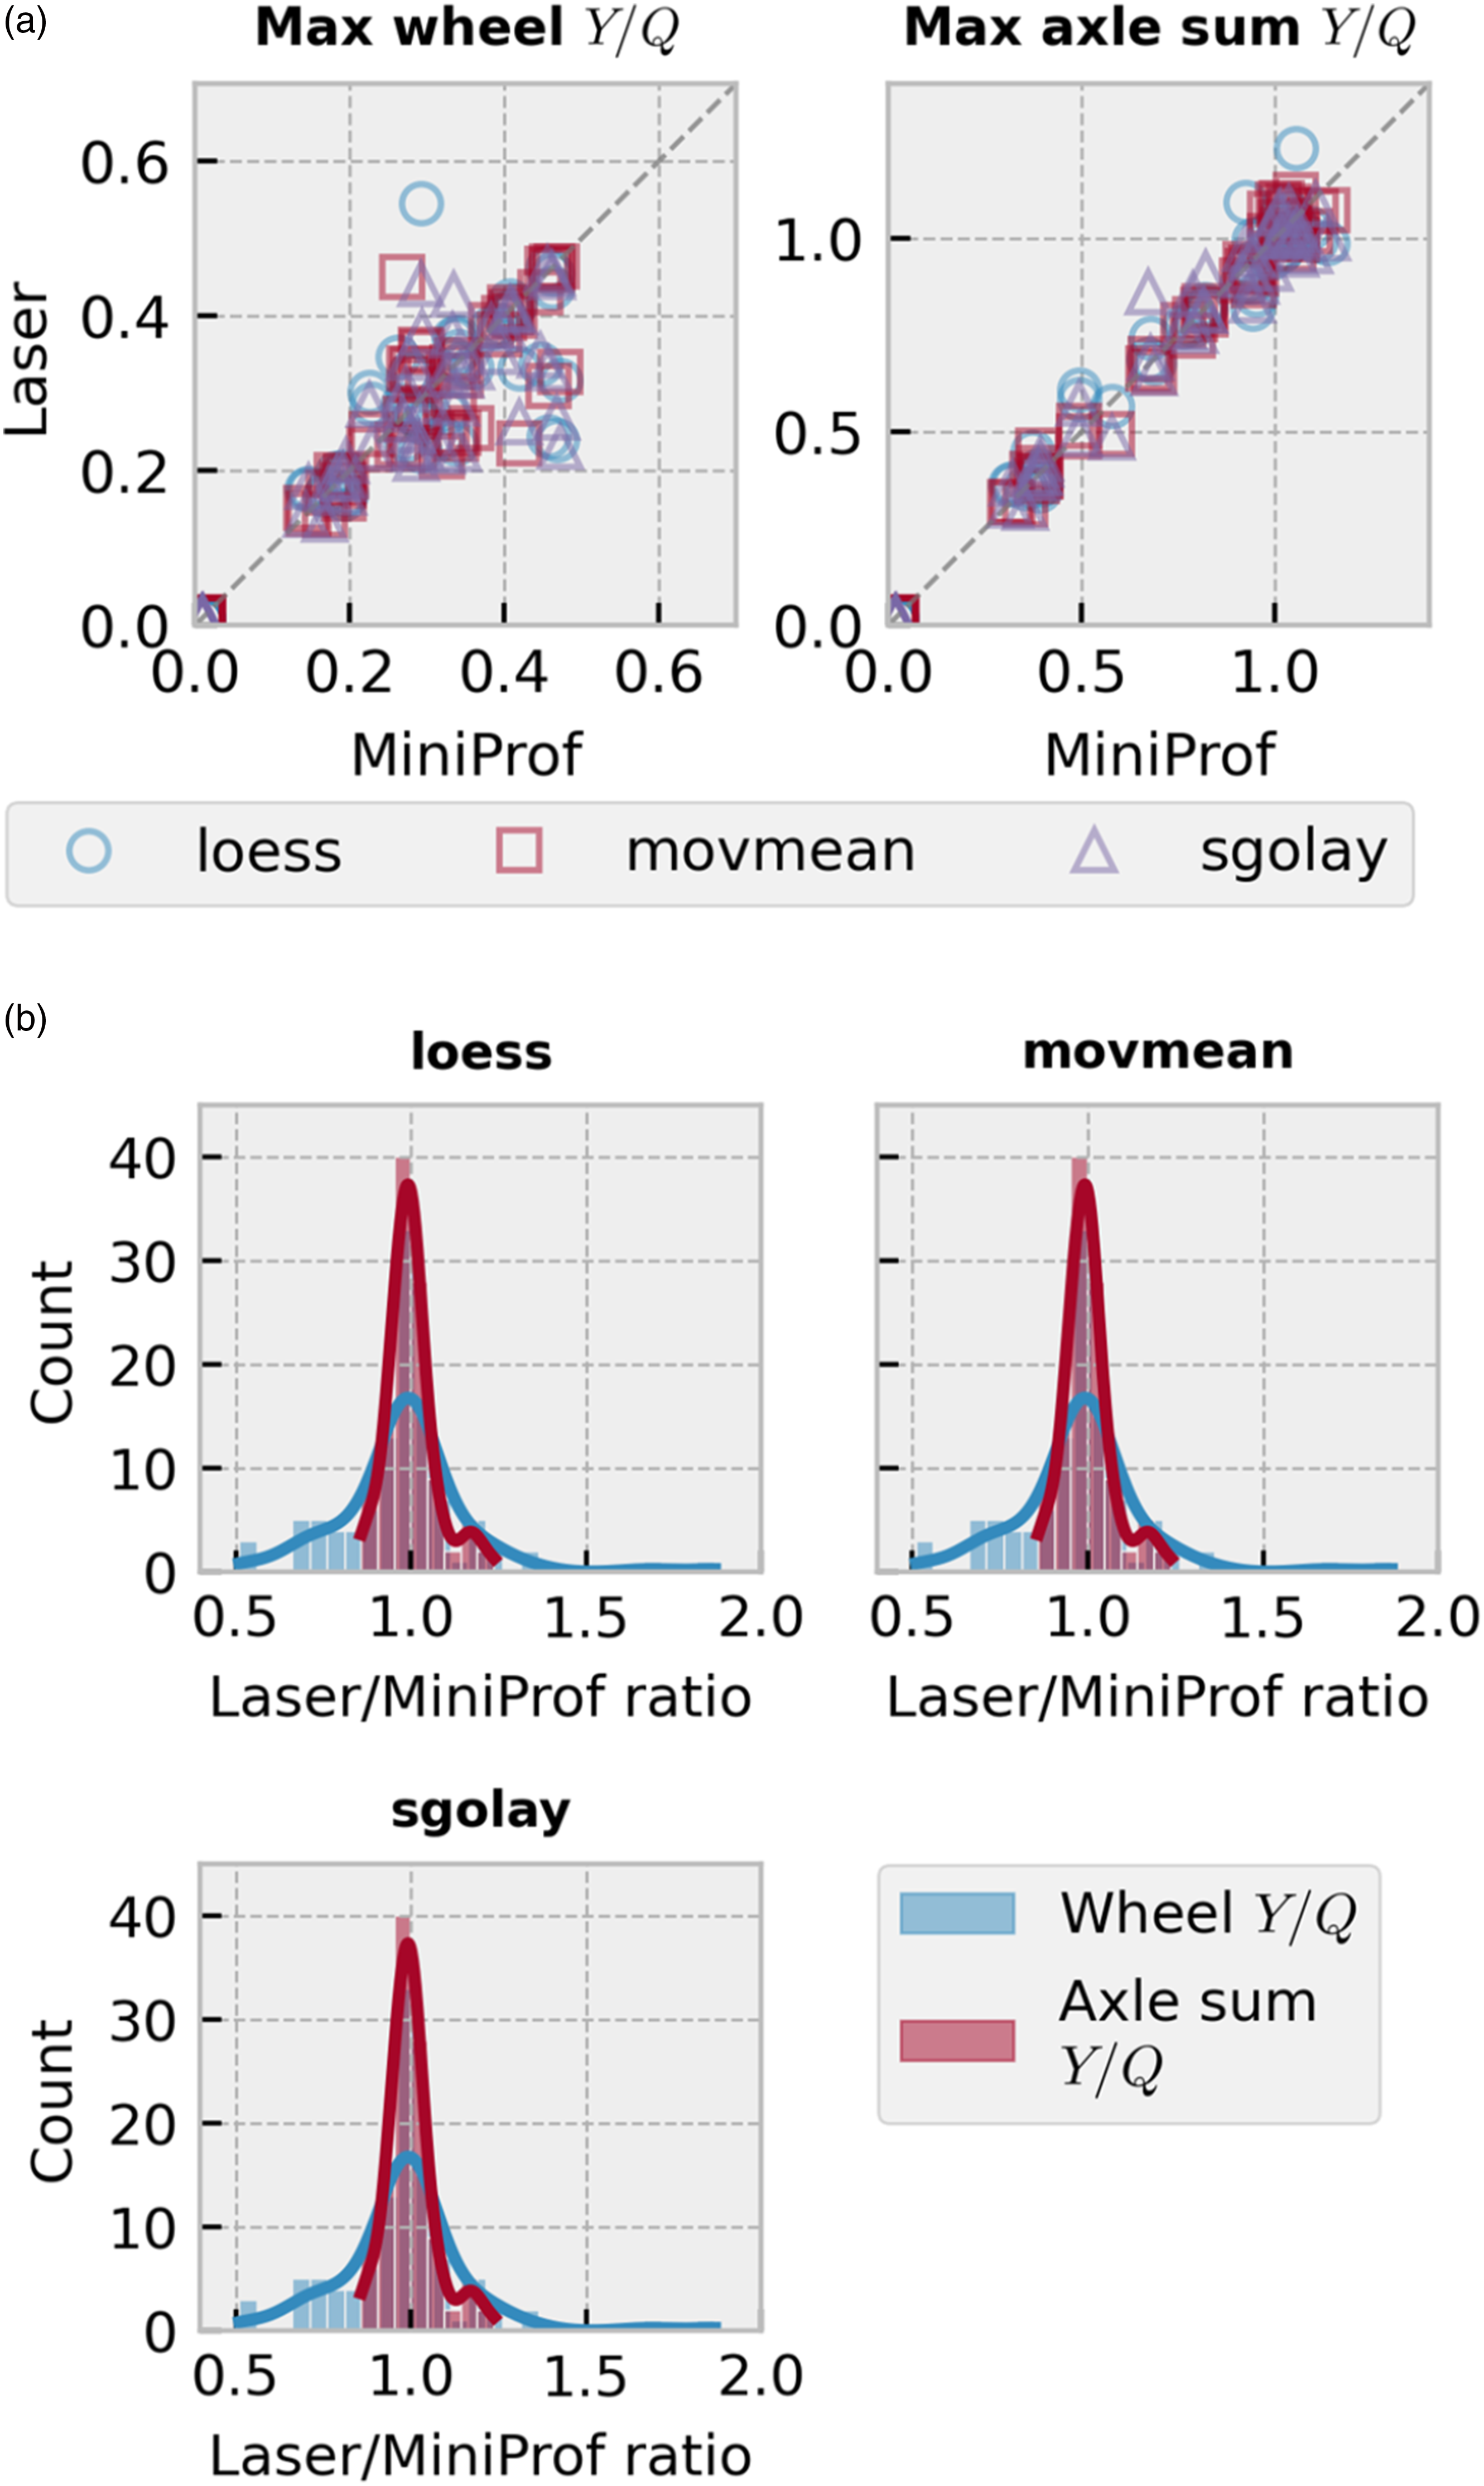
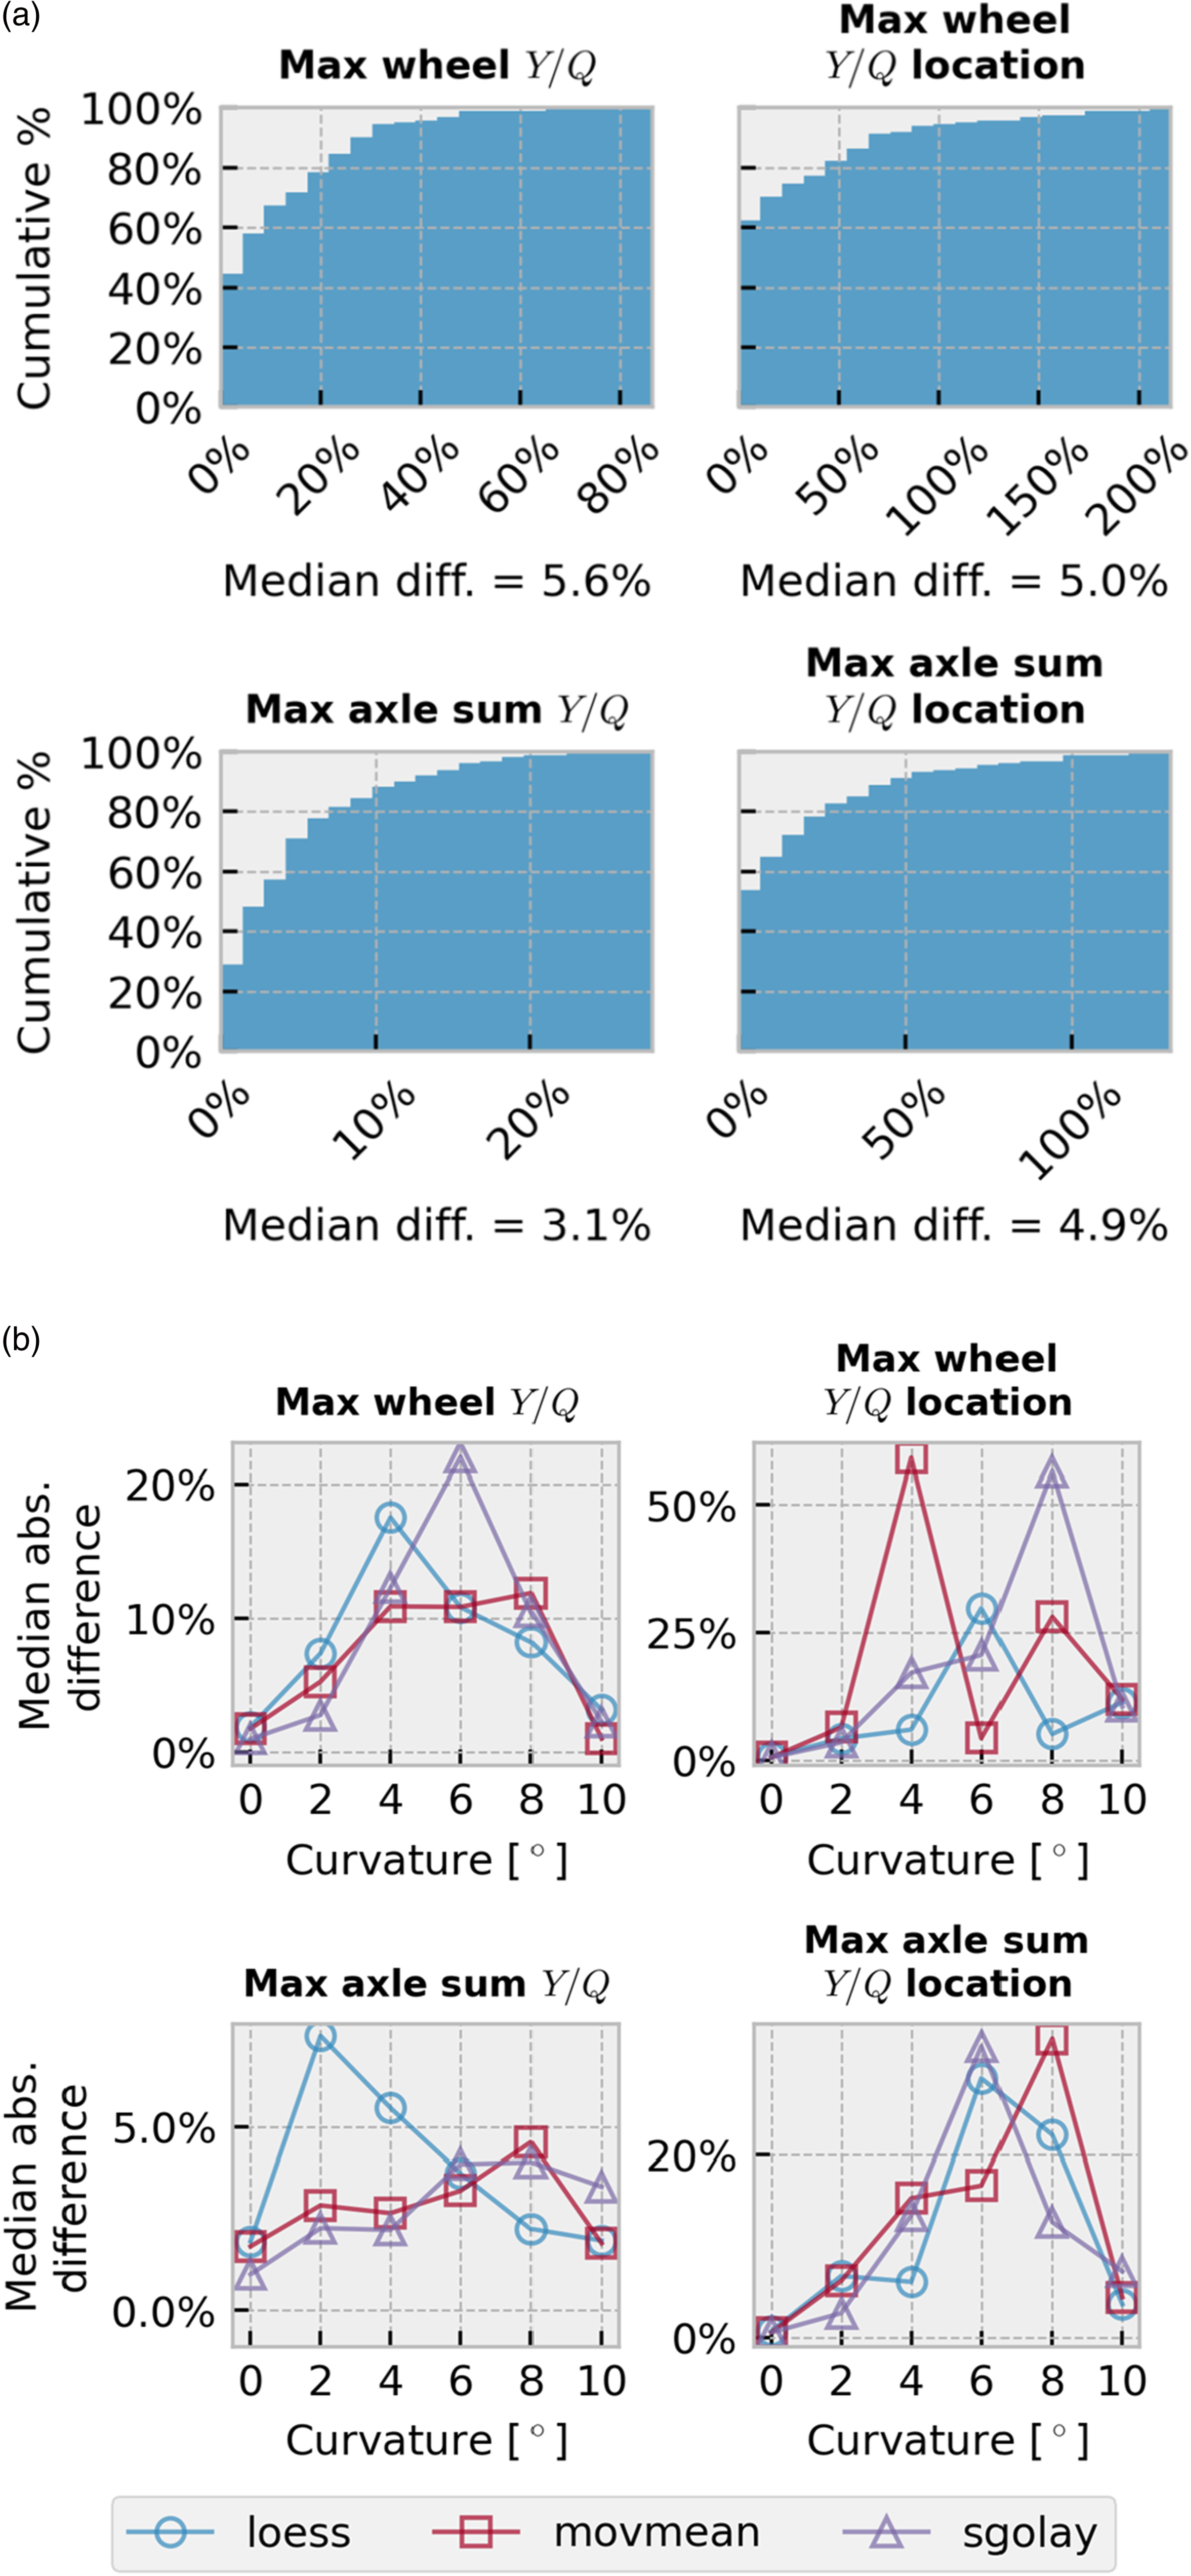
The differences between Y/Q results from Figure 8 are much smaller than the differences between CONTACT results discussed earlier. Across all three smoothing methods, the median differences in both Y/Q ratios and their occurrence locations between laser and MiniProf rail profiles are all around 5%. The larger differences are predominantly from the occurrence locations, which are caused by having two Y/Q peaks of similar magnitudes at the entry and exit spirals for some simulations. Since the NUCARS preprocessor applies further smoothing to profiles by arc fitting, theoretically, obtaining an identical set of circular arcs with slightly different measurements is possible, and this could be the reason for the results to match better than CONTACT. However, it is still to be determined whether this approach remains effective for a wider range of profiles.
In the application of maximum Y/Q ratios and derailment risks, as is shown by the comparisons, simulations using either laser or MiniProf profiles would successfully predict potential problems on the curve, even if the exact locations of the highest risk on the curve might disagree.
The distributions of Y/Q ratios in Figure 7(b) showed that while most maximum Y/Q ratios from MBD simulations using laser profiles are close to those using MiniProf profiles, there were still some that differed by a large margin and could significantly over or underestimate the derailment risk, especially for single wheel Y/Q. This is an interesting finding, since the distributions of the result ratios for axle sum Y/Q are much tighter, and if laser profiles only yield inaccurate simulation results, the absolute axle sum Y/Q would have larger differences between the two profile measurement techniques. Given the relatively small sample set for the work presented, studies using a larger number of profiles would help further validate these results.
Although some noticeably large differences exist in the results between the laser and MiniProf profiles, Figure 8(a) shows that more than 80% of the maximum wheel Y/Q differences are less than 20%, and more than 80% of the maximum axle sum Y/Q differences are less than 10%. In applications, such as assessing risks for train marshalling, the focus is primarily on conditions in which higher Y/Q is produced due to factors such as wheel-rail contact, coupler force input, vehicle length and weight differences, and high curvature. Figure 8(b) shows that although the Y/Q difference between the two sets of profiles becomes larger in curves than on a tangent track, they generally decrease as curvature increases. In these applications, errors in low Y/Q ratios are insignificant up to a large margin. As other variables that have significant influences on Y/Q ratios are being considered, such as high coupler forces or excessive vehicle length and weight differences, the relative contribution of profile measurements to the overall risk could be even smaller. 27
General remarks
The results obtained from the various comparisons using laser and MiniProf profile measurements were mixed, depending on which parameter of interest was being closely examined. Overall, the differences in results between the two sets of profile measurements were much smaller in MBD simulations than CONTACT simulations. The results represent high-level summaries of a much larger set of values calculated by both CONTACT and NUCARS, whose detailed interpretations are much more nuanced.
Some deviations in the results could also be caused by small deviations in the rail inclination since the laser scanner and single-head MiniProf did not have a common datum. The rails, as measured, were not inclined in the lab. and the MiniProf was placed perpendicular to the rail base, while the single laser scanner was tilted to cover more of the gauge face. Rotations of profiles were performed in the postprocessing of the measurements and potentially introduced errors beyond the differences in measured geometries from the two instruments. In practice, it is also possible for small errors to occur in the placement of both laser scanners and contact-based profilometers where the profile trace is not perpendicular to the rail or wheel.
The applied smoothing methods are standard MATLAB functions without intentional optimization efforts. It is the authors’ understanding that commercially available laser wheel and rail profile scanners apply smoothing algorithms before a final set of measurements is produced, but the details do not appear to be publicly available. Through the comparisons, the authors wish to show that a reasonably processed laser scan could produce comparable results to MiniProf profiles for certain applications. However, further validations may be required at a larger scale, although it may not be practical to obtain a large set of MiniProf profiles. Furthermore, this study focused on rail profile measurements and assumed a perfect wheel profile. When both the wheel and rail profiles are measured by a laser-based system, the difference in analysis results can further increase from those shown, and the applications of these measurements in derailment risk assessment using laser scans may need to be treated more conservatively than those from contact-based measurements.
Conclusions
While far from perfect, the ability of wayside and vehicle-mounted laser profilometers can enable analyses to be performed at a much larger scale. The comparisons have shown greater differences in results between laser and MiniProf profiles in CONTACT simulations than MBD simulations. From the MBD simulations, laser profiles have produced maximum Y/Q ratios close to those obtained using MiniProf in sharper curves, where Y/Q ratios are higher. The findings suggest that the laser-measured profiles can generate meaningful results at the summary level in applications such as derailment risk assessment. However, the sample size is limited in this study and more exhaustive verifications between the two measurement techniques should be considered to arrive at a truly high degree of confidence. The authors hope this work will lead to an open-minded approach to continue the evaluation of laser-based profiles in simulations.
Footnotes
Declaration of conflicting interests
The author(s) declared no potential conflicts of interest with respect to the research, authorship, and/or publication of this article.