We propose and apply novel corrugation and corrugation-related noise metrics designed to help maintainers monitor corrugation actively (on rail) or passively (by proxy through noise) at locations in a transit property. The novelty of our approach consists of incorporating wavelength-variable corrugation filtering, and wavelength- and velocity-dependent noise weighting into existing rail corrugation and wayside noise metrics primarily for municipal rail maintenance. The modified metrics isolate corrugation and corrugation-related noise in a manner tailored to a property’s operational characteristics, such as train velocity. The proposed modified metrics are applied to a data set collected from a pre- and post-grind monitoring regimen at 17 measurement sites in a North American property to investigate their responses. This study demonstrates the benefit of adapting the filtering methodology used to produce summary corrugation statistics to suit a specific property’s corrugation needs. It also demonstrates the need to include target corrugation wavelengths and approximate train velocity to appropriately weight the noise spectrum in a sample. These developments supplement the available methods that property maintainers can adopt to monitor corrugation conditions at discrete locations throughout a system by providing tools/metrics that are specifically designed to correctly assess the appropriate wavelength of corrugation on the rail face, thereby allowing maintainers to then accurately monitor corrugation via noise by means of passive wayside measurements.
Corrugation is a self-propagating rail damage phenomenon characterized by variable crests and troughs on the rail surface.1 Rail corrugation poses safety risks and contributes to increased noise and vibration emissions, and overall reduced ride quality.
Rail grinding is a widely adopted method for corrugation removal, but recent studies have identified the need to formulate grinding programs, methodologies, thresholds, and rail profile optimizations that account for varying rail corrugation, track, and operational characteristics.2,3 This is especially true for passenger and high-speed rail systems as their velocities and dynamic loads present unique challenges.4 For example, Xu et al.5 proposed a dynamic diagnosis method and quantitative characterization of rail corrugation using time-frequency information obtained from axle box acceleration (ABA) sensors affixed to the train. The study employed a quadratic integral of filtered ABA data to estimate the amplitude of corrugation and proposed an index to quantify rail corrugation at high speed. As research and practice develop better ways to quantify rail corrugation and a more robust characterization of the relationship between corrugation and noise, there is a concomitant need to demonstrate the impacts of train velocity and noise data filtering techniques on that relationship and the methods for assessing grind effectiveness. This study intends to address this need.
Rail maintenance with respect to corrugation requires inspection using specialized tools such as a Corrugation Analysis Trolley (CAT) and requires time for maintenance workers to measure the rail surface with no trains running. This inspection technique depends on the length of track maintenance workers can measure, and consequently can be very limited relative to the size of a property. Passive monitoring of rail conditions using noise could eventually eliminate the need for time- and labour-intensive CAT sampling, once a baseline behaviour of a particular section of track is established.
Relating rail condition to pass-by noise is not a new industry goal and was the focus of much research in the 1990s and 2000s to varying success. Remington6 presented the idea of a contact patch to attenuate wavelengths of roughness shorter than the wheel-rail interface as a function of vehicle velocity. This was extended by Thompson with the TWINS model for predicting rolling noise,7 and again when Thompson presented AV-weighting, which incorporated this into a way to weight frequencies of noise emitted by a vehicle passing over roughness at a given speed.8 Van Lier9 presented λ-weighting and its derivatives with a similar goal, again integrating the concept of a contact patch filter. These works and others like them appeared to focus on finding a generalizable relationship between rail roughness and audible noise that could be applied to intercity rail properties. Despite the potential value of such a relationship and the effort to unify rail roughness with pass-by noise, Thompson has stated that “single number values for roughness have not been widely adopted”, citing difficulties encountered by attempts to develop a robust, universal metric.10
Motivated by rail corrugation problems experienced by many urban rail transit systems—rather than the development of a universal metric as in prior efforts, our previous work Lasisi et al.11 investigated the relationship between rail corrugation and wayside noise with the aim of better informing rail maintenance (i.e., grinding) decisions. Given the service interruptions necessitated by periodic measurement of rail corrugation, the study also sought to use noise as a proxy for corrugation measurement, while condensing the information into a single number summary to guide maintenance decisions. This is distinct from prior work (e.g., the TWINS model), which effectively focused on expressing noise spectra as a function of roughness which may require property maintainers to have more expertise to use appropriately. In the aforementioned Lasisi et al.11 a North American urban rail transit property provided corrugation and wayside noise measurements sampled monthly over a period of 2 years, which helped to model a relationship of growth between the two datasets. The study culminated in the development and validation of a rail corrugation index, , an indicator meant to summarize a corrugation sample using a representative datum, where the x subscript refers to a percentile chosen to be representative of the spatial variation of corrugation along a rail segment. The study demonstrated that rail quality and subsequent grind effectiveness could be quantified in terms of . To compare corrugation to noise, they used A-weighted equivalent noise level , an audible frequency weighting meant to mimic human hearing sensitivities.
Where Lasisi et al.11 attempted to view and model the growth relationship between corrugation and noise, this paper investigates the pre- and post-grind noise and corrugation indices from a different North American rail property to gain insight into the property-specific characteristics of these metrics. As such, the aims of this paper are twofold. First, it investigates how responds when applied to a new property, and determines if it demonstrates the same response to grinding as previously observed. Second, it seeks to verify the usage of , investigates its response to grinding, and observes the correlation between the responses to grinding of the two indicators.
This paper extends the prior work by adjusting those metrics to suit a broader range of operational characteristics, while still maintaining their single number summary outputs for motivating maintenance decisions. Ultimately, we propose , an alternative to that uses corrugation wavelengths as a parameter for the filter for properties where the 30–100 mm bandwidth does not accurately capture the corrugation. We also suggest a velocity-dependent and corrugation-dependent noise weighting scheme, , as an alternative to to ensure the wayside noise measurement is isolating only the noise that is a result of corrugation.
A brief review of RCIx and LAeq
The work presented in our previous study demonstrated that and provided a successful framework for monitoring corrugation and noise growth at a North American rail property. With the intent of applying this framework to a second North American property in this work, we summarize the metrics in what follows.
RCIx
RCIx, as defined in Lasisi et al.,11 is a positionally-dependent indicator of the severity of rail corrugation along an interval of track. For a given measurement of raw corrugation, defined as a sequence of vertical displacements relative to the initial measurement sampled at 1 or 2 mm intervals as specified by the operator using a CAT on a single rail, the following steps are required to calculate :
1. Filter the corrugation for the 30–100 mm wavelength, otherwise known as short pitch corrugation. The CAT’s proprietary corrugation analysis software’s standard filter for 30–100 mm wavelength is a bandpass Butterworth filter of order N = 3.
2. Segment the filtered corrugation sample into 5 m blocks.
3. For each block, calculate the root mean square (RMS) vertical displacement.
4. Select the block corresponding to the th percentile of the sequence of block RMS values, rounding up if the block index of the desired percentile is not an integer value. This can be done manually by sorting the -length sequence of block RMS values in ascending order and selecting the value of the block at sorted index , where is the ceiling function.
Our work demonstrated that showed growth across the duration of a grind interval, as well as a clear drop in response to grinding. Both effects were evident in tangents and curves. The percentiles of interest in the previous work were the 65th, 85th, and 95th percentiles, all of which showed growth over time and a clear grinding response. This demonstrated value due to its ability to quantify corrugation severity across a segment of sufficient length to justify corrective grinding.11
Wayside LAeq
The previous study Lasisi et al.11 was undertaken at a site with a long-term sampling regimen to demonstrate the correlation and growth over time between corrugation and wayside noise measurement as a function of rail wear. Rail wear was quantified by cumulative load experienced by the rail in terms of million gross tonnes (MGT). Correlation between wayside noise magnitude and corrugation was successfully established.
Sound magnitude, as interpreted by humans, is a weighted sum of the various noise frequencies heard according to the sensitivity profile of the listener’s ear. Human ears are most sensitive to frequencies between roughly 2 kHz and 5 kHz.12 A-weighting is a sound weighting filter developed to mimic human hearing sensitivities, which appropriately amplifies and dampens different frequencies in a noise sample. Noise that has been A-weighted can be distinguished with the unit notation dBA.
The sound captured by a wayside noise measurement is not constant; it varies as the train passes by the measurement site. Equivalent Continuous Sound Level or Time-average Sound Level () is a one-number summary for a fluctuating noise sample. It is mathematically defined as the RMS of the measured sound pressure, averaged over the duration of a sample. Thus, represents an equivalent constant sound pressure noise level that has the same total sound energy as the time-varying signal. Raw noise is defined to be Z-weighted (zero-weighted), so the notation is defined as Z-weighted Equivalent Continuous Sound Level. If the noise is filtered according to A-weighting before the Equivalent Continuous Sound Level is calculated, the resulting value is defined as , or A-weighted Equivalent Continuous Sound Level.
Wavelength-adapted RCIx (RCIx(λ))
In this section we develop an adaptation of , namely , with the intention of making the metric more flexible and transferable.
Dataset
The dataset used in the current study sampled only pre- and post-grind corrugation at 17 different locations (all curves) throughout a property different from that considered in Lasisi et al.11 Corrugation was sampled on both the left and right rails at each location, providing a total of 34 unique pre- and post-grind corrugation inspections (left and right rail at each of the 17 locations). Compared with the previous Lasisi et al.11 study where corrugation data was sampled monthly at two constant points in the system (one tangent, and one curve), this new dataset limits this study’s scope in terms of time and track geometry, but there is still the potential to verify the response to grinding in the metric.
Application of RCIx
RCIx was calculated on the pre- and post-grind data to understand the response to grinding. We define as . Our definition implies that indicates improvement in rail condition. That is, the post-grind is lower than the pre-grind , which is the expected case when grinding. Of the 34 location/rail pairings, 24 of the measurements (70.58%) decreased with grinding as was expected. Similarly, 24 of the measurements (70.58%), and 22 of the measurements (64.71%) responded correctly. The remaining samples for the different measurements suggested that corrugation worsened post-grind, which is contrary to reported field observations.
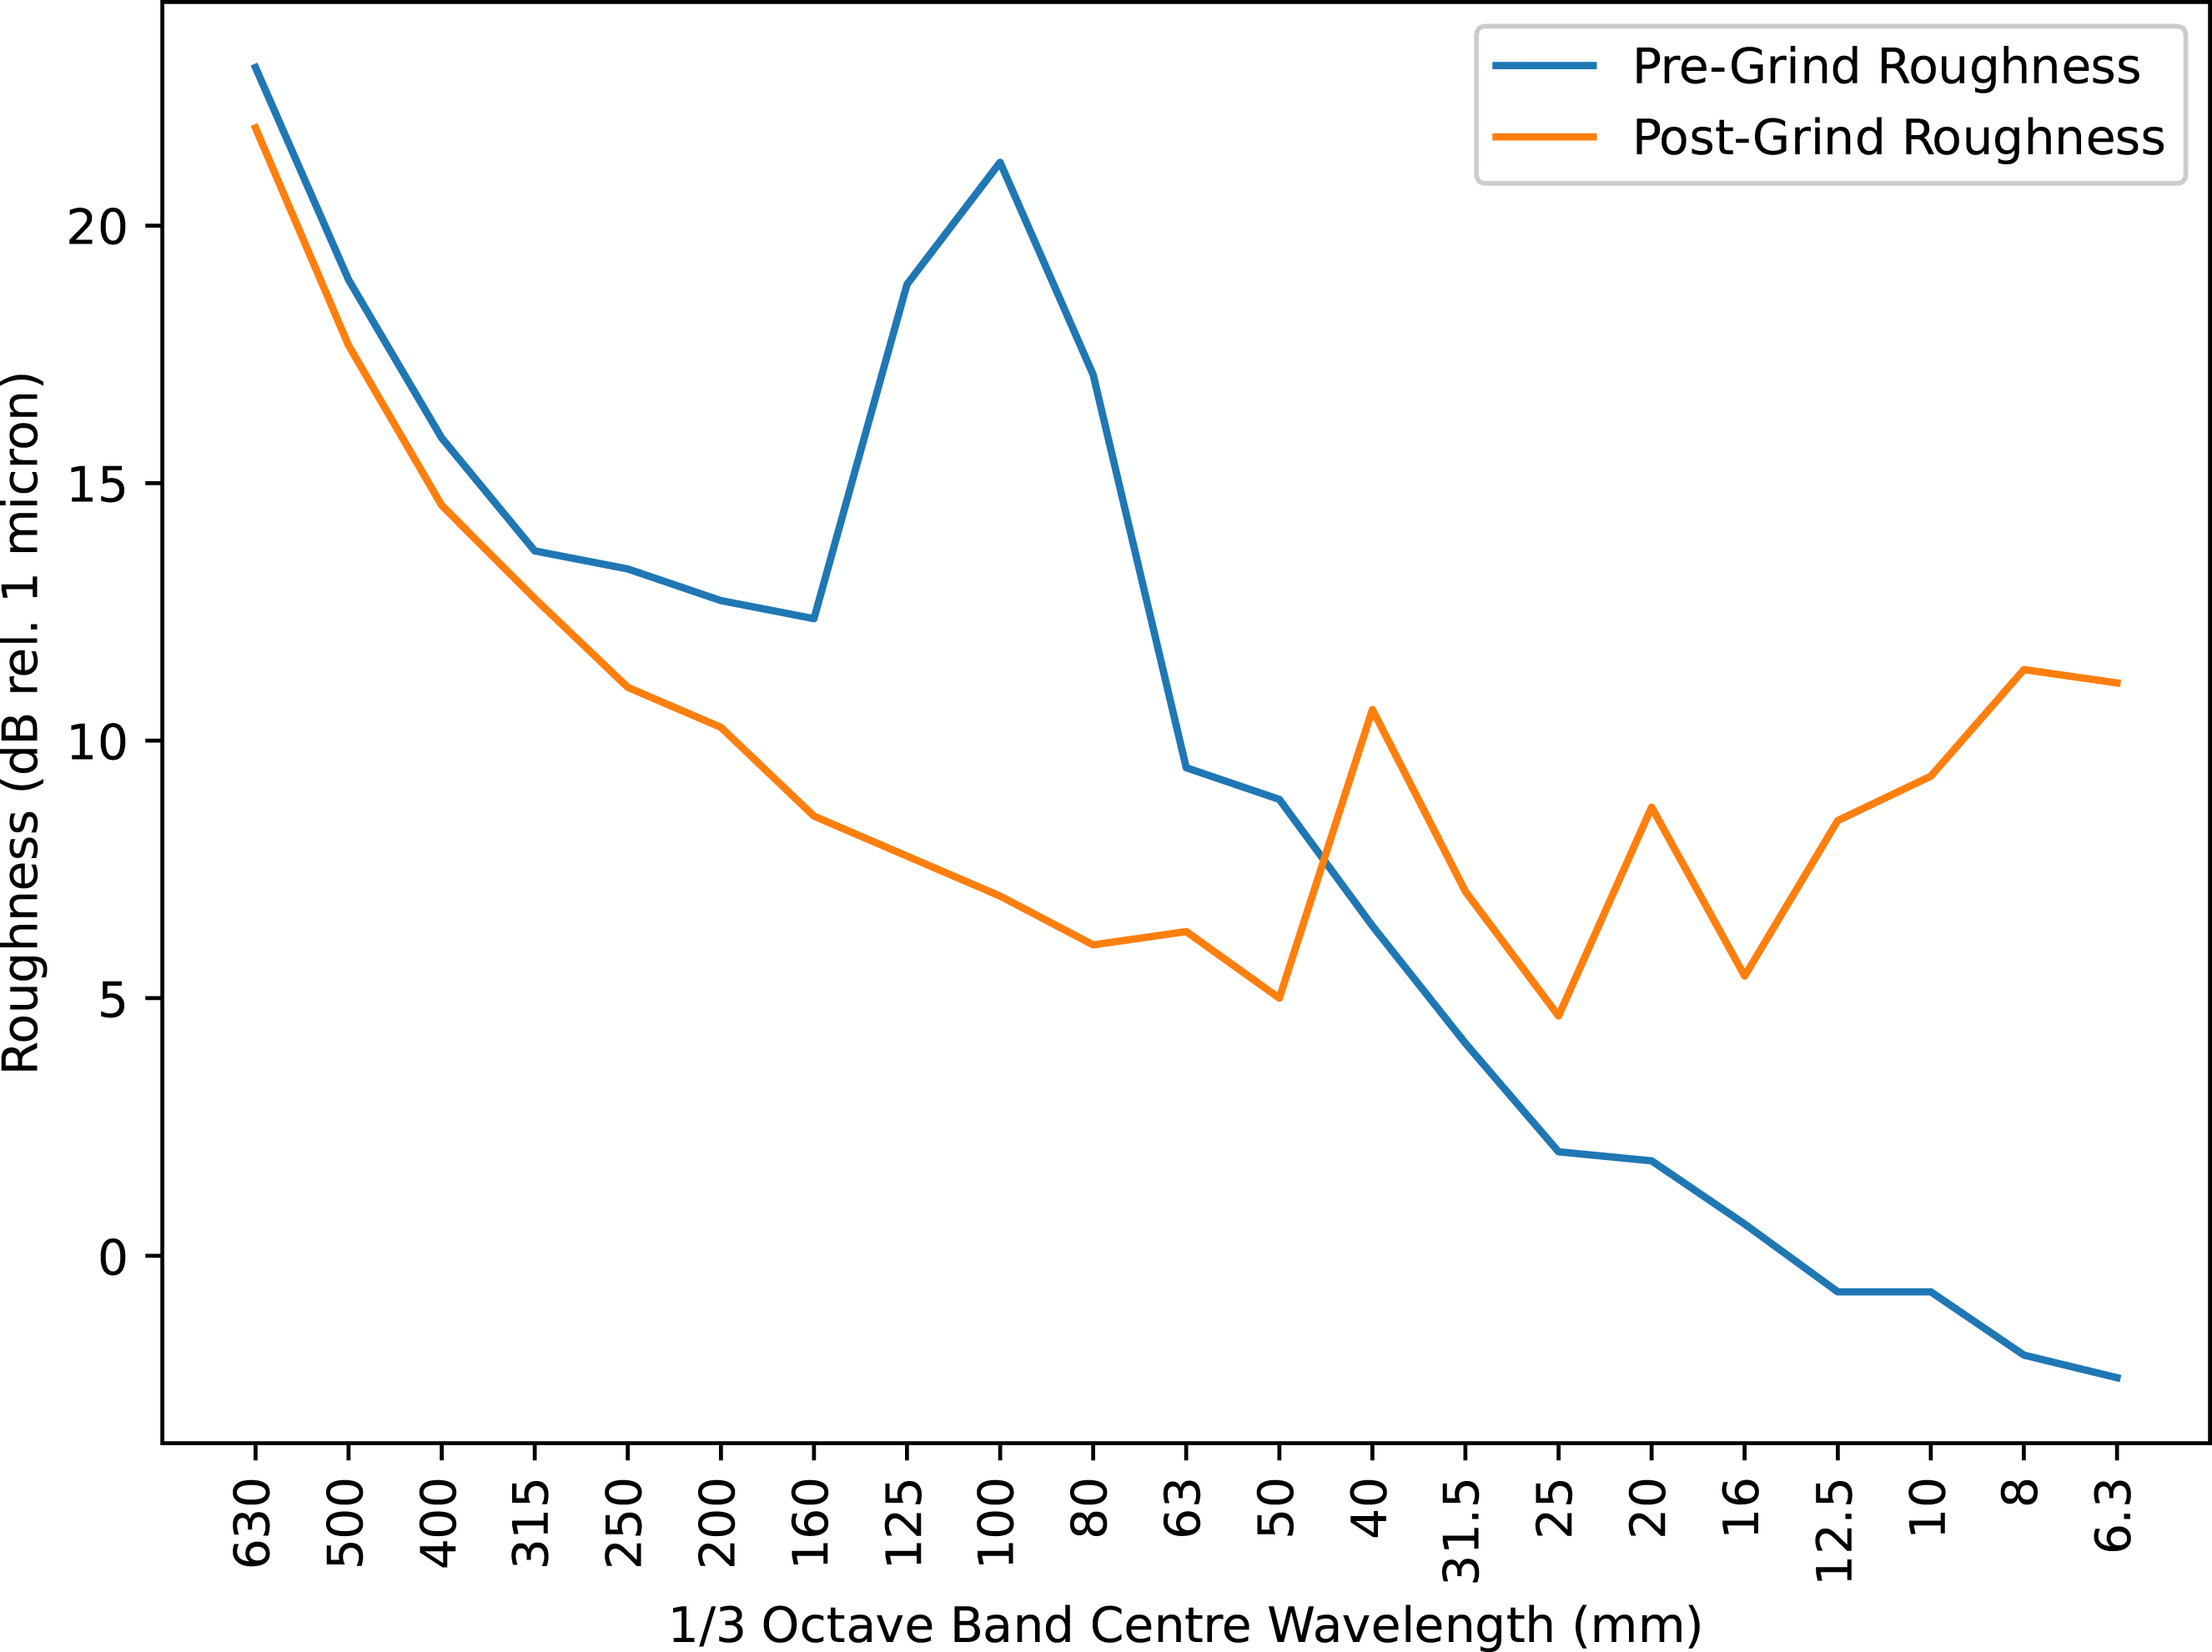
By inspection of the one-third octave information of the data, an example of which is found in Figure 1, there were two common characteristics across pre- and post-grind data. First, the pre-grind presence was centred at 100 mm wavelength or greater, suggesting that the 30–100 mm filtering was not encapsulating all the corrugation in the pre-grind summary. Second, while the post-grind data showed a reduction in the wavelengths above 100 mm, it also shows a new peak in the 31.5 mm frequency band believed to be associated with the grind signature of the maintenance done at this property, a short-lived roughness left on the rail from the grinder or mill smoothing the rail present immediately after grinding. This suggests that while the original formulation was designed to capture short-pitch corrugation, there may be a benefit to tailoring the wavelength range included in the quantification to account for property-specific realities. As a result, in what follows we adjust the filtering parameters to properly isolate a property’s characteristic corrugation, while excluding the remnants of any maintenance work which may affect the assessment of grind quality.
One-third octave plots showing the pre-grind and post-grind roughness. The corrugation peak centred at approximately 100 mm was removed through grinding, suggesting that corrugation at this property is not firmly in the 30–100 mm range.
Wavelength filtering
To determine the effects of varying the filter wavelengths of , we tested 4 different wavelength ranges to assess the performance of the index at this property. These are the standard 30–100 mm wavelength range used by the CAT software and Lasisi et al.,11 a 50–100 mm range which is meant to cut off any grind signature artifacts in the post-grind data found around 31.5 mm, a 50–200 mm range to include any corrugation in the pre-grind that may be slightly longer pitch than expected, and 100–300 mm which constitutes long-pitch corrugation to assess the performance if this property was attempting to remedy such corrugation. All filtering was achieved using a third order Butterworth filter, which is commensurate with the filtering done by the CAT analysis tool.
Results
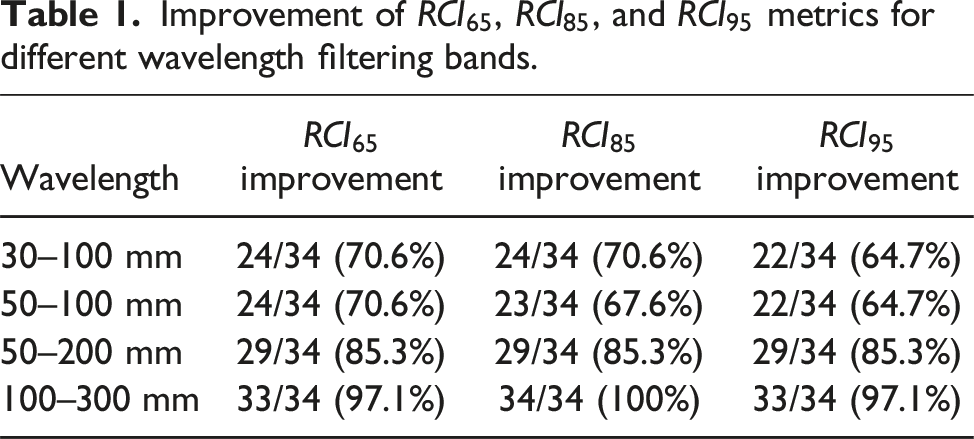
A preliminary investigation was undertaken to see which of these wavelength bins demonstrated better response to grinding. Table 1 shows the results. The table shows that increasing the lower wavelength cutoff from 30 to 50 mm makes no remarkable improvement to the change in from pre- to post-grind, consistent with the results in Figure 1. This suggests that perhaps the leftover grind signature does not have a major impact on the grind performance as measured by . However, the increase of the upper wavelength cutoff from 100 to 200 mm shows improvement, suggesting that the true problem with applying at this property is that the selected wavelength range is not properly capturing the corrugation present. Similarly, a further extension to the 100–300 mm range which constitutes long-pitch corrugation, demonstrates the largest sensitivity to grinding. This is consistent with the 1/3rd octave plots like in Figure 1, where the main pre-grind peaks exist between 80 and 400 mm, which suggests that ’s block RMS methodology is wavelength-dependent in its assessment of corrugation.
Improvement of , , and metrics for different wavelength filtering bands.
Wavelength
improvement
improvement
improvement
30–100 mm
24/34 (70.6%)
24/34 (70.6%)
22/34 (64.7%)
50–100 mm
24/34 (70.6%)
23/34 (67.6%)
22/34 (64.7%)
50–200 mm
29/34 (85.3%)
29/34 (85.3%)
29/34 (85.3%)
100–300 mm
33/34 (97.1%)
34/34 (100%)
33/34 (97.1%)
Quantifying rail corrugation improvement using RCIx(λ)
To contextualize the improvements captured by relative to the amount of corrugation present on the rail, we define . has a theoretical minimum of 0 microns indicating a perfectly smooth rail without corrugation and has an infinite theoretical maximum as rail can be infinitely rough. Correspondingly, has a theoretical maximum of when microns. However, has a theoretical minimum of -∞ as the post-grind measurement can be theoretically infinitely rougher than the pre-grind. Because of this, has a theoretical maximum of 100% and a theoretical minimum of -∞%.
To differentiate between the previous work done with , we introduce the notation , where denotes the wavelength filtering range. Explicitly, is equivalent to the original calculation in Lasisi et al.11 This notation extends to and . Initial investigations into these indicators when applied to the filter bands reinforce the findings in Table 1.
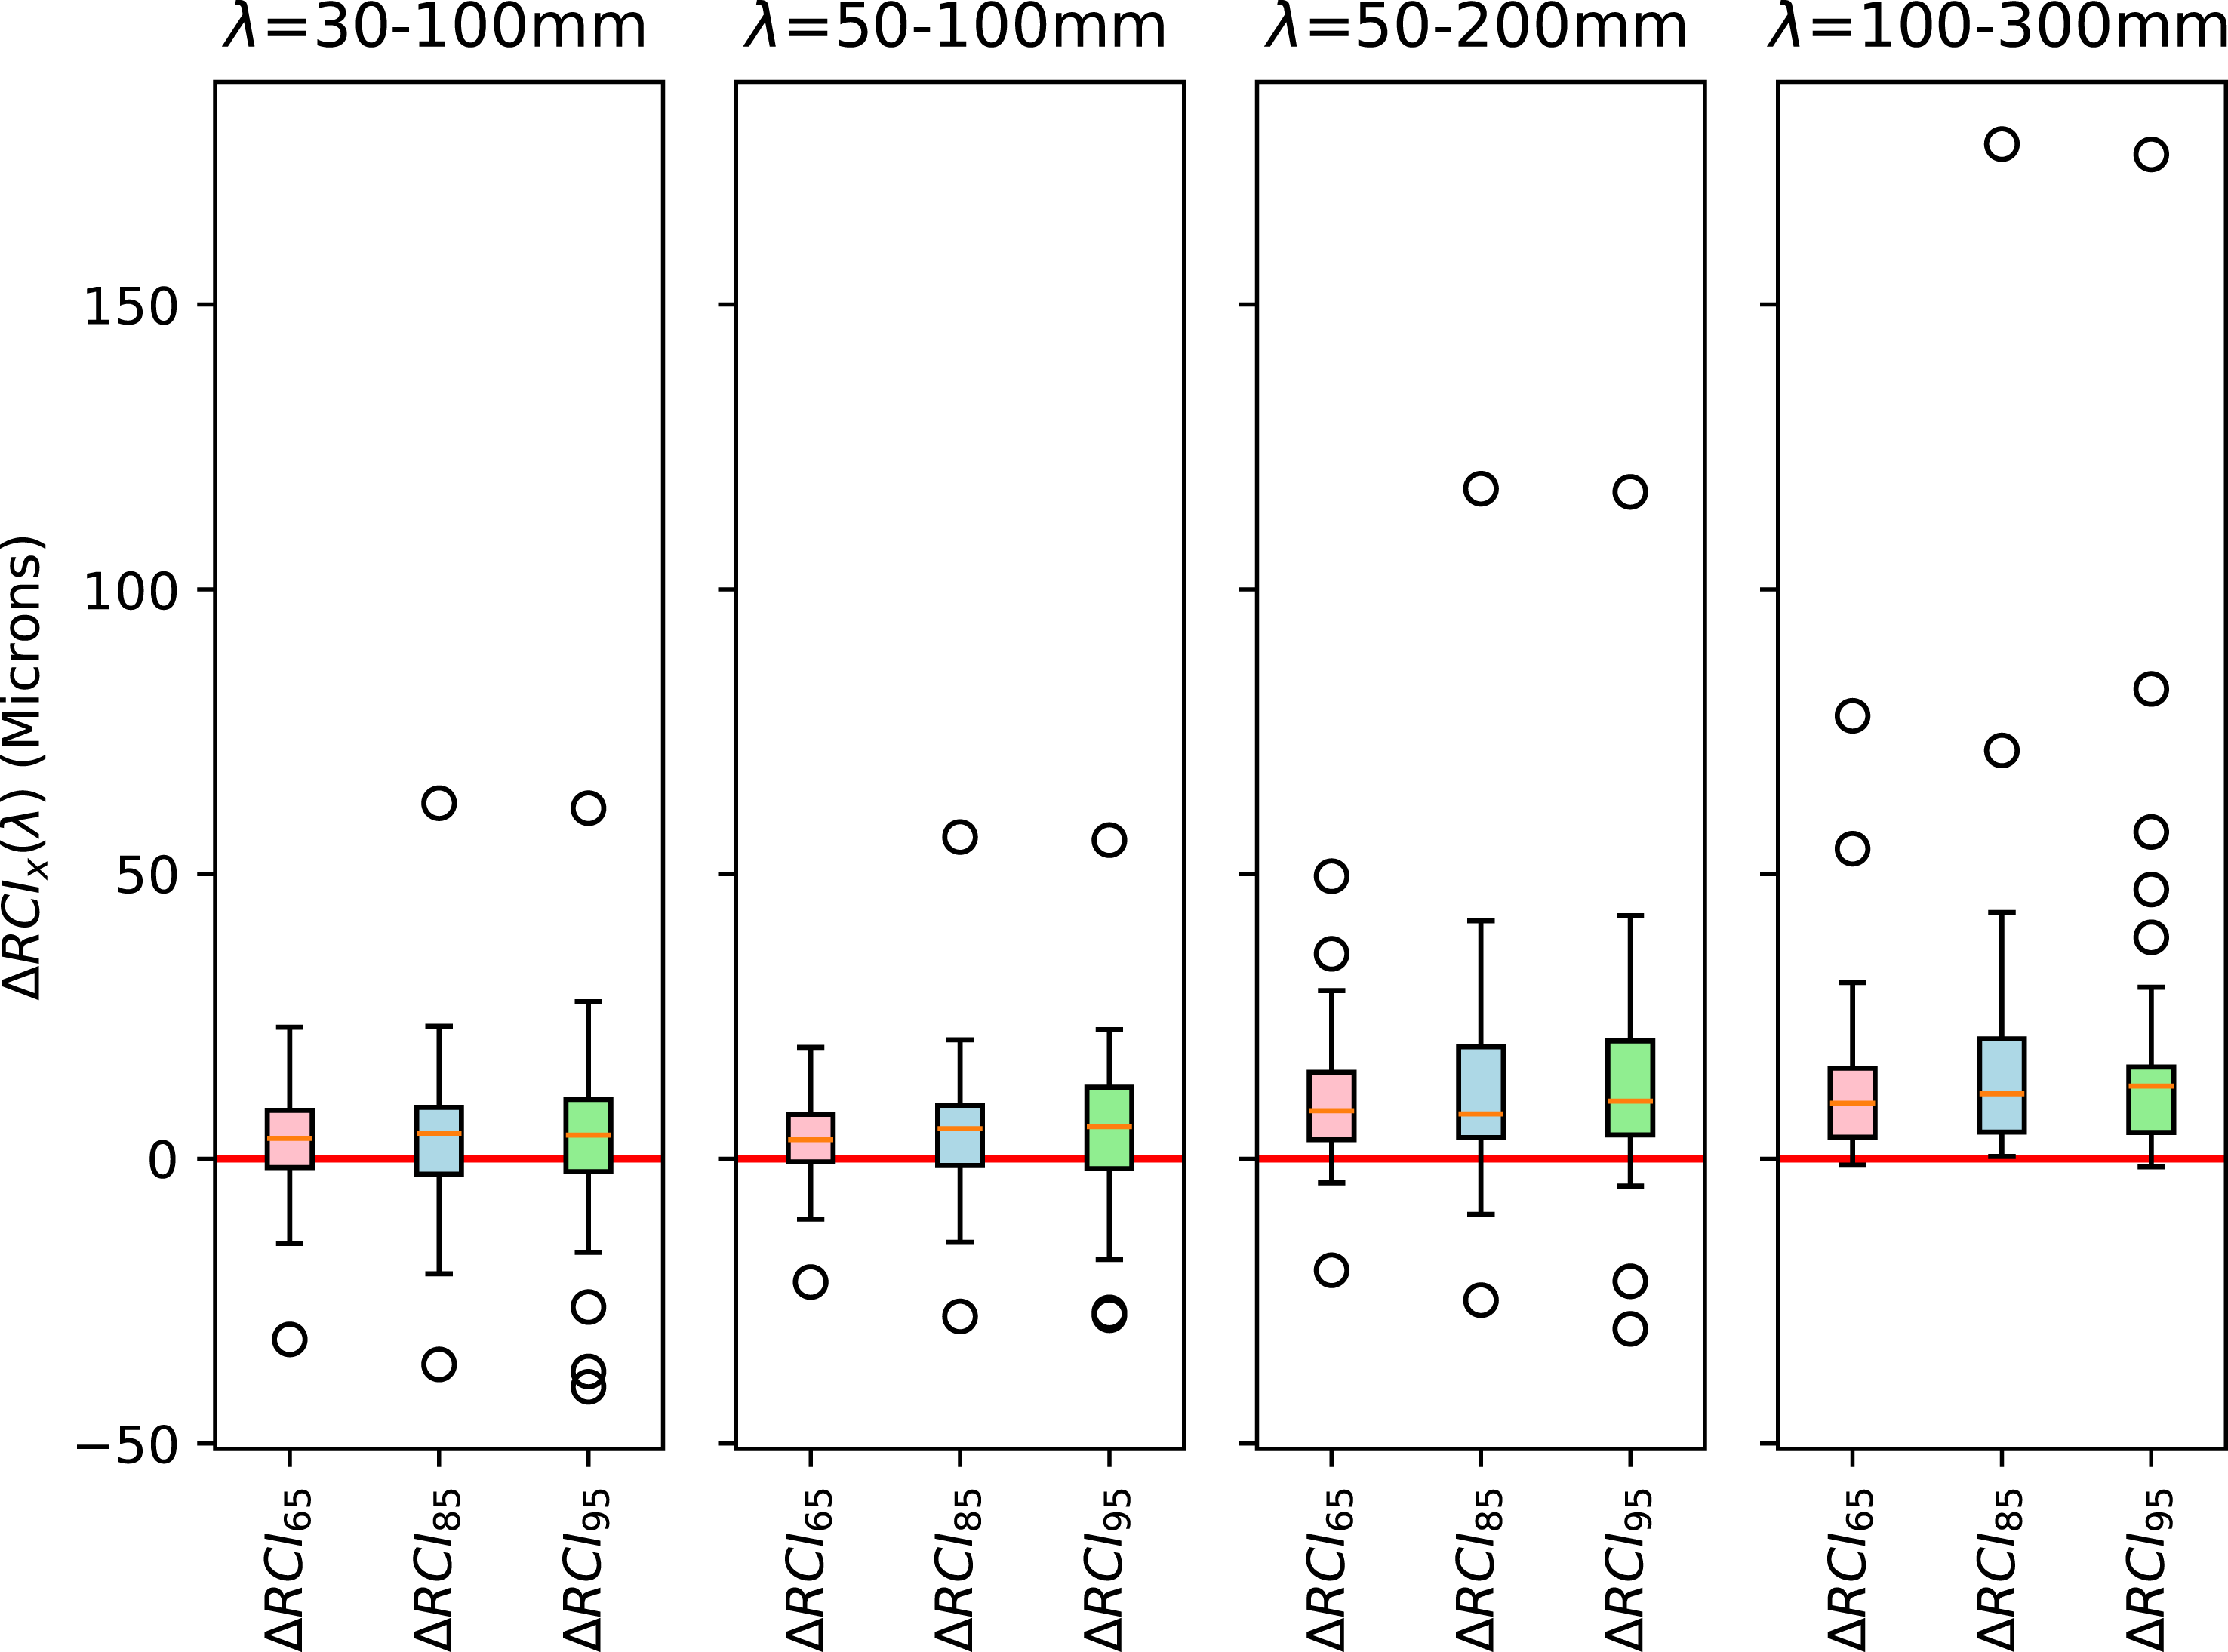
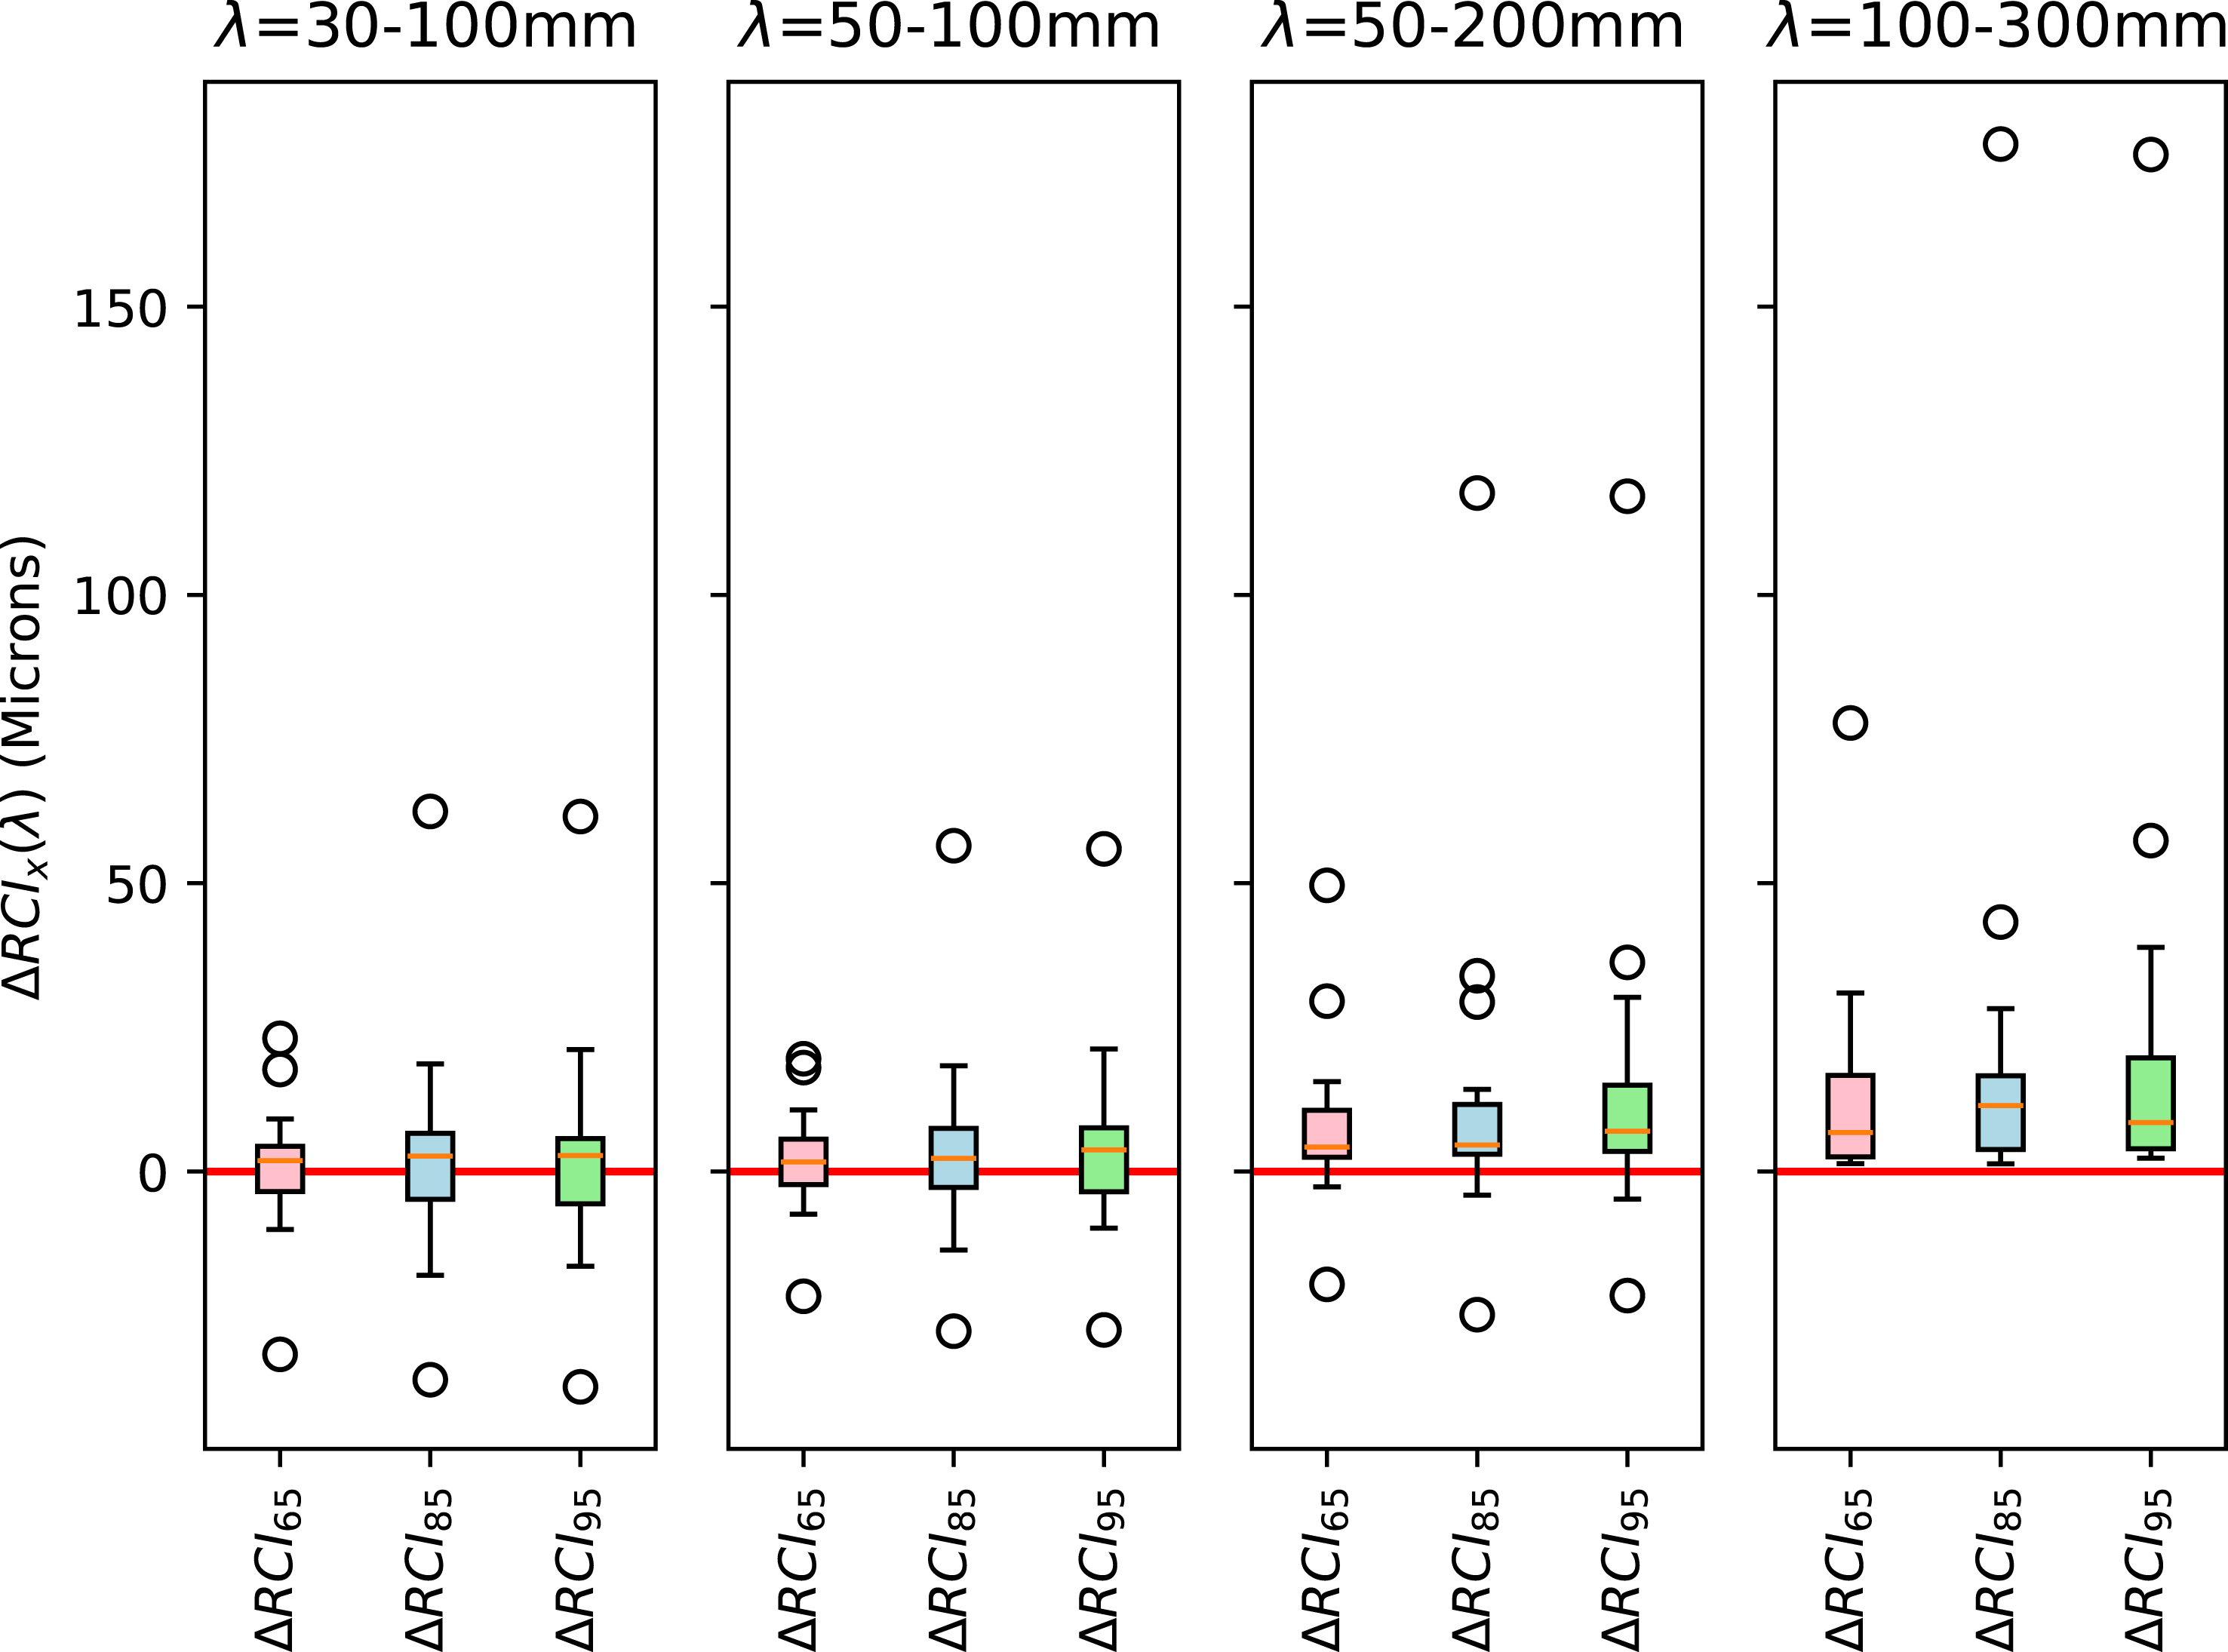
Figure 2 shows the distribution of these improvements as a function of filter band. In the box plots, the orange lines denote the medians, and the bottoms and tops of the boxes denote the first and third quartiles of the data (Q1 and Q3 respectively). The whiskers below Q1 extend to the first datapoint that is greater than Q1 minus 1.5 times the interquartile range (IQR = Q3-Q1). Similarly, the whiskers above Q3 extend to the first datapoint less than Q3 plus 1.5 times the IQR. Any points outside of these whiskers are mathematical outliers.
Distribution of for the different tested wavelength bands (n = 34).
From the figure, 30–100 mm and 50–100 mm are similarly inconsistent in showing a desirable response to grinding, while 50–200 mm and 100–300 mm are more adept at showing a desirable response (Figure 3).
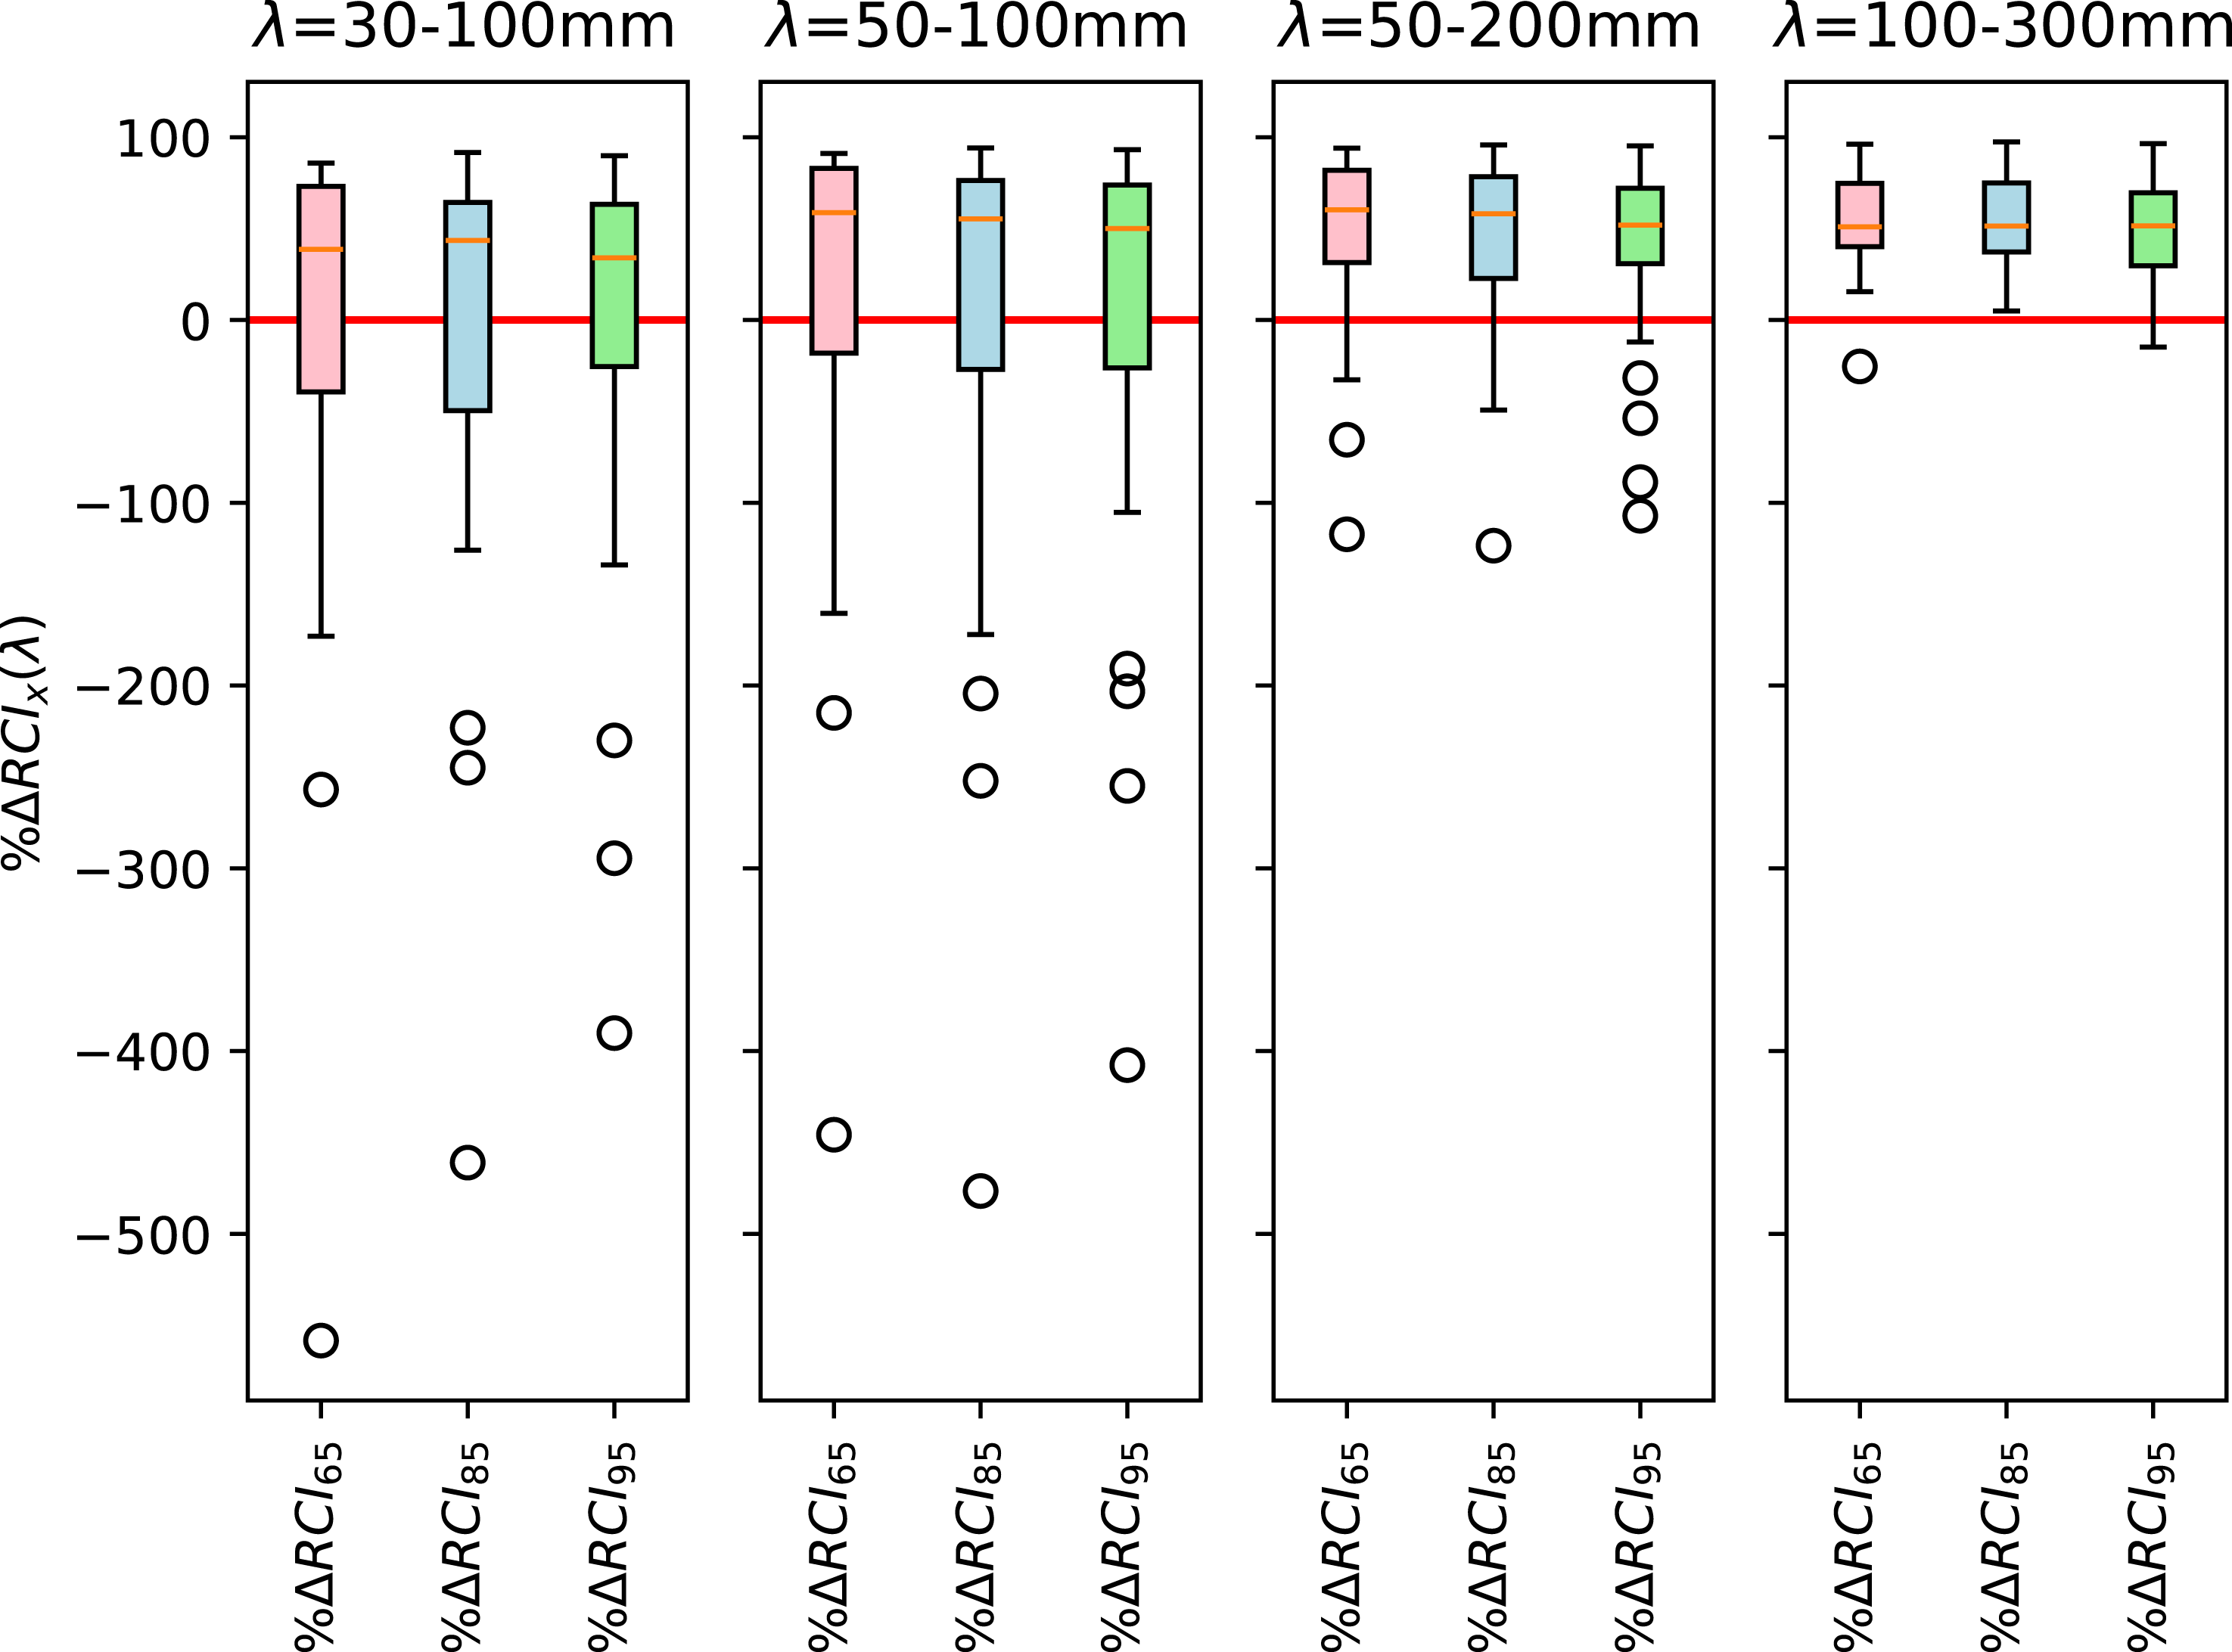
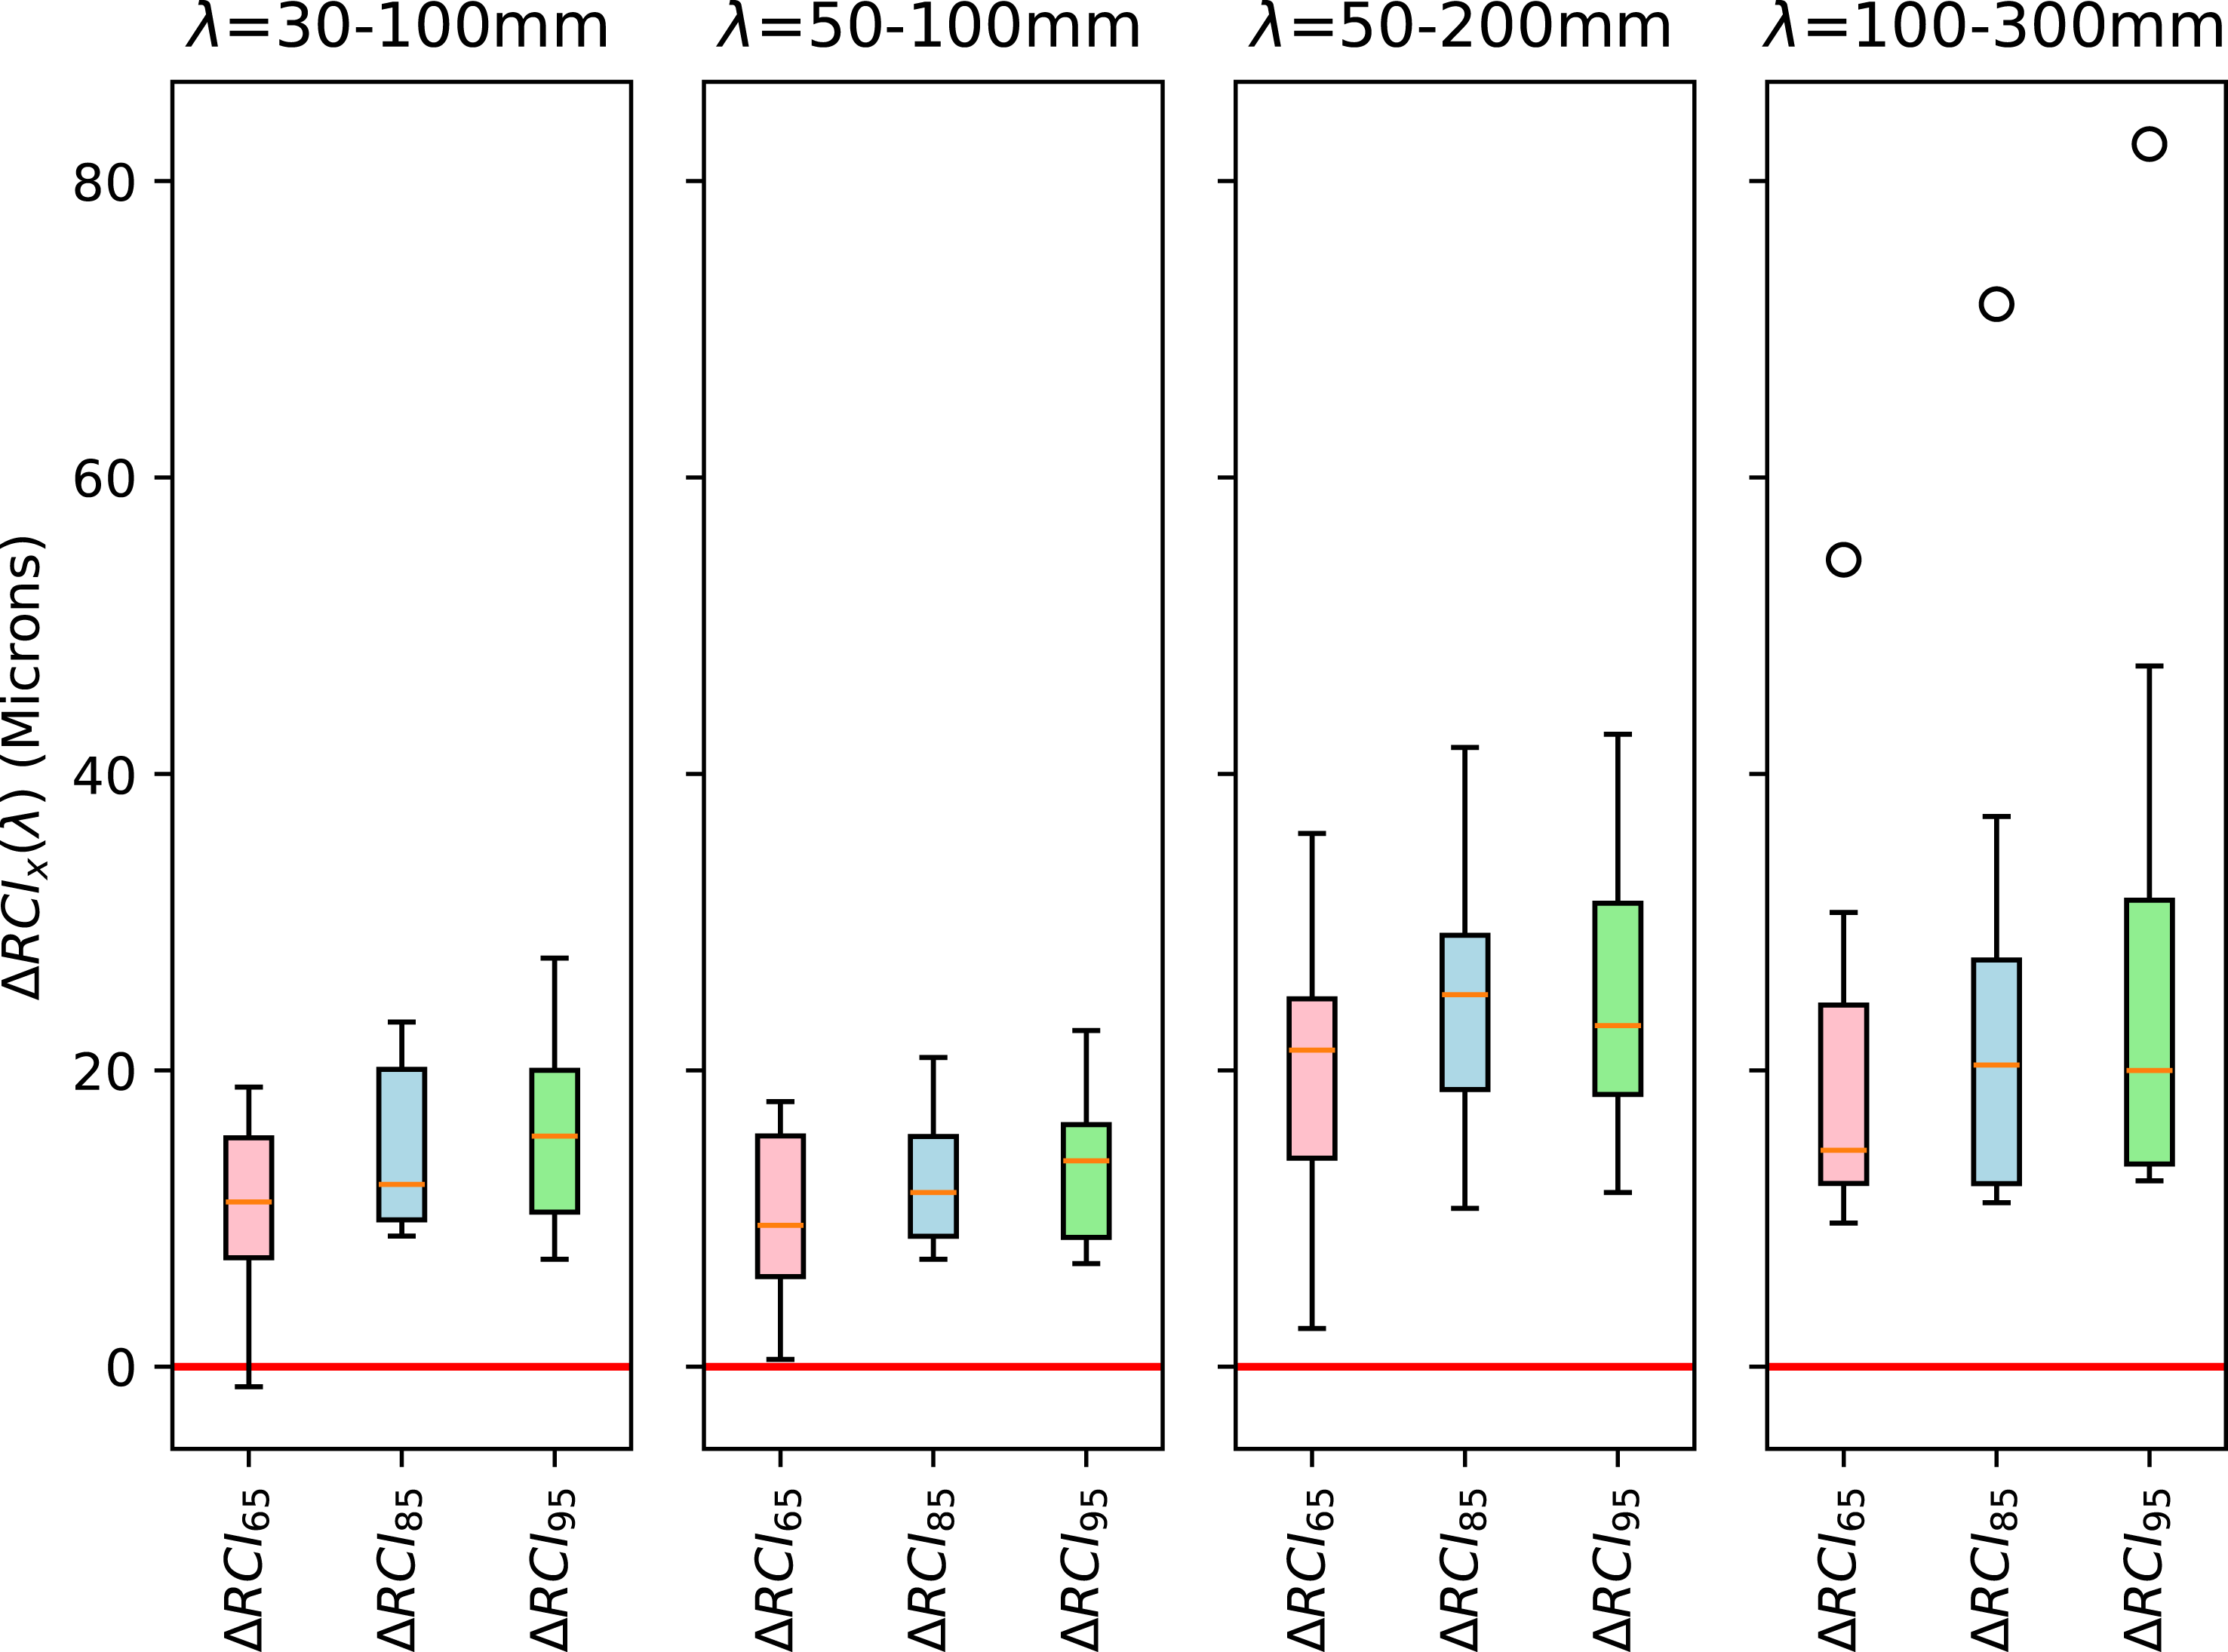
Distribution of relative to normalize improvement according to initial rail condition (n = 34).
Observing just the range of the boxes and whiskers, 100–300 mm outperforms 50–200 mm on the lower end by demonstrating a more consistently positive response to grinding, while 50–200 mm slightly outperforms 100-300 mm on the upper end of the distribution, particularly in the metric. This further reinforces the idea that at a property where the corrugation appears to be of longer pitch, the block RMS methodology of successfully echoes the spectral content’s response to grinding when the filter band is appropriately changed. Looking at the response in Figure 3, similar results are evident. However, 100–300 mm clearly outperforms all other frequency bands. Figure 3 repeats the behaviour found in Figure 2, where the longer wavelengths are demonstrating a desirable response to grinding more consistently than the shorter wavelengths, and any undesirable responses show less post-grind growth (i.e., are less negative) in the longer wavelengths than those in the shorter wavelengths. All of this is to say that the results of this study show that is a metric that is robust enough to be varied from property to property to address their corrugation assessment needs.
Sensitivity of RCIx(λ) to post-grind measurement delay
Extending this initial investigation, we considered why some values appeared to worsen post-grind. The samples were taken any time between 1- and 5-days (inclusive) post-grind, implying that some time may be required for regular train operation to remove the grind signature left on the rail. Indeed, allowing the rail to wear in before measuring corrugation showed improvement in the metric: looking at the comparison between the 1-day post-grind measurement distribution of Figure 4, and the 5-day post-grind measurement distribution of Figure 5, it can be seen that all wavelength bands improve their response in all percentiles. This suggests that while is robust in terms of detecting corrugation, it is somewhat susceptible to under-reporting grind effectiveness immediately post-grind. This is consistent with our previous findings, where the first measurement post-grind is not consistently better than the second measurement post-grind.
Distribution of for samples where post-grind measurements were taken 1 day post-grind (n = 16).
Distribution of for samples where post-grind measurements were taken 5 days post-grind (n = 12).
Pitfalls of %ΔRCIx(λ) due to low pre-grind RCIx(λ)
Notably, can be misleading in cases where suggests the rail quality is already good due to the sensitivity of the metric to the initial rail condition. For example, one such measurement indicated that the 30-100 mm filtered was measured to be 2.36 microns, and the was measured to be 5.01 microns, indicating a of −111.2%. It is understood that while this degradation is not desired in the post-grind measurement, this is misleading when viewed in isolation as the represents a very small increase. This increase could be an artifact of grinding, or an operator error due to inadvertently sampling some unground rail at the start or end of the measurement. Similarly misleading measurements are found across all filtered data bands and percentile values tested when both the value and the magnitude of were less than 6 microns. This understanding reinforced the idea that is best used when the suggests that the rail was initially in poor condition and is recommended to be used in conjunction with the measurement for reference. More generally, is well-suited for macroscopic analysis of distributions in grind response, as opposed to inspecting individual datapoints where the variance in measurements can make individual values noisy. Figure 3 demonstrates that while wavelength bands have at least one measurement near 100%, the distribution of this index across all wavelength bands varies considerably.
Summary
Previous work involving demonstrated reasonable responses over time, and when rail was subject to grinding on an initial rail property. This motivated the need to validate the index using data collected at a new property. This work has shown that the index can be made robust enough to translate to a new property by endowing it with the flexibility to monitor corrugation of a variable wavelength range. The initial study showed promise in the 30–100 mm window, and this continuation has demonstrated that the metric shows counterintuitive results when it is applied using an incorrectly chosen wavelength band (in terms of suitability to a property’s standard operation). This suggests that some level of expertise is required to correctly select a wavelength band for a unique property when this metric is being used. This study recognizes that can demand some level of patience when measuring post-grind corrugation as the difference in 1 day post-grind versus 5 days post-grind showed. Lastly, sometimes shows an insensitivity to grinding when the initial corrugation presence is low.
In this section we develop an alternative to , , to capture corrugation-related noise more appropriately from wayside noise measurements.
Dataset
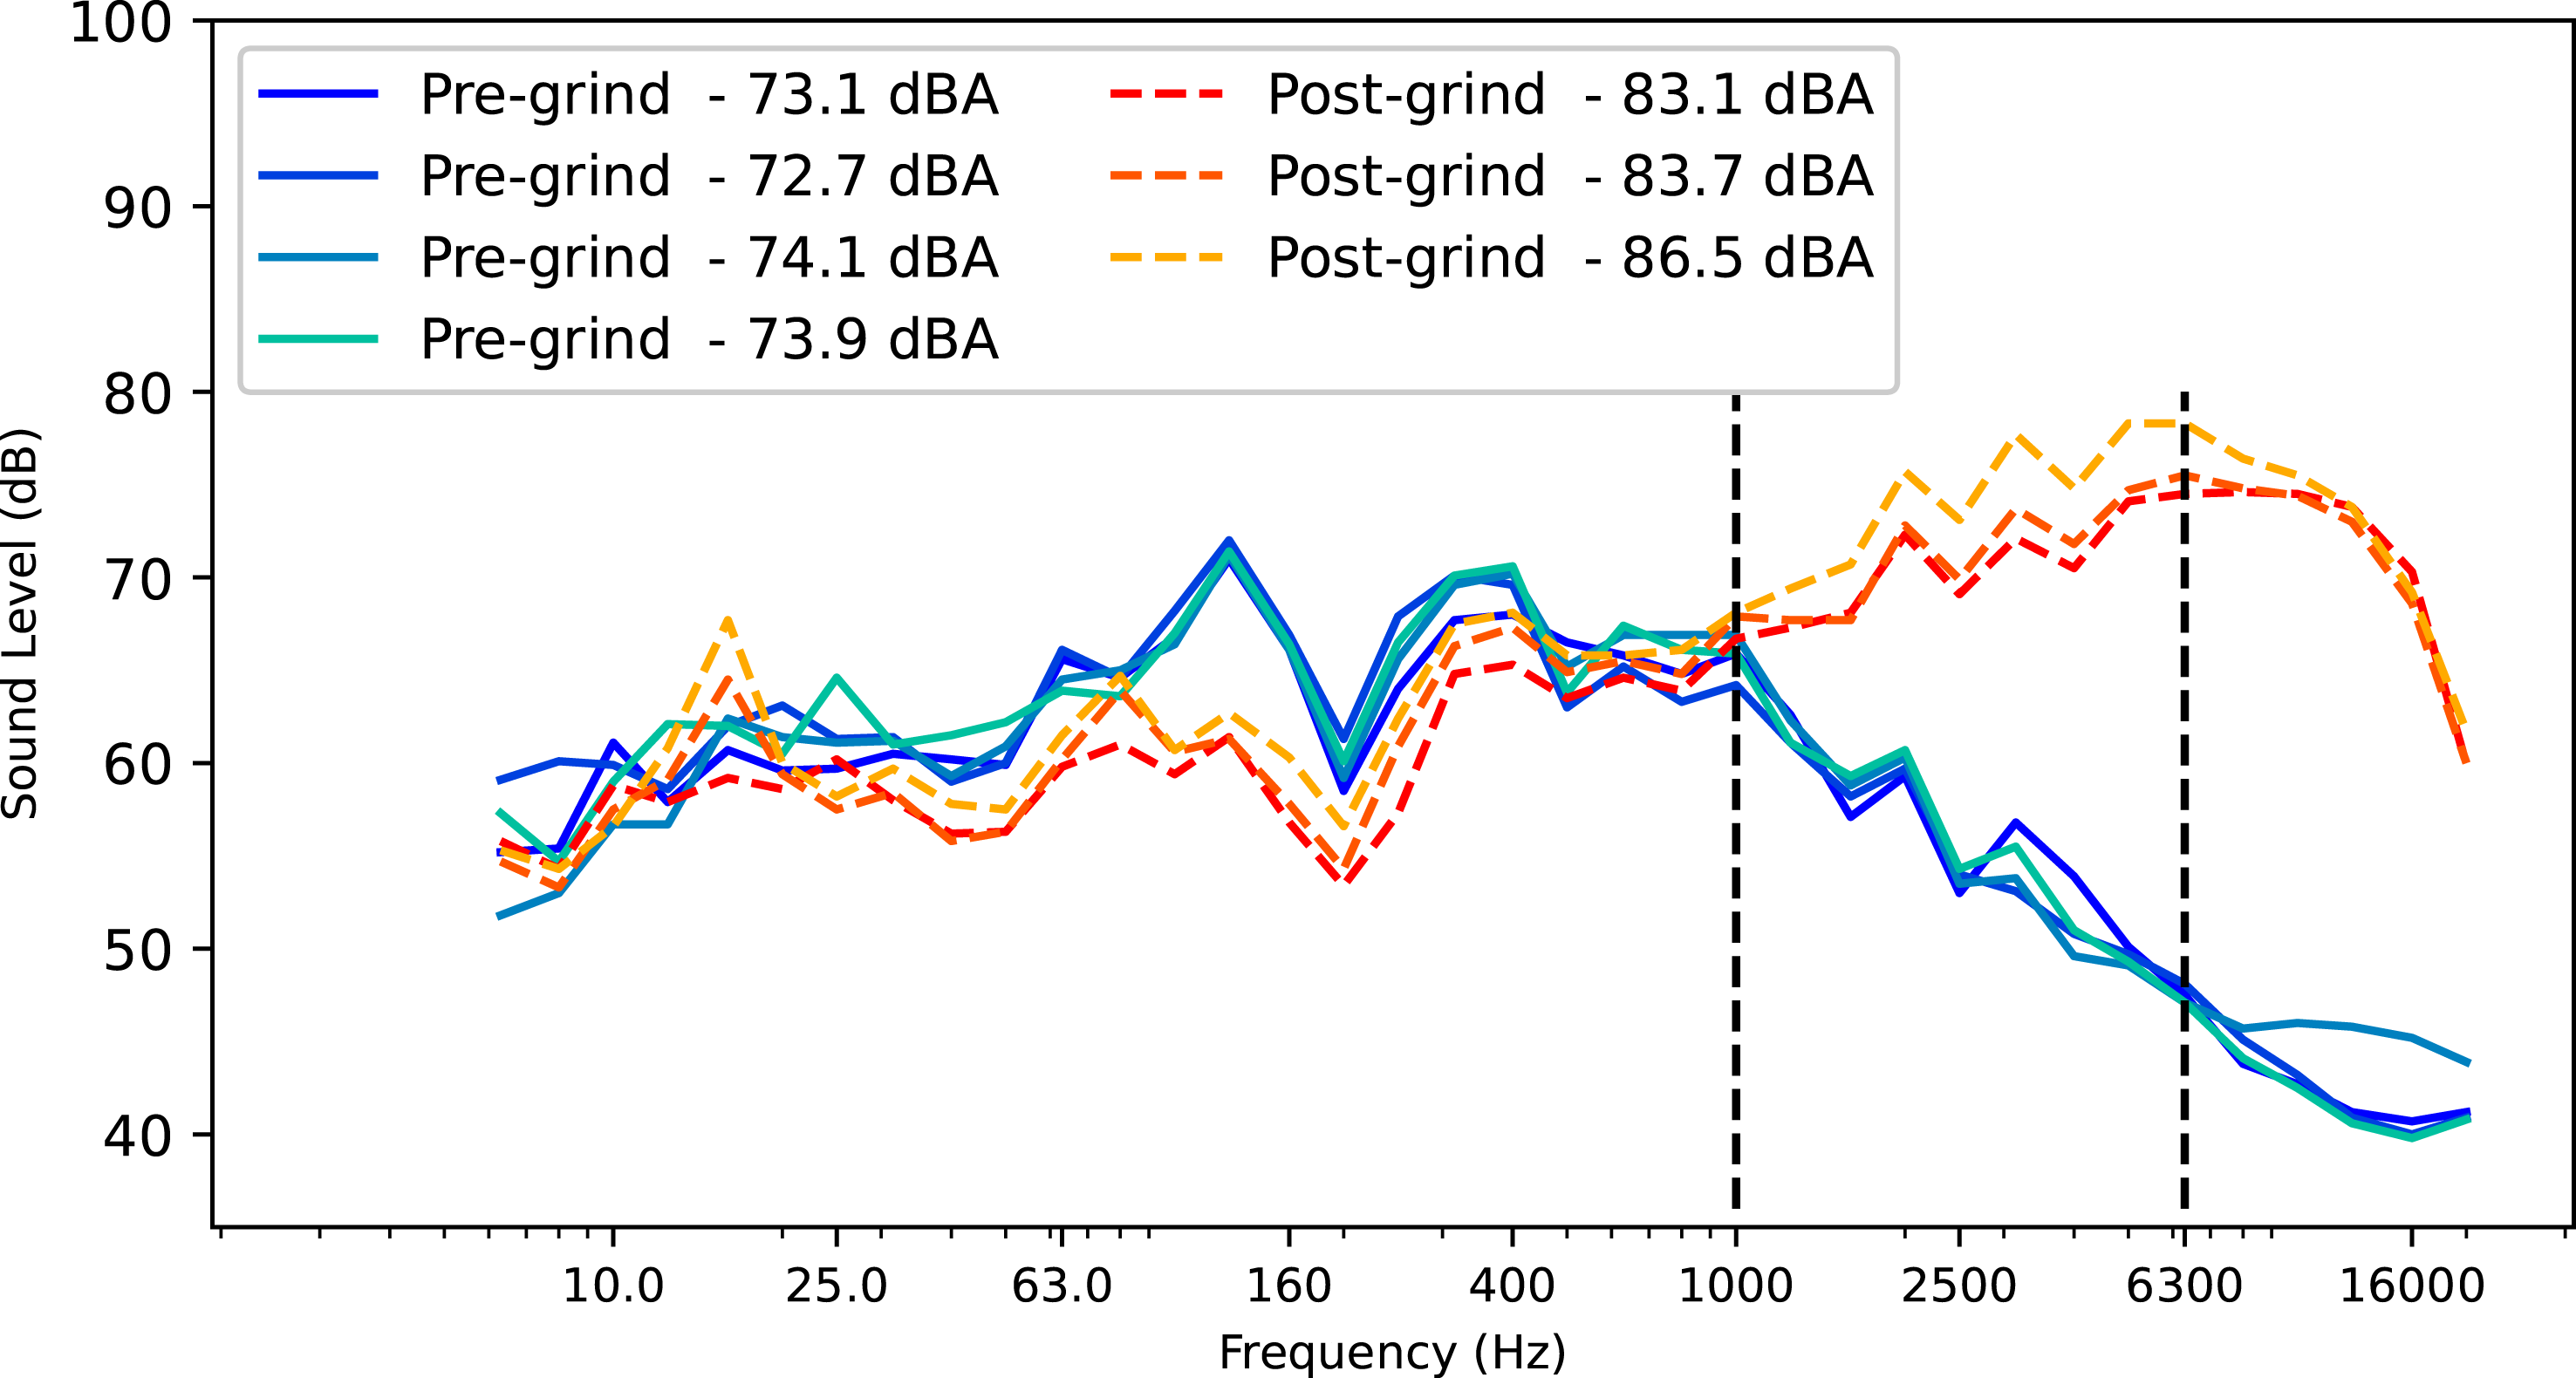
The noise measurement data available at this property consists of pre-grind and post-grind samples. As a result, there is no data capturing the evolution of noise levels between grinds. Wayside noise was measured using a sound level metre at the same 17 curves that corrugation was sampled, however only 15 of the 17 curves had both pre- and post-grind noise samples, so the 2 curves having only pre-grind or post-grind noise were discarded. These locations had between 1 and 4 individual noise measurements, where one measurement captured the noise generated by exactly one train passing by the measurement site. As shown in Figure 6, these spectra were consistent enough that the limited number of samples was deemed adequate. Each measurement included the A-weighted noise spectrum, and the calculated value.
Unweighted pre-grind and post-grind spectra of wayside noise taken from a particular curve. Note the post-grind increase in noise where A-weighting is especially sensitive, denoted by black dashed lines, and how this is reflected in the of each sample as presented in the legend.
Application of LAeq
This study repeated the work of Lasisi et al.11 at the new property with respect to noise, and again found that the results identified the need to refine initial understanding to account for property-specific characteristics. It was observed that 5 of the 15 test sites showed post-grind noise that was higher than the pre-grind noise, with increases of up to 10 dB. For situations where long-pitch corrugation is improved through grinding maintenance, the noise response is also expected to improve.
To investigate this post-grind noise increase in the measurement, the entire noise spectrum for each sample was considered. Figure 6 shows the 4 pre-grind and 3 post-grind Z-weighted spectra at a particular curve, and their calculated values. From this figure, the post-grind noise is higher magnitude than the pre-grind noise at frequencies greater than 1 kHz. A-weighting, the filter response of which is shown in Figure 7, amplifies frequencies between approximately 1 kHz and 6.3 kHz and for this example overrepresents frequencies where the post-grind noise is louder than the pre-grind noise. is valuable for investigating human perception of noise phenomena, but it seems to be missing a noise reduction due to grinding in this study. This suggests the need to adapt our noise weighting schema.
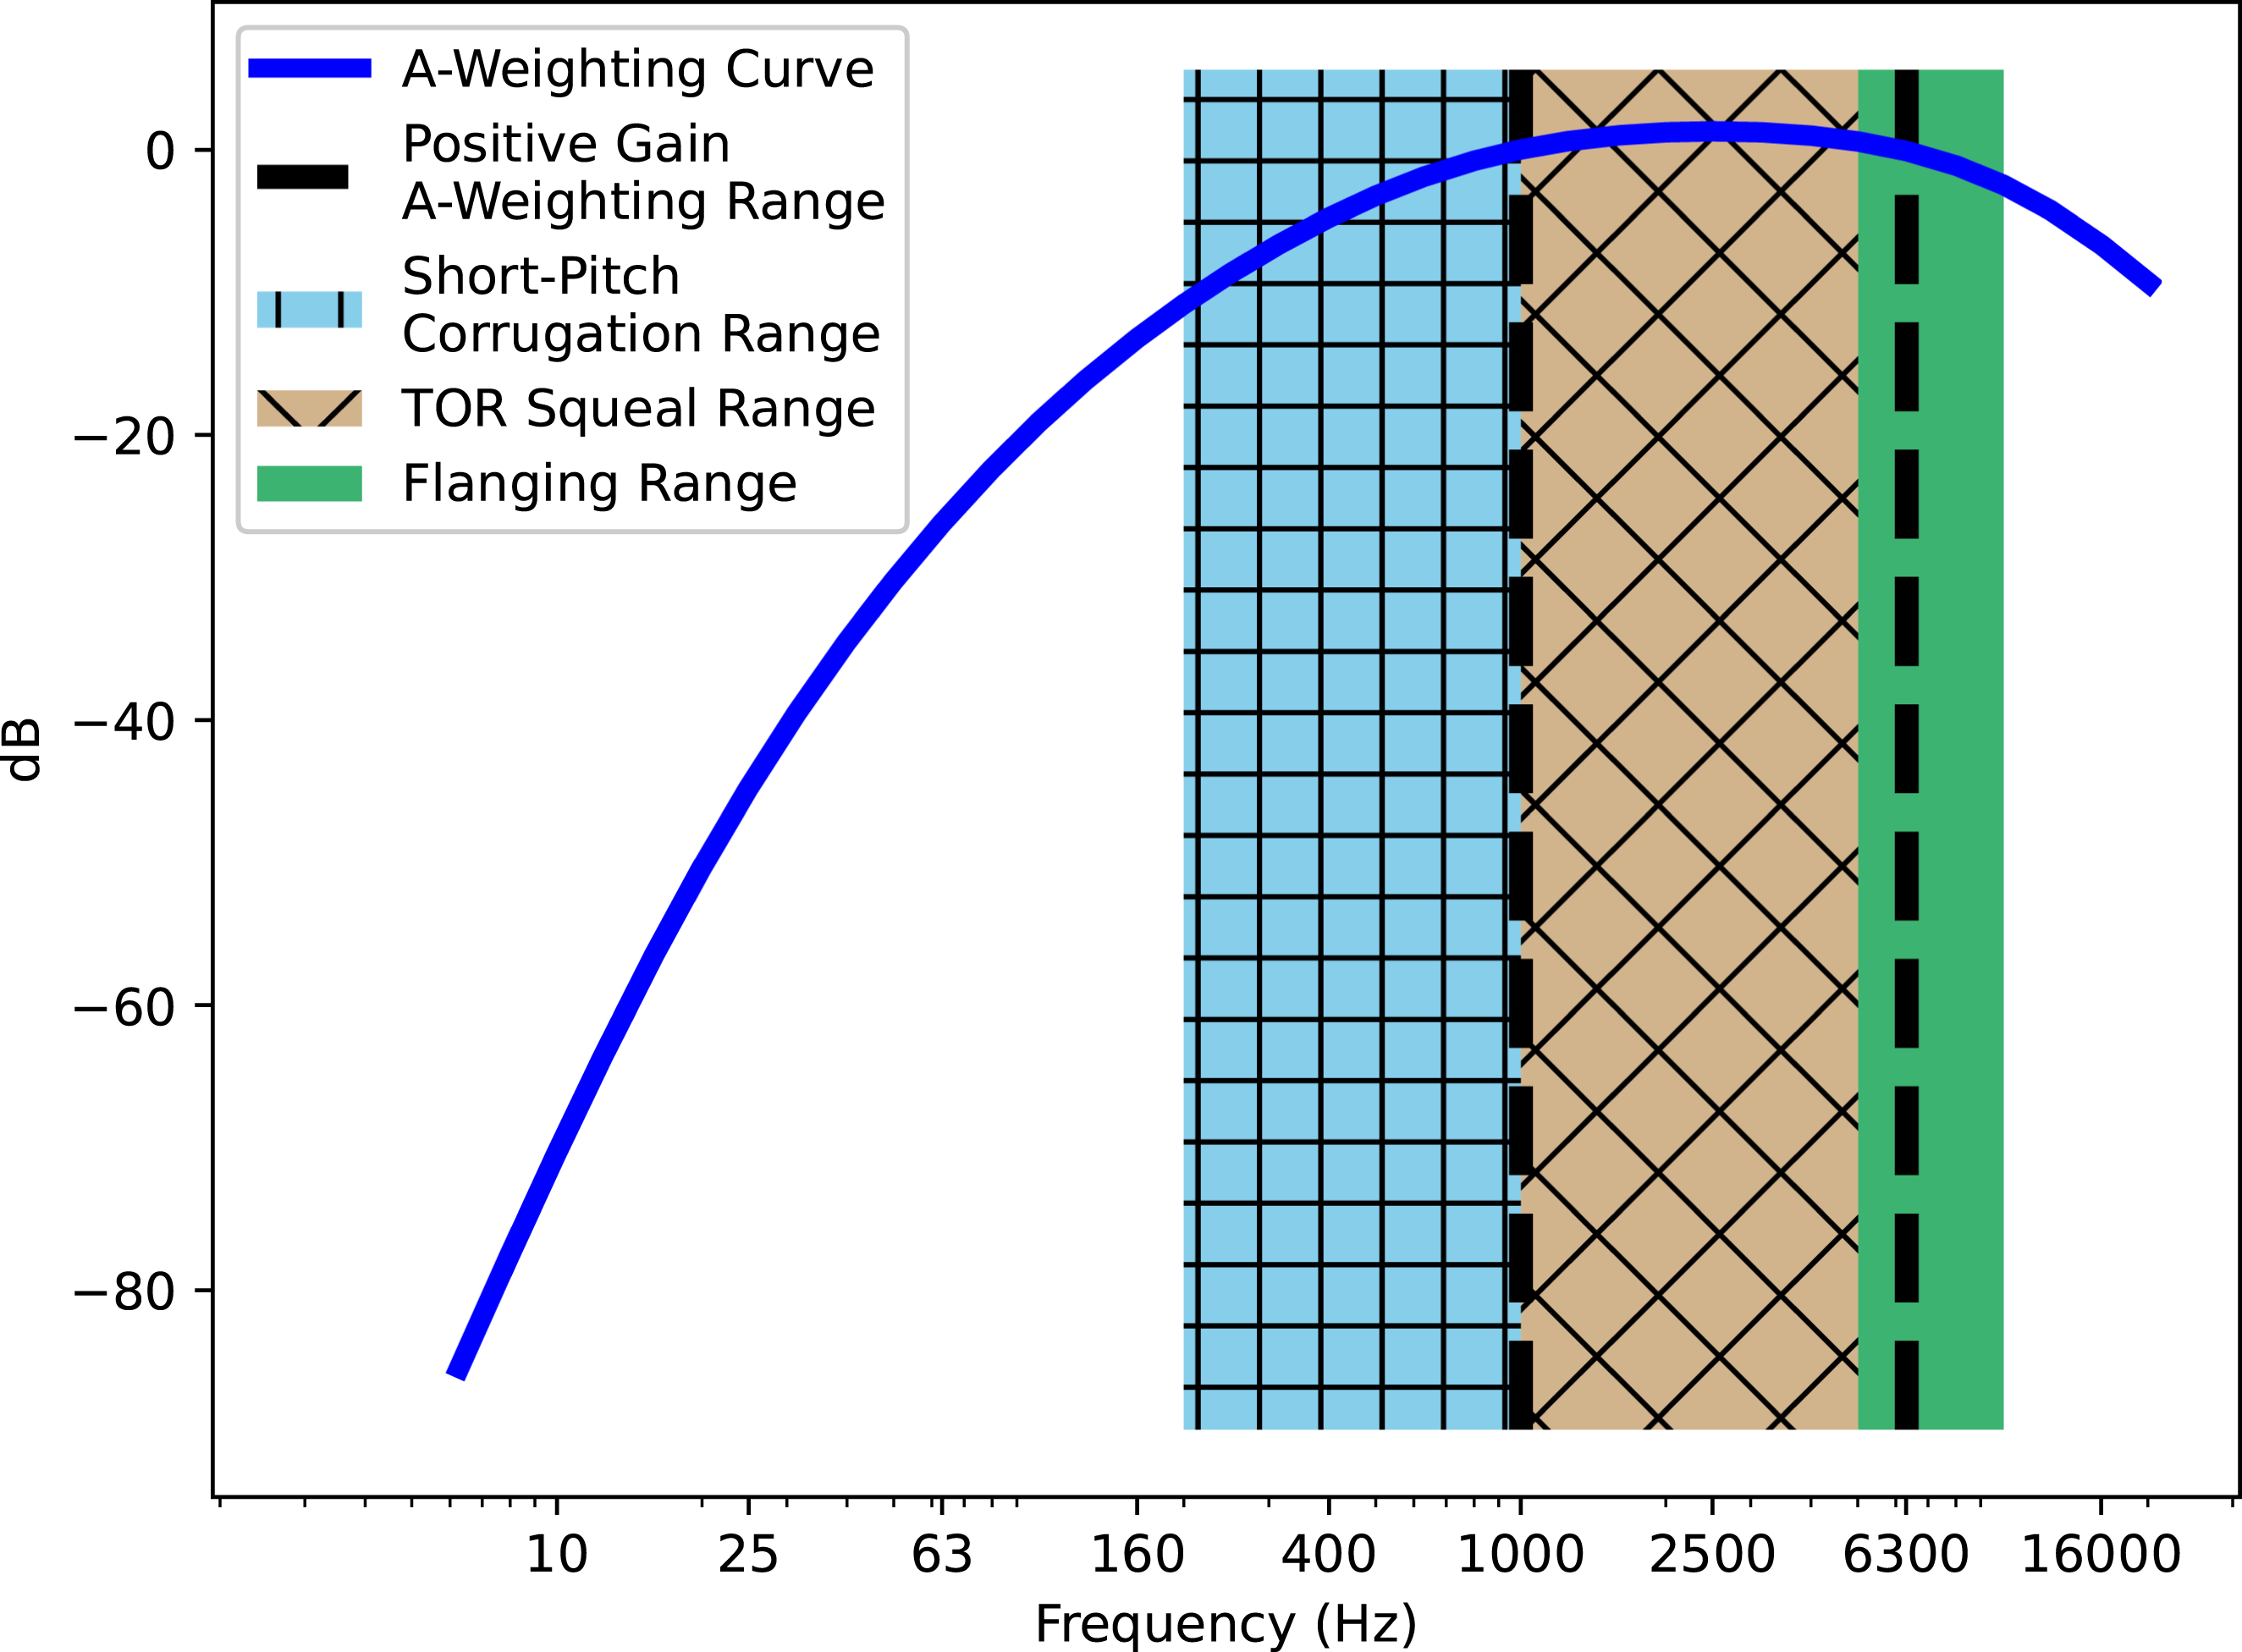
A-weighting curve with shaded/hatched regions indicating common rail maintenance phenomena highlighted in Table 2. The dashed black lines highlight where A-weighting does not attenuate the spectrum.
Velocity- and wavelength-adapted Boxcar filtering
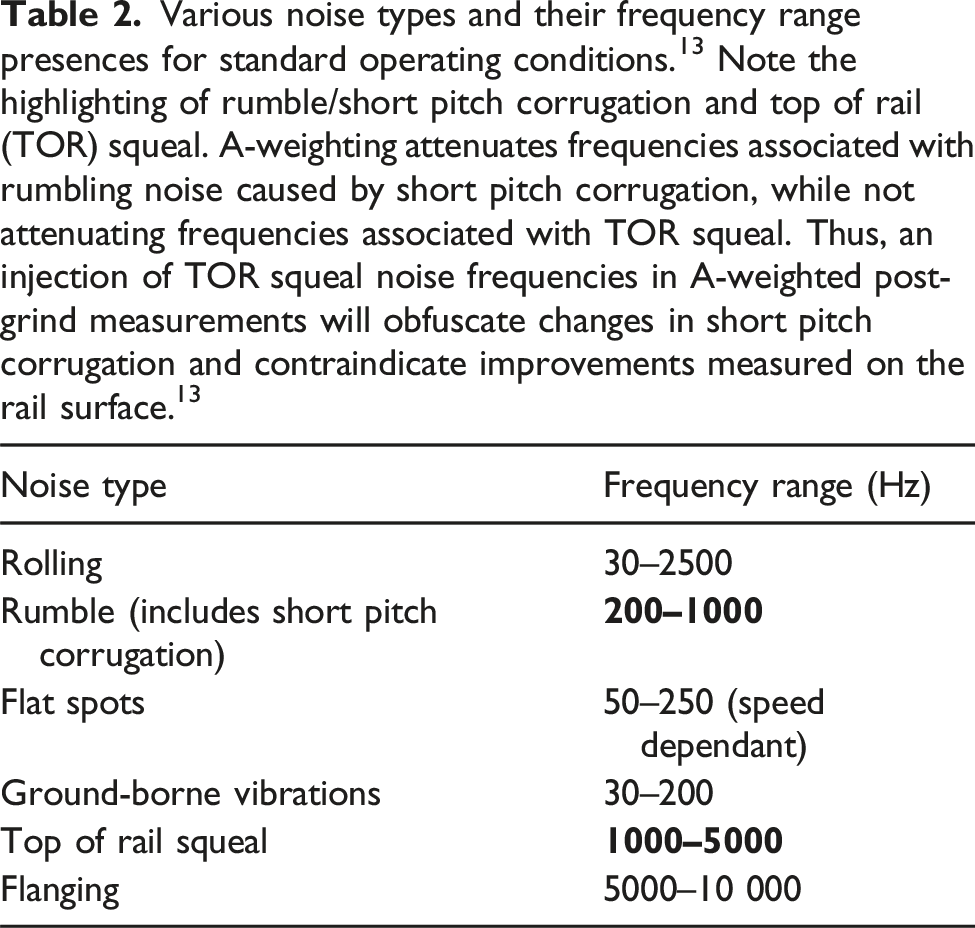
Under standard operation conditions, various rail phenomena will emit noise at different sonic frequencies.13Table 2, shows a list of common industry noise sources and their associated frequency ranges for nominal operation, suggesting that the noise detected in the post-grind measurements at frequencies greater than 1 kHz is likely not due to corrugation. Coincidentally, the noise range of top of rail (TOR) squeal aligns with the positive gain frequency range of A-weighting, as illustrated in Figure 7. It could not be precisely identified why this noise is present post-grind, but it is believed to not be due to corrugation. Because of this shortcoming with A-weighting, this study sought to define a noise weighting scheme with a desired sensitivity to only corrugation-related noise.
Various noise types and their frequency range presences for standard operating conditions.13 Note the highlighting of rumble/short pitch corrugation and top of rail (TOR) squeal. A-weighting attenuates frequencies associated with rumbling noise caused by short pitch corrugation, while not attenuating frequencies associated with TOR squeal. Thus, an injection of TOR squeal noise frequencies in A-weighted post-grind measurements will obfuscate changes in short pitch corrugation and contraindicate improvements measured on the rail surface.13
Noise type
Frequency range (Hz)
Rolling
30–2500
Rumble (includes short pitch corrugation)
200–1000
Flat spots
50–250 (speed dependant)
Ground-borne vibrations
30–200
Top of rail squeal
1000–5000
Flanging
5000–10 000
While Figure 6 shows an increase in noise in the TOR wavelength range, it also shows a decrease from pre-grind to post-grind between approximately 63 Hz and 200 Hz. Knowing that, at this property, corrugation is found in lower frequency noise, and that the corrugation roughness has been reduced, this dip is believed to be a result of grinding, meaning that an appropriate weighting scheme would be sensitive to this change in amplitude at this approximate frequency range, and ignoring the larger delta in the TOR Squeal frequency range. It is worth noting that this range is lower than the frequencies listed in Table 2, as the corrugation analysis determined that corrugation was of higher wavelength, which corresponds to lower audible frequencies.
It is understood that the noise generated by corrugation is a function of both the wavelength of corrugation present, and the velocity of the train passing over the corrugation. It is defined by the wave velocity equation , where is the velocity of the train in metres per second, is the wavelength of corrugation being passed over in metres, and is the audible frequency of noise in hertz.
We propose , a novel noise-weighting scheme that is parametrized for corrugation and vehicle velocity. These parameters allow the calculation of a potential frequency range of corrugation-related noise in a sample, namely . In our proposed modification, noise outside of this range is attenuated by 30 dB, before calculating the equivalent sound pressure level. We refer to the result with units of dBv to distinguish it from A-weighting, which we denote with dBA. In , the input parameter denotes a corrugation range, such as 30–100 mm, as it does for . Similarly, denotes a velocity range parameter; in this study, we used 60–90 km/h, which was the approximate velocity range of vehicles operating on the property.
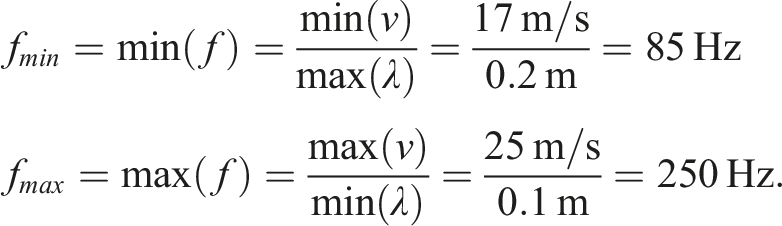
In the section Wavelength-adapted RCIx (RCIx(λ)), it was determined that the corrugation was largely in either the 50–200 mm band, or the 100–300 mm band. The following analysis assumes corrugation in the overlapping wavelength range 100–200 mm. The velocity range 60–90 km/h corresponds to approximately 17–25 m/s. As a result, the audible frequency band of interest is defined by:
Frequencies outside of this range were filtered by 30 dB. Figure 6 shows that the noise is reduced post-grind between approximately 100-200 Hz, which falls within the range calculated by when velocity is not precisely known.
Results
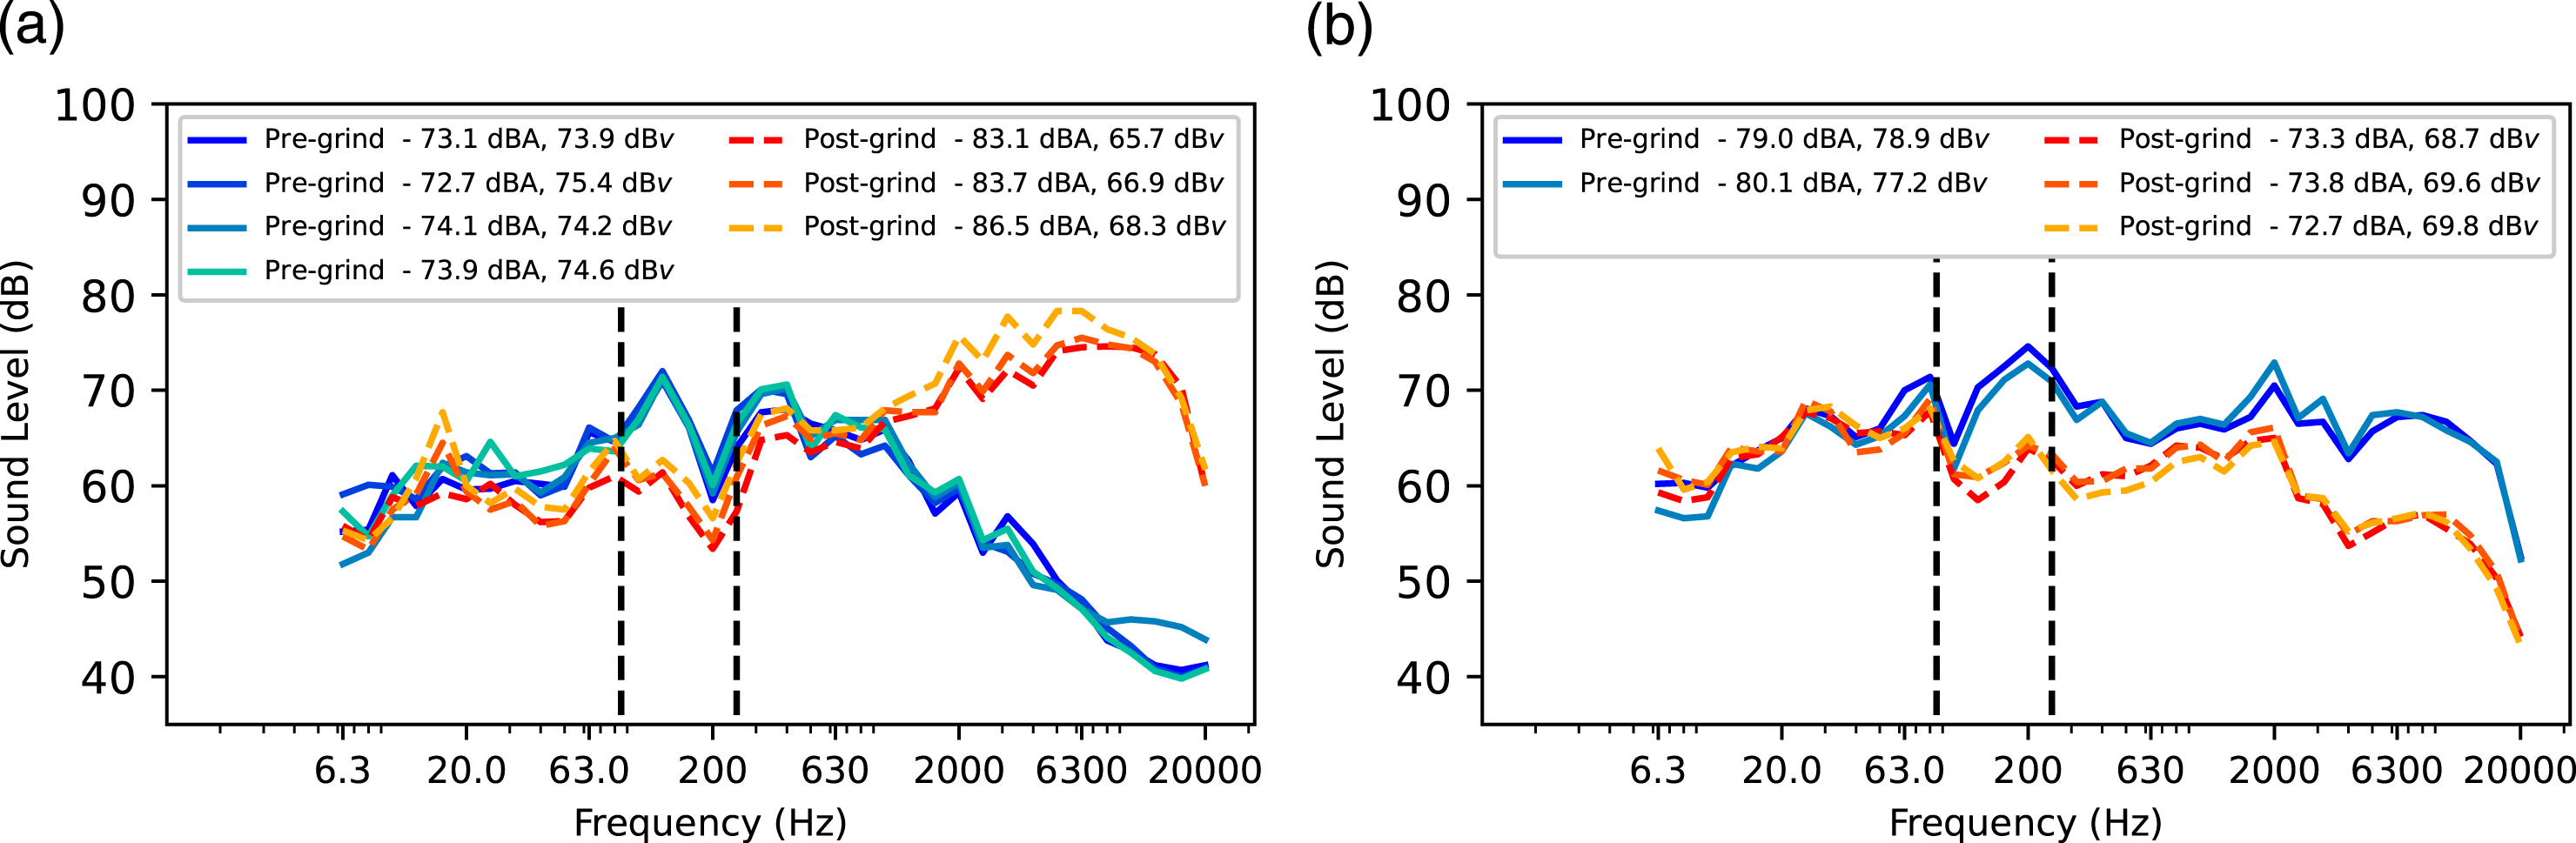
At the 5 measurement sites where the did not accurately reflect the change in corrugation in instances like Figure 6, effectively captures a notable dB drop as demonstrated in Figure 8(a). In addition, Figure 8(b) shows that preserves behaviour where accurately showed lower post-grind noise, indicating that the metric does not overfit anomalous results.
(a) Unweighted pre- and post-grind spectra, with and comparison, highlighting the corrugation-associated noise region as estimated by v-weighting. The legend illustrates that where A-weighting fails to capture the noise reduction from grinding, the parametrized v-weighting shows a proper decrease in noise. (b) Unweighted pre- and post-grind spectra, with and comparison, in a sample where correctly demonstrated lower post-grind noise. A-weighting properly detected a reduction in noise, as did v-weighting, suggesting the metric is not overfitting to samples misinterpreted by A-weighting.
This study has shown that can improve a property’s ability to detect the presence and subsequent treatment of corrugation through wayside noise measurements. By focusing the weighting scheme on specific low frequency information derived from maintenance targets, property maintainers can monitor corrugation without sacrificing other maintenance practices. It does this without raising the minimum threshold for knowledge to a point where additional technology or bookkeeping is necessary. For example, this metric could allow managers to perform Top of Rail Friction Management (TORFM) while still monitoring corrugation, all while knowing that the metric will be focused only on corrugation-related noise at the property considered. If the grind was not successful, but TORFM was applied post-grind, may tell the property maintainers that corrugation was successfully removed, whereas would correctly convey the corrugation-specific information.
Conclusion
This study has demonstrated a novel approach to corrugation monitoring, through monitoring of its noise as a covariate, to aid in the rail maintenance decision-making process. It has extended the work completed by Lasisi et al.11 to add flexibility and robustness when assessing corrugation and its associated noise at a new location with different operational characteristics.
This paper showed that is a malleable metric that can be used to monitor corrugation in any band and shows a clear response to grinding when the correct corrugation band is the focus of filtering, and provided a notation change of to differentiate it from previous work with . It also showed that and are impacted by allowing the grind signature to wear into the rail after grinding, as opposed to measuring immediately post-grind. This can help to provide guidelines to transit properties to better monitor their systems without false positives due to hasty corrugation measurements.
This paper also demonstrated some of the potential shortcomings of , due to its tendency to overrepresent noise frequencies not associated with corrugation in wayside noise samples. As a result, we have developed as an alternative, which demands slightly more information in terms of approximate train velocity of a sample but shows greater sensitivity to noise specifically due to corrugation.
The added flexibility of these metrics aims to help maintainers of properties with different track characteristics, rolling stock, and environmental conditions, which may affect the dominant wavelengths of corrugation in the system. We have shown that these corrugation and wayside noise metrics, for cases tested thus far, both respond similarly to grinding intervention across different properties. Future work should expand the number of test sites (both properties and locations within properties) and expand the time scope in an effort to assess ’s ability to infer corrugation growth. Additional work should comparatively evaluate against other indicators developed using different weighting schemes, such as AV-weighting and λ-weighting. Such indicators may be especially of interest for passively monitoring general roughness.
Footnotes
Declaration of conflicting interests
The author(s) declared no potential conflicts of interest with respect to the research, authorship, and/or publication of this article.
Funding
The author(s) disclosed receipt of the following financial support for the research, authorship, and/or publication of this article: This work was supported by Mitacs through the Mitacs Accelerate Program [Grant No: IT36922], awarded to Dr. Ian Jeffrey and Dr. Jonathan Regehr, University of Manitoba. The authors are grateful for in-kind contributions provided by Advanced Rail Management Corporation.
ORCID iD
Julian Carneiro
References
1.
GrassieSL. Rail corrugation: characteristics, causes, and treatments. Proceedings of the Institution of Mechanical Engineers, Part F, Journal of Rail and Rapid Transit2009; 223(6): 581–596.
2.
CuiXTangCLvD, et al.Grinding limit and profile optimization in the high-incidence section of rail corrugation in mountainous city metro. Wear2023; 522: 204850.
WangKLiuPZhaiW, et al.Wheel/rail dynamic interaction due to excitation of rail corrugation in high-speed railway. Sci China Technol Sci2015; 58(2): 226–235.
5.
XuXLiuJSunS, et al.Dynamic diagnosis method and quantitative characterization of rail corrugation. Proceedings of the Institution of Mechanical Engineers Part F: Journal of Rail and Rapid Transit2023; 237(3): 297–308.
ThompsonDJHemsworthBVincentN. Experimental validation of the TWINS prediction program for rolling noise, part 1: description of the model and method. Journal of Sound and Vibration1996; 193: 123–135.
8.
ThompsonDJ. ON the relationship between wheel and rail surface roughness and rolling noise. Journal of Sound and Vibration1996; 193(1): 149–160.
9.
Van LierAA. The measurement, analysis and presentation of wheel and rail roughness.AEAT report NSTO/97/9571011/005. 1997.
10.
ThompsonDJ. Single number metrics for roughness. In ThompsonDJ. Railway noise and vibration - mechanisms, modelling and means of control. Southampton, UK: Elsevier; 2009. p. 163-164.
11.
LasisiACarneiroJRegehrJ, et al.A rail corrugation index to characterize noise impacts and grinding effectiveness on rail transit systems. Proceedings of the Institution of Mechanical Engineers, Part F: Journal of Rail and Rapid Transit2023; 238: 580.
12.
GreenDM. Absolute Sensitivity. An Introduction to Hearing. London: Roudledge, 2021, pp. 37–38.
13.
ParagreenJ. Principles of Wheel-Rail Friction Management. WRI, 2022, p. 35. Principles Course hosted at the Wheel-Rail Interface conference in 2022.