
Abstract
Despite general agreement that rail corrugation generates unwanted noise, there is a need to quantify the relationship between rail corrugation and noise and to leverage this relationship within preventive rail grinding programs. This paper develops a novel rail corrugation index (RCI) and demonstrates the suitability of that index to characterize the relationship between corrugation and noise, to assess grind effectiveness, and to predict noise as a function of rail corrugation. Using a time-series data set collected at a North American rail transit property, the proposed RCI illustrated corrugation growth as a function of accumulated tonnage and an expected reduction of corrugation after grinding. The RCI also correlated well with corresponding wayside noise observations. The evident response behavior and the relationship between rail corrugation and wayside noise gave rise to the assessment of grind effectiveness using the RCI. Further, a modelling effort demonstrated that noise can be predicted using the RCI calculated from only one rail (left or right) on a tangent section. This result suggests that there may also be an opportunity to predict corrugation using noise data, thus limiting the need for track downtime required to measure corrugation.
Introduction
Rail corrugation is a quasi-sinusoidal type of track wear resulting from wheel-rail contact, where the wavelength can be up to around 300 mm.1,2 For rail asset managers—particularly those in the rail transit industry—the measurement, monitoring, and mitigation of rail corrugation is an important consideration in minimizing noise and vibration generated from rail corrugation, maintaining a state of good repair, and extending the life of rail and rolling stock components.1,3–6 Rail wear is the most common damage mechanism associated with rail corrugation (especially in transit systems). Plastic bending of the rail, plastic flow, and rolling contact fatigue (RCF) can also be causes of corrugation, though these phenomena can themselves be the consequences of corrugation. For example, depending on its magnitude, corrugation may be sufficient to generate subsurface RCF. 7 Once these damage mechanisms take root on the rail, the self-propagating nature of rail corrugation causes further damage to the track and equipment and also produces noise and vibration.7,8 Remedial actions for rail corrugation include, inter alia, rail grinding (re-profiling), lubrication and friction control, and various strategies to manage dynamic wheel-rail interactions, such as rail dampers.2,9–11
While there is demonstrable evidence that rail corrugation generates noise, there is a need to quantify the relationship between rail corrugation and noise and to leverage this relationship within preventive rail grinding programs. Early work by Thompson 12 examined the assumed linear relationship between roughness (a combination of rail corrugation and wheel roughness) and noise. The study presented experimental evidence from numerous sources to validate the linear relationship between roughness and noise, at least for non-severe roughness amplitudes. The study also found that inconsistencies between roughness and noise levels do not imply a non-linear relationship to be sought since many other factors can significantly disturb the relationship. Grassie 13 corroborated the need for further quantitative work, suggesting that while irregularities (including rail corrugation) on the running surfaces of rails and wheels are known to induce noise, a better understanding about the correlation between such irregularities and noise is required. That relationship should be contextualized vis-à-vis relevant standards and should consider differences between types of traffic (high-speed, heavy haul, mixed, metro, light rail), geometry (tangent, curve), and rail side (high/low rails on curves). The literature also recognizes the need to establish and calibrate thresholds to support grinding interventions and evaluate grinding effectiveness.6,14 For example, some properties have a grinding interval of 5 dB above the best condition for a track section. Kuffa et al. 6 reported that a novel two-part grinding strategy employing both roughing and finishing in a single pass effectively decreased noise by 2 to 6 dB relative to the initial state of the rail.
Reliable measurement and monitoring of rail corrugation underpin the development and specification of the relationship between corrugation and noise.14,15 To this end, three relevant standards have been developed: 1. EN15610 (2019): Railway applications – Acoustics – Rail and wheel measurement related to noise generation. 2. EN13231-3 (2020): Railway applications - Track - Acceptance of works - Part 2: Acceptance of reprofiling rails in plain line, switches, crossings and expansion devices. 3. ENISO3095 (2013): Acoustics – Railway applications – Measurement of noise emitted by rail bound vehicles.16–18
The quantification of a relationship between rail corrugation and noise has been limited by practical data collection challenges, as described in the following points: • Rail corrugation data collection relies on the use of manually operated trolleys or accelerometers affixed to the train.
8
Manual data collection is limited in many ways. On-board measurement of corrugation offers a much more robust data set (in space and time). However, it is not devoid of challenges, among them being the need to isolate those accelerations caused by corrugation.
19
• Rail noise can be measured on-board or wayside as well. Wayside measurements record noise with respect to time from a fixed location. One shortcoming is that the recorded noise only pertains to a short portion of track. On-board noise measurement records noise relative to time and distance. Like on-board corrugation data collection, this approach provides a more robust data set but is subject to several properties of the train and track. In both approaches, challenges arise when attempting to isolate noise generated from rail corrugation within a variable ambient noise.
20
Given the foregoing realities, it is evident that conflating (i.e., pairing) rail corrugation and noise data requires a reliable way to align that data spatially and temporally. This challenge has inhibited a more robust quantification of the corrugation-noise relationship.
This paper confronts the challenge by proposing a novel rail corrugation index and relating this index to wayside noise generated at selected locations within a North American rail transit property. Specifically, the paper pursues three research questions: • How can manually collected rail roughness data be summarized into an index that meaningfully characterizes the rail corrugation phenomenon? • What is the nature of the relationship between rail corrugation and noise measured at a wayside location? • How can this relationship be used to assist rail asset managers in the assessment of grind effectiveness, prediction of rail corrugation growth, and prediction of when rail should next be ground?
The next section of this paper summarizes previous efforts to develop a rail corrugation index and proposes a new index that builds on those efforts. Then, the paper applies and verifies the index as the foundation for understanding the relationship between rail corrugation and wayside noise using data collected at a North American rail transit property. Before concluding, the paper discusses issues relating to the generalizability of the corrugation-noise relationship and its potential use for managing rail assets.
A proposed rail corrugation index
Previous work
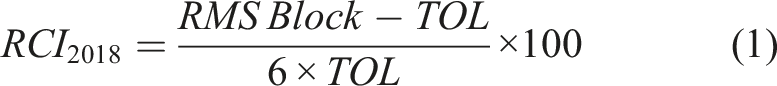
Scale for
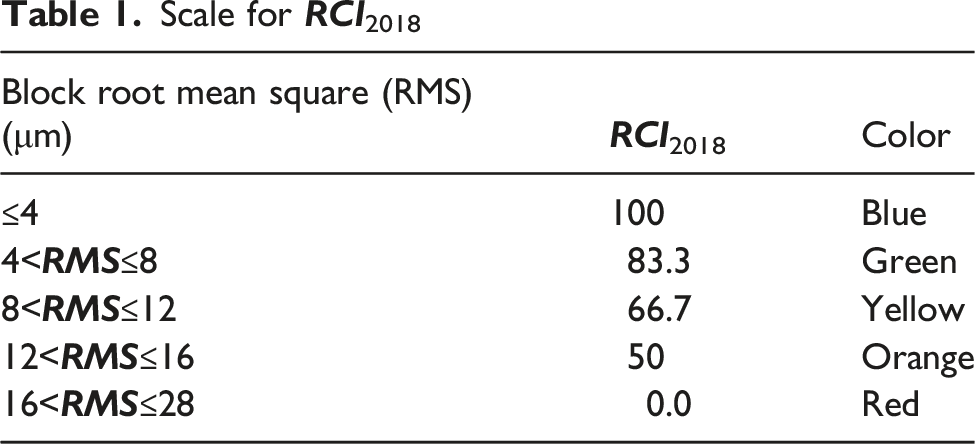
There is a known practical application of a rail corrugation index, though its definition differs from the proposed RCI2018. That index, established by Advanced Rail Management (ARM) as a segment-based corrugation quality index (CQI), is defined as the 95th percentile value of the 5m block RMS value (using the 30 to 100 mm band) within a specified track segment length (320 m in this case). This band captures short-pitch corrugation, but excludes corrugation characterized by longer wavelengths. This CQI is calculated as follows: 1. Divide a 320 m segment of track into n 5m blocks (i.e., n=64 for this definition). 2. Calculate the RMS value of the corrugation measurement for each block. 3. Sort the 5 m block RMS values in the 320 m segment in ascending order. 4. Set N = n × 0.95 to determine the block number that represents the 95th percentile, rounding up to a whole number if necessary. 5. CQI is then the Nth element of the sorted array of block RMS values.
Like the proposed RCI2018, the CQI is based fundamentally on block RMS values. However, since the CQI is oriented towards practical grinding applications, it is expressed in terms of a segment length (usually 320 m) rather than at the block level. While characterizing rail corrugation at a more precise spatial scale (e.g., a 5 m block) may be helpful to understand causes of rail corrugation, the treatment of corrugation through grinding can only practically occur for a meaningful length of track.
A novel rail corrugation index for rail grinding effectiveness
This paper proposes a novel rail corrugation index that generalizes aspects of the CQI and extends the application of that index by considering its use to assess grind effectiveness. Moreover, given the posited relationship between rail corrugation and noise, a dimensionally consistent approach to assessing grind effectiveness based on noise is also proposed.
Formally, let RCI x denote the proposed rail corrugation index, where x is the user-specified percentile (e.g., 95th, 85th, or 65th) of the 5m block RMS values (for the 30 to 100 mm band) over a variable length of track. To assess grind effectiveness with respect to corrugation removal for a segment, the approach used here is to find the difference between the RCI x measurements before and after grinding and then compare this to the targeted or desired difference between the corrugation before grind and some tolerable level of corrugation post-grind. 22
Mathematically, let ∆
c
denote the difference in corrugation severity, according to equation (2):

For example, we could assume TOL
c
equals 4 μm as proposed earlier by Magel and Oldknow.
21
The effectiveness of grinding with respect to corrugation removal, ϵ
c
, may be expressed as a ratio as in equation (4):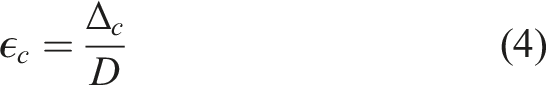
such that both ∆ c and D are positive numbers. Considering the extreme cases, when ϵ c equals zero, no corrugation has been removed by grinding, and when ϵ c equals or exceeds unity, the grinding target has been fully achieved. A grinding effectiveness greater than unity suggests that excessive removal of material has occurred or that a downward adjustment to TOL c may be appropriate. This potentially opens the idea of penalizing grinding effectiveness if excessive rail material is removed, but that is beyond the scope of this study.
Analogously, for a dimensionally consistent measure of grinding effectiveness with respect to the reduction of noise caused by corrugation, ϵ
n
, we consider the difference in the A-weighted equivalent wayside noise levels recorded before and after grinding and express this difference relative to the desirable reduction of noise achieved post-grind. Equation (5) denotes this relationship: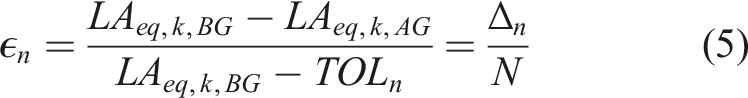
Application and verification of the rail corrugation index
This section applies and verifies the RCI x using data collected at a North American rail transit property and demonstrates its use to characterize the relationship between rail corrugation and wayside noise and to assess grinding effectiveness. In so doing, the analysis addresses the three research questions posed at the outset of the paper.
Source data
The analyses in this section used corrugation and wayside noise data collected at a contiguous 320 m test track section comprising a tangent segment and a right-hand curve (including spirals). On the curve segment, the left rail is the high rail and the right rail is the low rail. The direct fixation track is super-elevated through the curve. Trains typically travel at about 80 km/h at this section, based on the maximum normal operating and catchup up speed (experienced as a form of acceleration when leaving a switch) of 90 km/h. All data were collected between 2019-11-06 and 2021-05-21. This period encompassed two grind cycles (i.e., one grind occurred approximately mid-way through the period). A top-of-rail friction modifier was applied to the rail during the second cycle, which resulted in a period of reduced noise.
A manually operated corrugation analysis trolley (CAT) was used to collect raw corrugation data by measuring the vertical displacement of the rail surface one side at a time. The accompanying CAT software was used to apply wavelength band filtering and to calculate RMS, block RMS, and the one-third octave spectrum. Corrugation data collection occurred approximately every 2 weeks under normal circumstances (except during COVID-19 restrictions) during the data collection period. This enabled a unique time-series analysis, as will be presented in the next section.
Corrugation data were collected across different sensor locations (or channels) positioned laterally across the railhead (see Figure 1). Initial investigations indicated that the corrugation data collected at the 30 and 35 mm positions (from the gauge corner) appropriately reflected the corrugation conditions along the tangent segment. Thus, the analysis used data from the 35 mm sensor position. Although not the focus here, for the right-hand curve segment, the data collected at the 25 and 30 mm positions was appropriate based on engineering judgement. Sensor positions across the railhead.
The corrugation data were complemented by an acoustic data set obtained from two wayside locations in the same test section. This enabled a time-series pairing of corrugation and noise data at the test section through an 18-month period. The tangent segment was sampled 8 m from the guideway and the curve segment was sampled 13 m from the guideway. The microphone was at track height for both collection locations. Wayside noise data were collected for every train passage during a day (between 14 and 24 samples, depending on the day). The days on which noise data samples were collected corresponded approximately to the instances of corrugation data collection. For each train passage, the equivalent A-weighted and maximum noise levels, LA eq and LAF max , respectively, were reported. Thus, for a single day of data collection, a distribution of LA eq values was generated, which was represented by a mean or percentile value in the analysis.
Tangent rail corrugation and noise summaries from the data collection period*.
*MGT: million gross-tons; RCI x is expressed in μm; LAeq,95 is expressed in decibels (dB). Bolded font denotes pre- and post-grind data.
1 Pre-grind Measurement; 2 Post-grind Measurement.
Characterizing the relationship between rail corrugation and noise
The available data facilitates a quantitative characterization of the relationship between rail corrugation and wayside noise. Figure 2(a) illustrates the corrugation and noise relationship observed through two grind cycles for the left rail at the test track section. In general, Figure 2 shows steady growth in corrugation (in terms of RCI65, RCI85, and RCI95) through the 1st & 2nd cycles, and a corresponding growth in noise ( LAeq,mean, LAeq,65, LAeq,95) at different sensor positions and rail sides. Table 3 summarizes the respective correlations (Pearson’s correlation coefficient) of corrugation statistics with their noise counterparts. Quantitatively, for the left rail, the highest correlation coefficient between the corrugation and noise indices occurs for the RCI85, regardless of the noise index considered, though the strongest correlation occurs with LAeq,95 (0.881). The coefficients for RCI95 and RCI65 are systematically lower. For the right rail, RCI65 has the highest correlation coefficients, followed by RCI85 and RCI95. Corrugation and noise levels over time on the tangent section at different sensor positions. (a) Corrugation and noise levels over time (MGT) on the tangent section (left rail) at the 35 mm sensor position. (b) Corrugation and noise levels over time on the tangent section (left rail) at the 30 mm sensor position. (c) Corrugation and Noise levels over Time on the tangent section (right rail) at the 35 mm sensor position. Correlation summaries between noise and corrugation indices (at the 35 mm sensor position).
The corrugation on the right rail is generally higher than that on the left rail. One explanation is that the right rail is the low rail on which the outer face of the wheel flange rubs when negotiating the curve. While it is possible that initial and post-grind conditions contribute to the RCI/noise growth rate, we observe that the impact of top-of-rail friction modifier (TOR-FM) when applied to control friction results in slowing the rate of corrugation. Hence, in the absence of significant corrugation differential between both rails, the latter would be our first focus of inquiry.
These correlations are evident at other sensor positions (e.g., at the 30 mm position as in Figure 2(b)) and on the right rail of the same tangent section at the 35 mm sensor position (Figure 2(c)).
Unfortunately, we were unable to collect data immediately after grinding and approximately four MGT elapsed between the end of the first cycle and the collection of the first set of data for the second cycle. During that measurement gap, a top-of-rail friction modifier (TOR-FM) was applied at the test site to control the friction level at the wheel-rail interface and control stick/slip behaviors to reduce wear and slow the growth of corrugation. Its effectiveness is seen clearly in the lower growth rates of corrugation and noise when comparing the second cycle to the first (dry rail) cycle. The application also resulted in a more pronounced reduction in noise than in corrugation.
Characterizing Grind Effectiveness
Grind effectiveness calculations for tangent section*.
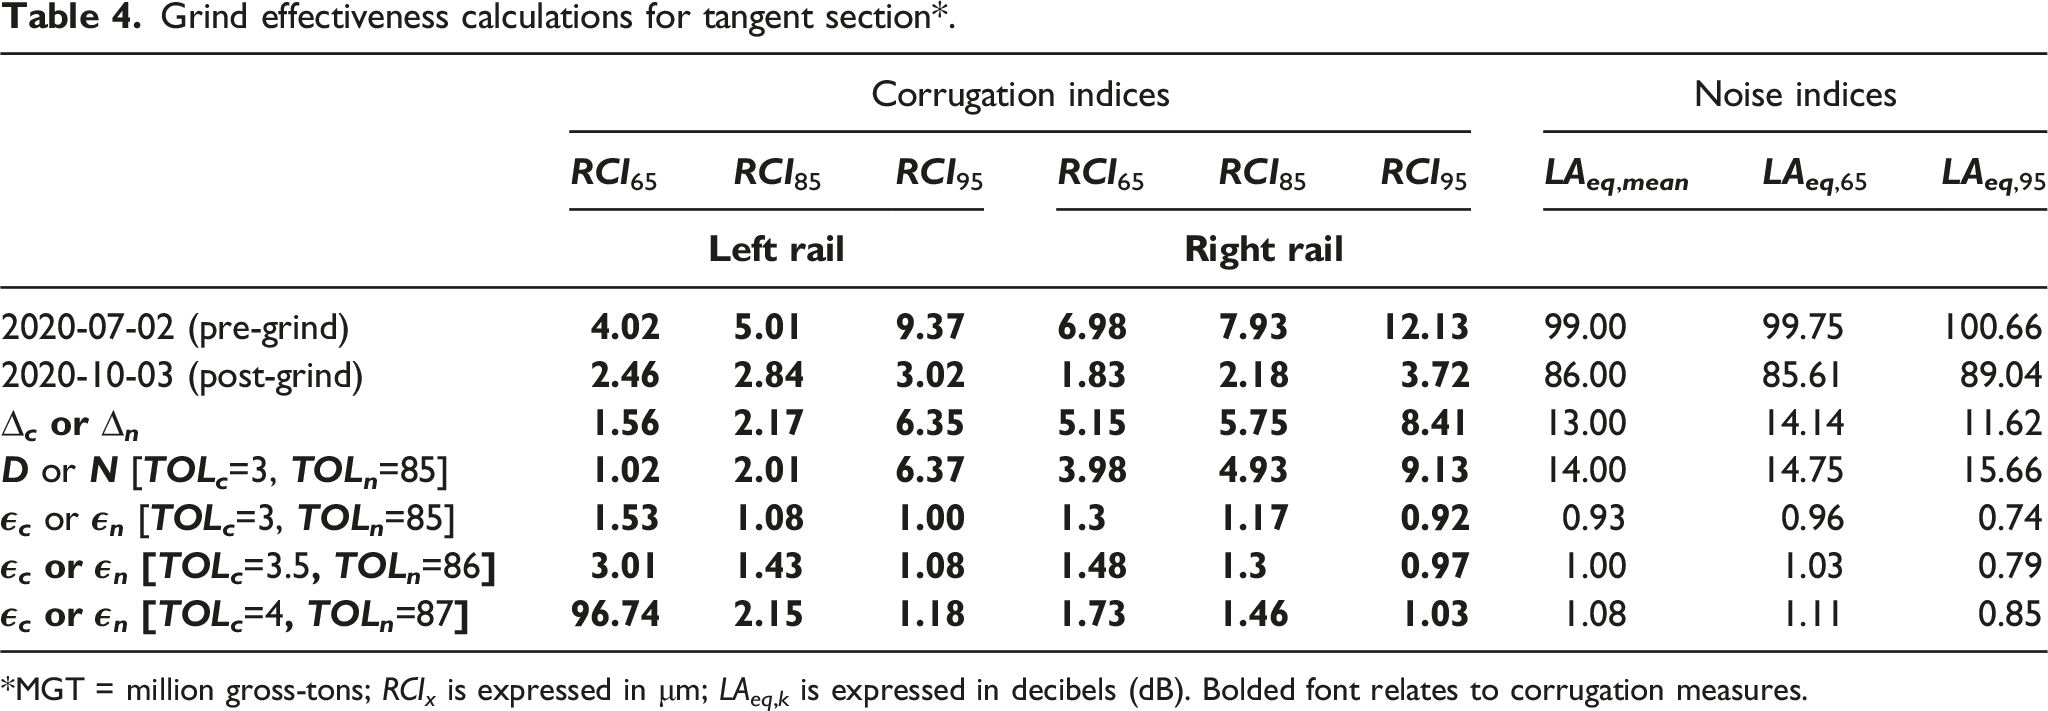
*MGT = million gross-tons; RCI x is expressed in μm; LAeq,k is expressed in decibels (dB). Bolded font relates to corrugation measures.
From Table 4, it can be observed that the grind effectiveness revolves around unity (RCI x ranges between 0.92 and 1.53 and LAeq,k ranges between 0.74 and 0.96) at the lowest tolerance levels (i.e., TOL c = 3 μm and TOL n = 85 dB, respectively). Generally, the grind effectiveness declines as the percentile statistic increases. This is always true for RCI x and evident between LAeq,65 and LAeq,95. Notably, the grind effectiveness determined using LAeq,mean consistently exceeds the effectiveness for LAeq,95, suggesting an outlier effect. Moreover, as the tolerance levels are increased by 0.5 and 1 respectively, the values of ϵ c and ϵ n increase, as expected. This arises because of the nature of the mathematical relationships in Equations [2] to [5] and, more practically, because higher tolerance levels are more easily achieved through grinding interventions. Interestingly, the highest tolerance levels resulted in an outlier result for ϵ c of 96.74 for RCI65 on the left rail. Upon investigation, it became obvious that there was an approximate equivalence between RCI65,BG and TOL c . That is, the corrugation level before grinding (4.02 μm) was approximately equal to the tolerance level (4 μm), which technically meant that grinding would have been unnecessary when considering this index.
While the grind effectiveness indices for corrugation and noise (ϵ
c
and ϵ
n
, respectively) vary with the tolerance values selected for RCI
x
and LAeq,k, respectively, it can be observed that several cases led to numerically close grind effectiveness values, as follows: • For the lowest tolerance levels (TOL
c
= 3 μm and TOL
n
= 85 dB), RCI85, RCI95, LAeq,mean, and LAeq,65 produce grind effectiveness values close to unity. • For the moderate tolerance levels (TOL
c
= 3.5 μm and TOL
n
= 86 dB), RCI95, LAeq,mean, and LAeq,65 produce grind effectiveness values close to unity. • For the highest tolerance levels (TOL
c
= 4 μm and TOL
n
= 87 dB), RCI95, LAeq,mean, LAeq,65, and LAeq,95 produce grind effectiveness slightly higher than those for moderate tolerance levels, but still close to unity.
Overall, the findings presented are intuitive and point to the reasonableness of the proposed indices. It is apparent that the selection of the limits could be affected by track type and property specific characteristics. The nuances of track structure, train speed, rail type, and track geometry make this task non-trivial and will be the subject of a forthcoming study. For practical purposes, it may be expedient to cap grind effectiveness at unity for both noise and corrugation, but for the purpose of this study it is important to highlight the implication of specifying tolerance limits or the range for grinding intervention outside which the excessive grinding can be numerically quantified.
Towards developing a predictive corrugation-noise relationship
This section explores the possibility of utilizing the corrugation-noise relationship in a predictive application, particularly in the case where it may be onerous to collect both corrugation and noise data. The goal is to determine when remedial action should be taken to prevent excessive noise or corrugation levels from occurring. Figure 3(a) shows the corrugation and noise growth curves evident on the left rail of the tangent section (35 mm sensor position) as a function of MGT for the first cycle, using RCI85 and LAeq,95 (i.e., the indices which had the highest correlation, as stated earlier). Figure 3(b) expresses noise levels as a function of corrugation with a strong correlation coefficient. For simplicity, these curves have been approximated by linear equations to avoid overfitting. Considering noise as the independent variable, the regression equation can be interpreted as showing a 1 dB noise increase for each accumulated MGT after 91 dB. Substituting out the abscissa (MGT) in both equations yields a direct relationship between corrugation and noise, as shown in equation (6). First cycle corrugation, noise levels and the MGT relationship on the tangent section (left rail) at the 35 mm sensor position. (a) First cycle corrugation and noise levels over MGT on the tangent section (left rail) at the 35 mm sensor position. (b) First cycle corrugation versus noise levels on the tangent section (left rail) at the 35 mm sensor position.

Similarly, the second cycle relationship between these variables can be expressed as shown in equation (7), although the corrugation and noise levels are relatively lower, a feature attributed to the application of TOR-FM during the second cycle.
To demonstrate the utility of the above relationships, equation (7) is used as a predictor of the noise level with the corrugation data on the second cycle of the right rail. Figure 4 shows the relevant observed data points (square) and predictions (round). The results reveal that, even with simple straight-line models, noise levels can be predicted with reasonable accuracy. The prediction error in this case ranges from +3.32 to −4.08 dB with an average error of +0.21 dB and a median error of +0.77 dB. Noise prediction using corrugation observations from the opposite rail.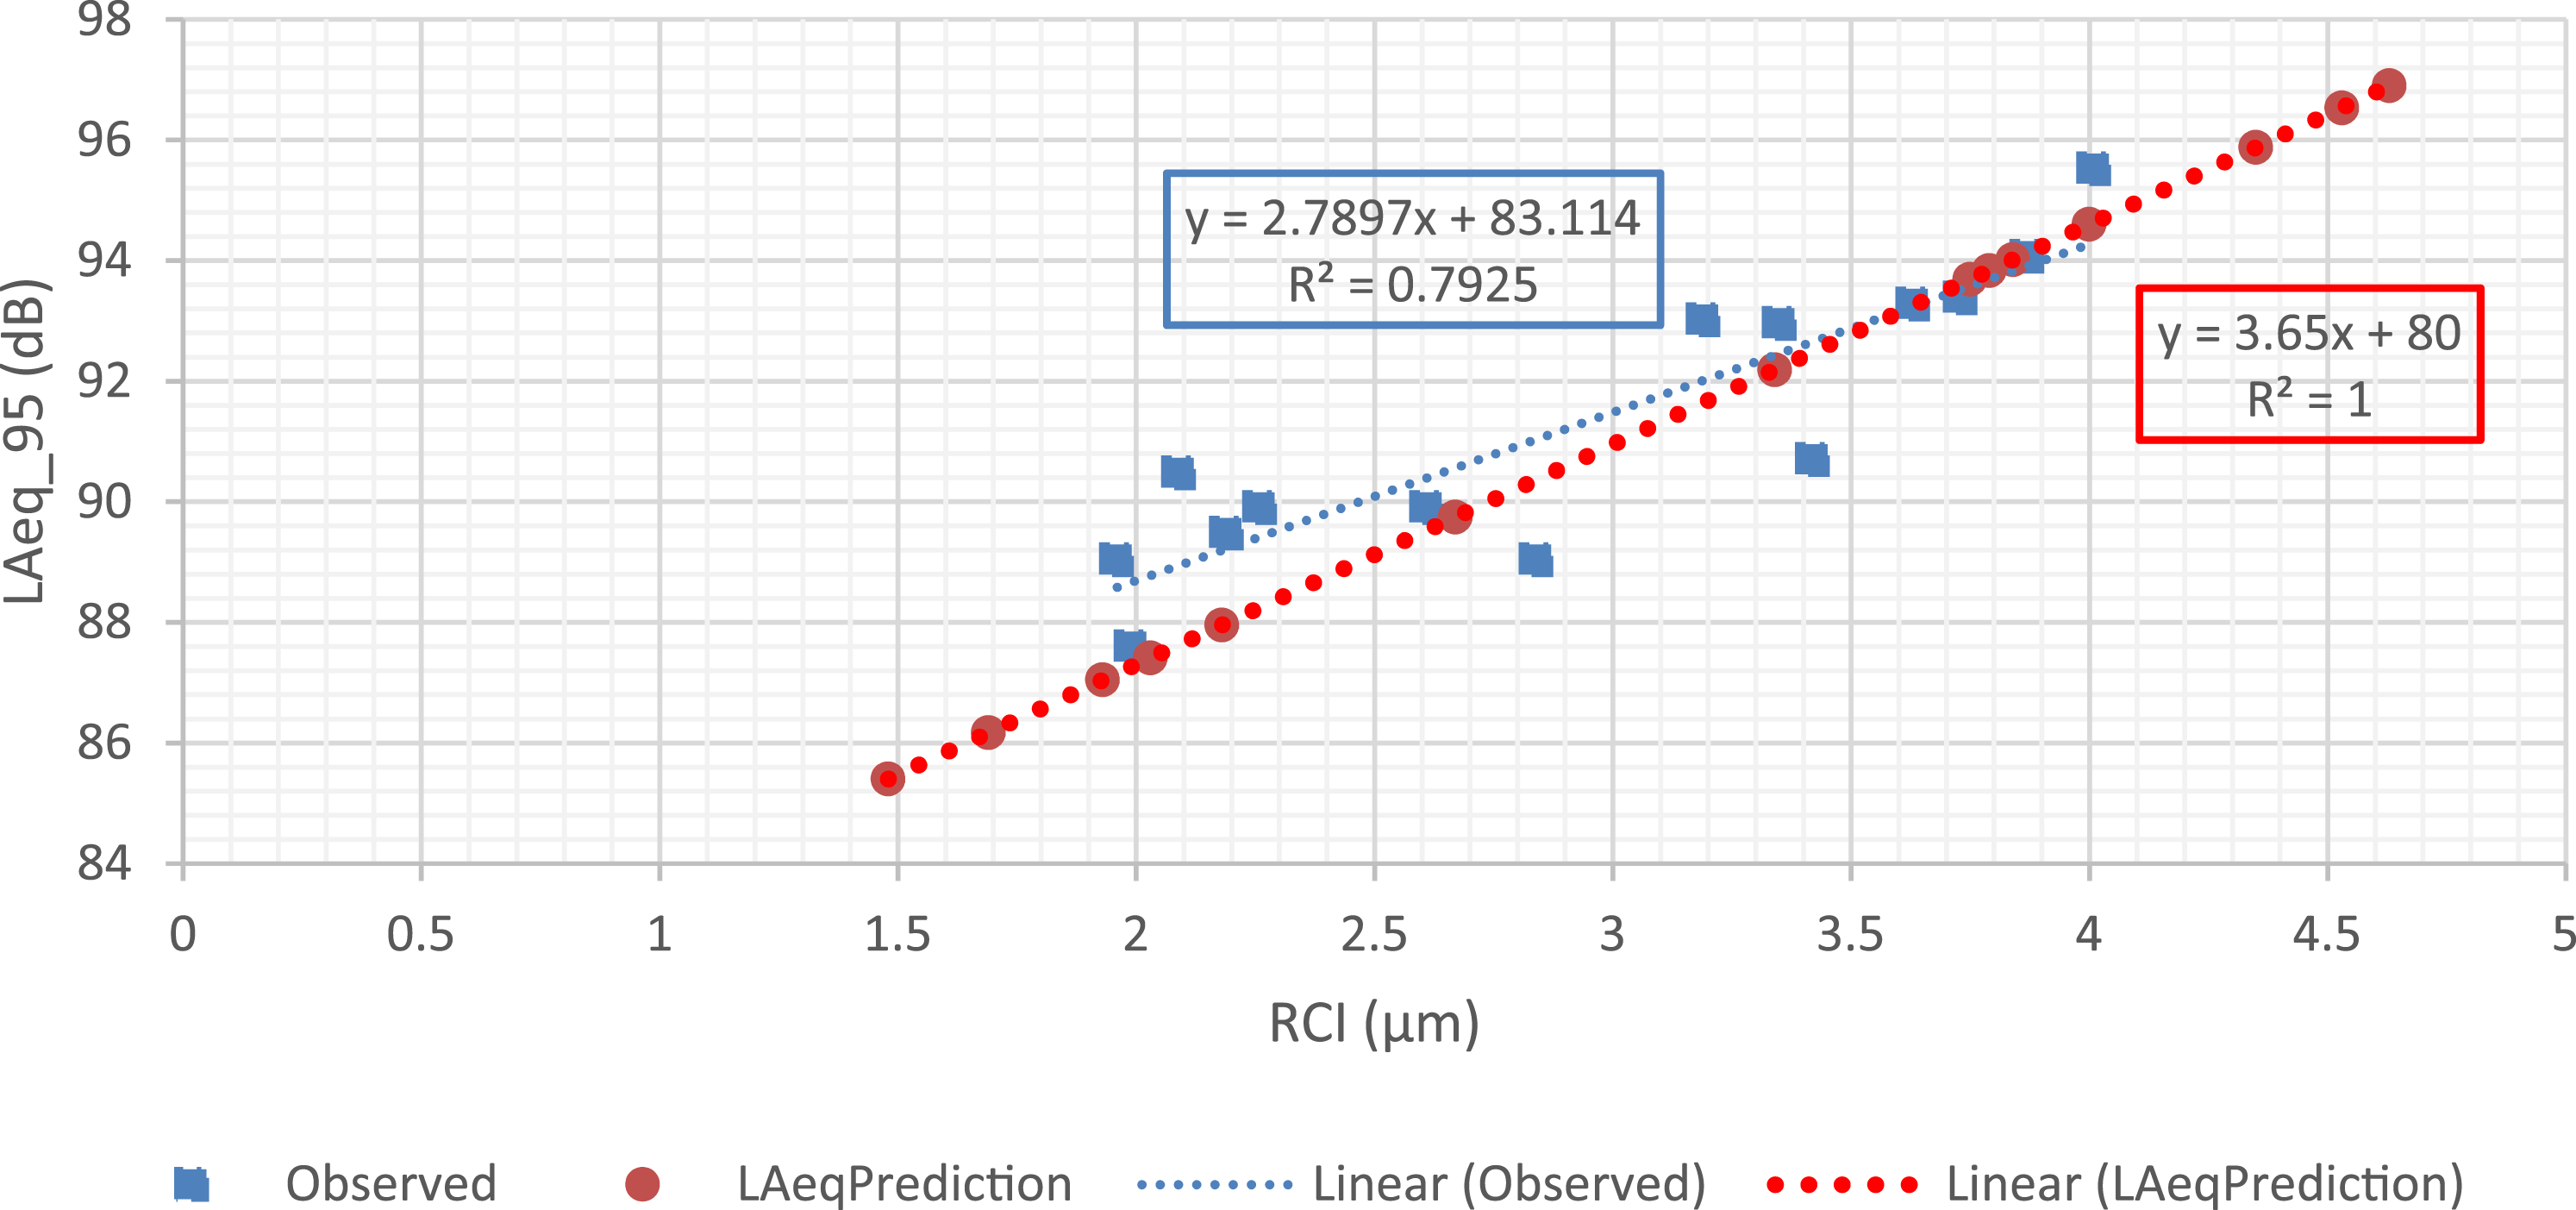
While the authors acknowledge the inherent possibility of autocorrelation since noise is generated from both rails, this exercise demonstrates the potential of isolating the corrugation from one rail (left or right) as a reliable predictor of noise in that track section. This offers significant potential to save costs due to track downtime that would be spent manually measuring corrugation levels on both rails in a tangent section. Moreover, if one recasts Equations [6] and [7] so that corrugation rather than noise is the independent variable, further cost savings could arise if a property could reliably predict corrugation levels by simply measuring noise. This would enable grinding interventions aimed at managing corrugation to be scheduled without requiring track downtime to measure corrugation.
Conclusion
This paper developed a novel rail corrugation index and verified its ability to characterize the relationship between rail corrugation and noise, to assess grind effectiveness, and to predict noise as a function of rail corrugation. The analyses utilized a unique time-series data set collected on a test track section at a North American rail transit property. The following key findings and contributions emerged through the course of this study: 1. The study encapsulated rail corrugation data into a percentile-based index—namely, RCI
x
—that reasonably represented the corrugation behavior on a tangent rail segment. Regardless of the percentile selected, RCI
x
increased as a function of MGT and returned to a low level after grinding. The rate of corrugation growth, as measured by RCI
x
, slowed under the application of a TOR-FM. Moreover, the RCI
x
correlated well with a time-series of wayside noise measurements collected during the same timeframe. 2. Given the observed relationships, the study showed that both the new RCI
x
and an analogous index based on wayside noise data could be used to assess grind effectiveness for removing corrugation,
23
if tolerance levels could be selected to appropriately reflect track operating conditions. 3. The apparent relationship between corrugation and noise also justified casting of corrugation as a function of noise and vice versa. The analysis showed that noise can be predicted using the RCI85 calculated from only one rail (left or right) on a tangent section. This result suggests that it may be possible to predict corrugation using wayside noise observations, thus limiting the need for track downtime required to measure corrugation. Future work would be needed to establish whether onboard noise measurements may also be considered as a predictor in the absence of wayside readings.
Due to the nature of this work, we acknowledge the following limitations: 1. The grind effectiveness concept considered in this study does not consider profiling that removes additional material to reduce the rail surface hardness differential between peaks and valleys on the rail.
24
Such additional material removal could delay the return of rail corrugation and thus may not be considered over-grinding. 2. The results from this study are from a single property. Despite the relatively controlled track environment and repeated data collection pre- and post-grind, we acknowledge that using results from one location is insufficient to make generalizing statements. Nevertheless, the study helps to advance our knowledge of rail track noise and corrugation behavior in transit systems. 3. While assessing the relationship between corrugation and noise in this study, there is an underlying presumption that all other factors (such as wheel out-of-roundness, train characteristics, track geometry, and other wheel/rail irregularities) are controlled. As the data used in the study represent real-world track conditions, such control was not possible during the data collection phase and cannot be accounted for in the analysis.
To complement this study, future work will investigate a mathematical procedure to set the incremental basis for increasing the grind effectiveness ϵ c or ϵ n based on corrugation or noise levels, respectively, when choosing the tolerance limits. The authors will also explore the possibility of fitting corrugation curve growths with nonlinear models in the case of exponential corrugation growth observable in other rail track properties. Finally, corrugation and noise data matching offer the opportunity to propose physically verifiable maintenance thresholds and grind effectiveness checking mechanisms based on the effects of noise level exposure.
Footnotes
Acknowledgements
The authors are grateful to Advanced Rail Management (Canada) Inc. for providing the case study data.
Declaration of conflicting interests
The author(s) declared no potential conflicts of interest with respect to the research, authorship, and/or publication of this article.
Funding
The author(s) disclosed receipt of the following financial support for the research, authorship, and/or publication of this article: This research was financially supported by the National Research Council of Canada.