
Abstract
Within any railway network Switches and Crossings (S&C) are essential. They allow trains to change tracks, allowing different routes to be selected. Despite their necessity, they generally have a lower reliability than plain line track and are often subject to breakdowns due to the high number of interlinking electrical and mechanical components they contain. Due to their location such as station throats and major junctions, S&C breakdown is generally very disruptive to traffic causing significant delays. Ensuring that S&C units are maintained correctly and minimising their risk of failure, is therefore of critical importance to railway asset managers. This research uses maintenance and failure data to determine probability distributions for the degradation, failure, inspection and maintenance of nine critical components within S&C units. These distributions can then be used within an asset management framework to simulate the expected operational behaviour of an S&C unit under a given set of conditions, allowing more informed asset management decisions to be taken.
Introduction
Railway infrastructure is key to the prosperity and success of countries and economies worldwide. Moreover, rail services must be reliable and punctual in order to attract both passenger and freight customers.1,2 Having reliable infrastructure is critical to this; it is the responsibility of railway infrastructure asset managers to ensure the infrastructure is maintained effectively in order to meet safety and performance targets whilst adhering to financial constraints, to satisfy both customers and stakeholders. This research focuses on the asset management of one aspect of the railway infrastructure; Switches and Crossings (S&C).
Switches and crossings are essential to the railway network and allow trains to switch between and cross over other tracks. 3 Despite their necessity S&C, generally have a lower reliability than plain line track and are responsible for a significant number of delays, with Network Rail reporting that points failures caused 481,719 delay minutes to passenger and freight services on the British railway network in 2019/20. 4 Deutsche Bahn reported that 19% of delay minutes on the German railway were caused by S&C failure in 2010. 5
This paper presents a reliability study of the key components within S&C units, determining probability distributions to model their degradation, failure, inspection and maintenance. These distributions can subsequently be used to populate an asset management framework such as that presented in the companion paper. 6 The outputs of asset management frameworks can then be used to assess how asset management decisions will impact Key Performance Indicators, such as punctuality, and life cycle cost, allowing more informed decision making.
There are many different types of S&C unit including turnout, scissor crossing and Fixed Diamond (FD) crossing. Their specific layout can be adjusted to meet the capacity and capability requirements of the network, as well as geographical constraints. They are made up of various electrical and mechanical components, and not all components are present in all designs, the nine most common components are: (i) Ballast (ii) Bearer (iii) Check and Wing Rail (iv) Crossing (v) Fastening (vi) Slide Chair (vii) Stretcher Bar (viii) Stock Rail (ix) Switch Rail
These components are illustrated in Figure 1 which shows a schematic of a turnout S&C. The ballast is the select crushed granular material placed as the top layer of the substructure in which the sleepers are embedded.
7
It is composed of medium to coarse gravel-sized aggregates typically (20–50 mm). The optimum thickness is 250–300 mm.
8
There are three main types of rail in an S&C unit: the stock rails which are fixed, the switch rails which move allowing the train to change track; and check and wing rails used to guide the train wheels and ensure the train stays on the correct track as it passes over the switch. There is a gap in the stock rail, to allow the train wheels to cross over the other track, this is known as the crossing. The crossing experiences very high impact forces9,10 and deteriorates significantly faster than most other S&C components. Turnout layout with key components.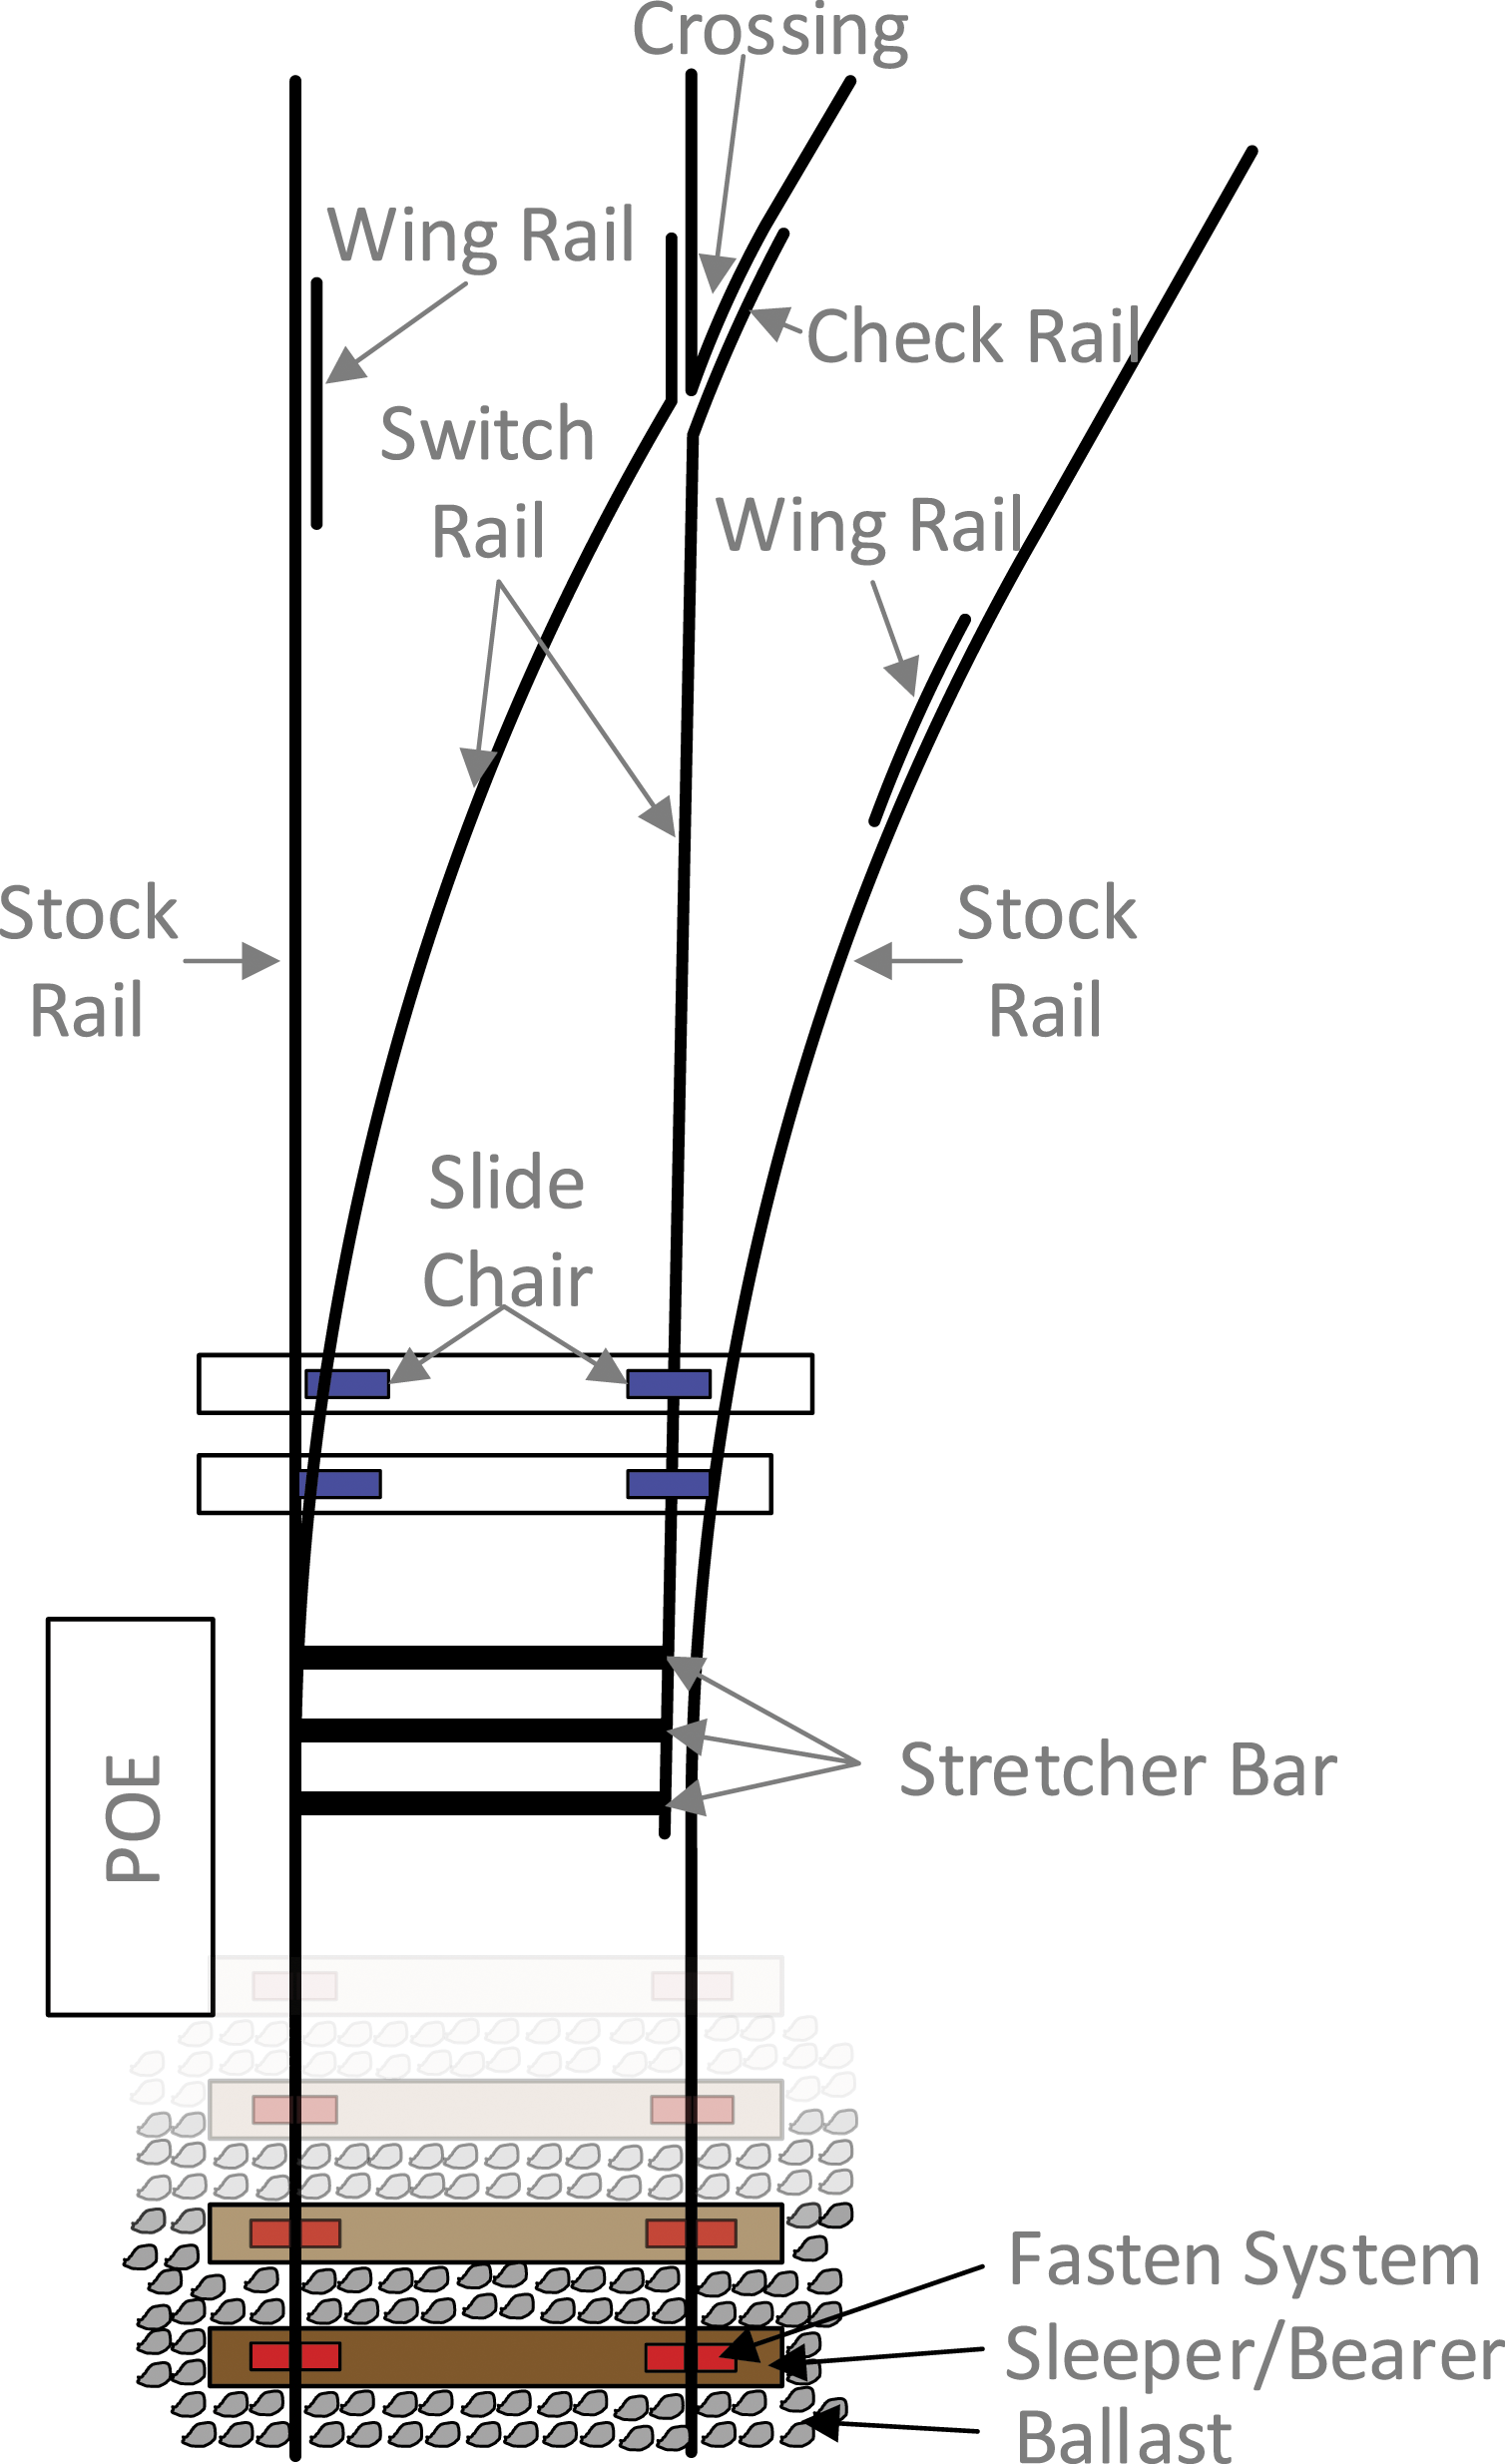
Stretcher bars are used to join the two switch rails together and ensure the gauge is maintained. They are safety critical and stretcher bar failure has led to catastrophic derailments in the past, such as that at Potters Bar (UK) in 2002. 11
Bearers are the special name given to sleepers used within an S&C unit. The bearers are typically spaced around every 0.6 m 12 and are normally longer than a standard sleeper. Bearers can be made of either wood or concrete. In the UK timber is widely used in S&C design as it is simple to shape and straightforward to attach fastenings to. As of 2017 around 70% of turnout switches in the UK were built on timber bearers. However, for high-speed design timber can often not provide the necessary support and therefore concrete bearers are used much more widely for high speed turnouts. 3 The bearers are embedded in the ballast and ensure that the rails are maintained at the correct alignment and gauge. Fastenings or clips are used to attach the stock rails to the bearers. A great variety of fastening systems exist, new types are regularly added, in order to keep up with changes in requirements or due to the availability of new materials. 8
As the switch rails move, they cannot be fixed with rigid clips, slide chairs are used instead as they allow the rails to move in the horizontal direction. The switch rails are moved using Point Operating Equipment (POE). The POE can be electric, hydraulic or pneumatic. 13 As the POE is an electrical component its failures were not recorded in the datasets analysed in this research. Subsequently, the POE is not considered in the remainder of this paper.
This paper presents a reliability study of the key components listed above; determining probability distributions to model their degradation, failure inspection and maintenance.
Reliability analysis
Reliability is the study of a component’s ability to perform as required; reliability analysis is used throughout engineering. One of the most widely accepted definitions of reliability is ‘the probability of a device performing its purpose adequately for the period of time intended under the operating conditions encountered’. 14
Closely linked to reliability is maintainability, which provides an assessment of how quickly a device can be returned to its operational state following failure.
Reliability and maintainability can be linked through the concept of availability which is defined as ‘the fraction of the total time that a component or system is able to perform its required function’.
15
Availability provides a combined view of how often a component or system fails and how quickly it can be repaired following failure. Availability can be expressed as
There are a number of processes that drive a component’s reliability and maintainability and its subsequent availability. These are: (i) Degradation (ii) Failure (iii) Inspection (iv) Maintenance
These processes are outlined in the diagram in Figure 2. Component life cycle.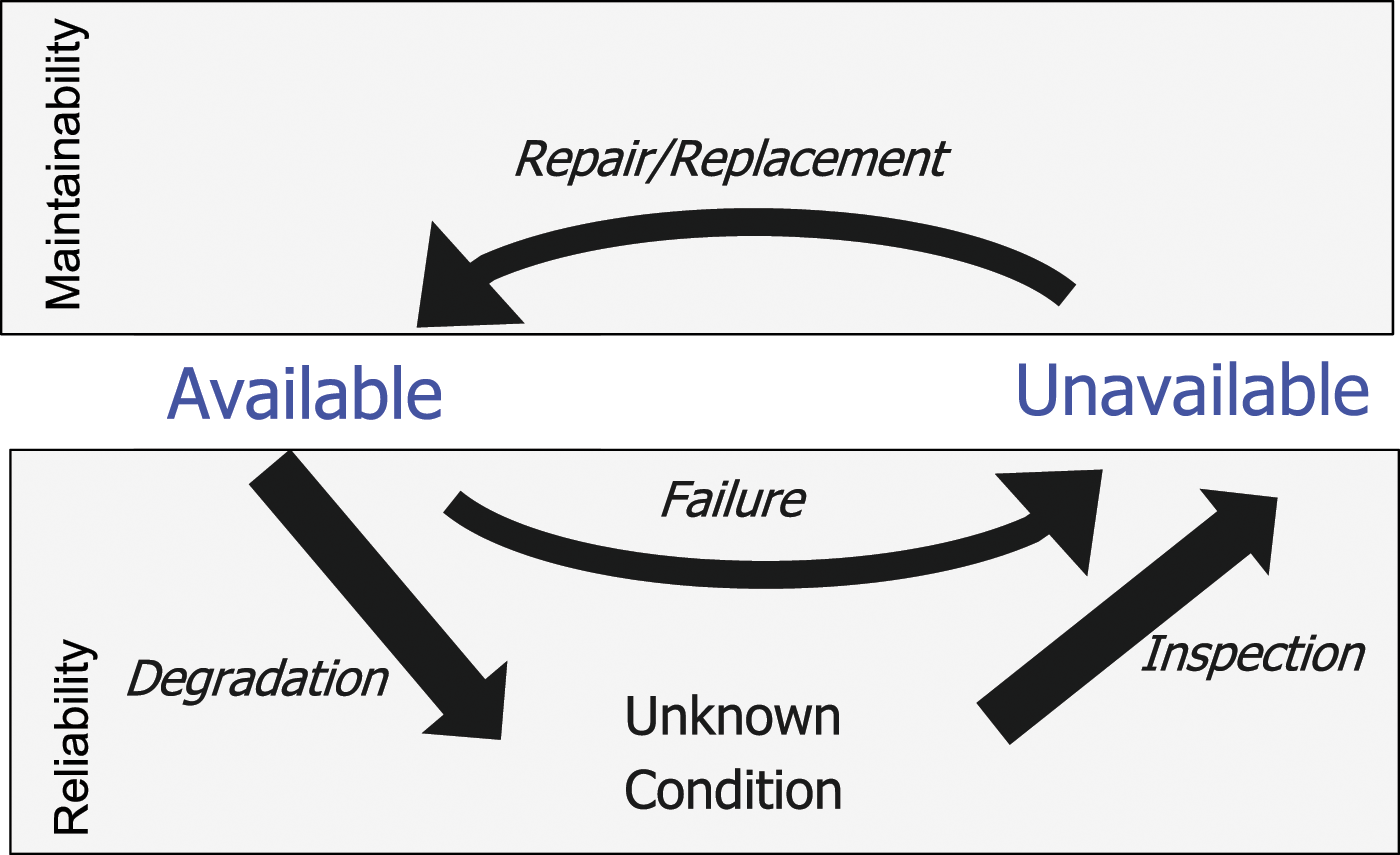
When managing an S&C one of the fundamental questions an asset manager will need to answer, in order to make good asset management decisions, is the proportion of the time the planned timetable cannot operate because the S&C is not performing as required. To predict the component availability a forecast for the four processes outlined in Figure 2 is required. This paper builds on the work presented by Rama and Andrews 13 by considering maintenance records in parallel with failure records, allowing deterioration and failure to be modelled. The paper also introduces a methodology to model the time between inspections and the time to complete maintenance activities.
The S&C unit will experience multiple failures and repairs throughout its life which will impact its availability. However, it is impossible to say with certainty when these events will occur; even under seemingly identical conditions the timing of these events will vary, therefore it will never be possible to say categorically whether the S&C will be available at a given time.
Handling events whose occurrence is non-deterministic is a problem commonly experienced in many branches of engineering and the branch of statistics used to overcome these difficulties is probability theory. 15 Probability theory expresses the probability (between 1 and 0) of different events occurring based on some known distribution. This allows inferences to be made about the true characteristics of the system, allowing numerical quantification of the likelihood of different scenarios, and identification of the most likely (and unlikely) scenarios.
Probability distributions
A vast range of different probability distributions exist, which can be used to model the likelihood of different events occurring. These are generally grouped into two types: (i) Continuous (ii) Discrete
Continuous distributions can take any value, whereas discrete distributions are limited to certain values (for example integers). Due to the diverse range of components within an S&C unit, both continuous and discrete distributions have their uses. For components where the exact time between repairs is known, continuous distributions are most useful. However, for other components, where the data collected does not identify the specific component that was repaired, it can be easier to model the number of repairs expected in a given period of time, making discrete distributions more appropriate.
Continuous probability distributions
When modelling reliability using a continuous probability distribution, it is common practise to explore a range of different continuous probability distributions and then select the most appropriate model (if any) using a ‘goodness of fit test’.
There are a range of techniques to fit continuous probability distributions to reliability data. These include the method of moments, 16 regression methods, 17 and maximum likelihood methods. 18
There is no exact rule on when which method is the most appropriate. Nonetheless, as the data sets in this study were large and generally contained a significant amount of right censored data, the maximum likelihood method is chosen. The likelihood function for right censored data is given by
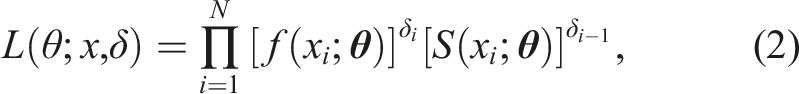
where f(t) is the distribution Probability Density Function (PDF), totally determined by the parameter vector
Within this study four of the most commonly occurring continuous probability distributions in engineering were tested for each data set. The distributions considered are: (i) Exponential (ii) Weibull (iii) Normal (iv) Log normal
Exponential distributions are denoted E(λ), where λ is the failure or repair rate. Weibull distributions are denoted W (α, β), where α is the shape parameter, such that 0 < α < 1 indicates a decreasing failure rate, α = 1 the distribution is equal to an exponential distribution and has constant failure rate, α > 1 indicates an increasing failure rate. β is the scale parameter and indicates the characteristic life. Normal distributions are denoted N (μ, σ2), where μ is the mean and σ2 is the variance. Finally, log normal distributions are denoted L (μ, σ2) where
Once each of these distributions was fitted to the data, a goodness of fit test was used to assess which (if any) was the best fit to the data. There are a range of goodness of fit tests that can be used to evaluate how well a given sample data set fits a given distribution. Some of the most common goodness of fit tests include chi-square, Kolmogorov-Smirnov and Anderson-Darling. 19
In this study Weibull++
20
is used for all distribution fitting. Weibull++ fits the data using the maximum likelihood method outlined in equation (2) and assesses the goodness of fit based on three measures: (i) AVGOF, from Kolmogorov-Smirnov method (ii) AVPLOT, from the correlation coefficient (iii) KV, from the likelihood value
Discrete probability distributions
For certain components it was not possible to identify exactly which component had failed and therefore it was more appropriate to model the number of failures expected in a given period of time, rather than trying to model specific component behaviour. Discrete probability distributions can be useful in this regard, one of the most widely used discrete probability distributions is the Poisson distribution:
Poisson distribution
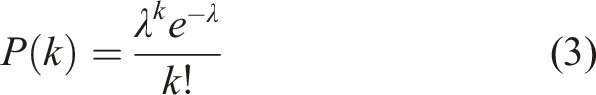
The Poisson distribution21,22 assumes that failures are independent, and the probability of failure is constant throughout time. The process is memoryless and the time of previous failures has no effect on the time of future failures. The probability mass function for the Poisson distribution contains a single parameter, λ, and is expressed using the following formula
The time between failures thought to follow a Poisson distribution, can be modelled using the continuous exponential distribution.
Non-homogenous poisson process
One of the limitations of using the Poisson distribution as described in equation (3) is that it assumes a constant failure rate. However, for some components in the S&C a constant failure or repair rate would not make sense. For example a repair might improve the condition but not return it to the new condition. Therefore, an increasing failure rate would be observed for this component.
To model this phenomenon the Non-Homogenous Poisson Process (NHPP) can be used; it assumes the rate of occurrence, u, is a function of time.
The NHPP can contain as many parameters as required to completely relate time to the rate of occurrence. A common two parameter function to relate the occurrence rate with time is

where a and b are positive constants. This choice was proposed by Crow 23 and is known as the Power Law NHPP or Power Law Process and has extensive applications in the study of repairable systems.24,25
S&C life cycle modelling
This section explores how real world S&C reliability and maintainability data, collected in the UK by Network Rail, can be used to determined distributions for the key processes in the component life cycle outlined in Figure 2.
Total amount of different switch types in the UK alongside the assumed number of components by switch type.
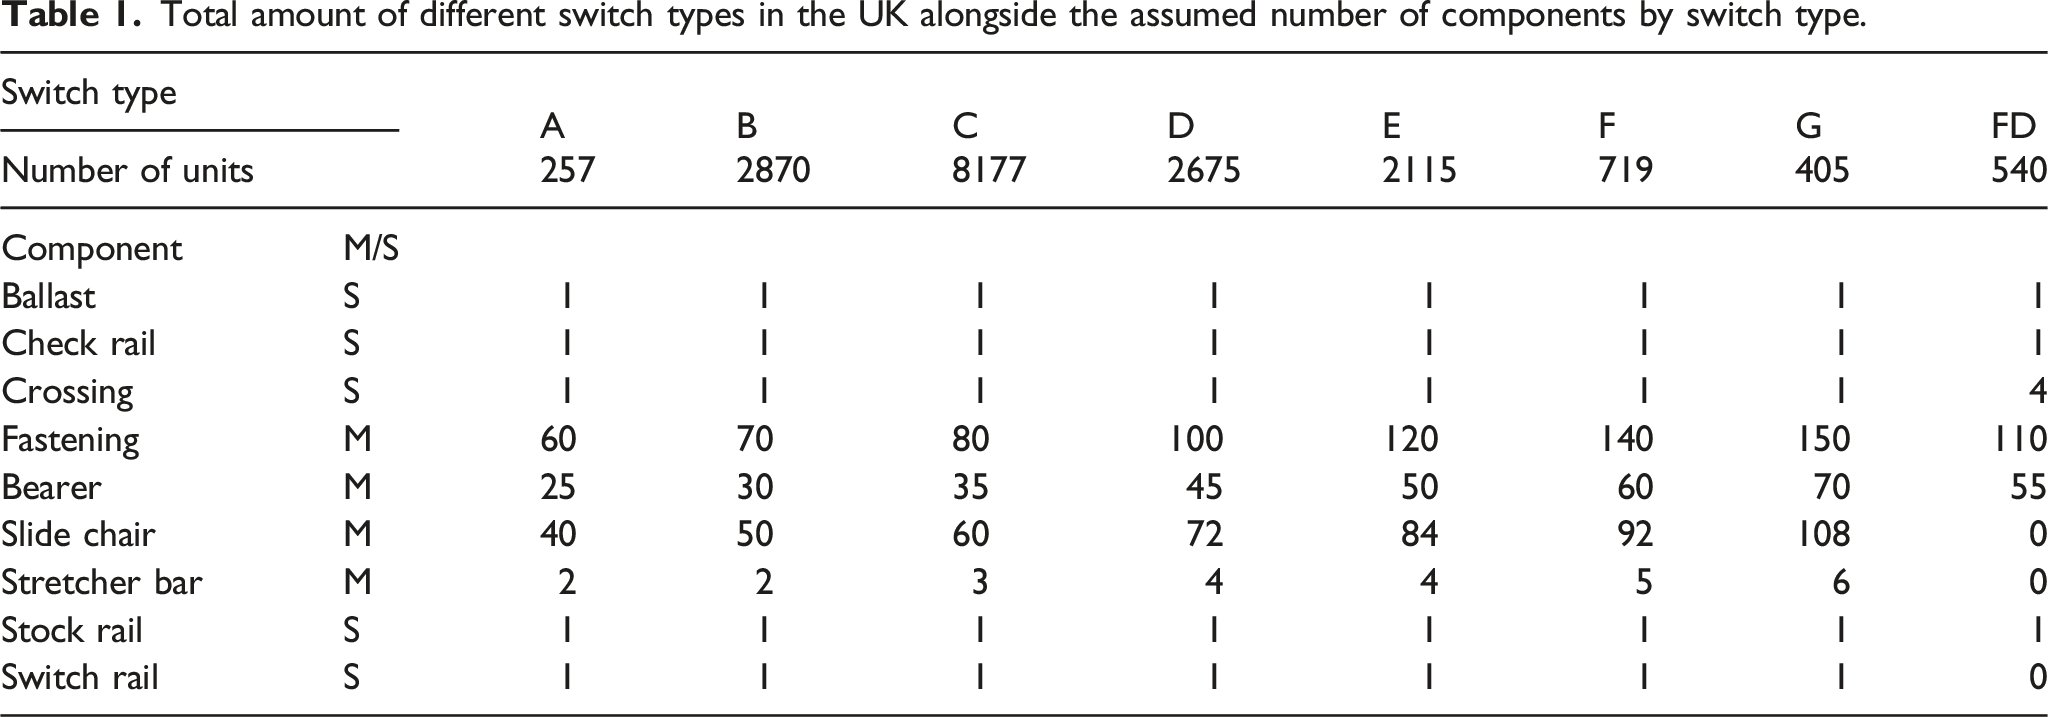
In an attempt to enhance the quality of outputs, it was decided to group together S&C with similar characteristics. The initial grouping was based on switch size. This approach groups switches with similar properties such as size, crossing angle and turnout radius. However, other factors such as rail weight, loading and number of operations may also influence the S&C behaviour. At the time of writing it was extremely difficult to align datasets containing traffic information such as tonnage and number of operations to the failure data, with the former significantly lacking in data. Therefore, these factors are not explicitly considered in this study. As future work the authors would like to explore how emerging techniques may allow these factors to be considered.
For the purpose of the analysis the components were split into two groups: (i) (ii)
The complete list of single and multiple occurring components is given in Table 1 alongside the assumed number of components by switch type.
Component degradation
For the key S&C components listed in Table 1, condition data is generally only available for ballast, the ballast is discussed separately at the end of the section. For the remaining components, in the absence of condition data, the degradation is estimated using maintenance records. A different approach is taken to model multiple occurrence components compared to single occurrence components due to differences in the data availability, the methodology used for each is outlined below:
Multiple occurrence components
For multiple occurrence components, the data is usually not granular enough to distinguish between individual components. Therefore, the deterioration must be estimated solely based on the total number of repairs; the total number of repairs is denoted N and was determined using records in Ellipse, Network Rail’s asset management system. In all cases it is assumed that components were repaired because they were degraded in some way.
As highlighted in the previous section, the Poisson distribution can provide a good approximation for the expected number of occurrences of an event in a given period of time when only the total number of occurrences in that period of time is known. Therefore, the Poisson distribution is considered suitable to approximate the expected number of replacements for multiple occurring S&C components in a given period of time. This approximation assumes that the replacement rate is constant.
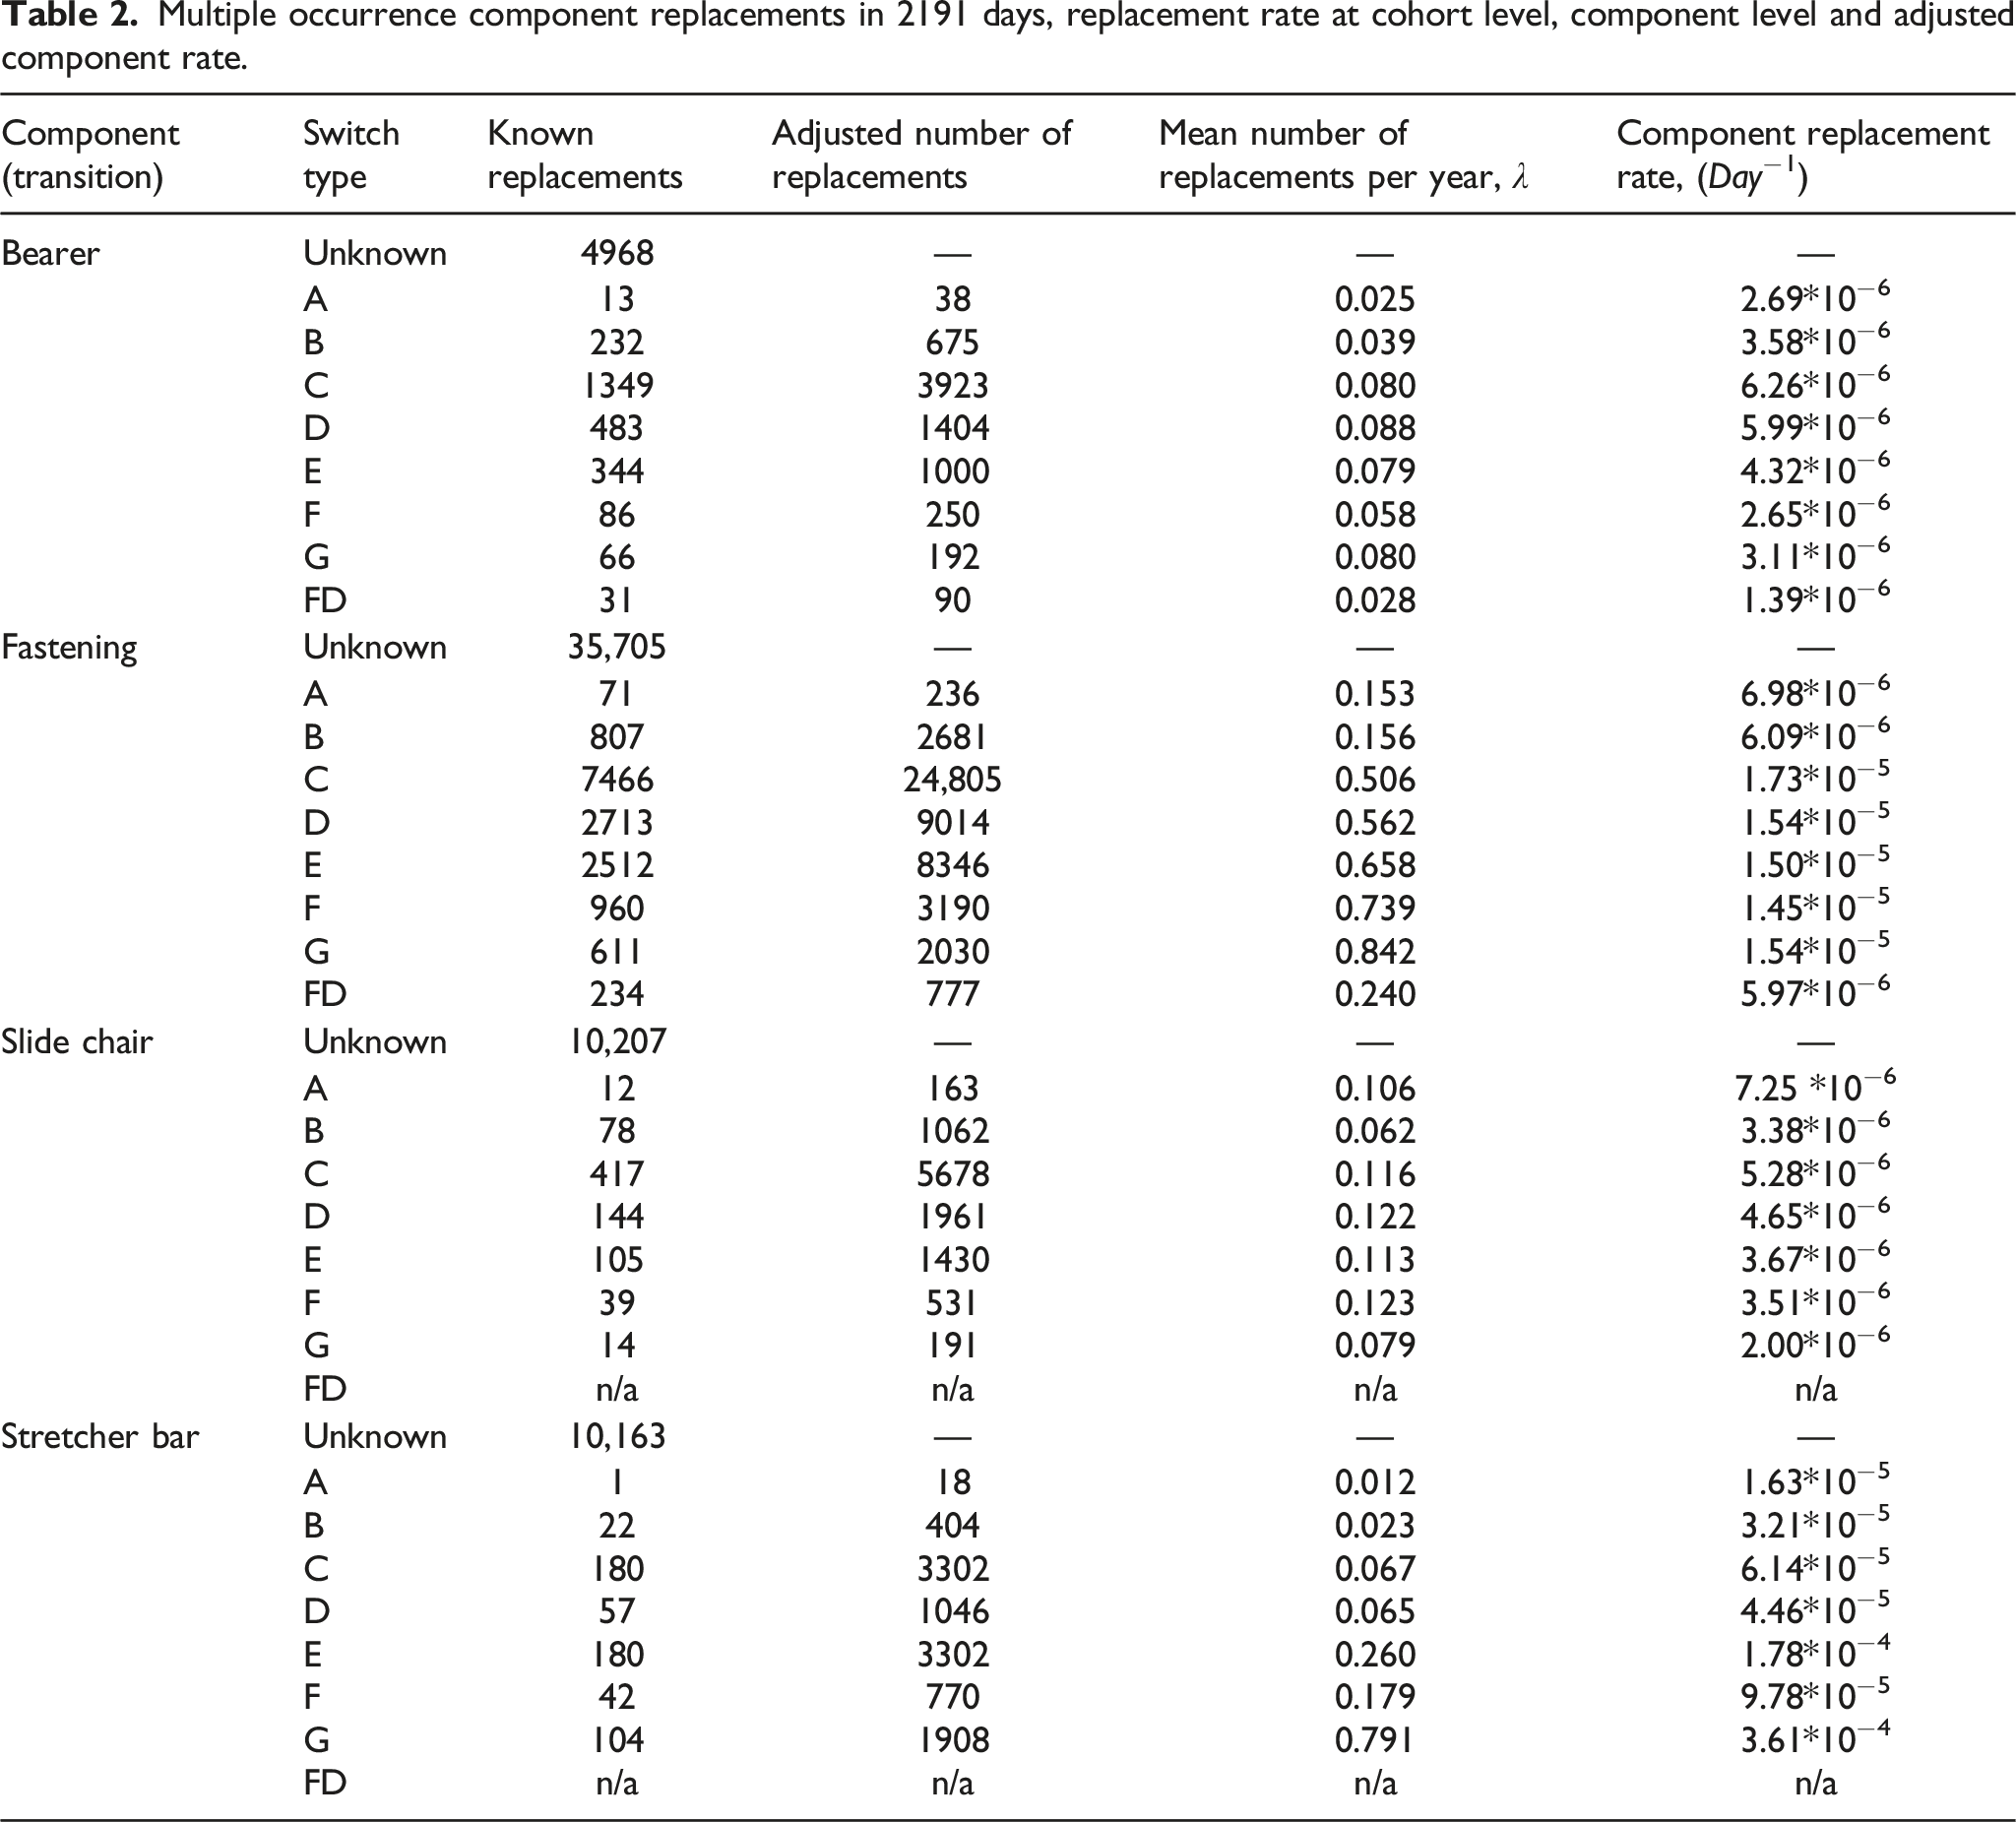
Maintenance data was used to determine a Poisson distribution to model the number of replacements for the four multiple occurring components; the analysis was divided by switch type to allow a separate Poisson distribution to be determined for each switch size. The λ parameter for the Poisson distribution was determined using the following steps: (i) (ii) (iii) (iv)
Multiple occurrence component replacements in 2191 days, replacement rate at cohort level, component level and adjusted component rate.
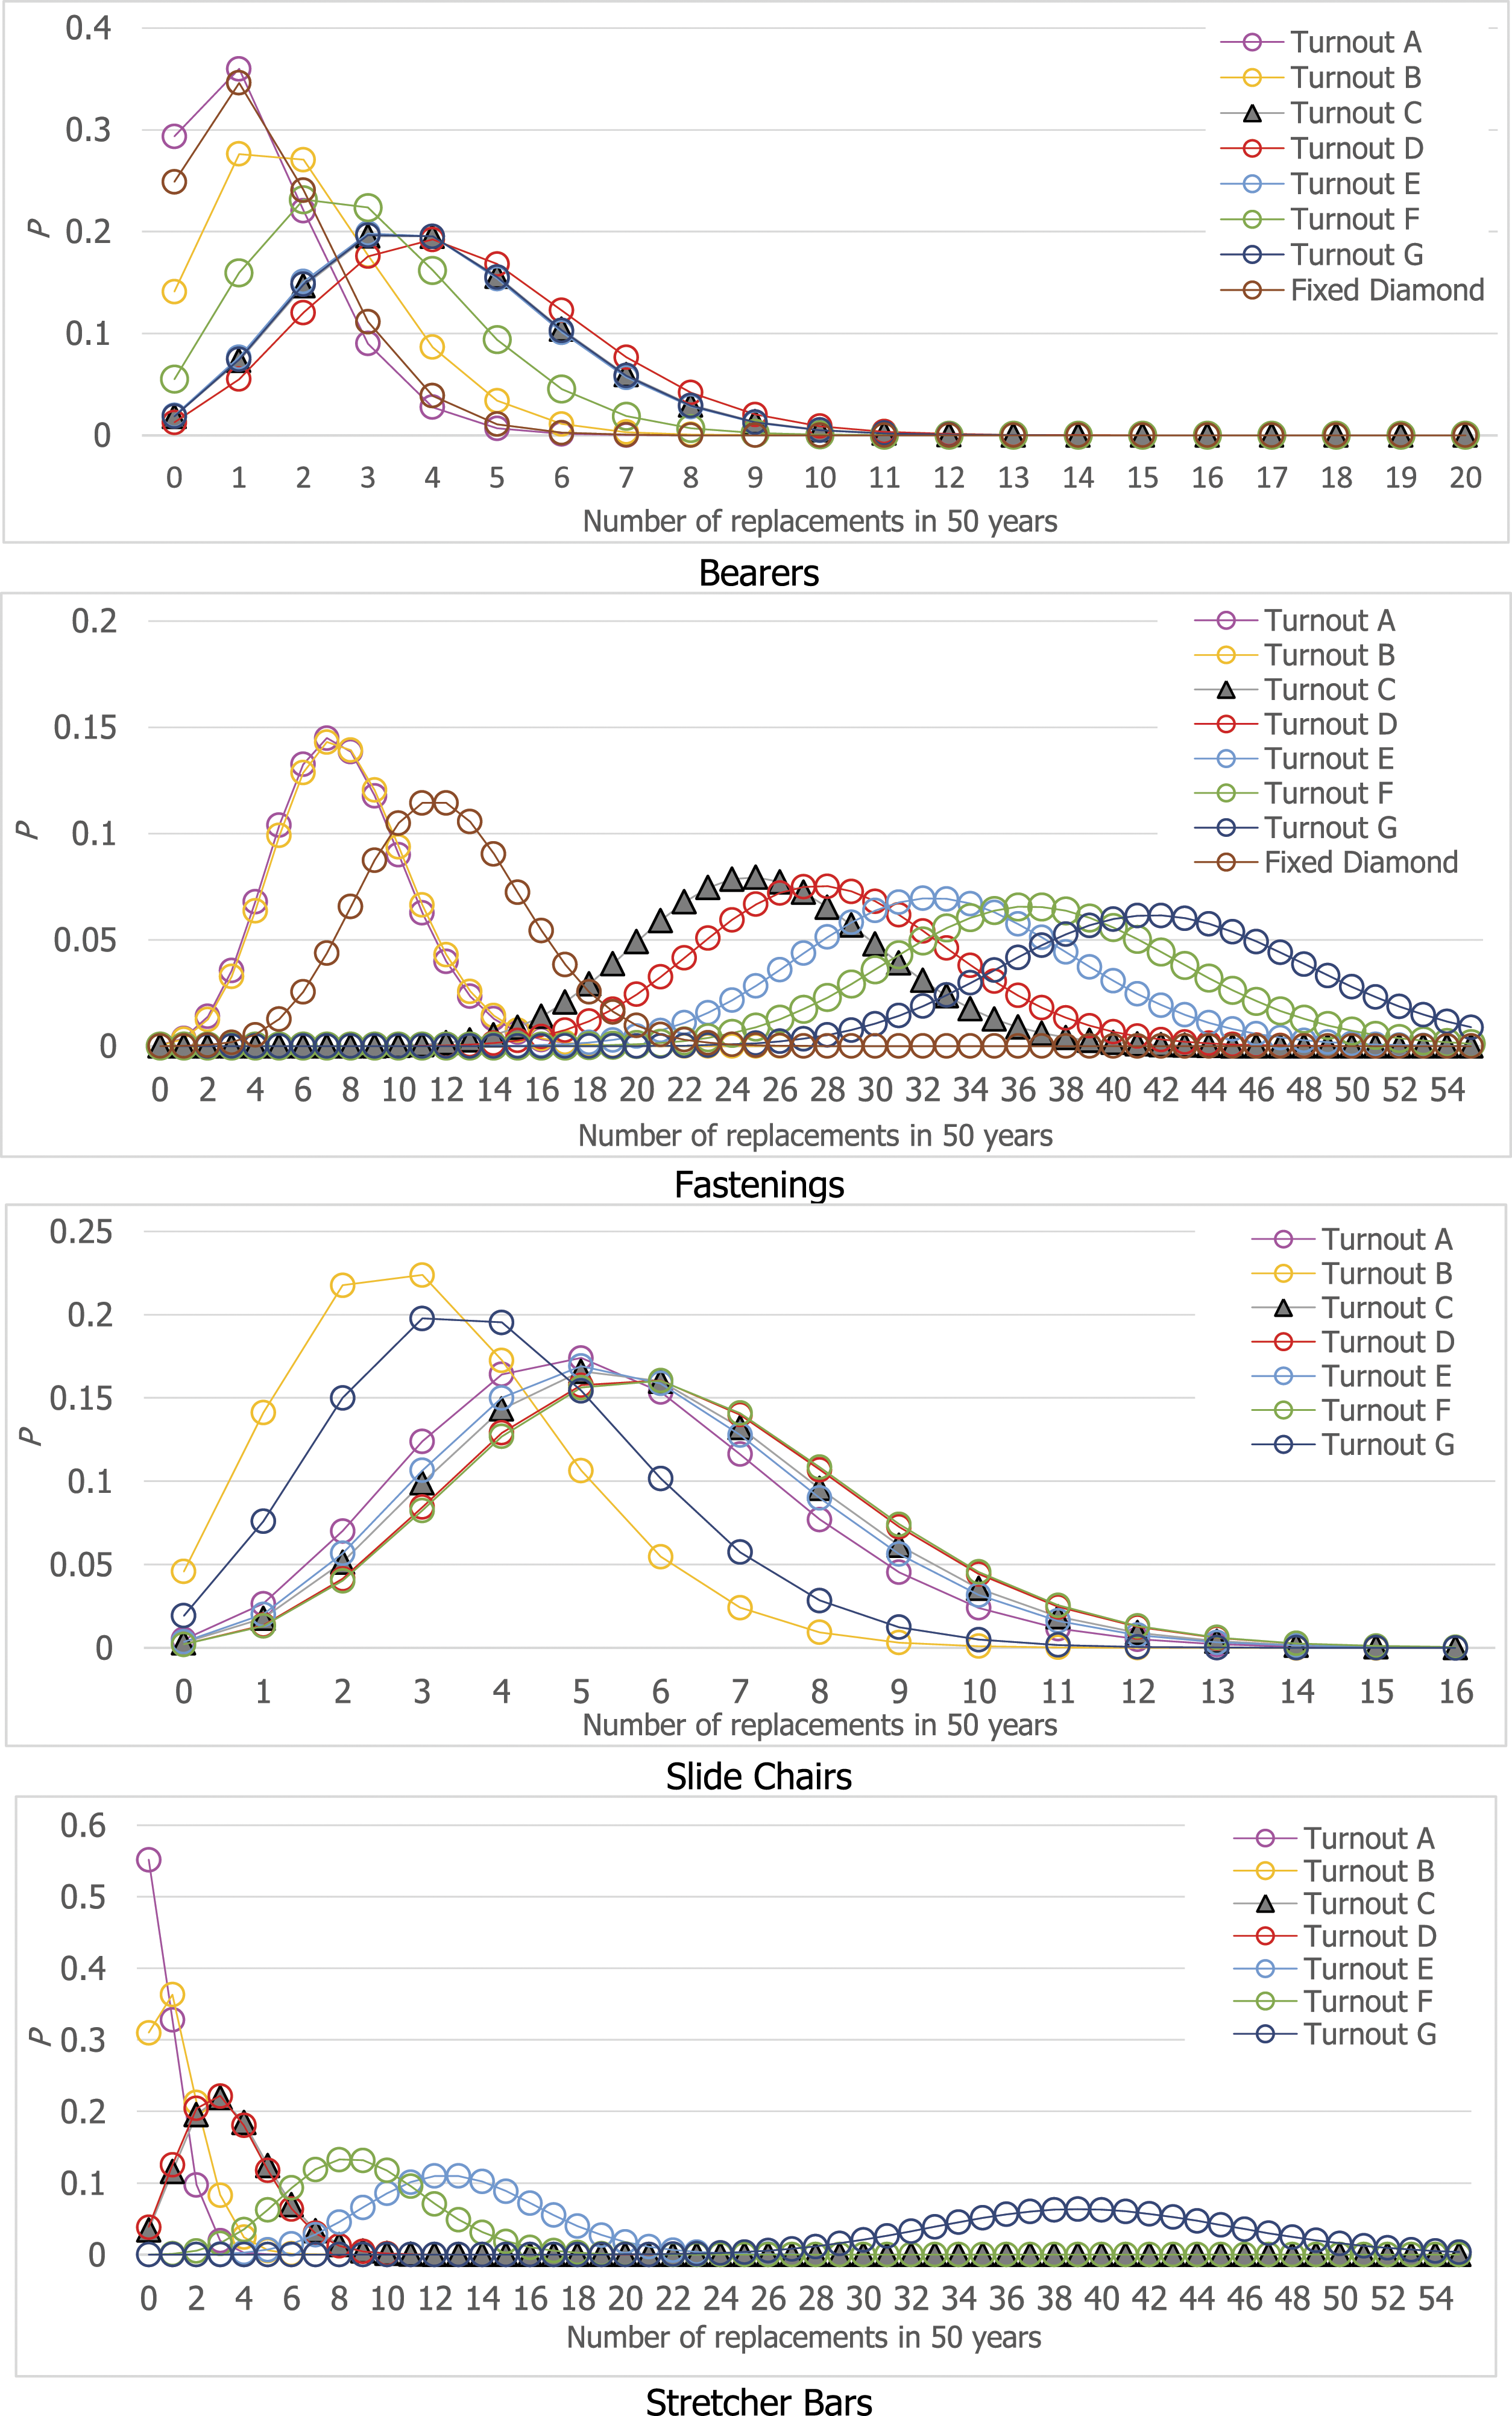
Poisson distribution for the number of component replacements by switch type.
Single occurrence components
For the stock rail, switch rail, crossing and check and wing rail, as there is just a single component, it is possible to assign maintenance records to the specific component and from this the time between interventions of specific components (component lifetime) can be calculated.
Based on the maintenance records it is possible to identify complete and right censored lifetimes for each component. Nonetheless, the observation period was relatively short in comparison to the average complete lifetime, therefore the majority of the data was right censored. Right censored data occurs when full lifetimes are not observed as the component remains functioning beyond the end of the observation period. Censored data is still advantageous, as it is known that the actual component lifetime was at least this long.
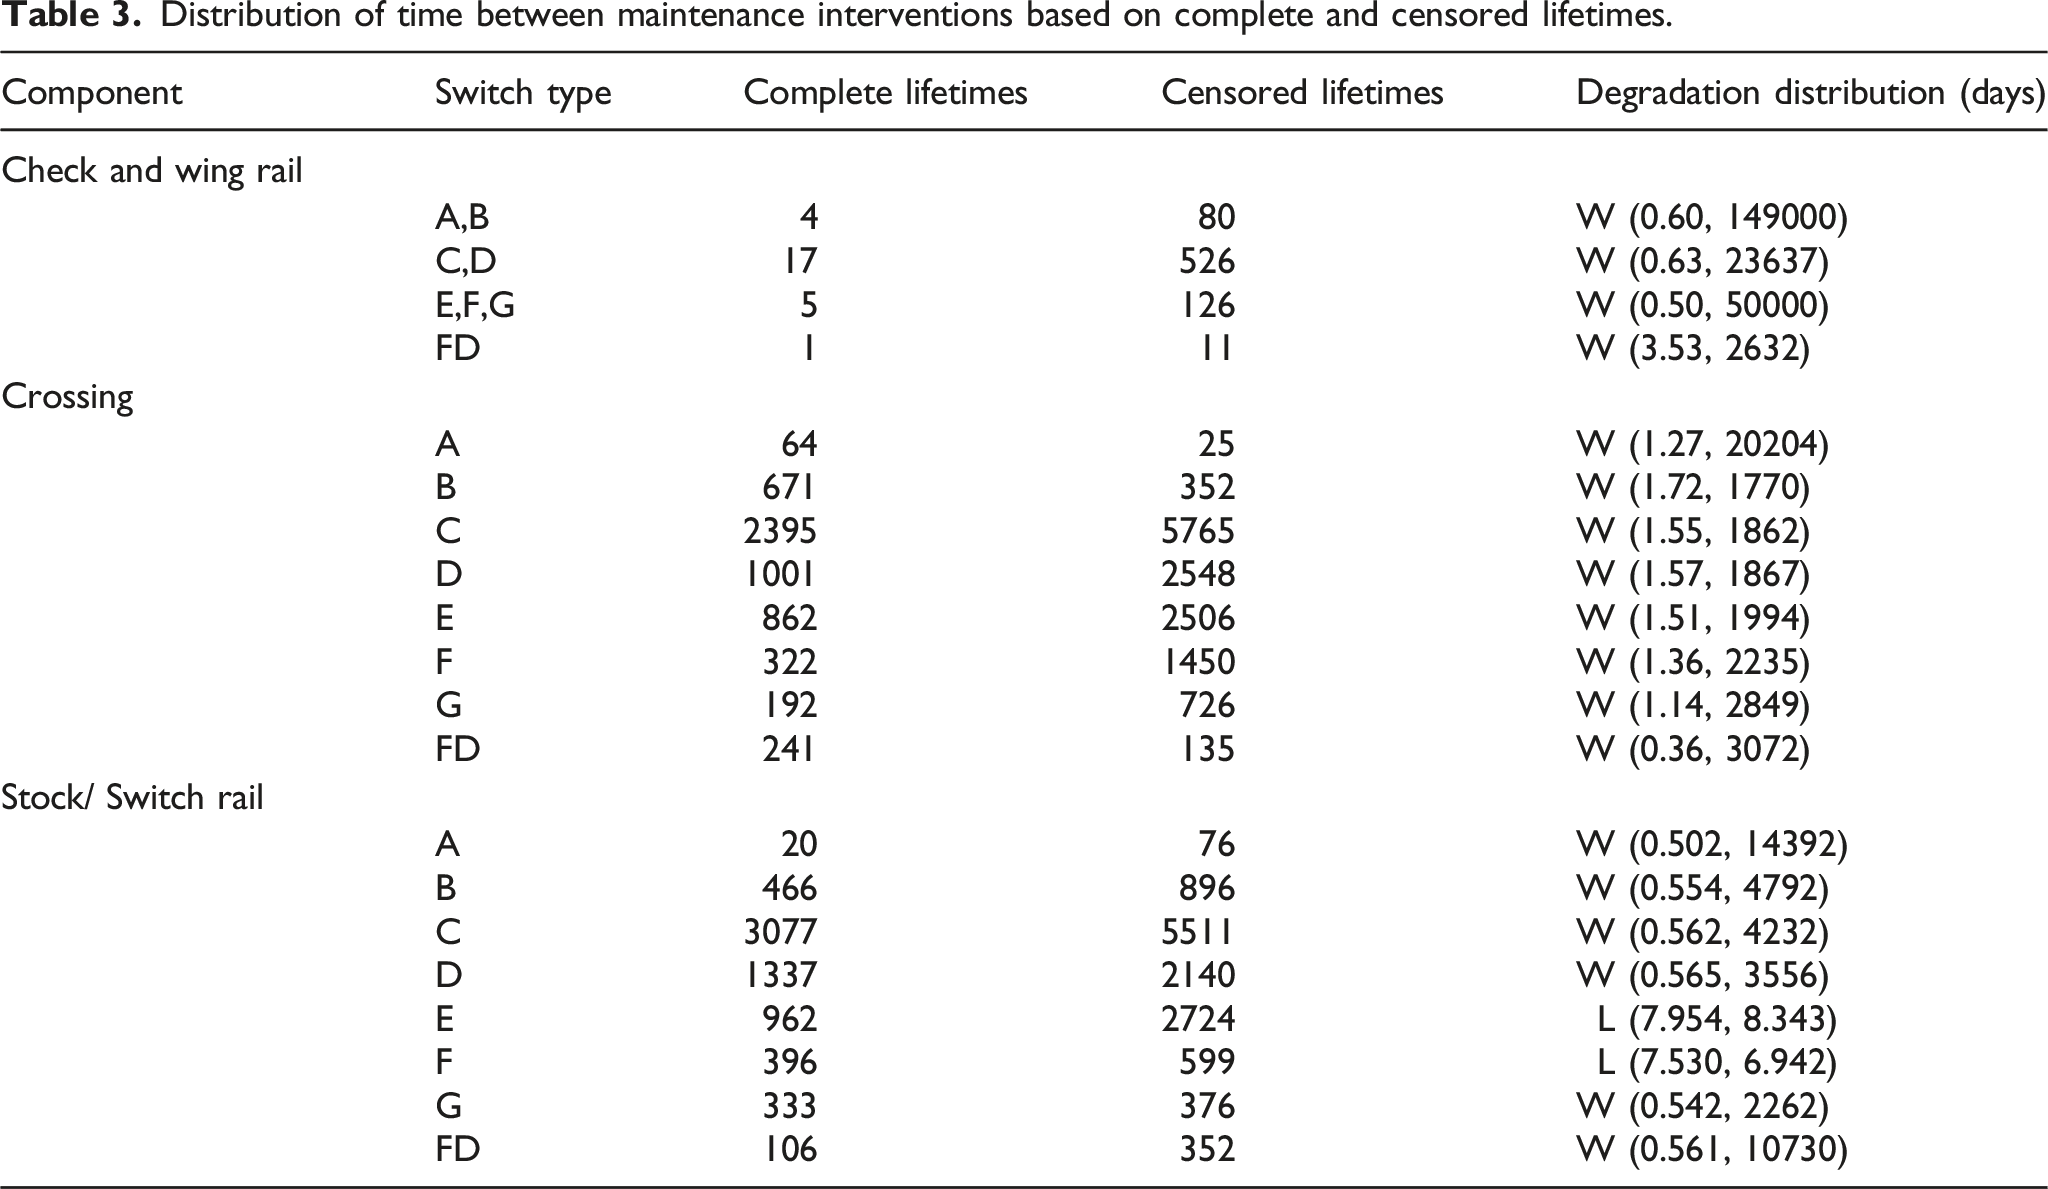
Based on the maintenance records, the distribution of time between interventions was calculated in the following way: (i) Use the switch ID to assign maintenance records to individual switches, (ii) Determine complete lifetimes based on the time between interventions, (iii) Determine censored lifetimes based on the time between the final observation and the end of the observation period and between the start of the observation period and the first intervention, (iv) Use the maximum likelihood function in equation (2) to fit the four distributions outlined to the lifetime data to determine continuous probability distributions to model the time between interventions, (v) Apply goodness of fit tests to determine which distribution is the most appropriate.
Distribution of time between maintenance interventions based on complete and censored lifetimes.
Ballast and track geometry
As aforementioned, the ballast’s main role is to support the sleepers and maintain the track alignment. There are a range of different ways to assess the ballast condition, one of the most common being a ballast fouling index.26,27 However, ballast maintenance decisions are usually governed by the track geometry, rather than the ballast condition itself. The track geometry is assessed using a number of measurements including: twist, vertical profile, horizontal alignment and gauge. 28 When modelling the track geometry it is common practice to discretise these continuous measurements into a number of discrete condition states and model the time to transition between them.29–31
In the UK, Network Rail assesses the track geometry as being in one of five quality bands based on the horizontal alignment, vertical alignment and line speed. These categories are Good, Satisfactory, Poor, Very Poor and Super Red. 2
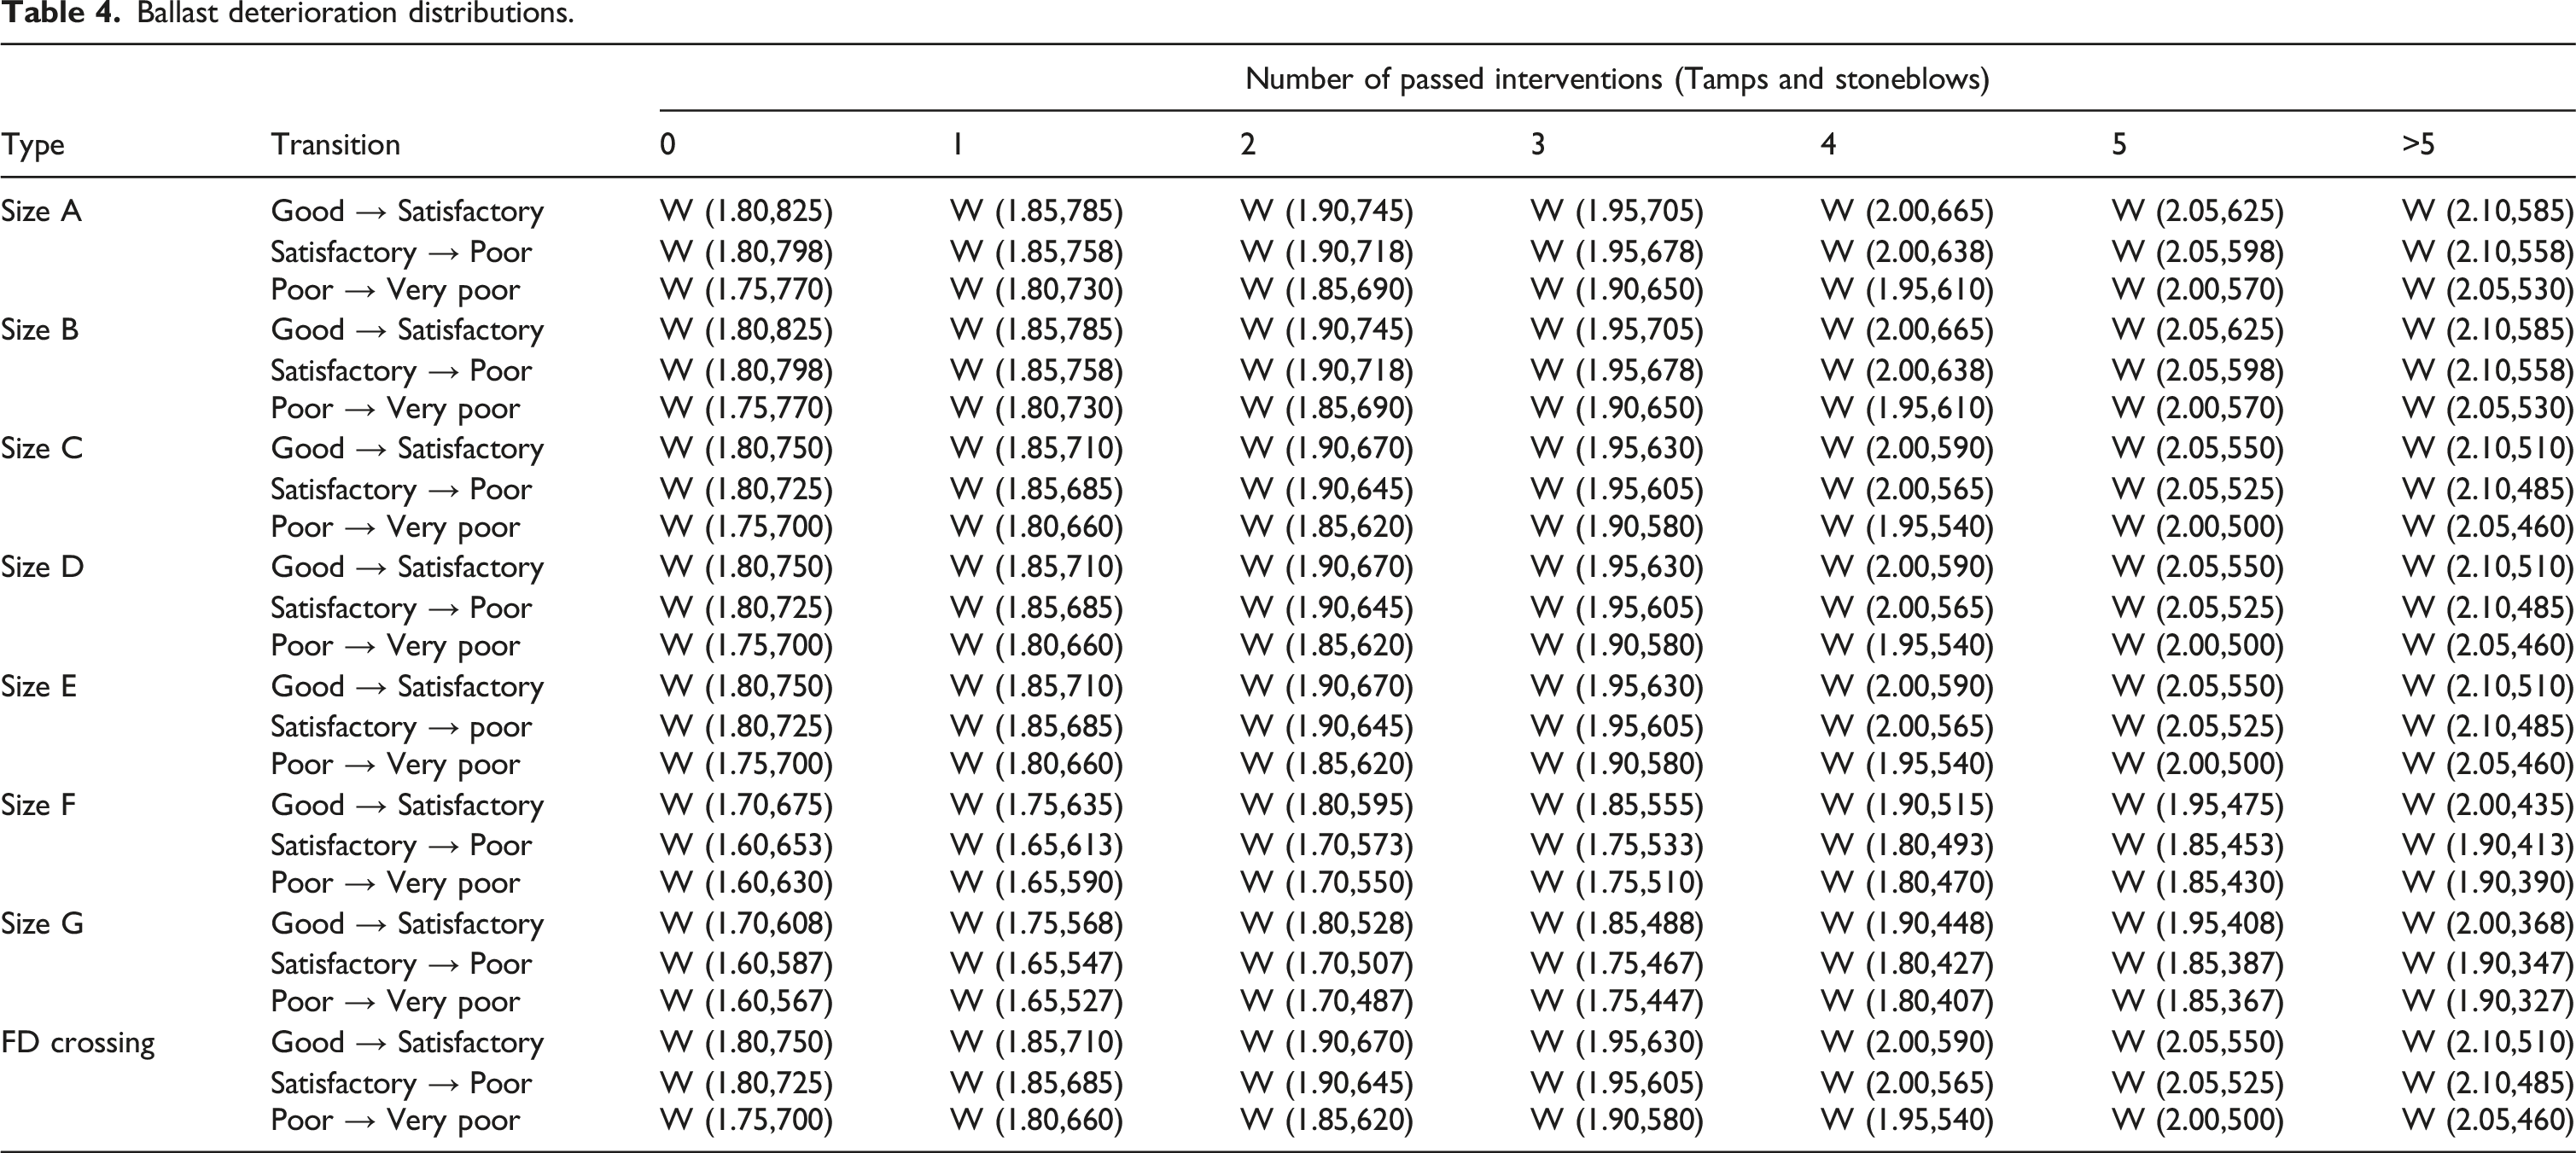
During a geometry inspection the geometry of the S&C will be measured and placed in one of the five quality bands outlined. By comparing the alignment at subsequent inspections it is possible to estimate the time taken to traverse the various different condition states. Nonetheless, the full maintenance history of the S&C would also be required as the degradation of the ballast has been shown to be dependent on the maintenance history. 29 Aligning the maintenance and renewal records with the geometry data to determine a maintenance history for each S&C is beyond the scope of this paper, as such Weibull distributions were estimated based on engineering judgement.
Ballast deterioration distributions.
Safety limit exceeding defects
The analysis so far has used maintenance records captured in Network Rail’s Ellipse database to estimate the component reliability based on the time between interventions. However, many of the S&C components also have safety thresholds; if defects are found to exceed these thresholds action will be taken immediately; either an emergency speed restriction (ESR) or a line closure. These events are captured in the FMS (Fault Management System) database. Defects requiring an ESR or line closure were observed for the single occurrence components namely: stock rail, switch rail, check rail and crossing.
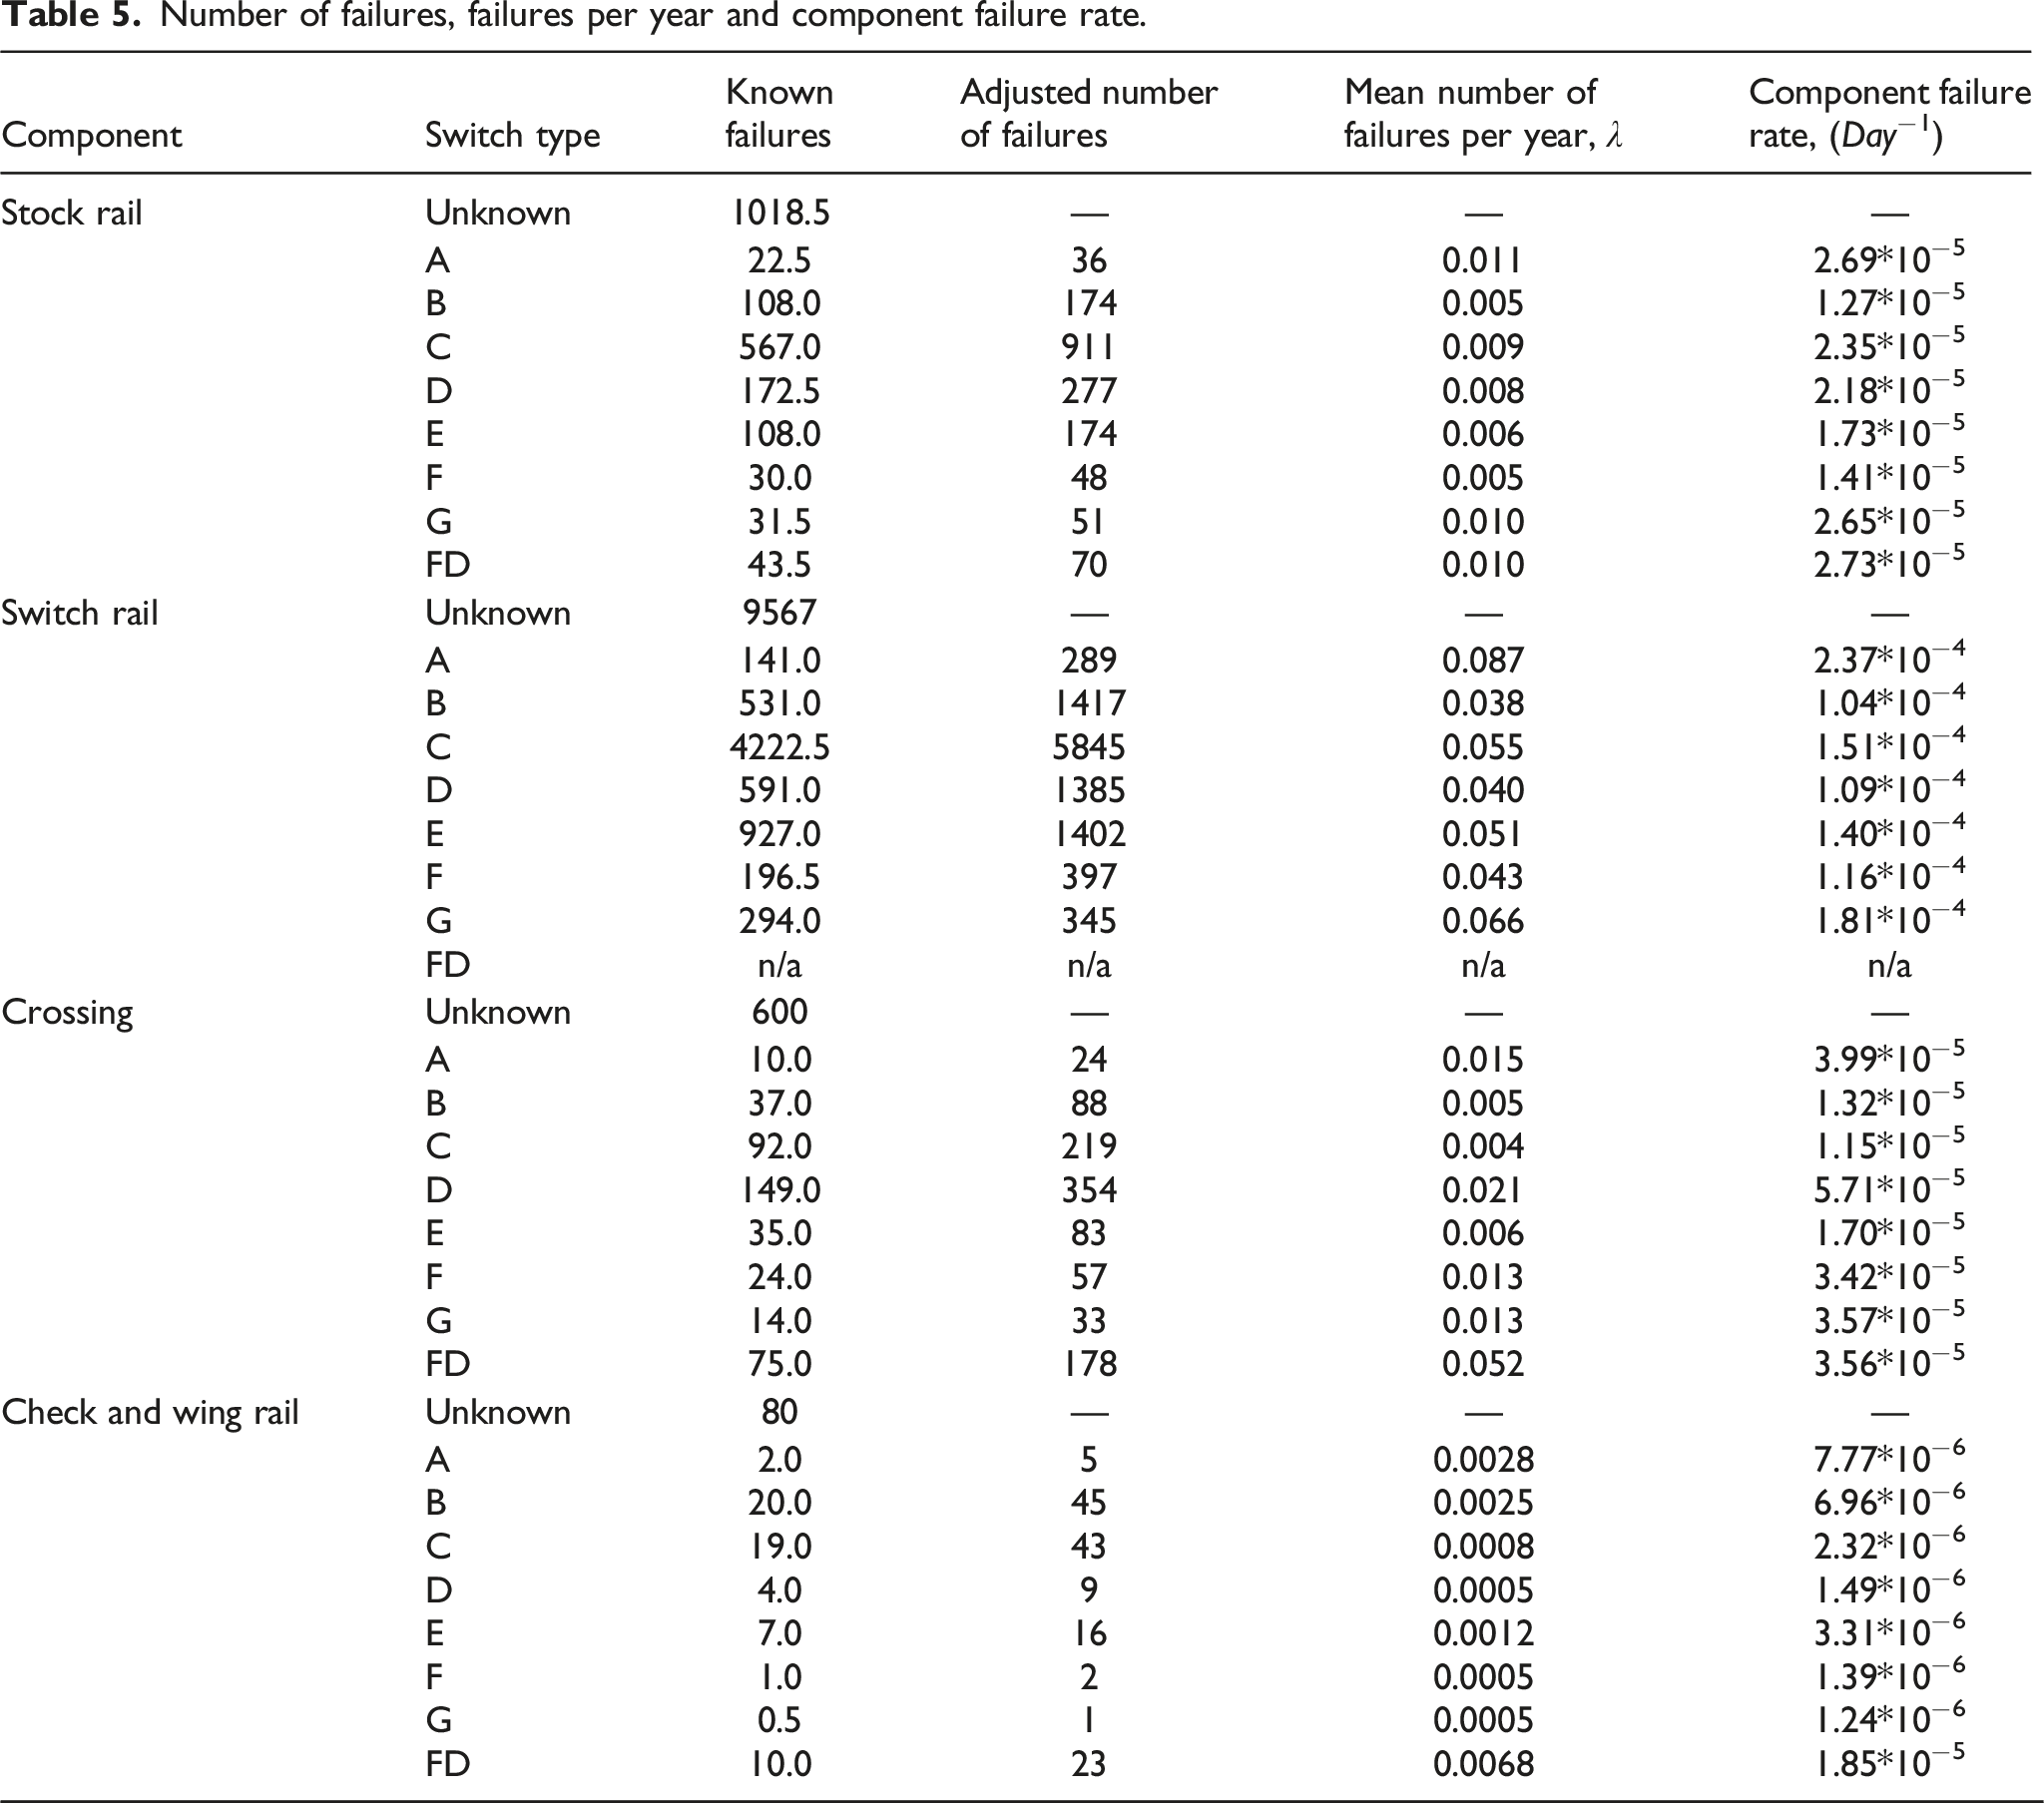
The FMS data was analysed to determine the expected number of failures, for the four components listed above for the eight switch types. Specific switches could be identified from the data, hence the time between failures of specific components could be determined. However, the lifetimes were concluded not to be comparable, as the components would have undergone different maintenance cycles during each lifetime. As such a complete maintenance history of the component would be required in order to identify similar lifetimes. This level of analysis was beyond the scope of this paper.
Number of failures, failures per year and component failure rate.
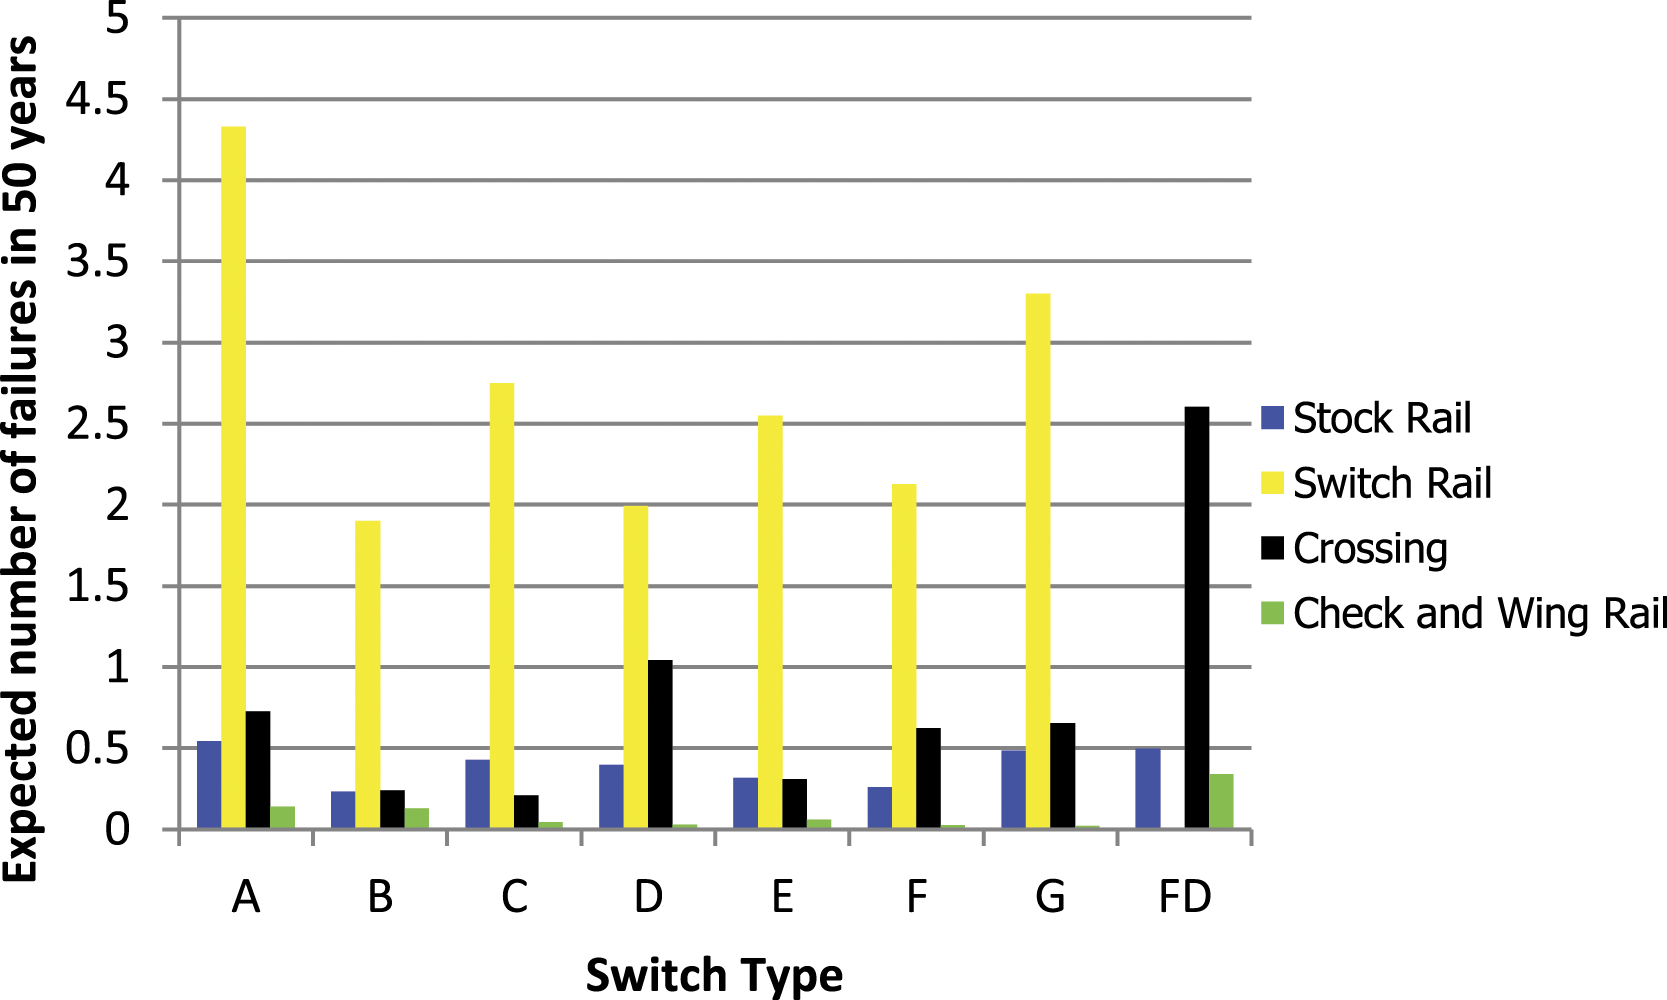
Expected number of failures in 50 years for various components and switch sizes.
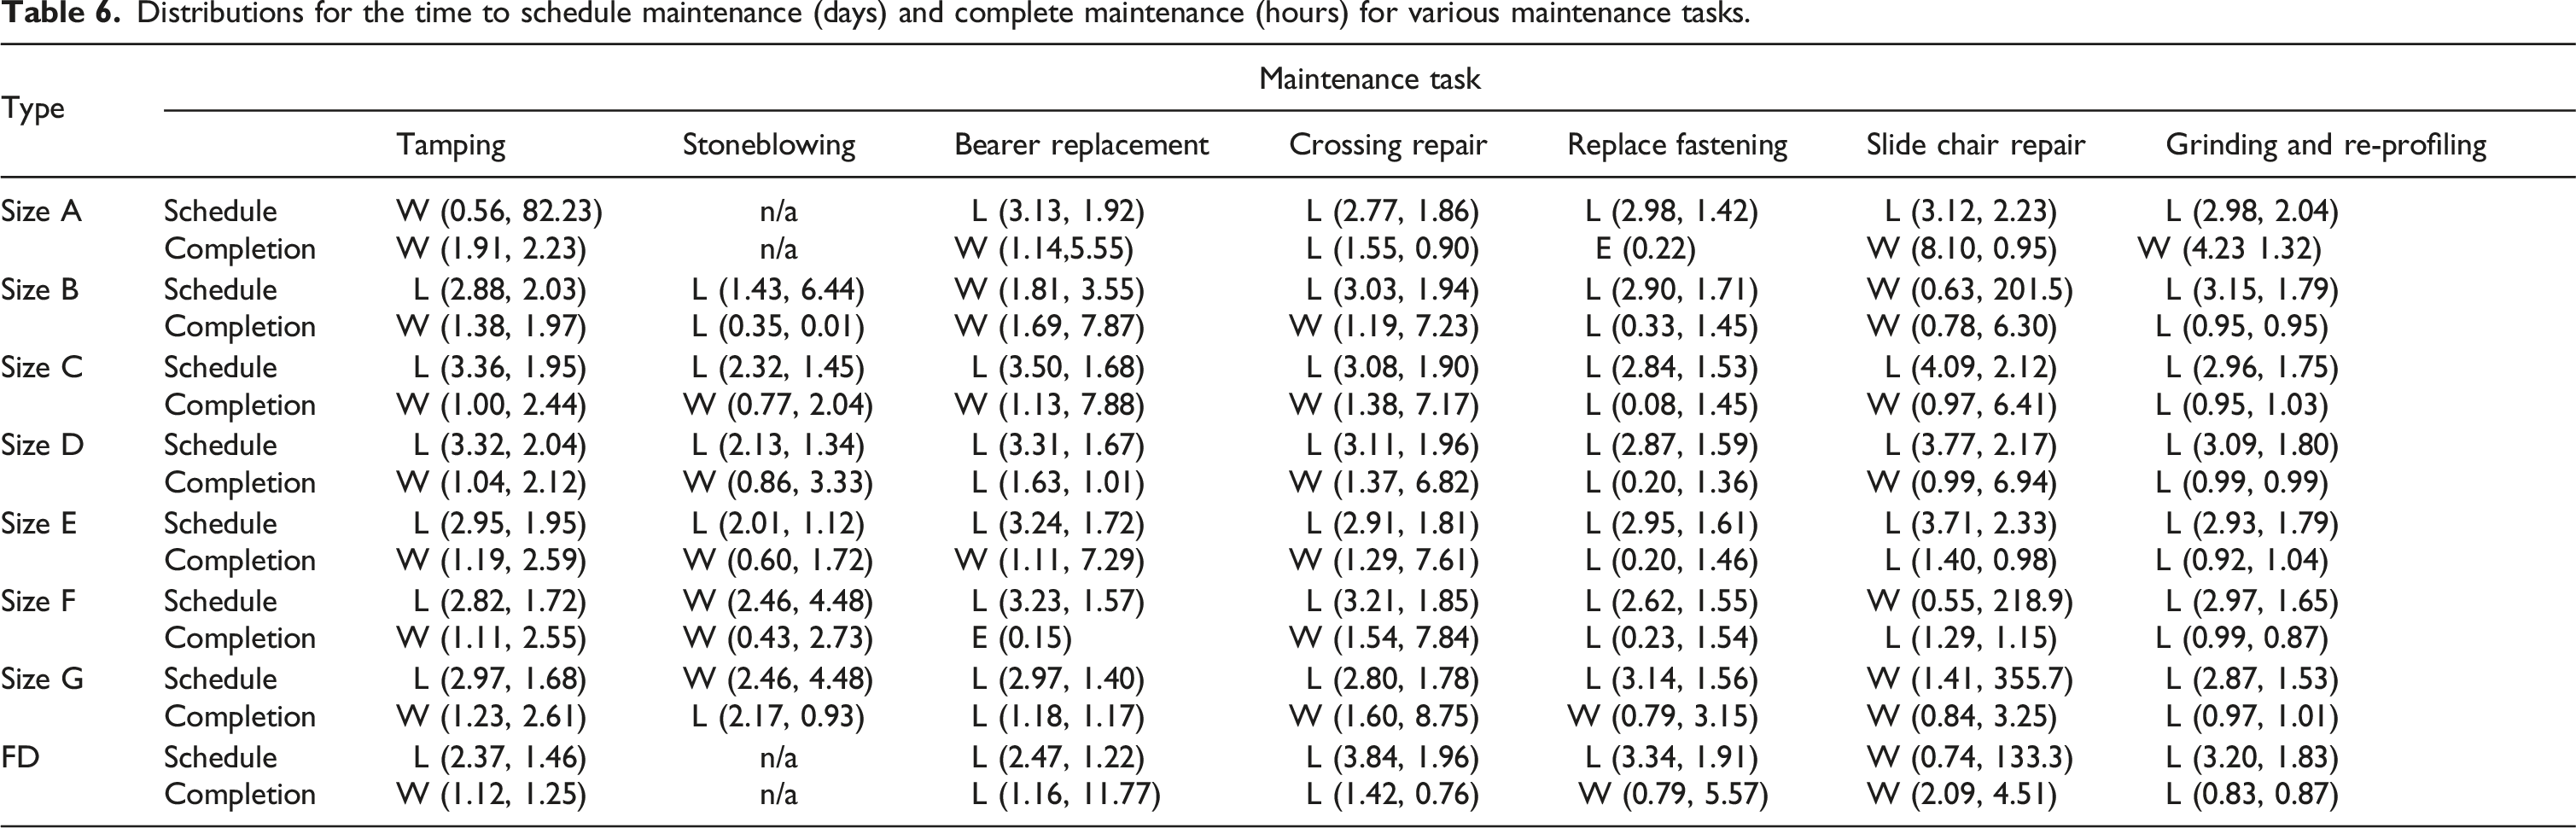
Maintainability
Once the component reliability had been determined the second part of the availability assessment was to determine the maintainability. The maintainability is modelled in two parts: (i) Schedule time This is the time between the maintenance being requested and maintenance being complete, (ii) Completion time This is the time the engineers are on site completing the maintenance.
Distributions for the time to schedule maintenance (days) and complete maintenance (hours) for various maintenance tasks.
Inspection intervals
The deterioration of any S&C component will generally be unrevealed and therefore it is critical to inspect the S&C regularly to ensure that any deterioration is discovered in a timely manner. Different components will require different inspection types. For example it will generally be possible to visually see missing or defective fastenings, however rail defects are generally not visible to the naked eye. Three types of inspection are used at S&C units. Visual inspections which are used for bearers, fastenings, slide chairs and stretcher bars. Ultrasonic inspections which are used for the rails and lastly geometry/recording car inspection, which is used to assess the track geometry and determine if any ballast maintenance is required.
As a modelling simplification, it is assumed that the inspection frequency is independent of the component condition, and as such the deterioration rate is not influenced by the inspection interval, this is thought to be justified as the inspection frequency is significantly smaller than the degradation rate. The visual inspection frequency assumed is seven days based on Network Rail 33 Standards. The ultrasonic inspection frequency is 28 days based on Network Rail 34 Standards. Lastly, the recording car inspection frequency was assumed to be 56 days according to the information in Network Rail 35 Standards.
Summary and conclusions
This paper presented a reliability study of railway S&C. The paper considered the nine key components within an S&C, and provided a methodology to model degradation, failure, inspection and repair of those nine components. Based on the component properties a mixture of discrete and continuous probability distributions were determined to approximate the four processes outlined. The analysis was further divided by switch type, to allow the impact of switch type to be understood.
It was concluded that switch size impacted the number of replacements with larger switch sizes generally seeing more maintenance interventions. However, switch size did not seem to influence the expected number of failures in a given period.
Due to the complex nature of the interactions between degradation, failure, inspection and maintenance, it is not possible to analytically determine the availability of each component and the overall availability of the S&C. To determine the availability a simulation based approach such as a Markov or Petri net approach would be required, a Petri net solution based on the distributions found in this paper is presented in the companion paper. 6
Footnotes
Declaration of conflicting interests
The author(s) declared no potential conflicts of interest with respect to the research, authorship, and/or publication of this article.
Funding
The author(s) received no financial support for the research, authorship, and/or publication of this article.