
Abstract
Switches and Crossings (S&C) are a fundamental part of any railway network, they allow trains to switch between tracks and to cross over other tracks. They consist of various electrical and mechanical components to which there is a substantial maintenance cost. Failure of an S&C unit can cause significant disruption to traffic and have large financial implications. Therefore, planning their maintenance is of critical importance to railway asset managers. This research proposes an asset management framework, which models the degradation, failure, inspection and maintenance for the S&C unit. The framework comprises nine Petri net sub-models for the S&C component availability and predicts the number of maintenance interventions in a given time period. This can be used to inform maintenance decision making, with the aim of reducing the life cycle cost of the S&C.
Introduction
Railway asset managers are required to make key decisions on where, when and how budget will be used to maintain the railway infrastructure, while also ensuring maintenance and performance targets are achieved and strict safety standards adhered to. 1 The need to utilise the funding available to achieve best advantage makes effective asset management decisions ever more important. Asset managers require accurate models to predict the availability and future evolution of their assets, enabling them to make the most informed decisions possible.
This research focuses on one element of the railway infrastructure; Switches and Crossings (S&C). An S&C unit is a track asset that allows trains to switch between tracks or to cross over another track. There is a significant cost to maintaining S&C units and their failure can cause large disruption to traffic. Despite running a reduced timetable due to the impacts of COVID 19 Network Rail still reported that S&C failures caused over 270,000 delay minutes to passenger and freight services on the UK network between April 2021 and January 2022. 2 Deutsche Bahn reported that 19% of delay minutes on the German railway were caused by S&C failure in 2010. 3
Switches and crossings units have regularly been the focus of research studies, with investigation into the interactions between forces4–6 as well as the use of condition monitoring to predict their failures.7–9 However, literature on S&C life cycle analysis is far less common. Zwanenburg 10 explored the effects of location, curvature, switch (crossing) angle and the soil quality, on the service life of switches on the Swiss railway. Nissen 11 used Excel to create a life cycle model for S&C on the Swedish railway network by considering the Life Cycle Cost (LCC) as being made up of six parts and determining a cost for each of them. More recently, Landgraf working with others 12 proposed conducting a life cycle assessment to determine the environmental impact of S&C over their lifetime.
This paper will build on this research by creating an asset management framework which models the degradation, failure, inspection and maintenance of the key components within an S&C unit under given operational conditions and a given period of operation. The model details the average number of maintenance interventions in a given period alongside the overall S&C availability. The framework is initially populated with the values determined in the S&C reliability study presented by Litherland and Andrews. 13
S&C asset management processes
The life cycle of a component is widely viewed as having four stages: (i) Planning/design (ii) Construction (iii) Operation (iv) Decommission
As the majority of railway infrastructure is already in place the research in this paper will focus on the operation part of the life cycle only. To develop an effective model for the asset management of an S&C unit, there are six main processes that need to be considered: degradation, inspection, servicing, maintenance, renewals and enhancements. These aspects are discussed in the following sections.
Degradation process
A detailed understanding of the degradation process is central to any asset management model, as the degradation is the primary driver of the other processes. Nonetheless, the deterioration is often the most difficult process to model accurately. There are various methodologies to forecast degradation; estimating degradation rates using maintenance and failure records is popular among researchers.14–16 In this study, S&C components are modelled as being in one of several discrete condition states. Maintenance and failure records can then be used to estimate the transition time between states.
Inspection process
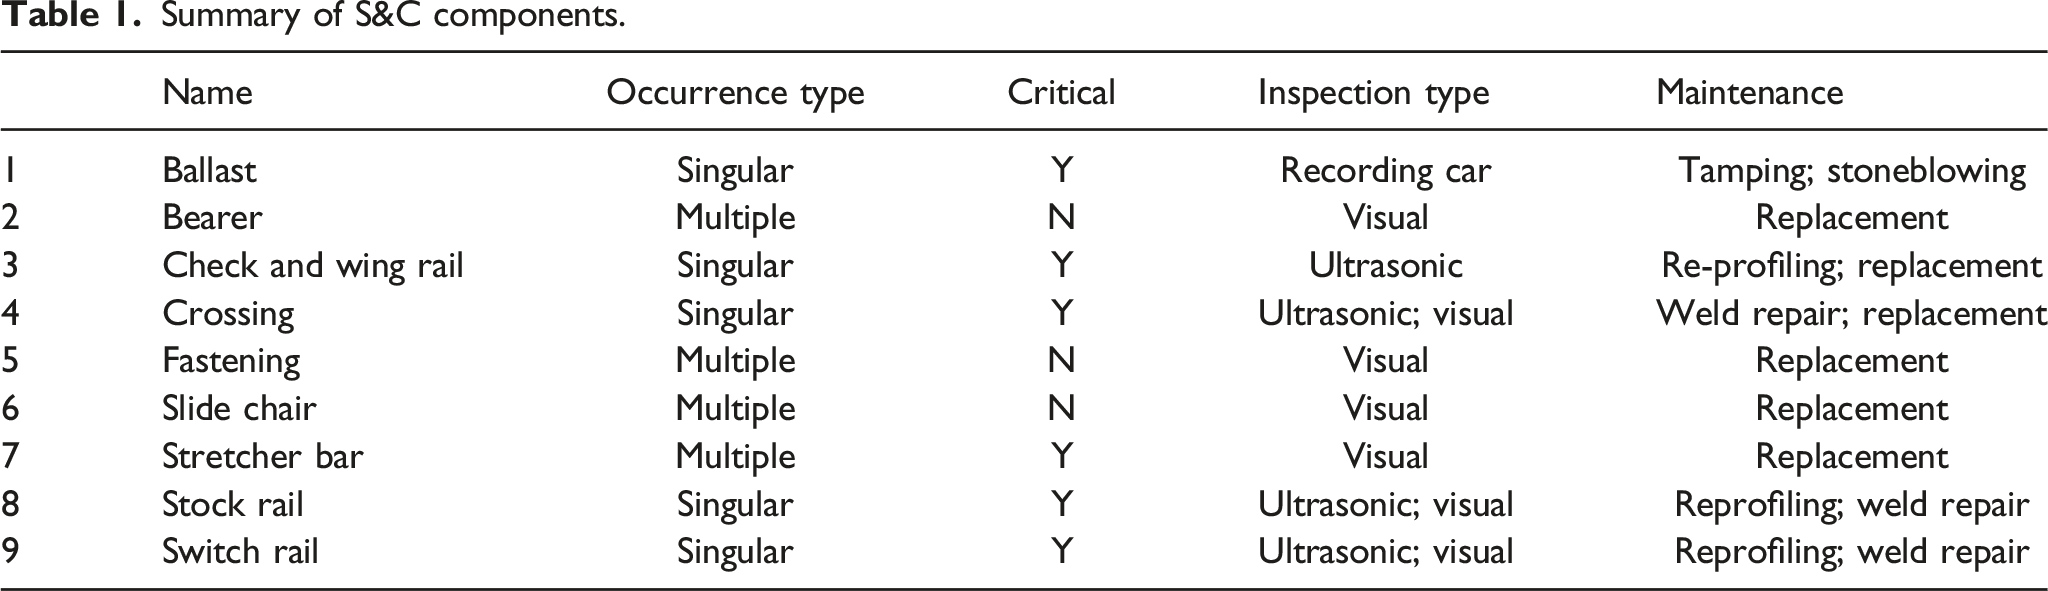
Summary of S&C components.
Service regime
Effective servicing can extend the life of components. 18 For an S&C unit servicing tasks include tightening (checking torque) of stretcher bar bolts, oiling slide chairs and switch rail pivots, clearing flange ways, and adjusting the switch rail alignment. It is common practice to model servicing as slowing the degradation process rather than delivering condition uplift. 19
Repair process
The repair or maintenance process is critical to effective asset management and is one of the areas the Infrastructure Manager (IM) has most control over, as such there are various well established techniques for assessing the effectiveness of different strategies, including failure mode and effects analysis (FMEA) and reliability centred maintenance. 20
For an S&C unit there are various maintenance options that can be performed, these will vary from component to component, the most common techniques and the ones considered in this study are summarised in Table 1, and described below, but this is by no means an exhaustive list.
Component replacement
Replacement can be the preferred option for components where maintenance is not possible, for reasons such as component design or obsolescence; or because component replacement is cheaper than maintenance (this is generally the case for low cost components).
Tamping
Tamping is used to repack the ballast and improve the geometry at the S&C. 21 A tamping machine is self-propelled, it grips the rails and lifts the track into the required position, tines are then used to rearrange the ballast to support the track in its new position, 22 specialist tampers are used for S&C, 23 which can work around the additional ironworks at the S&C.
Stoneblowing
Stoneblowing is another technique that can be used to improve the geometry. During stoneblowing the track is lifted, small stones are blown under the bearers and finally the track is lowered onto the new stones. It can be performed at S&C using a handheld or multipurpose stoneblower. Stoneblowing is generally performed when tamping starts to become ineffective, Network Rail 23 have found stoneblowing to be very successful at extending the life of older S&C in the UK.
Rail re-profiling
Re-profiling is used to correct defects in the rail surface such as lipping. Lipping is a plastic metal flow occurring in the rail head (top) caused by high axle load and high gross tonnage. There are various rail re-profiling techniques including grinding, milling and planing.
Welding and thermite repair
If rail defects propagate beyond a certain depth then re-profiling becomes ineffective, at this point a weld repair must be conducted. There are various approaches to rail welding 24 but the central idea is to remove small sections of damaged rail and replace with new steel.
Renewal process
Eventually the S&C will become unviable, for reasons such as poor performance, high maintenance cost, obsolescence or change of requirement. At this point the S&C must be replaced or decommissioned. There are several methods of deciding when this point will occur: (i) When the condition of the asset becomes inadequate to deliver the required functionality, (ii) After a set number of maintenance interventions have taken place, (iii) When the time between maintenance interventions becomes too short, (iv) After a fixed lifetime.
As an alternative to a complete renewal, major refurbishment activities such as ballast cleaning can be performed. 25 However, at this stage as a modelling simplification, it is assumed that the impact of renewal and major refurbishment will be the same and therefore major refurbishments are not explicitly modelled.
Enhancement process
The enhancement stage may be separate, or parallel, to the operational stage. 26 This stage involves improvement to the system, often with the addition of functionality to meet changing user demands, extend operating life or to combat obsolescence. It typically involves adding additional infrastructure/components or redesigning components to design out known weaknesses.
S&C components
There are various different types of S&C units, with the most common being a turnout which allows the train to switch to a different track. Other types include Fixed Diamond (FD) crossing (allowing trains to cross but not switch tracks) and scissor crossing (allowing trains to cross and switch tracks). The specific design can be tailored to meet capability and capacity requirements, but can be restricted by geographical constraints. The S&C will be made up of various components, namely: (i) Ballast (ii) Bearer (iii) Check and Wing Rail (iv) Crossing (v) Fastening (vi) Slide Chair (vii) Stretcher Bar (viii) Stock Rail (ix) Switch Rail
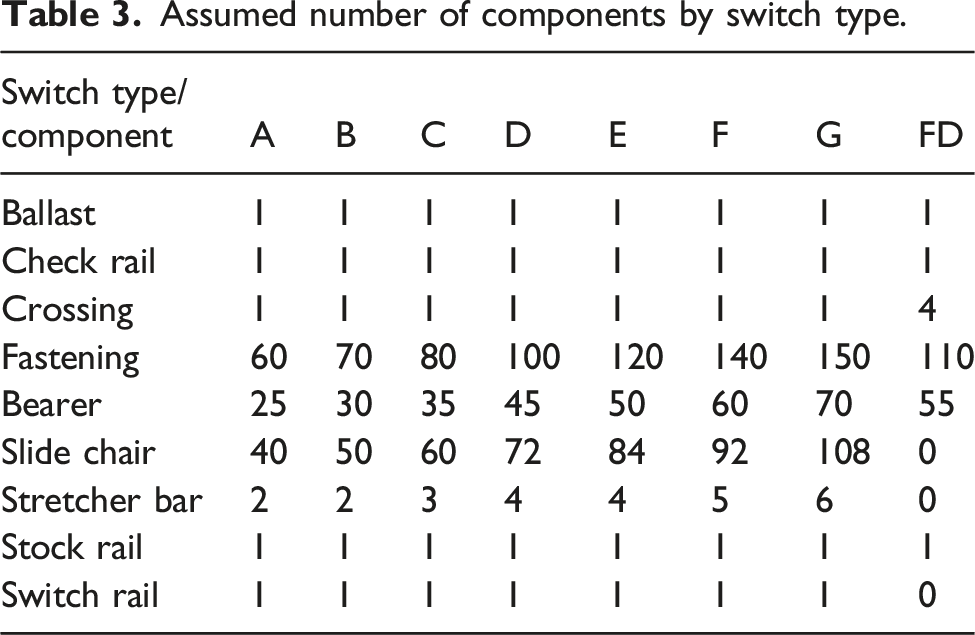
The quantity of each will vary depending on design, and not all will be present in all designs, for example an FD crossing will not contain any switch rails. For the purpose of modelling, components are grouped into two main classes. Firstly, single occurrence where just one instance of the component is present. Secondly, multiple occurrence components, where there are multiple occurrences of the component. The quantity of multiple occurrence components varies between different S&C types. Within the model components are also grouped into critical and non-critical. Single occurrence components are classified as critical as if they become unavailable it is assumed the S&C will become unavailable. Multiple occurring components are not considered critical as if one fails individually it will not cause S&C unavailability. The exception to this is the stretcher bars, if too many stretcher bars become defective the S&C is also assumed to become unavailable. The occurrence type and criticality is shown in Table 1.
Asset management framework
There are a range of different modelling techniques that could be used to support the asset management framework. These range from combinatorial methods such as fault trees 27 and FMEA, 28 which are generally deterministic and fast to solve, through to detailed simulation methods, which are stochastic in nature and are generally solved using Monte Carlo approaches 29 requiring significant computational resource. As there is believed to be an inherent randomness involved in the deterioration of railway track 30 deterministic combinatorial methods were considered not to be suitable.
A range of stochastic techniques to model railway assets can be found in literature including Bayesian networks, 31 Markov models,32,33 discrete event simulation34,35 and Petri nets (PN). 16 Bayesian networks were discounted as they required the relationships between the failures of components to be completely defined in order to populate conditional probability tables. At this time this information is not thought to exist, or be determinable from the data available. Markov models were also discounted based on their limitation of requiring a constant transition rate between states. The only way to model non constant rates in a Markov model is to introduce more states, this can lead to an exponential increase in the number of states in the model, significantly impacting the solution time.
Subsequently, a PN approach was selected, the PN method is extremely flexible, with transitions being able to capture any distribution. Whilst arguably the same results could have been achieved using discrete event simulation, it is felt the precise definitions and visual representation of the system offered by PNs is more conducive to the reader’s understanding in this case. Furthermore, the PN structure lends itself well to future expansions; it is the authors ambition in the future to link the PN model proposed in this research with models for other assets to allow a whole system assessment of the LCC to be conducted.
Petri nets were first proposed by Carl Petri in his 1962 thesis, 36 since then their applications have been extensive including, railway track asset management, 37 emergency response decision making 38 and modelling passenger flows at transport interchanges. 39 Their graphical representation supports the visualisation of changes of state of the system whilst their features allow detailed modelling and investigation of a wide range of components.
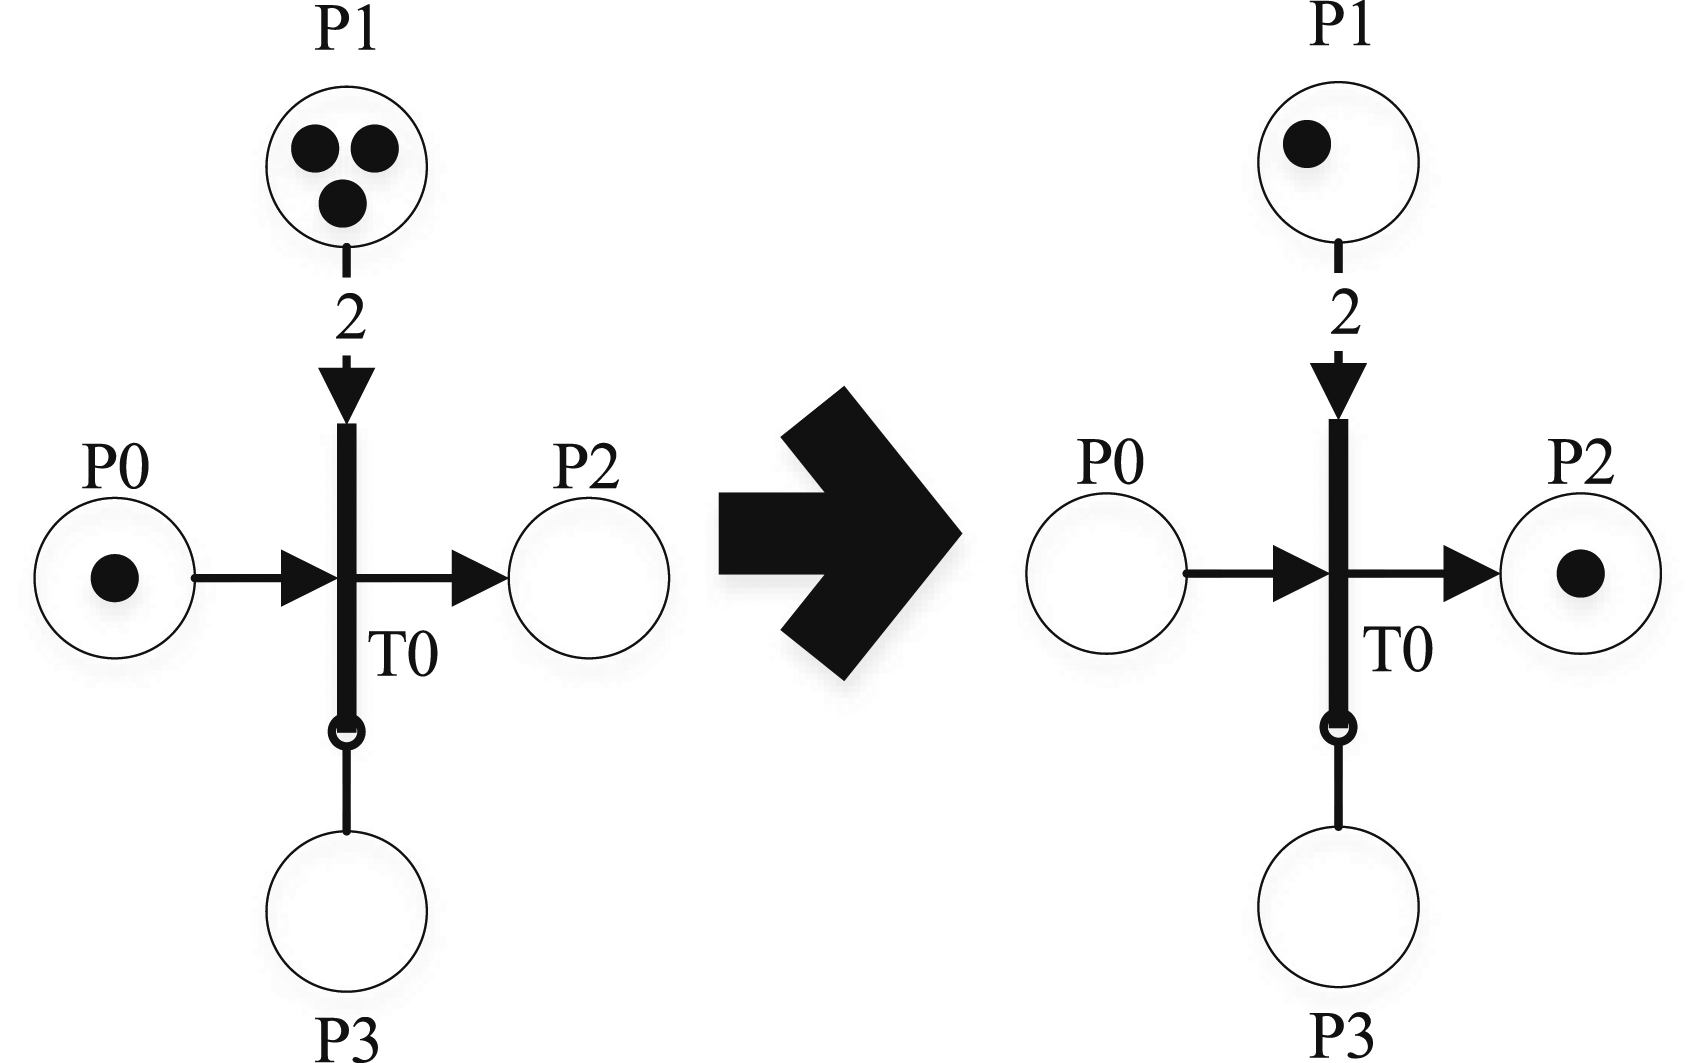
There are two node types within a PN framework: places and transitions. Places normally represent the state of the system such as working or failed and are represented as circles. Tokens are located within places to indicate the current state of the system. The number of tokens in a place is referred to as its marking. Transitions are used to change the state of the system by moving tokens from place to place. The transitions and places are connected using arcs, which can have a weight or multiplicity. The multiplicity describes the number of tokens that will travel along that arc. An additional feature of PNs used in this research is the inhibitor arc. An inhibitor arc prevents state changes if the number of tokens in the place it is linked to is greater than its multiplicity.
A simple example of a PN is shown in Figure 1. The system is updated when the transition fires, which occurs in the following way: 1. The transition must be enabled. A transition is enabled when all the input places contain tokens at least equal to their arc multiplicity and it is not inhibited. The transition in Figure 1 is enabled as the marking of places P0 and P1 are greater than or equal to their arc multiplicity and there is no token in place P3, so the transition is not inhibited. 2. Once the transition is enabled it will wait for a delay time, the delay time can be deterministic (fixed delay time) or stochastic (delay time sampled from a distribution). 3. Once the delay time has elapsed the transition will fire. When a transition fires, a weight of tokens equal to the multiplicity of arcs is removed from each input place and a weight of tokens equal to the multiplicity of arcs is added to each of the output places. Consequently, the number of tokens does not need to be conserved in the firing process. PN transition firing.
Several PN extensions are also used. Firstly, the conditional transition, 40 where the delay time is dependent on the marking of one or more other places in the net, these are drawn in blue. Secondly, the reset transition, 40 drawn in orange, which resets several other places in the net (the marking is returned to the initial marking). Thirdly, the conditional probabilistic transition, 16 for this transition each output arc has a probability value, and when the transition fires one of the output places is selected based on these probabilities. The probability of each arc varies based on the marking of various places in the system. These are drawn as green squares. Finally, the periodical transition, 41 which is used to simulate inspections. This transition has two input parameters: the time from the start of the simulation until the instant the transition becomes able to fire, τ, and the length of time between two periodic events such as inspections, p. The firing time is then equal to the remainder when τ is divided by p. Periodical transitions are shown with a coloured outline, turquoise for visual inspections, green for ultrasonic inspections and finally yellow for recording car inspections.
Computer software such as the Mathworks’ Petri net toolbox or AIS group’s CPN tools can be used to simulate the movement of tokens through the PN, to determine the behaviour of the system over a given period. By applying a Monte Carlo approach and running many simulations, it is possible to analyse the probability and likelihood of different events, for example the mean and variance of the number of times a given transition fires.
PN model development
The PN framework contains 98 places and 61 transitions and is formed of nine sub-models; one for each of the component types listed in Table 1. The system model PN structure is shown in Figure 2. Squares represent sub-models each of which is described in detail in the following sections. The sub-model’s outline colour corresponds to the type of inspection that component receives. PN S&C framework, consisting of nine sub-models.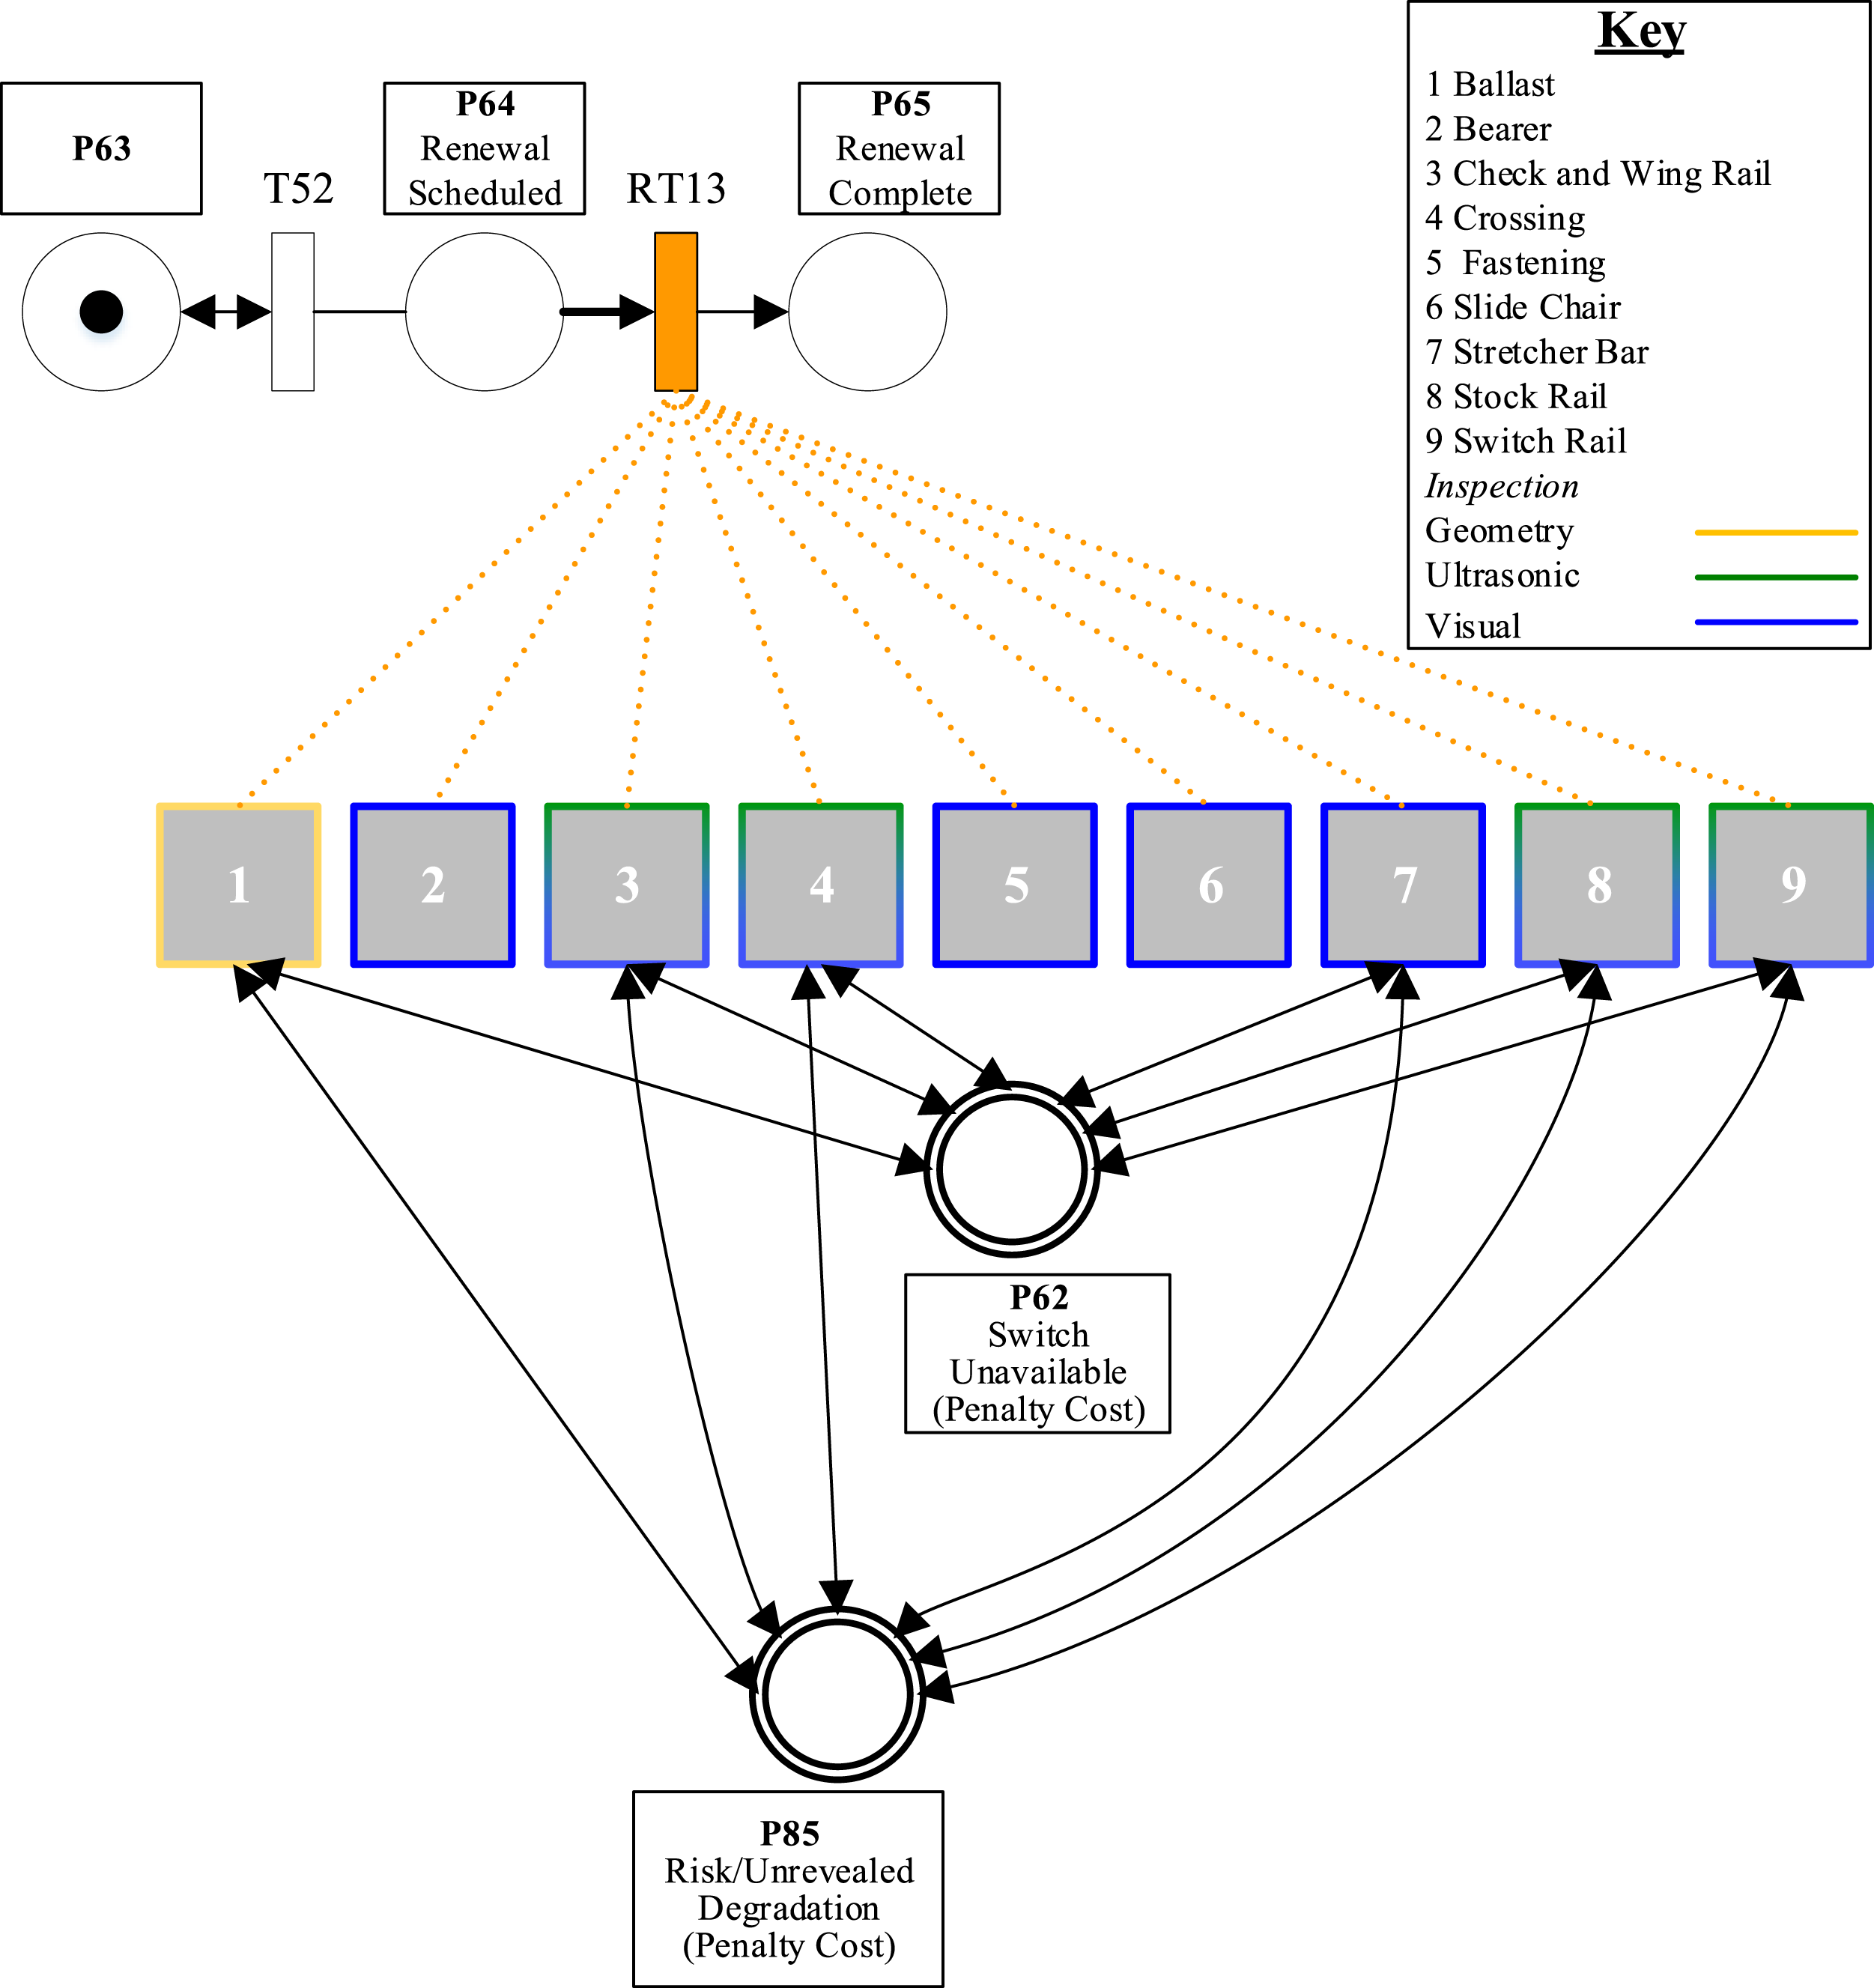
The system PN contains two global places, drawn with a double border, the information in these places is shared between multiple different sub-models. Global place P62 is used to record system unavailability. This place is marked if any of the critical components (see Table 1) fail, if any one of these fails, the S&C unit will be unavailable causing disruption to traffic and incurring a financial penalty. Global place P85 is used to record risk, when component degradation is unrevealed. Unlike the case of unavailability, where the effect is the same whether one component is unavailable or many (the system is unavailable), for risk the effect is cumulative; the more components that are unrevealed the higher the risk. A risk implication is also only considered for the critical components.
Grinding and reprofiling maintenance is generally performed on the switch and stock rail simultaneously to ensure that the S&C continues to operate correctly. To allow this phenomenon to be captured in the PN there is a direct link between the stock and switch rail sub-models, this is outlined in more detail in the stock rail section.
Places P63-P65 are used to simulate the renewal of the S&C, based on a fixed component lifetime, simulated using T52. When transition T52 fires a renewal is scheduled; from then on only critical maintenance can occur (maintenance that returns the S&C from unavailable to available (unmarks place P62)), until transition RT13 fires (which indicates the renewal has been completed). RT13 returns every place, across all nine sub-models, to their original marking.
Ballast
The ballast sub-model is shown in Figure 3. There are four condition states (P46–P49) used to assess the ballast quality based on the standard deviation of the vertical alignment, Ballast PN sub-model, with links to global place P62 and P85. Ballast condition states.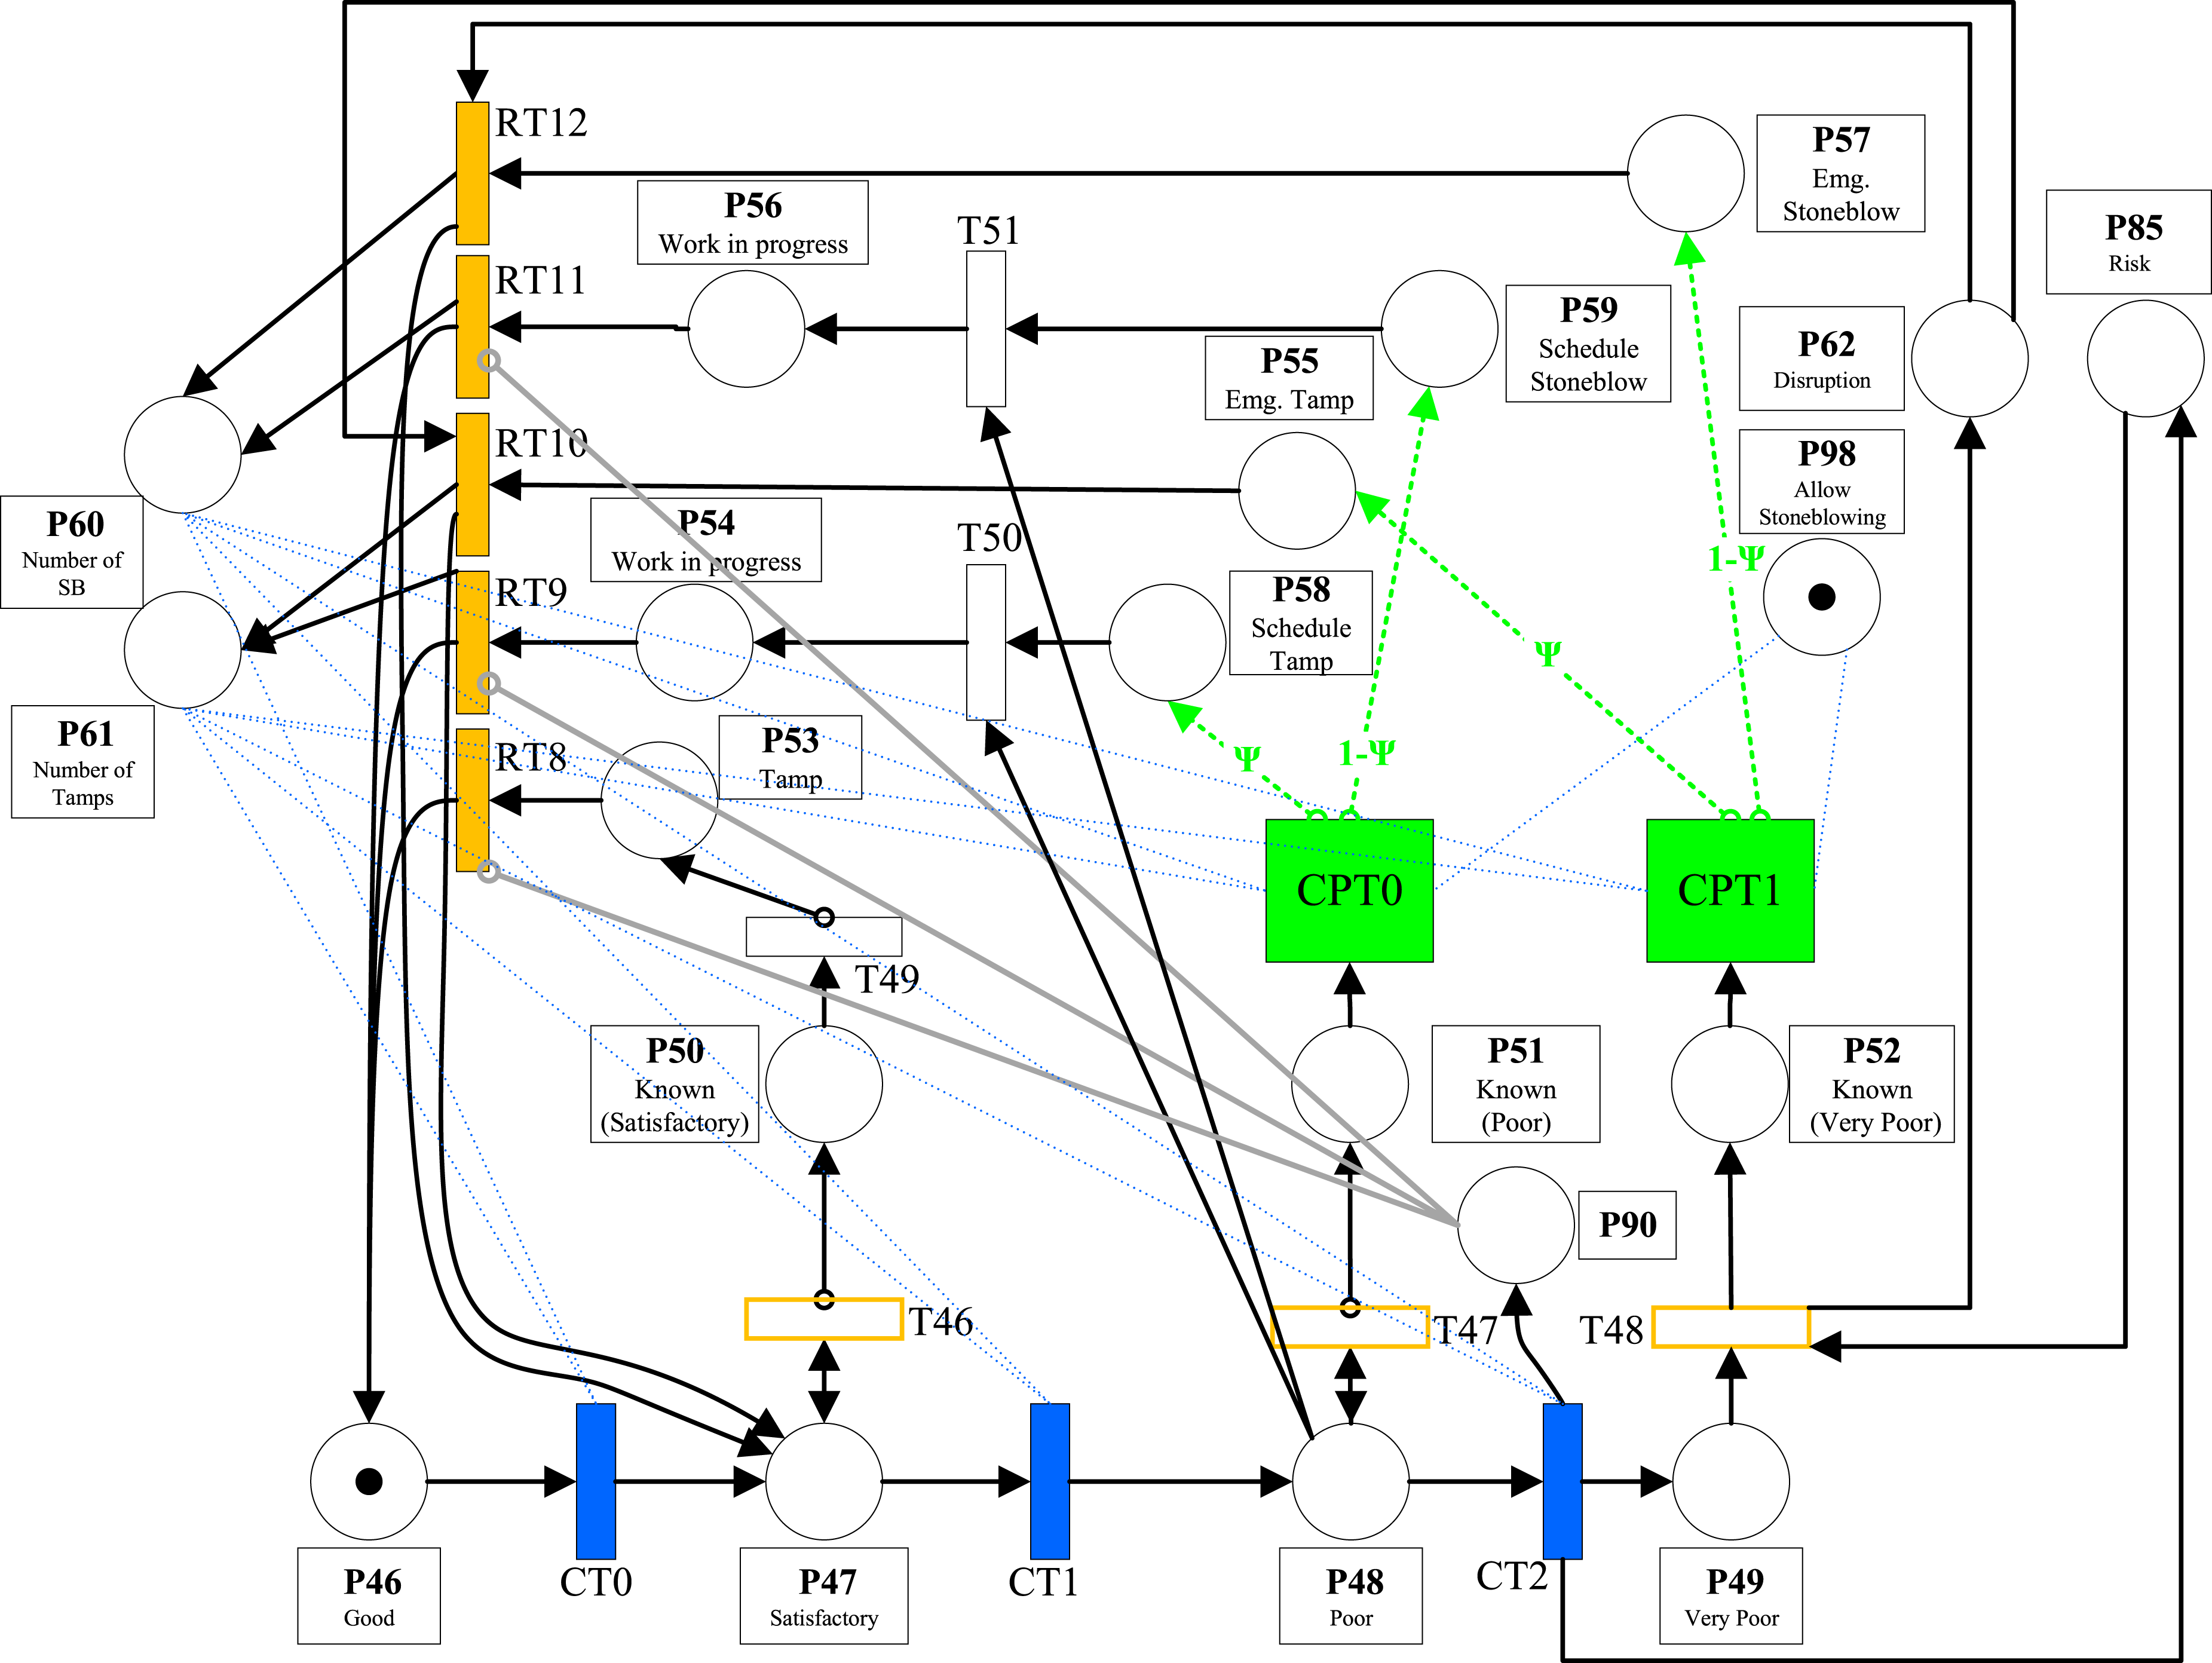
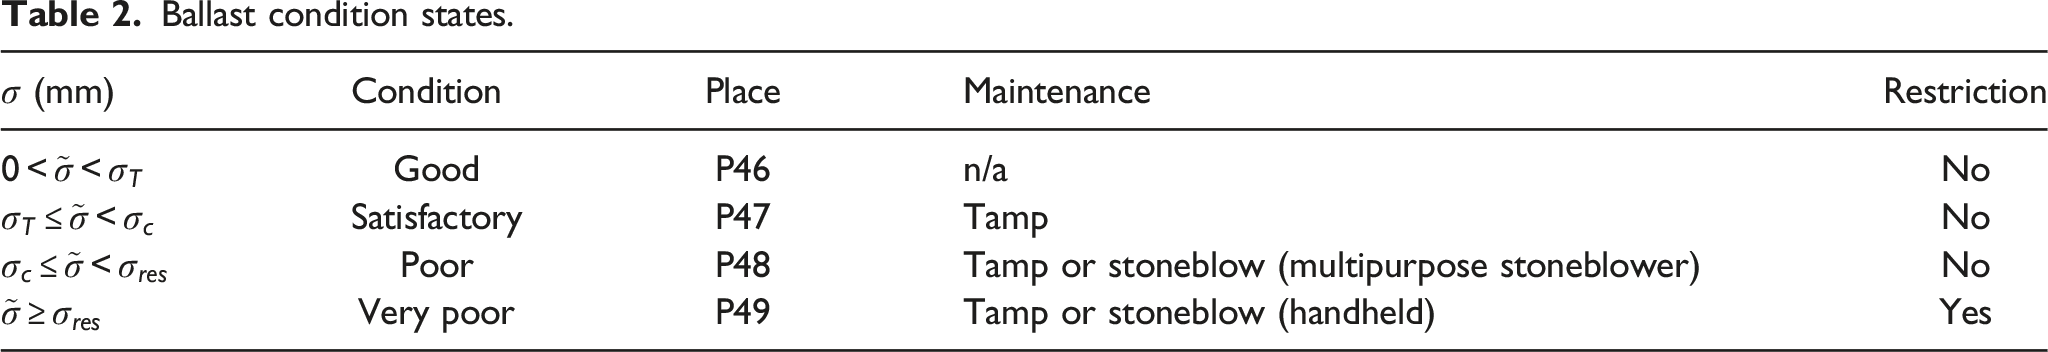
Once degradation is revealed maintenance is scheduled. There are two primary techniques to correct the alignment: tamping and stoneblowing. The maintenance selected in the framework is based on the condition state and the maintenance history (see Table 2).
The conditional probability transitions CPT0 and CPT1 are used to select between either tamping or stoneblowing. The transitions select tamping (P55/P58) with a probability Ψ and stoneblowing (P57/P59) with a probability 1−Ψ. The value of Ψ changes based on the maintenance history (marking of P60 and P61). Three rules are considered when determining Ψ: (i) At the beginning of the ballast’s life tamping is the preferred option, as it can deliver a lower (ii) As the number of passed tamps increases, they become less effective and the value of (iii) Once a section has been stoneblown it should not be tamped, hence following a stoneblow the value of Ψ is close to zero.
If P98 is not marked, then stoneblowing is not considered and tamping is always selected.
P58 and P59 are used to model standard maintenance. The maintenance process is modelled in two parts, the schedule time, T49–T51 (time between deterioration being revealed and maintenance beginning) and completion time, RT9 and RT11 (the time between maintenance beginning and maintenance being completed (on site time)).
P55 and P57 are used to model emergency tamping and stoneblowing. In this scenario it is assumed that the workforce will be deployed immediately and handheld tools will be used to complete the work, as such no schedule time is assumed. These places are linked directly to the reset transitions RT10, RT12 which model completion time.
When RT8-RT12 fire all places in the ballast sub-model are returned to their original marking (as shown in Figure 3). The exceptions to this are places P60 and P61, these places are only reset after a complete S&C renewal (RT13). As outlined emergency maintenance will be completed using handheld tools, as such it is assumed the result will not be as effective and it is assumed that the condition will only return to the satisfactory band.
If the ballast condition reaches the very poor state (P49), global place P85 will be marked indicating a high level of risk, it will remain marked until T48 fires, at this stage the degradation will be revealed and so mitigating action such as a speed restriction or line closure, will be put in place, making the S&C unavailable, and global place P62 will be marked. P62 will remain marked until a ballast intervention is completed (RT10 or RT12) or the S&C is renewed (RT13).
Crossing
The crossing can experience several different defects
43
including soft spots, shelling, plastic deformation and cracking. The PN sub-model for the crossing is shown in Figure 4. The crossing can be in one of three condition states: working (P31), minor defects (P32) or safety limit exceeded (P33). Crossing PN sub-model, with links to global place P62 and P85.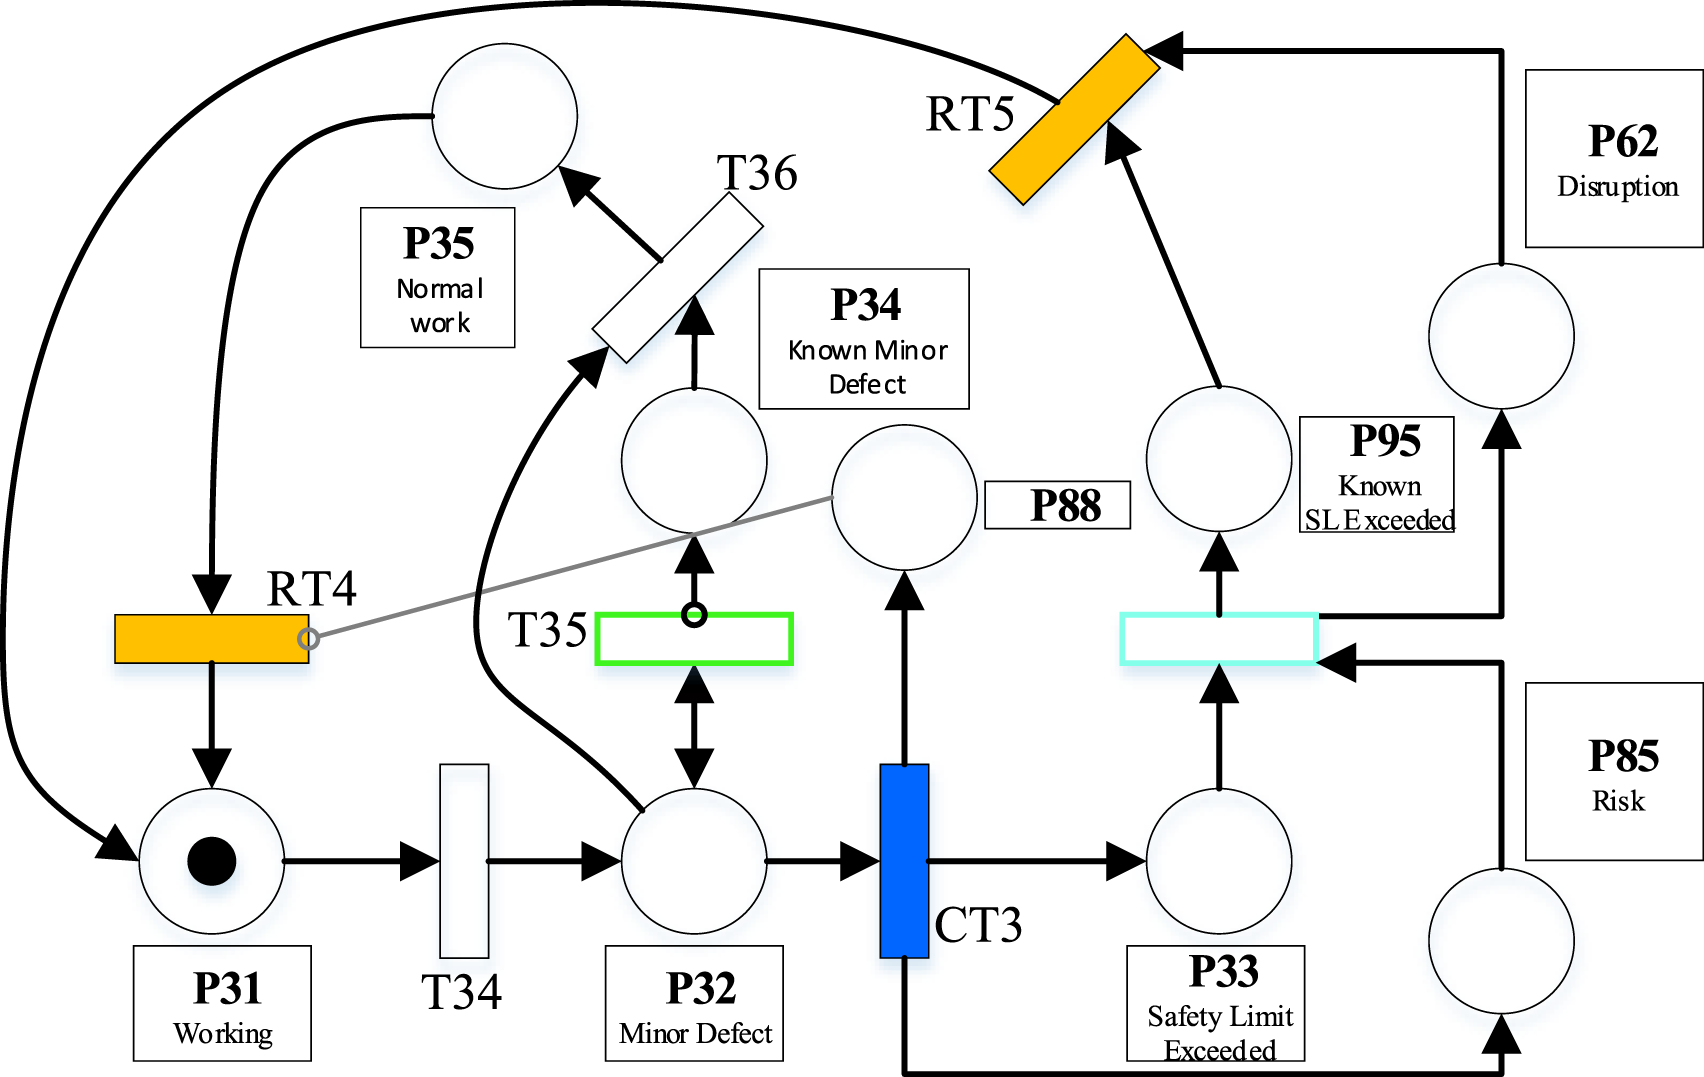
From the minor defect state, it is assumed that grinding/reprofiling can be used to rectify defects (RT4), minor defects will be revealed following an ultrasonic inspection (T35). Defects exceeding the safety limit will need more major maintenance such as a weld repair or crossing replacement (RT5), safety limit exceeding defects will be revealed following a visual inspection (T59). When defects exceeding the safety limit are unrevealed the global place P85 will be marked, indicating there is a high risk. Following the discovery of a defect exceeding the safety limit the crossing will be marked as unavailable (P95), P62 will then be marked indicating the S&C unit is unavailable and incurring a penalty cost, the inhibitor arc between P34 and RT4 ensures that a safety limit failure is addressed before a minor defect.
Check and wing rail
The check and wing rails are used to guide the train wheels and are not directly load bearing. The check and wing rail PN has the same structure as the crossing net; with three condition states: working (P36), minor defects (P37) and safety limit exceeded (P38). Again, it is assumed that minor defects will only be revealed by an ultrasonic inspection and that defects exceeding the safety limit will be revealed following a visual inspection. Minor defects will be repaired with grinding/reprofiling (RT6) and if defects exceed the safety limit the check rail will be replaced (RT7). Like the crossing, if check and wing rail defects exceeding the safety limit are unrevealed the global place P85 is marked. Once these defects are revealed global place P62 will be marked indicating the S&C is unavailable. These defects are likely to be resolved by replacement.
Fastening
The PN sub-model for the fastening consists of four states, working (P17), degraded (P18), known degraded (P19) and under repair (P20), arranged in a loop as shown in Figure 5. It is assumed that the stock rail is attached to each bearer using two fastenings, each fastening is represented by a token. The number of fastenings within the S&C, f, is dependent on the switch layout (number of bearers). Fastening PN, section in blue simulates fastening inspection.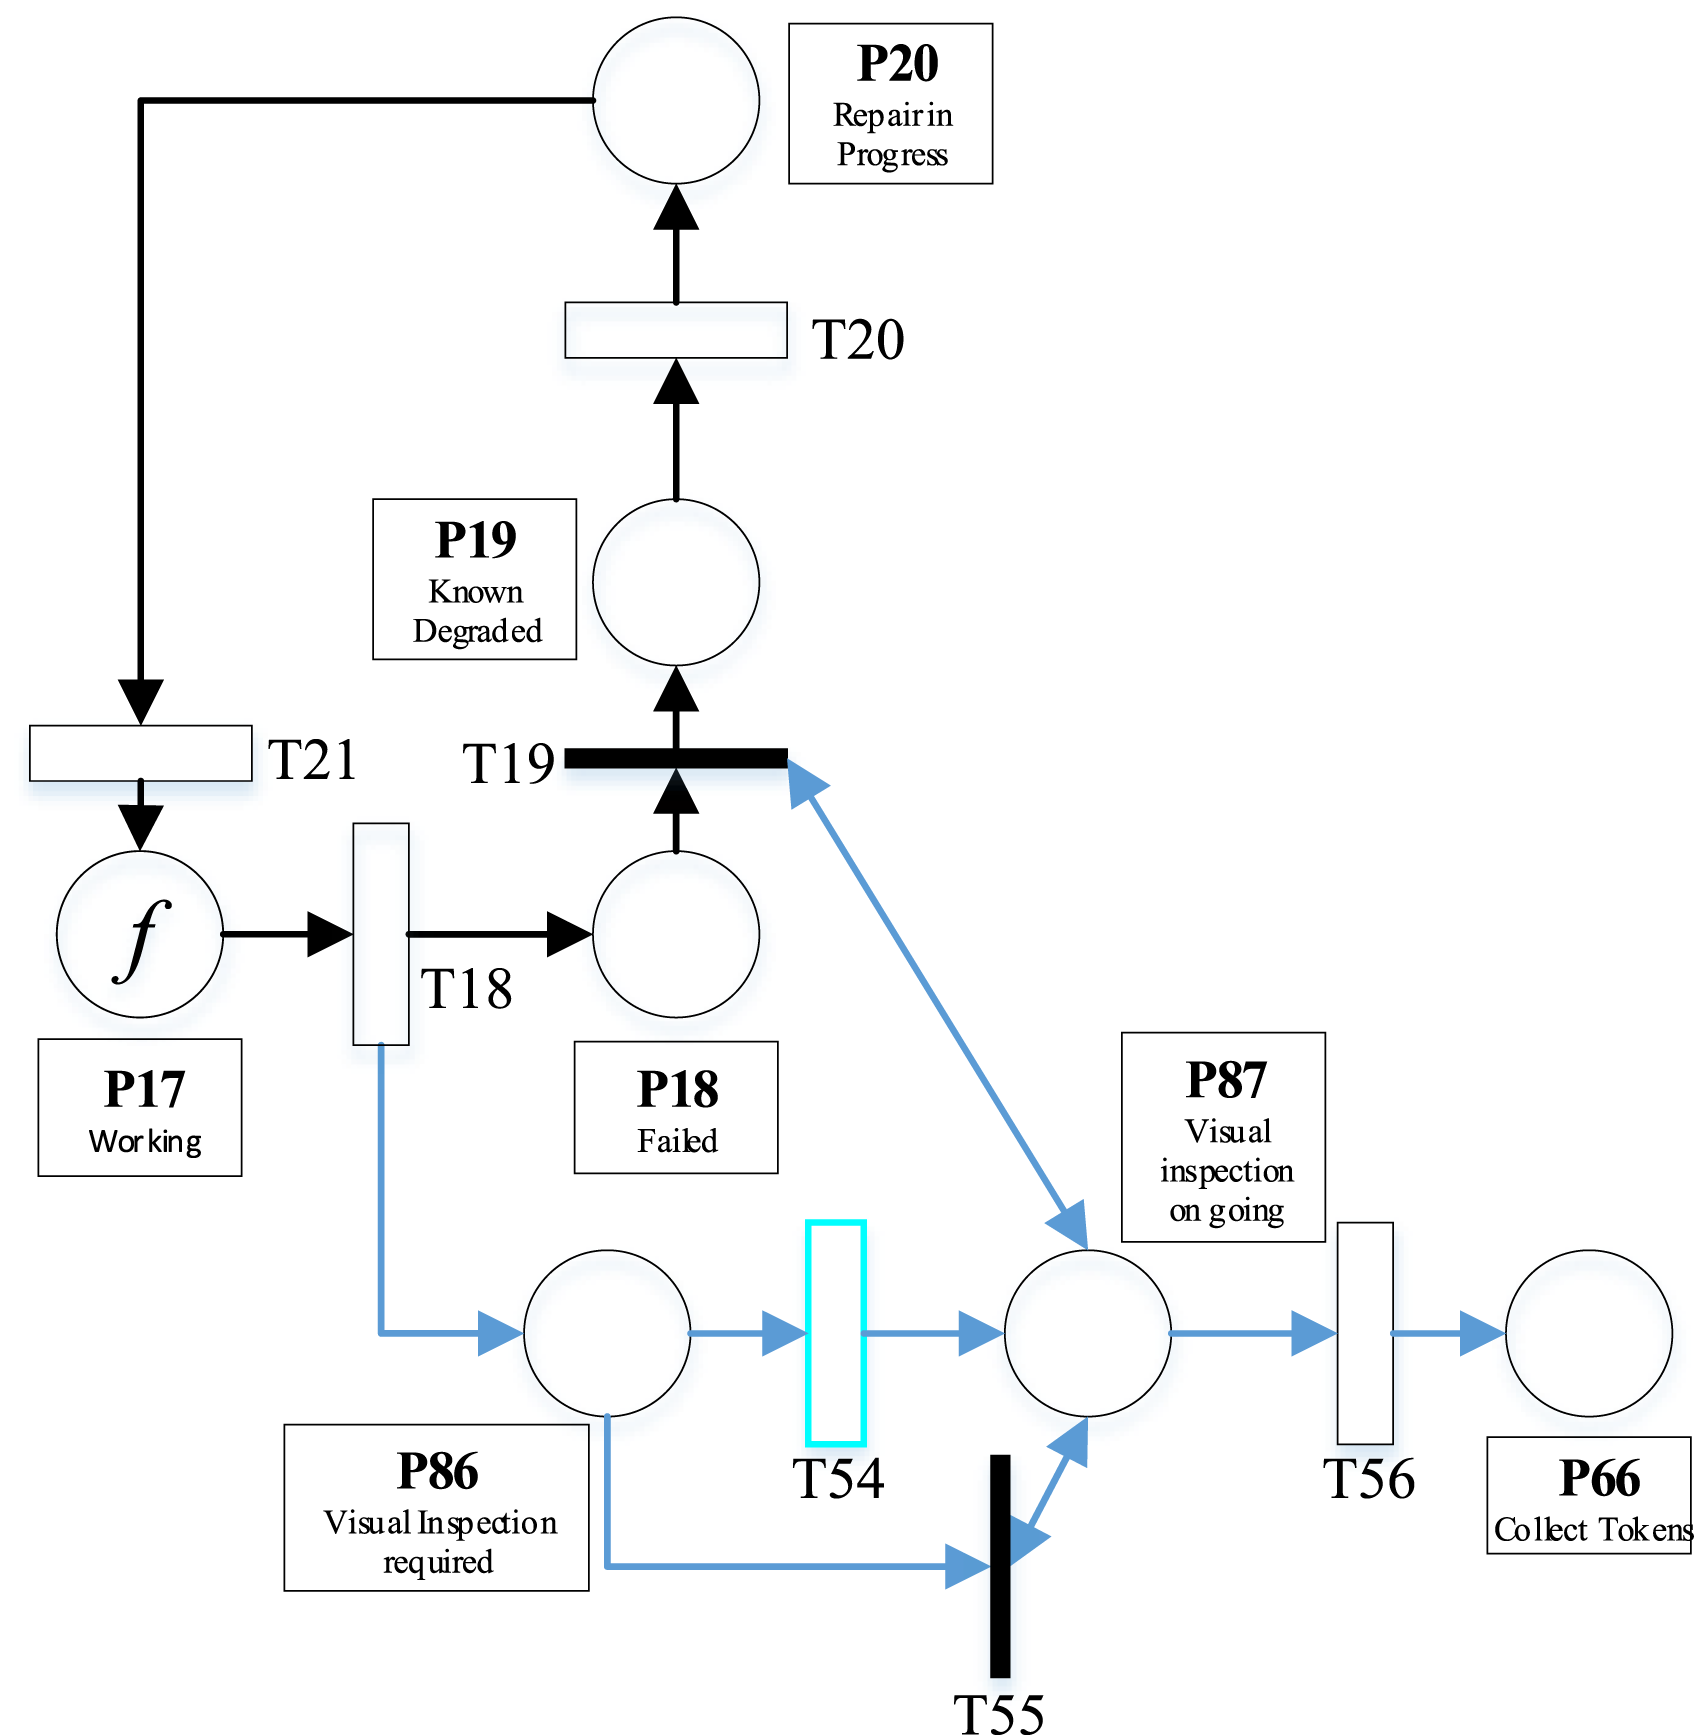
Due to the very low cost of fastenings, 44 when they fail or become degraded, they are simply replaced, and the only form of maintenance considered is replacement (T21).
When inspecting the fastenings, it is assumed that following an inspection the degradation of all fastenings is revealed (all tokens in place P18 moved to P19). Following the degradation of a fastening (firing of T18), place P86 will be marked. Transition T54 is a periodical transition and will fire when a visual inspection is due (T55 is an immediate transition, but is not enabled until P87 is marked). When P87 is marked T19 is enabled, as the arc between T19 and place P87 is a test arc, T19 will continue to fire until all the tokens have been moved from P18 to P19. T56 has a fixed delay ϵ ≪ 1, which ensures that T19 will always fire before T56.
Bearers
The bearer PN is of the same format as the fastening net, with four states: working (P21), degraded (P22), known degraded (P24) and under repair (P25) arranged in a loop. There are a range of reasons for wooden bearer decay including biological attack and fastening damage. 45 Once a bearer becomes defective, it is assumed it is replaced (T22).
Similar to the fastening sub-model, each bearer is represented with a token and the total number of bearers, b, is dependent on the S&C type, with larger layouts containing more bearers. The main difference between the bearer PN and that for the fastenings is that servicing of the bearers is considered in the form of packing. When packing is performed, it does not improve the bearers’ condition but does slow their degradation by disabling the degradation transition (T24) for a period.
Slide chair
The PN used to model the slide chair is of the same format as that for the bearers and fastenings; four states, working (P26), degraded (P27), known degraded (P29) and under repair (P30) arranged in a loop. Similarly, to the fastenings, replacement is the only form of maintenance considered and each slide chair is represented with a token and the total number of slide chairs, c, is dependent on the switch type.
The slide chair model also considers servicing in the form of slide chair oiling. This is one of the most frequently re-occurring S&C maintenance tasks. Slide chair oiling is not assumed to improve the condition but will slow the degradation by inhibiting T30 for a period of time.
Stretcher bar
The structure of the stretcher bar PN is shown in Figure 6. It is again of a similar structure to the fastening and bearer sub-models with four states arranged in a loop and each stretcher bar being modelled by a token. The number of stretcher bars, Σ, varies based on the switch size, with larger layouts having more stretcher bars, the only form of stretcher bar maintenance considered is replacement (T42). Stretcher bar PN.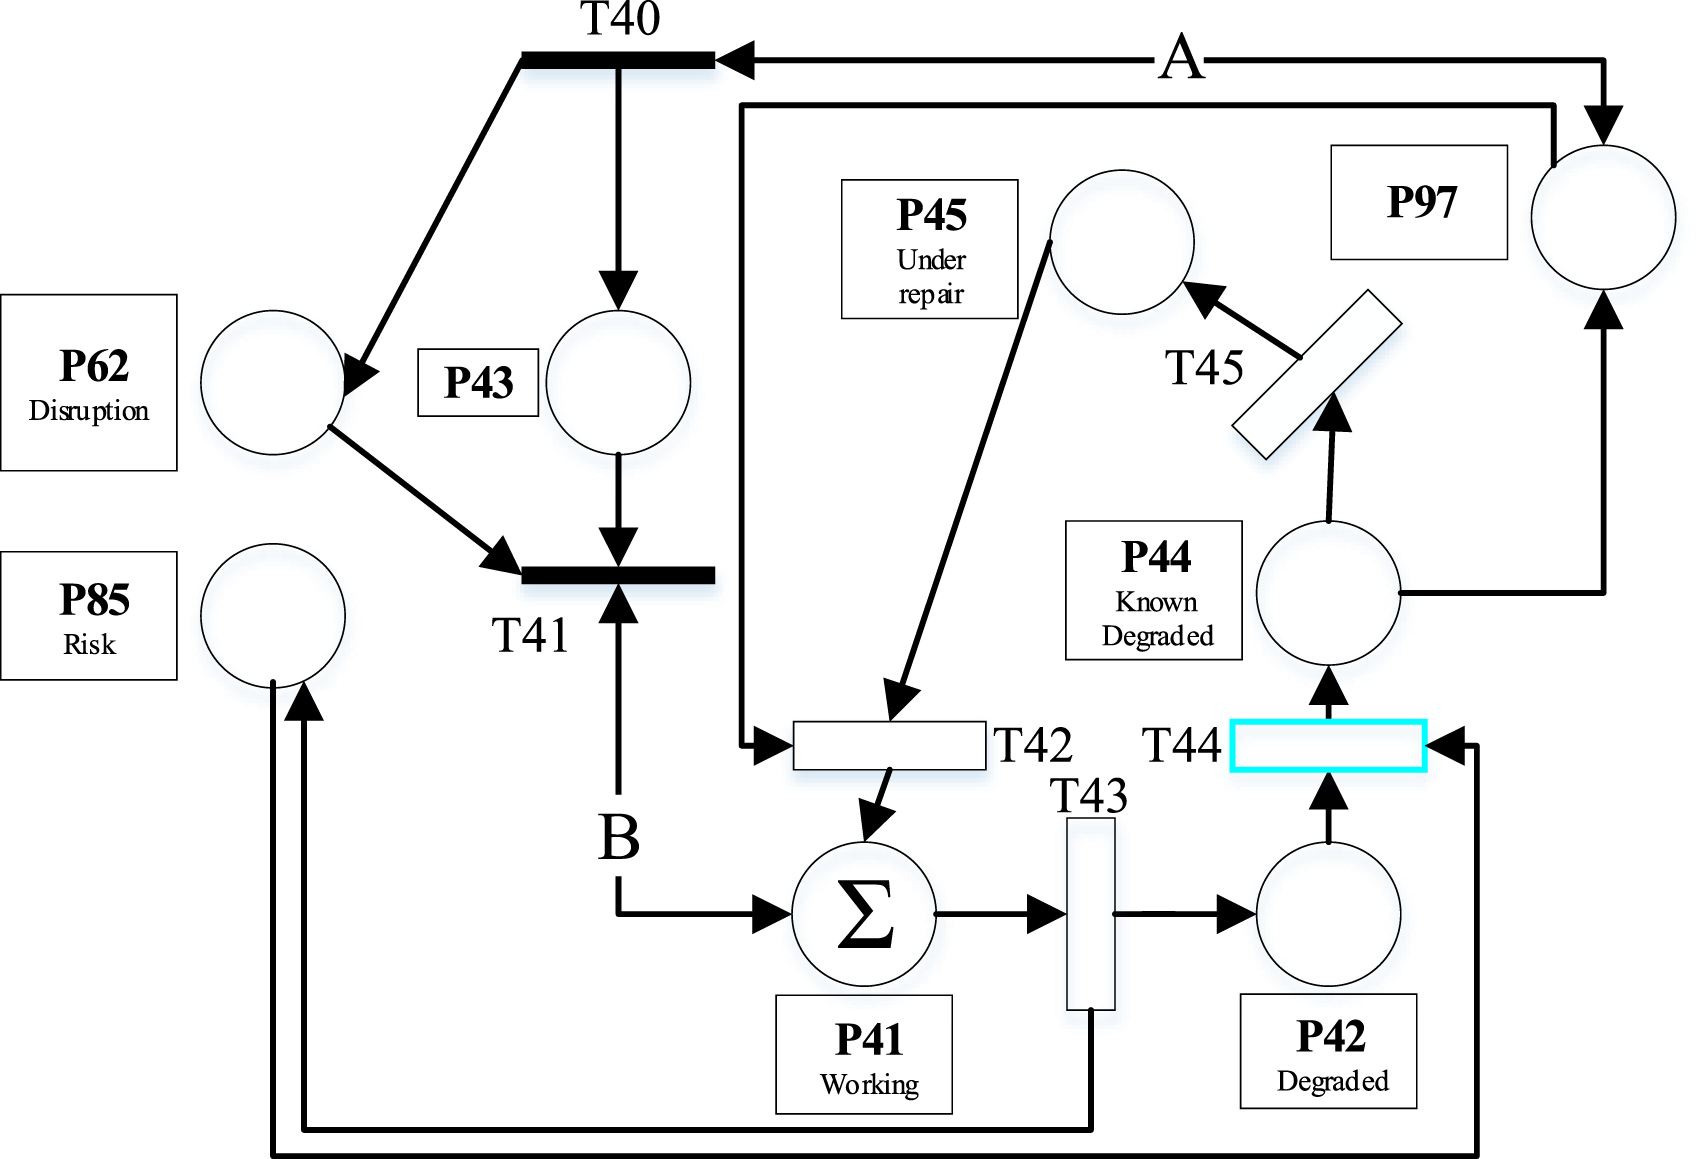
As the stretcher bar are safety critical there are always at least two stretcher bars to provide redundancy. If too many stretcher bars become defective, then it is no longer safe to run trains. If there are more than A tokens in P42 (A is the critical number of stretcher bars that can be defective) T40 will fire immediately marking place P43 indicating the stretcher bars are unavailable, global place P62 will also be marked indicating that the S&C is unavailable. The marking of P62 will only be removed when T41 fires, which occurs once there is at least B stretcher bars in the working state and the marking of P41
Stock rail
The PN used to model the stock rail is shown in Figure 7. The stock rail is modelled as being in one of three condition states: working (P0), minor degradation (P1) or safety limit exceeded (P2). As condition data is not available for the rails, the transition between P1 and P2 is based solely on time. Stock rail PN.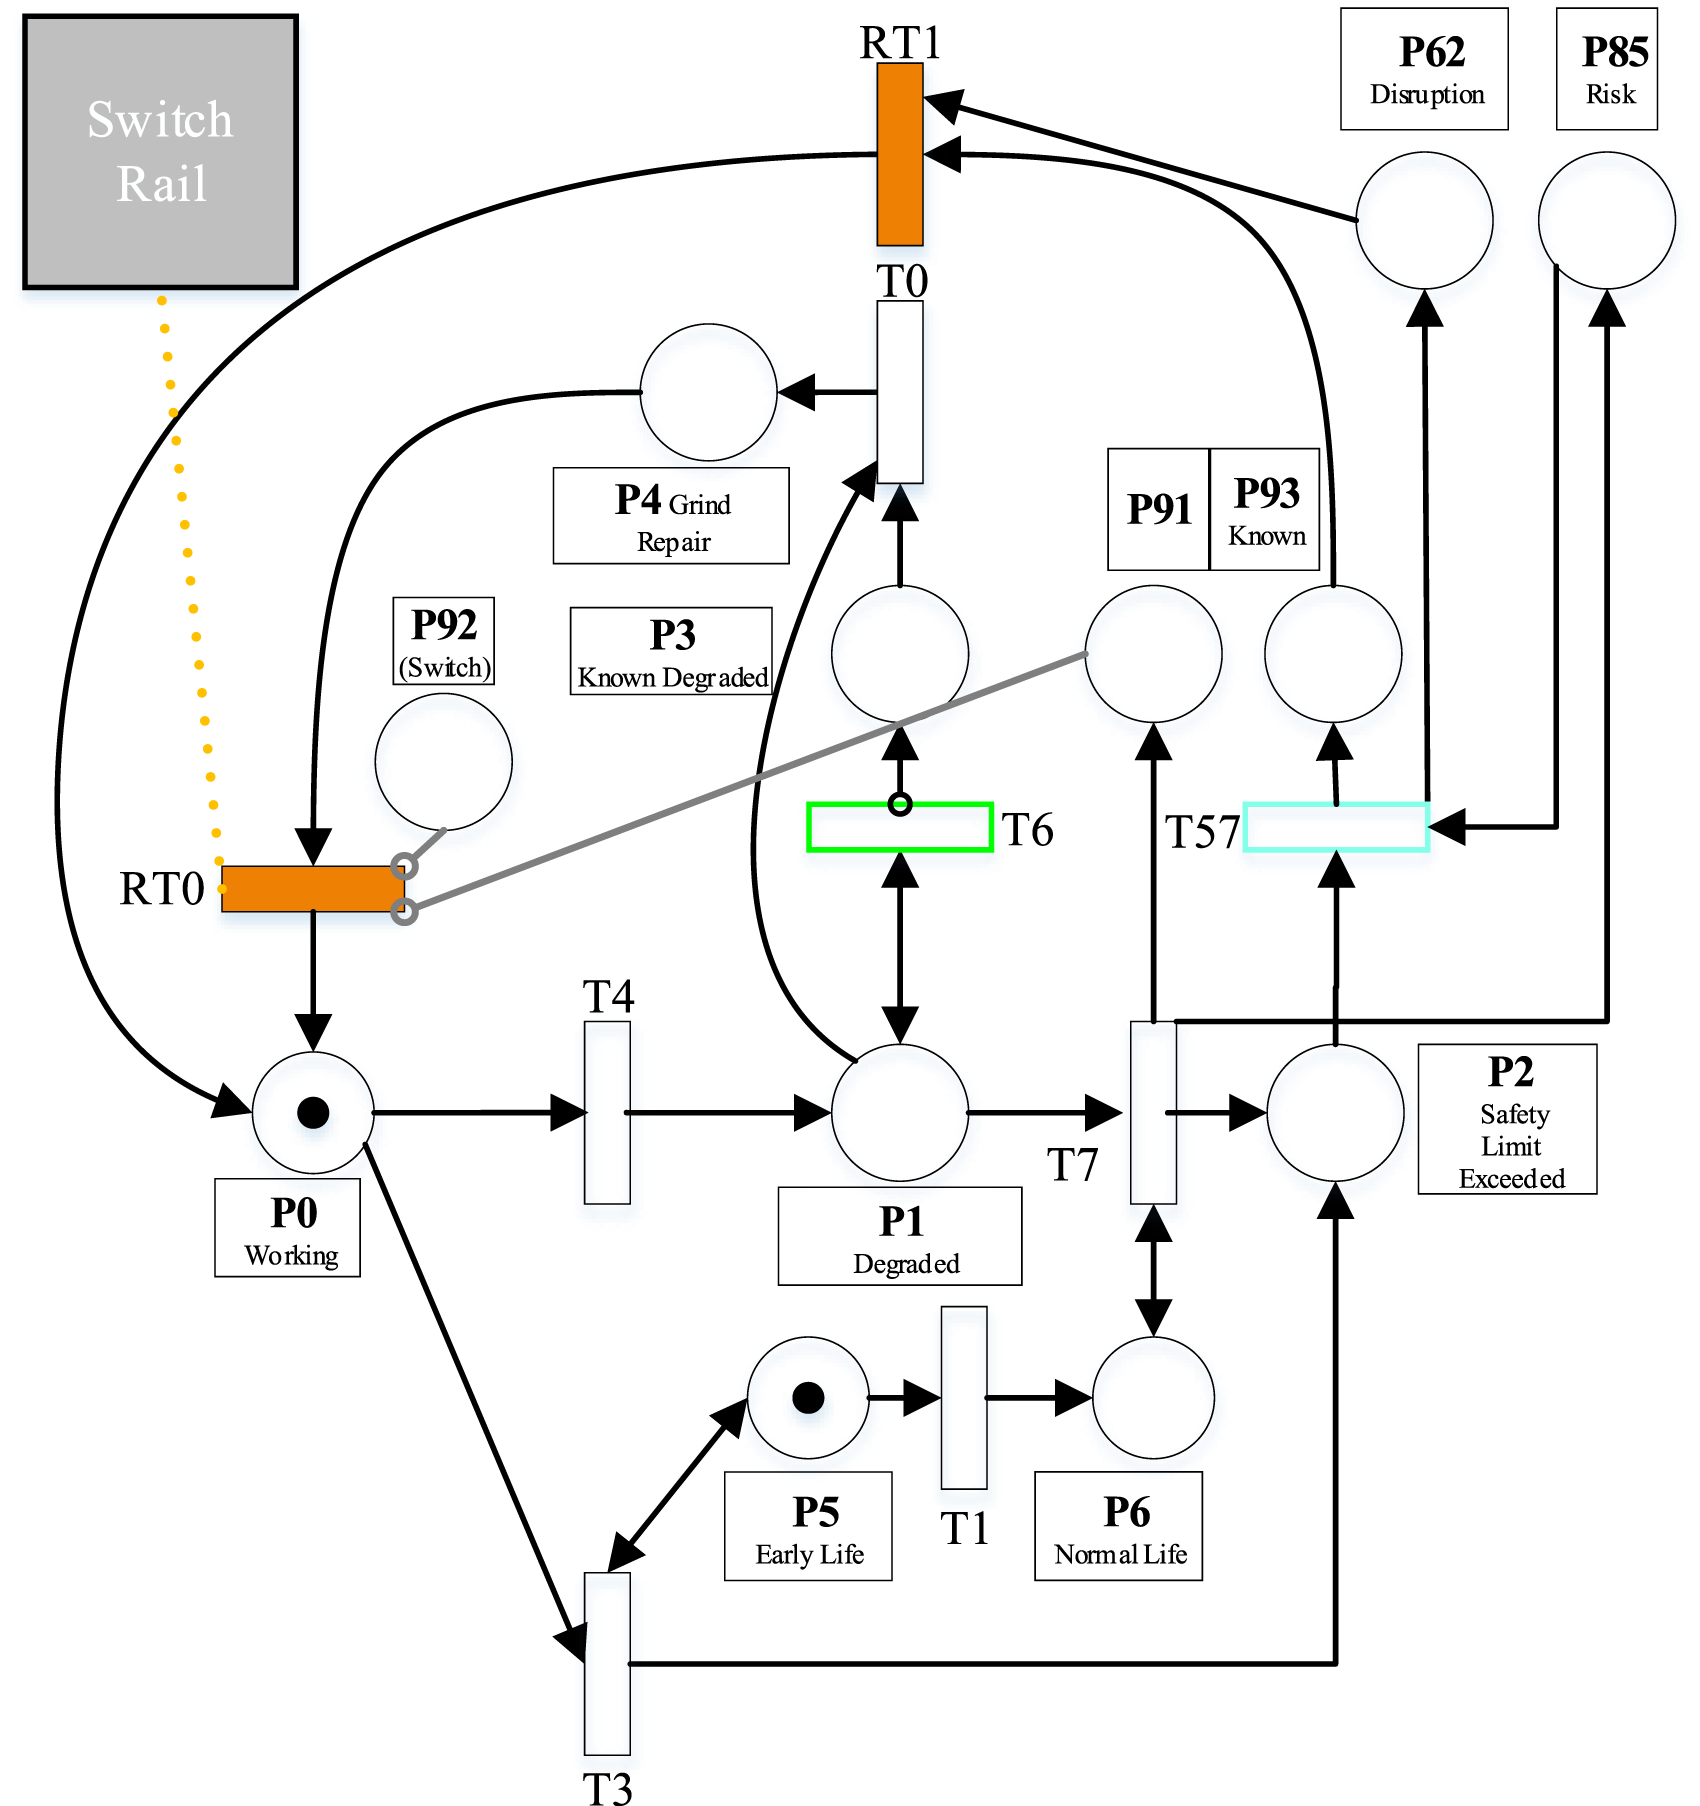
Defects exceeding the safety limit will be revealed following a visual inspection (T57), however minor defects will only be revealed following an ultrasonic inspection (T6). Degradation can be repaired using rail grinding and reprofiling (RT0), for this to be most effective it should be performed on the switch and stock rail simultaneously to ensure the two rails remain correctly aligned. Consequently, the stock rail PN is directly linked to the switch rail PN (see Figure 7). When RT0 fires the condition of the switch rail is also updated. RT0 is inhibited by both P91 and P92 to ensure reprofiling cannot take place if the stock or switch rail has a defect exceeding the safety limit. In this case a weld repair (RT1) is required to rectify the defect and will only affect the stock rail.
The risk due to unrevealed stock rail degradation is also considered, global place P85 is marked when place P2 is marked. If the safety limit is known to be exceeded global place P62 will be marked indicating the S&C is unavailable and that a traffic disruption is occurring. It remains marked until the stock rail is fixed following the firing of RT1.
Analysis of maintenance and failure records revealed the stock rail often experienced a cluster of repairs followed by a substantial period with no maintenance, suggesting a burn-in region. Within the framework, the repair clusters following renewal are modelled as a burn-in region (T3) this is referred to as the early life phase (P5 marked). Following the initial burn in region, the normal life phase is reached (P6 marked). The early life phase occurs straight after renewal (firing of RT13), when in this state it is possible to transition directly between the working (P0) and safety limit exceeded state (P2). Once T1 fires, the stock rail enters the normal life phase and it is only possible to reach P2 from place P1 (via T7).
Switch rail
The switch rails move to allow trains to switch tracks. They are modelled in a similar way to the stock rail, using a two-phase life. Switch rail pivots are regularly lubricated and adjusted to make sure they travel the correct distance such that they fit up against the stock rail correctly. Oiling the pivots is classified as servicing and as such does not improve the condition but slows down degradation. To model this in the PN an additional place was introduced in the switch rail sub-model which, when marked, prevents degradation in the normal phase.
Framework solution and results
The S&C framework is demonstrated through application to a selection of S&C units on the UK railway network and is initially populated using the degradation, failure, maintenance and inspection distributions derived by Litherland and Andrews 13 in the companion paper.
Assumed number of components by switch type.
Bespoke C++ software was written to solve the PN system model using Monte Carlo simulation. 100,000 simulations were performed for a 50 years simulation length (a typical appraisal timeframe), for the eight different switch types. The model outputs the number of inspections, maintenance interventions, failures, services and renewals as well as the number of days the S&C unit is unavailable and the number of days with high risk (when component degradation is unrevealed).
Mean [standard deviation] of defects exceeding the Safety limit, maintenance interventions, services, renewals and inspections as well as the number of days of unavailability and high risk, over a 50 year period, based on 100,000 simulations.
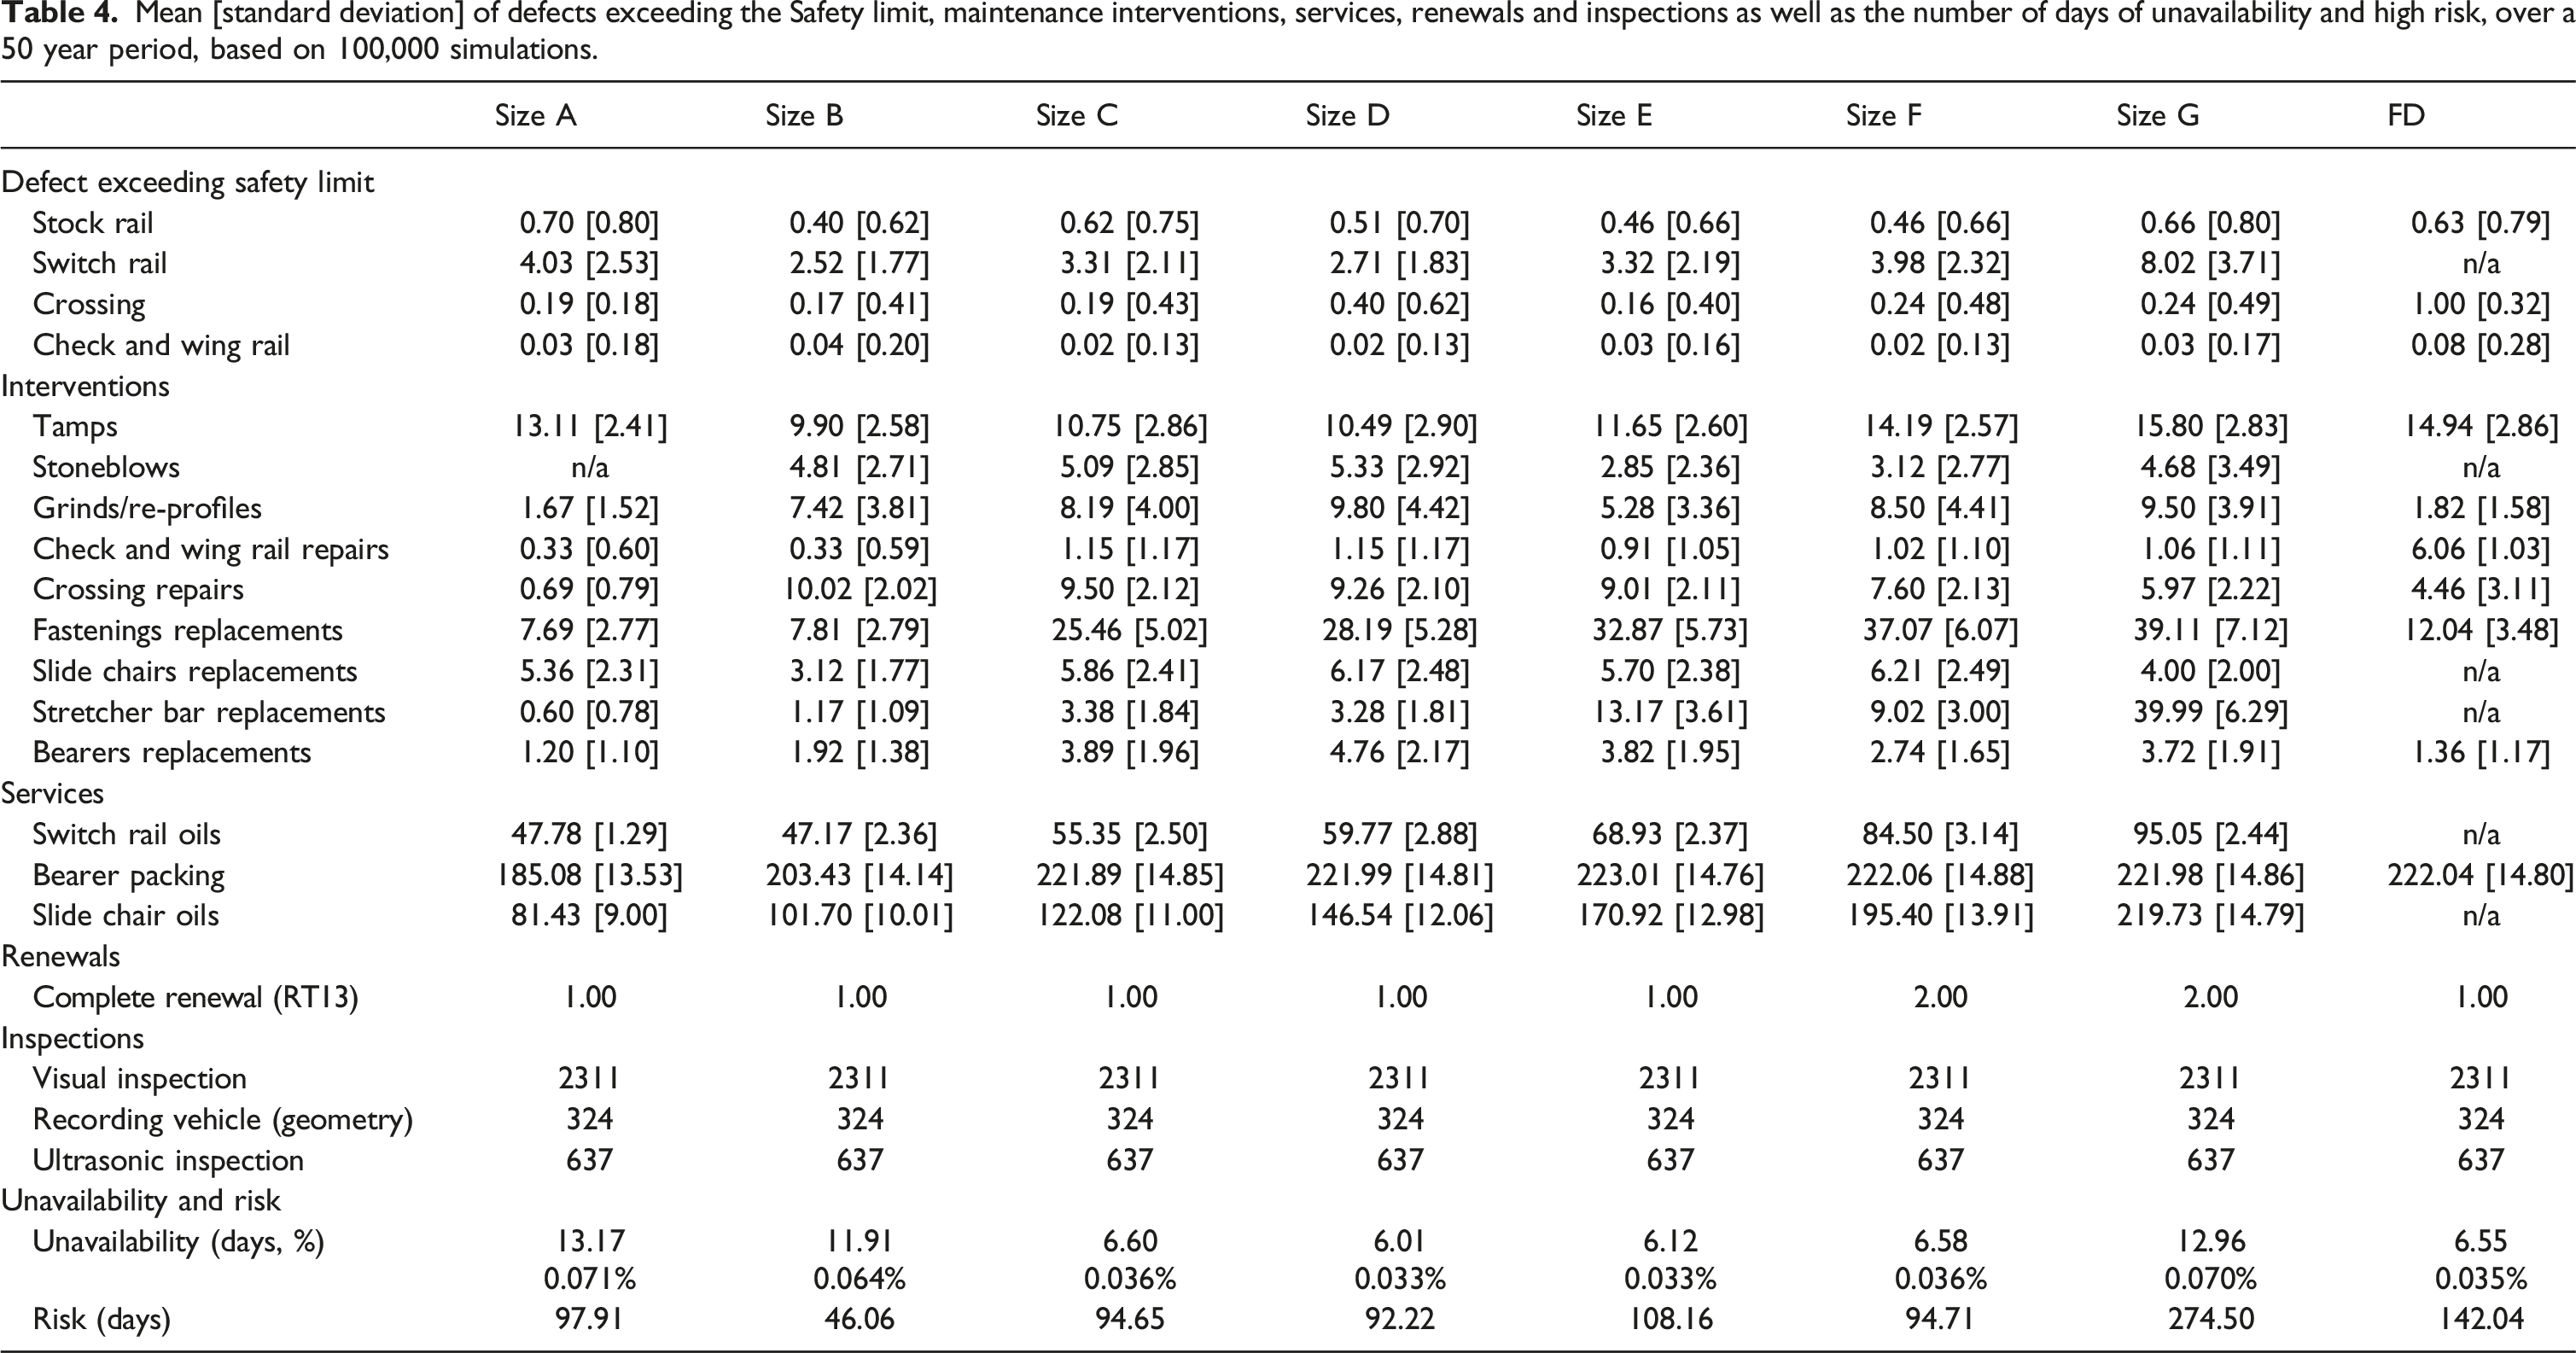
There is a stronger trend between switch size and number of maintenance interventions, with larger turnout layouts generally having more maintenance, size G has the highest volume of fastening replacement, slide chair replacement, stretcher bar replacement and tamping. Size C and D seem to break the trend slightly with high volumes of bearer replacement, check and wing rail repair and stoneblowing. The volume of servicing appears closely linked to switch type, mainly caused by the larger switch types having more components that require servicing. Switch size F and G are assumed to have a mean service life of less than 25 years and as such have two replacements during the observation period. As a fixed inspection is assumed, the number of inspections is the same for all.
Figure 8 shows how the maintenance totals listed in Table 4 are broken down into 16 weeks (112 days) periods over the 50 appraisal year periods. It includes maintenance to repair defects exceeding the safety limit (failures). The two stage, decreasing deterioration rate, for the stock and switch rails can clearly be seen, with a sharp decrease in maintenance immediately following renewal, followed by a gradual decrease. The volume of ballast work increases with time as performing ballast maintenance degrades the quality of the ballast and accelerates deterioration. As the slide chairs, fastenings, stretcher bars and bearers are modelled using a Poisson process their maintenance frequency remains constant throughout. For all turnout layouts, there is a slight increase in the crossing maintenance as the switch ages, which is to be expected as the time to degrade is modelled using a Weibull distribution with shape factor greater than unity. PN S&C asset management framework solution: maintenance frequency per 16 weeks.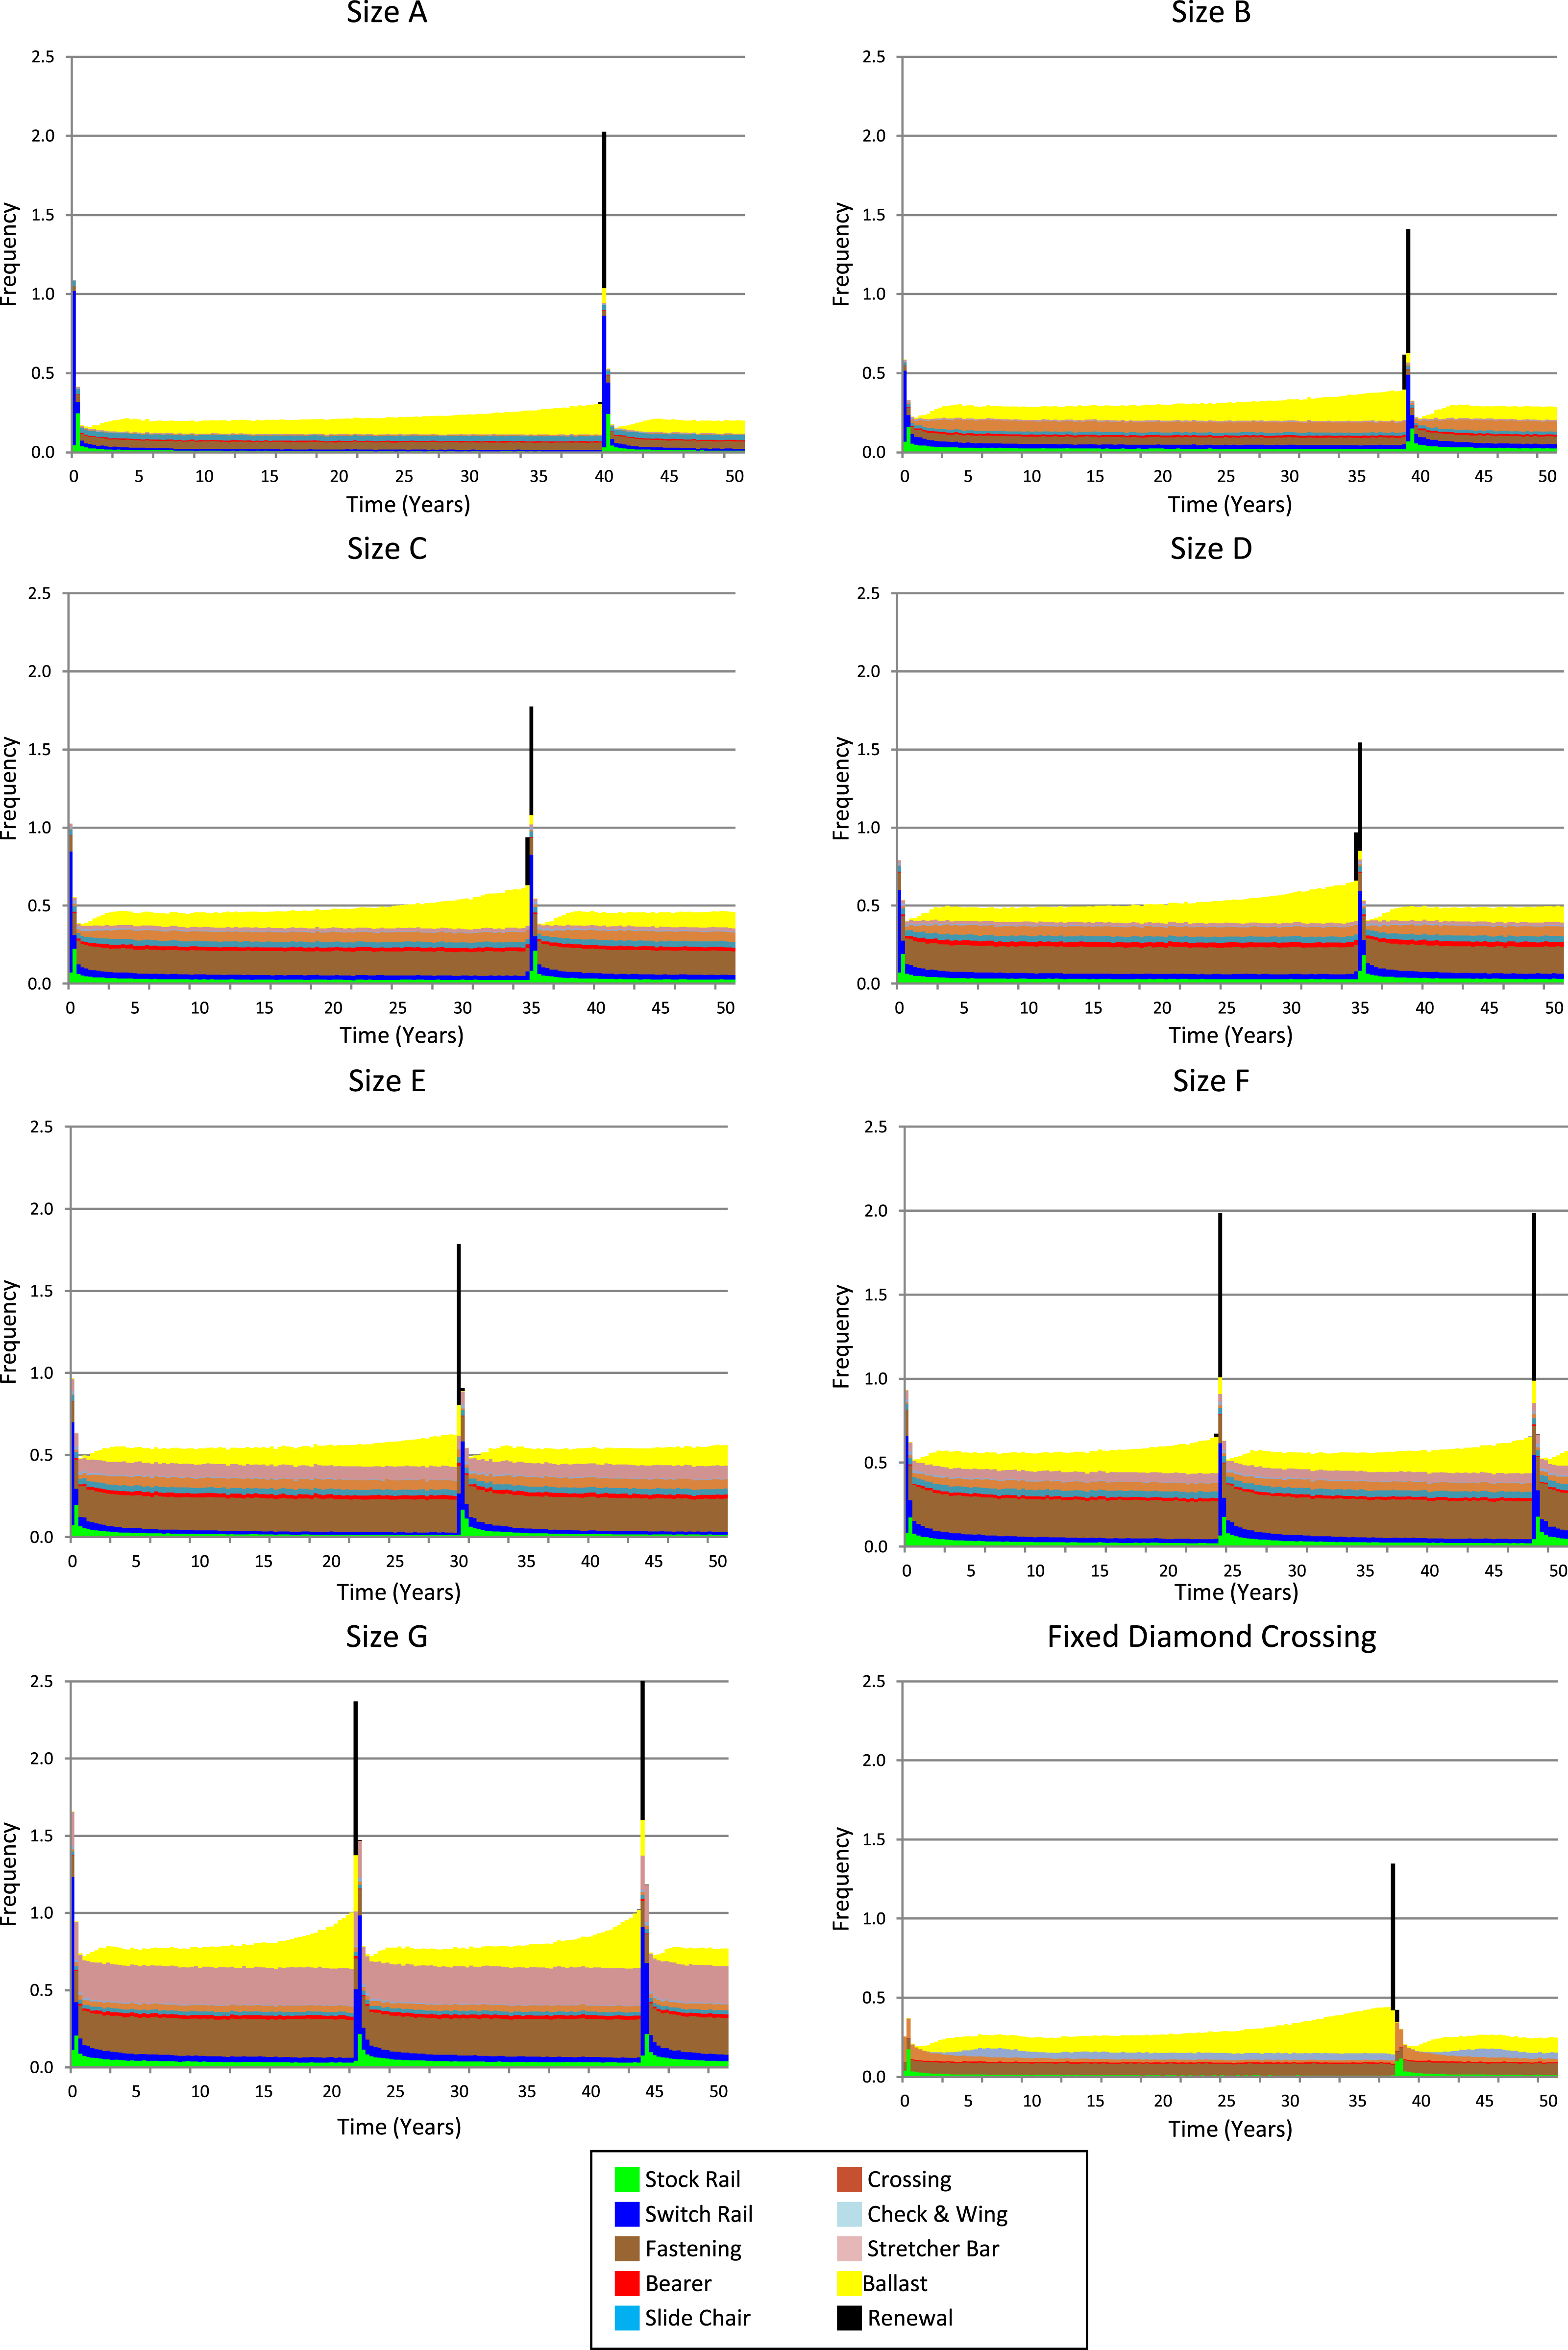
To assess the convergence of the model the following costs units were assigned to the interventions listed in Table 4: renewals (100 units), defects exceeding safety limit (failures) (50 units), interventions (5 units), services (2 units) and inspections (1 unit). The total number of cost units was assessed after each simulation and a running average calculated, this was used to assess the convergence of the model. The convergence of the PN for a size C turnout is shown in Figure 9. For the size C turnout the model was viewed as converged after around 13,000 simulations, when the width of the 95% confidence interval was less than 0.1% of the mean. After 100,000 simulations the width of the 95% confidence interval was around 0.03% of the mean. Convergence of the PN and 95% confidence bounds for size C turnout.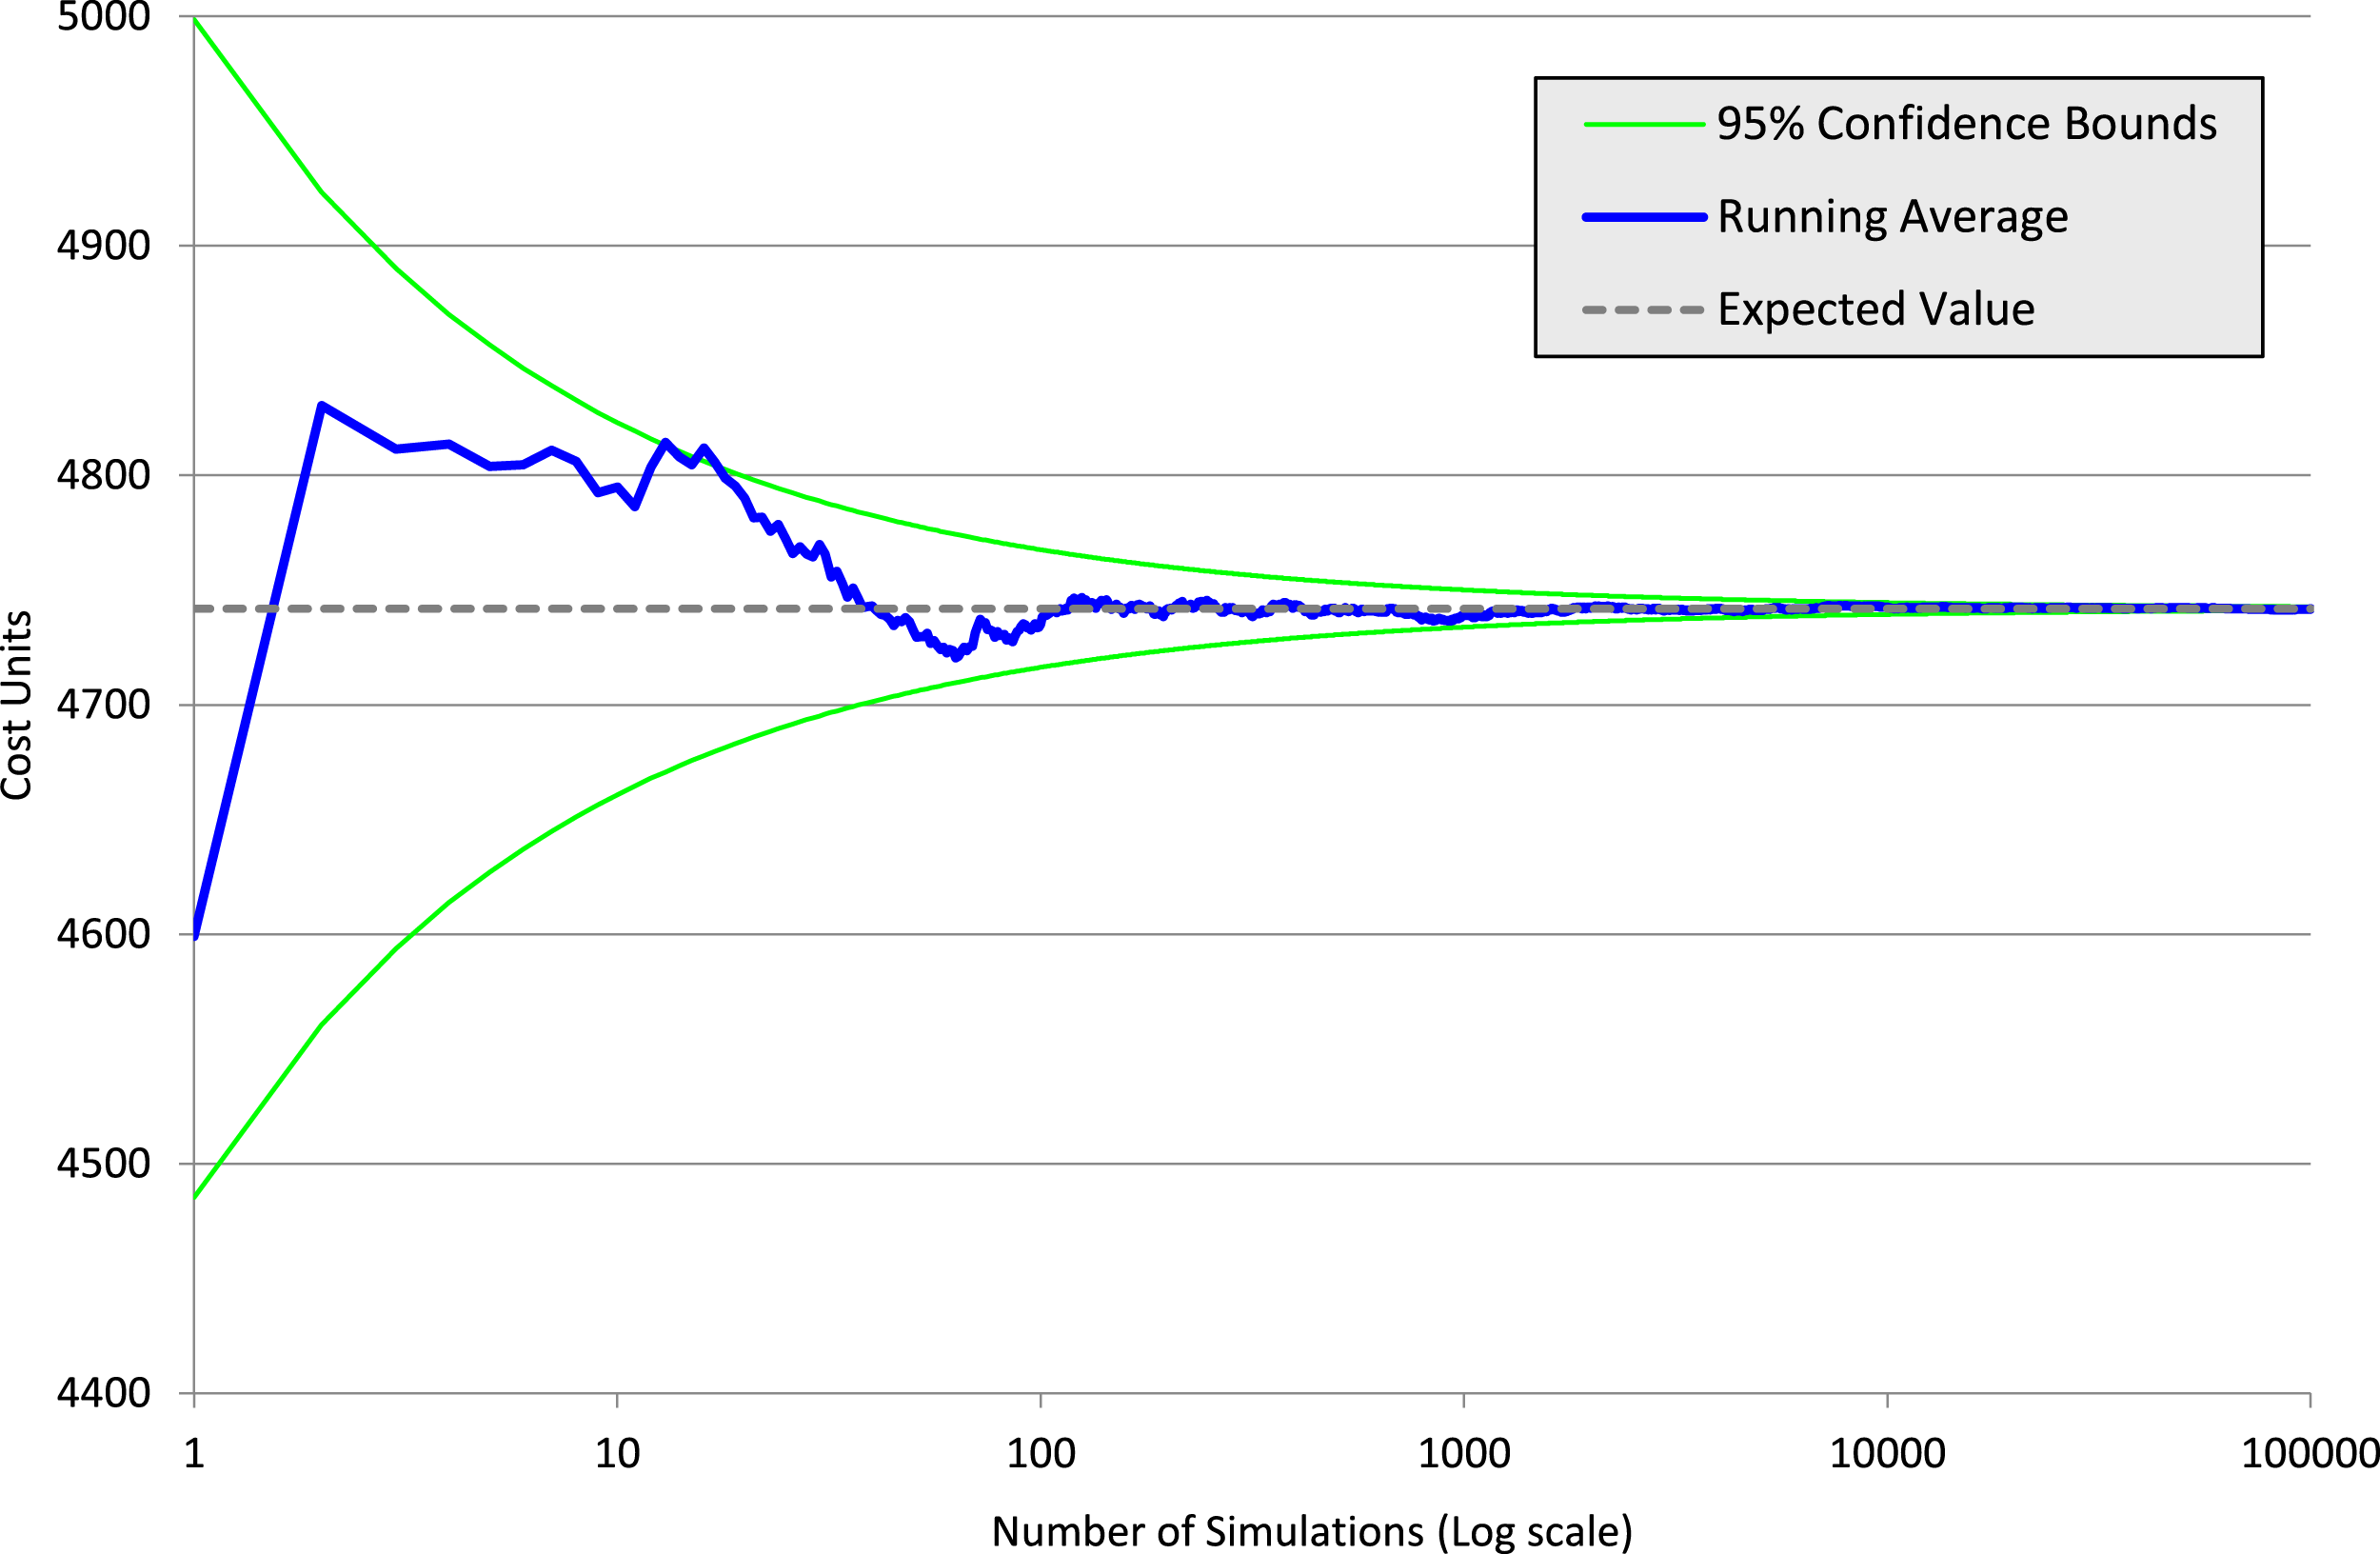
Conclusions
This paper introduces an asset management framework for railway S&C. The framework comprises a PN model containing nine sub-models for the various components within an S&C unit, the framework is populated using the values determined by Litherland and Andrews. 13 It predicts the expected number of inspections, maintenance interventions, failures and services, as well as the number of days the S&C unit is unavailable.
The model was simulated for various different switch types. It was concluded that switch type had a significant impact on the number of maintenance interventions and level of servicing required, with larger switch types requiring more maintenance and more servicing. However, little correlation was found between the switch size and the number of failures. The results showed that size A and G turnouts had similar reliability with an average unavailability of 0.07%. The authors have concluded from this that other factors such as age, tonnage, superstructure and number of operations are likely the main factors contributing to the number of failures; nonetheless it is still likely that switch size does have some impact.
As a future study the authors would be keen to undertake a sensitivity assessment to understand the key factors that influence the S&C availability, as well as understanding the impact of factors such as number of operations and train loading on availability. The authors also plan to link the PN model proposed in this research with models for other assets to allow a network wide assessment of the LCC to be conducted.
Supplemental Material
Supplemental Material - A Petri net asset management framework for railway switches and crossings
Supplemental Material for A Petri net asset management framework for railway switches and crossings by Jack Litherland and John Andrews in Proceedings of the Institution of Mechanical Engineers, Part F: Journal of Rail and Rapid Transit
Footnotes
Declaration of Conflicting Interests
The author(s) declared no potential conflicts of interest with respect to the research, authorship, and/or publication of this article.
Funding
The author(s) received no financial support for the research, authorship, and/or publication of this article.
Supplemental Material
Supplemental material for this article is available online.
References
Supplementary Material
Please find the following supplemental material available below.
For Open Access articles published under a Creative Commons License, all supplemental material carries the same license as the article it is associated with.
For non-Open Access articles published, all supplemental material carries a non-exclusive license, and permission requests for re-use of supplemental material or any part of supplemental material shall be sent directly to the copyright owner as specified in the copyright notice associated with the article.