
Abstract
In railway systems, switch rails are one of the key components of switches & crossings (S&C). They are controlled by switch machines to guide trains from one track to another. Due to the discontinuity in geometry, switch rails are exposed to high-impact loads as train wheels pass through. The long-term impact loads can cause local plastic deformation. These faults, and general alignment changes, can lead to the development of a gap between the switch rail and the stock rail known as a toe gap, as well as non-optimal contact with the wheel flange, both of which can endanger the safe operation of passing trains. Currently, periodic visual inspection is the main method for detecting these defects. This is not efficient or reliable enough to support the ever-shortening maintenance windows available in modern railway systems. The development of computer vision technologies and constantly improving processors make it possible to monitor the health status of such safety-critical components in real time. This research proposes a line-side condition monitoring approach for the switch rail. With the use of dedicated identification algorithms, the status of the switch rail, including movement, position, toe gap and the edge of the toes, can be monitored remotely in real time. This approach has been tested in a high-speed train testing centre in China. The results show a capability to further improve the safe operation of S&C while simultaneously reducing the cost and increasing the safety of inspection.
Introduction
Rail inspection plays a vital role in ensuring the normal operation of railway networks, especially for safety-critical components. One such key system is switches & crossings (S&C) which enable trains to change routes through the network. Figure 1 shows a single S&C arrangement and its main components, with sleepers/bearers omitted for clarity.
1
The complicated structure of S&C and their role at junctions within the network expose them to higher working loads than plain track, and thus they tend to have a shorter life span.
2
Therefore, more frequent inspection of S&C is needed to ensure the normal operation of the rail network. Simplest structure of S&C.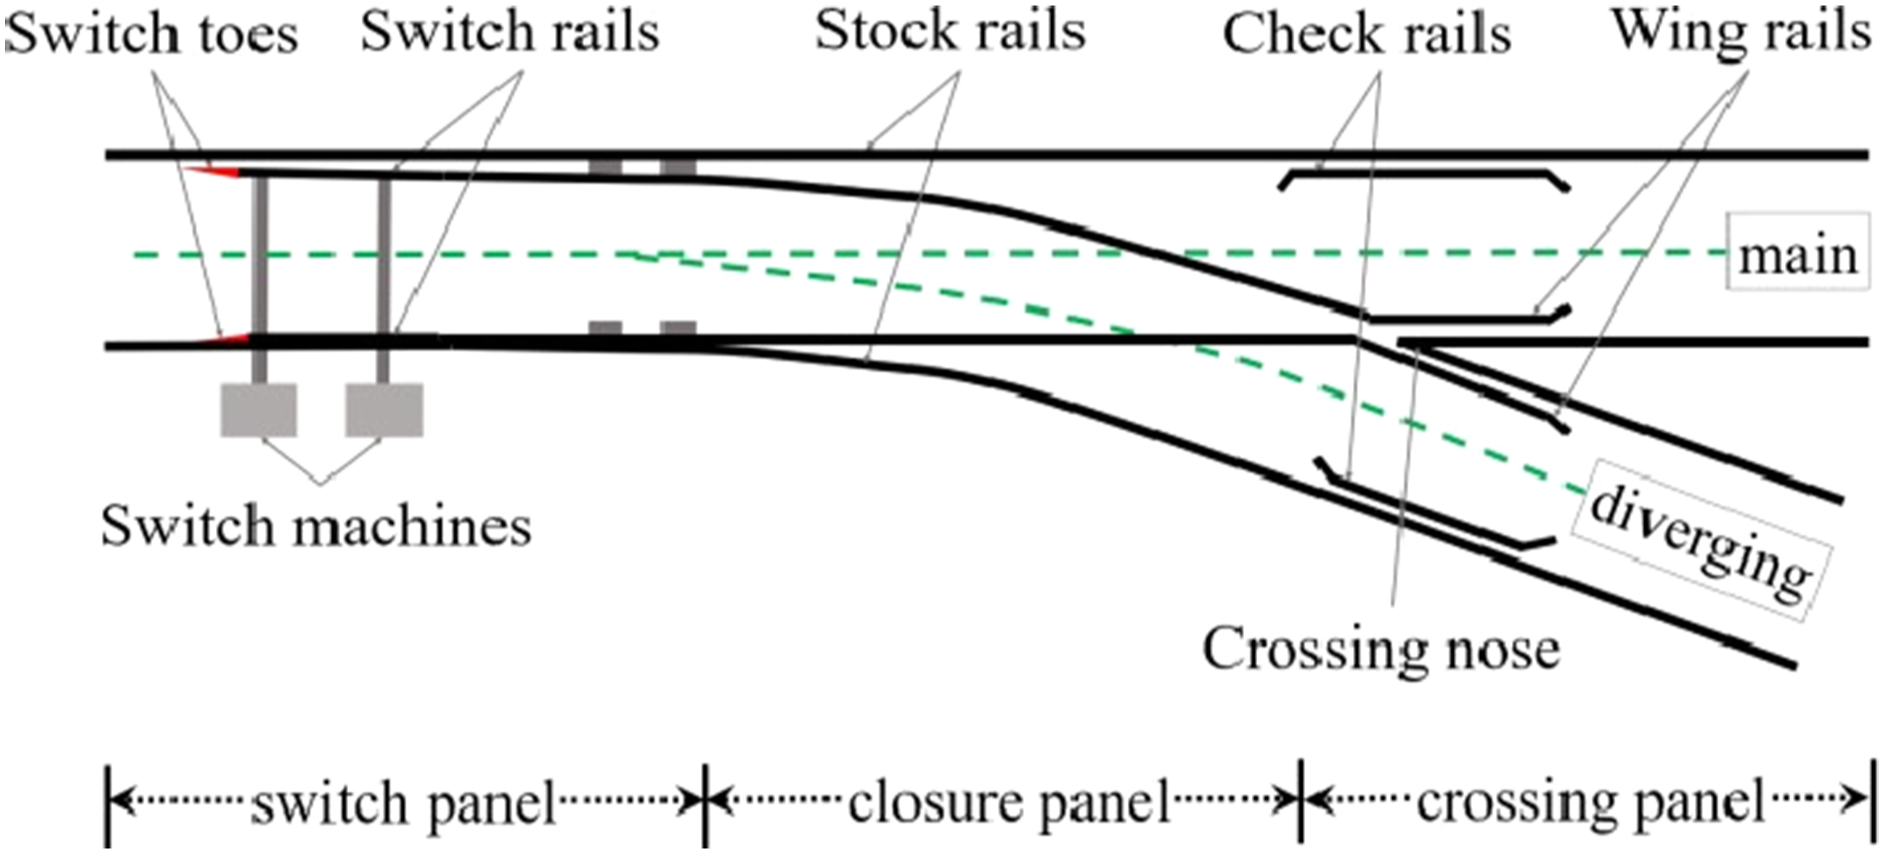
According to the statistics from the International Union of Railways (UIC), the cost of maintenance for every S&C unit is equal to that for about 0.3 km of plain track. 3 Except for switch machines, the cost of maintaining and replacing the switch rail accounts for a large proportion. 4
As a transfer area for train wheels, the switch rail is exposed to high-impact loads as trains pass through. Even with the use of advanced alloys, the long-term impact loads can still cause abrasion, and a plastically deformed lip is prone to forming at the switch rail toes. 5 Defective switch rail toes can lead to incorrect lateral alignment with the stock rail, which is characterised by a small gap between the switch and the stock rail known as a toe gap. Excessive toe gaps can lead to non-optimal contact with wheel flanges as wheels travel from the stock rail onto the switch rail. For example, wheel flanges can strike the switch rail with higher impact loads and make the switch rail ‘crawl’ along the longitudinal direction of the stock rail, which can endanger transit safety, or in extreme cases the toe gap can be further split by the wheel flange and even direct the train to the wrong route. 3
Traditionally, the inspection of these defects is mainly based on periodic visual inspection undertaken by human operators complying with corresponding standards (e.g. Network Rail’s NR/L2/TRK/001 Inspection and Maintenance Permanent Way). 6 Inspection of the switch rail normally includes two parts: 1) to check the contact angle between the switch rail and the stock rail, using mechanical gauges such as a TGP8 gauge and 2) to measure the toe gap between the stock rail and the closed switch rail, using cant sticks such as a track gauge. However, manual inspections are normally characterised by low efficiency, and their reliability is susceptible to human errors. 7 For example, poor maintenance of S&C led to abnormally positioned switch toes which caused a train derailment at Potters Bar in the UK on 10 May 2002 which killed seven and injured 76. Since then, numerous researches have been carried out both in universities and industrial railway organisations to develop automatic inspection solutions to replace or reduce the dependence on manual inspection. Fundamentally, conventional manual inspections mainly involve visual identification of rail faults and rail profile measurements, and thus most of the automatic inspection systems using camera and laser-based measuring units to replace such operations, which can be mounted on trains,8,9 rail vehicles,10,11 trolleys,12,13 or hand-held. 14 For example, Network Rail’s New Measurement Train (NMT), which equipped with an array of lasers and cameras. It can measure rail profiles and identify rail faults periodically at train speeds. 8 The vehicle-based ‘Switch Inspection & Measurement’ (SIM) wagon developed by Eurailscout is advertised as having the capability of inspecting 100 S&C in less than 6 hours. It includes eight charge coupled device (CCD) cameras and a laser measurement unit. The system can be used to check various parameters including missing fasteners, track gauges and flangeway gaps. 10 Compared to manual inspection methods, these automatic systems do considerably improve the efficiency of inspection. However, one of the main limitations of these inspection systems is the fact that they need to be scheduled in the train timetable, which impacts normal train services. Meanwhile, they cannot support continuous inspection and monitoring of S&C. Therefore, there is still a risk of missing developing rail faults or deterioration of S&C, especially under increasing traffic density and with the decreasing inspection and maintenance windows available in modern railway systems.
There are also some fixed monitoring systems which include the installation of a wide range of sensors for continuous S&C condition monitoring.15–17 As an example, the position of the detection rod connected to a switch machine can be monitored with displacement sensors or CCD cameras to reflect the real-time toe gap.16,17 These methods can detect excessive toe gaps caused by mechanical failures such as incorrect adjustment of the driving and locking devices, but cannot monitor the condition of switch rails directly. For example, a deformed switch rail adjacent to the switch toe and excessive toe gaps caused by this could still be an insidious problem. This has been increasingly reported as one of the major concerns that require more frequent and direct inspection. 18
In recent years, the development of computer vision technologies and constantly improving processors have paved the way for the application of vision-based condition monitoring systems into more challenging areas. In the railway, such systems have also been applied to provide more accurate and effective condition monitoring solutions.19–22 An example is the overhead track detection and gauge measurement system proposed by Singh et al.,
21
which employs computer vision-based monitoring through drone imagery. Z. Liu et al.
22
proposed a vision-based monitoring approach for catenary support components using fixed high-resolution cameras and LED lights. By exploiting specific inspection algorithms, these systems can achieve automatic condition monitoring and fault detection with reduced human involvement, which is efficient and cost-effective, and is a recognised target for future rail condition monitoring applications. Accordingly, a vision-based real-time switch rail condition monitoring prototype is proposed in this research. The main contributions can be summarised in the following three points: (1) A line-side and non-intrusive vision-based condition monitoring prototype is proposed for switch rail condition monitoring and fault detection, which satisfies the relevant requirements for high-speed rail inspection equipment. (2) The system can monitor the conditions of switch rails including movement, position, toe gap and the edge of the toes in real time through embedded algorithms. (3) Through the monitoring of switch rails on both sides, a real-time trajectory that reflects the status of the S&C (position and route setting) can be built, which can work as a supplement to existing inspection devices.
The following Measurement system introduces the structure of the system. Methodology illustrates the methodology of the vision-based switch rail condition monitoring and inspection including object detection and tracking and switch rail evaluation. The testing results are analysed in Field Test Results. Discussion discusses some external factors that may influence the effectiveness of the system. Conclusion summarises the work.
Measurement system
The data acquisition system mainly consists of a pair of high-resolution CCD cameras with external infrared (IR) lights and an embedded PC for communication and data transfer. To obtain a clear view of the switch rail, and to have minimal impact on the existing systems, the cameras can be installed line-side or mounted on the overhead line structure. Considering the visibility of both toe gaps and the edge of switch rail toes, the cameras in this research are fitted on the line side. The CAD model shown in Figure 2 illustrates the relative position of the camera modules (A and B) installed at the line side of a railway switch system. All the components are fitted into a customised metal case to protect the camera, provide vibrational damping, ensure its absolute position and maintain the cleanliness of camera lenses. The dashed lines indicate the corresponding target of each camera module. The system outputs images at a resolution of 1920 × 1080 at a frame rate of up to 30 frames per second. To comply with the relevant safety requirements for line-side equipment in the country where the field tests were conducted (China),
6
the camera module is set 2.40 m away from the midpoint between the stock rails and at a height of 0.55 m. A zoom lens and focussing system are added to the cameras to ensure high-quality images while focussing more tightly on the target objects to reduce the computational complexity associated with processing the wider background. CAD model of the proposed system.
Methodology
To accurately measure the toe gap, a number of elements are required. The system must be able to locate the switch and stock rails and to track the switch rail to ascertain when it reaches the lateral position associated with locking. Additionally, deformation on the switch rail may distort results and so it is necessary to identify its status when locating the switch rail. These activities are presented in the following sub-sections.
Detection of the switch rail
In computer vision, object detection is the process of finding instances of an object in images or video frames based on its features. These features could be colours, edges and corners and can be described as quantitative attributes by using numerous feature descriptors such as Speeded Up Robust Features (SURF) and Maximally Stable Extremal Regions (MSERs).
23
These features form distinguishable patterns to help detect and locate the object. Accordingly, such descriptors were considered in the experimental stage of this work in order to establish those most suitable for inclusion in the final system. Figure 3 shows an example of lab. testing results for detecting and matching the SURF features on the locking nut of the driving rod, through which the movement of the switch rail can be inferred. This method performs well in the lab. where the working conditions of S&C are stable. However, the complicated working conditions of S&C in the real world such as weather conditions, background clusters and different S&C types make this challenging for final deployment. These factors can affect both the stability and the accuracy of detection. Considering the robustness requirements of the system, one alternative solution would be to apply marker points to assist the detection of the object.
24
This approach is used extensively in other domains such as surgical instrument tracking and augmented reality.25,26 A reference marker points-based method is therefore applied in this research. Figure 4 illustrates the framework of this method. Figure 4(a) shows initial example video frames captured in a high-speed train testing centre in China in the daytime and at night, respectively. The marker point (attached on the switch rail toe) is an IR-reflective round patch (30 mm diameter) with a black contour to facilitate detection with increased contrast against the background, especially at night when the external light dims. SURF-based switch rail detection. Framework of the maker points-based switch rail detection (a) initial video frames captured in the daytime and at night, (b) V-channel intensity analysis and partial enlarged views, (c) detection results in binary images and (d) switch rail localisation.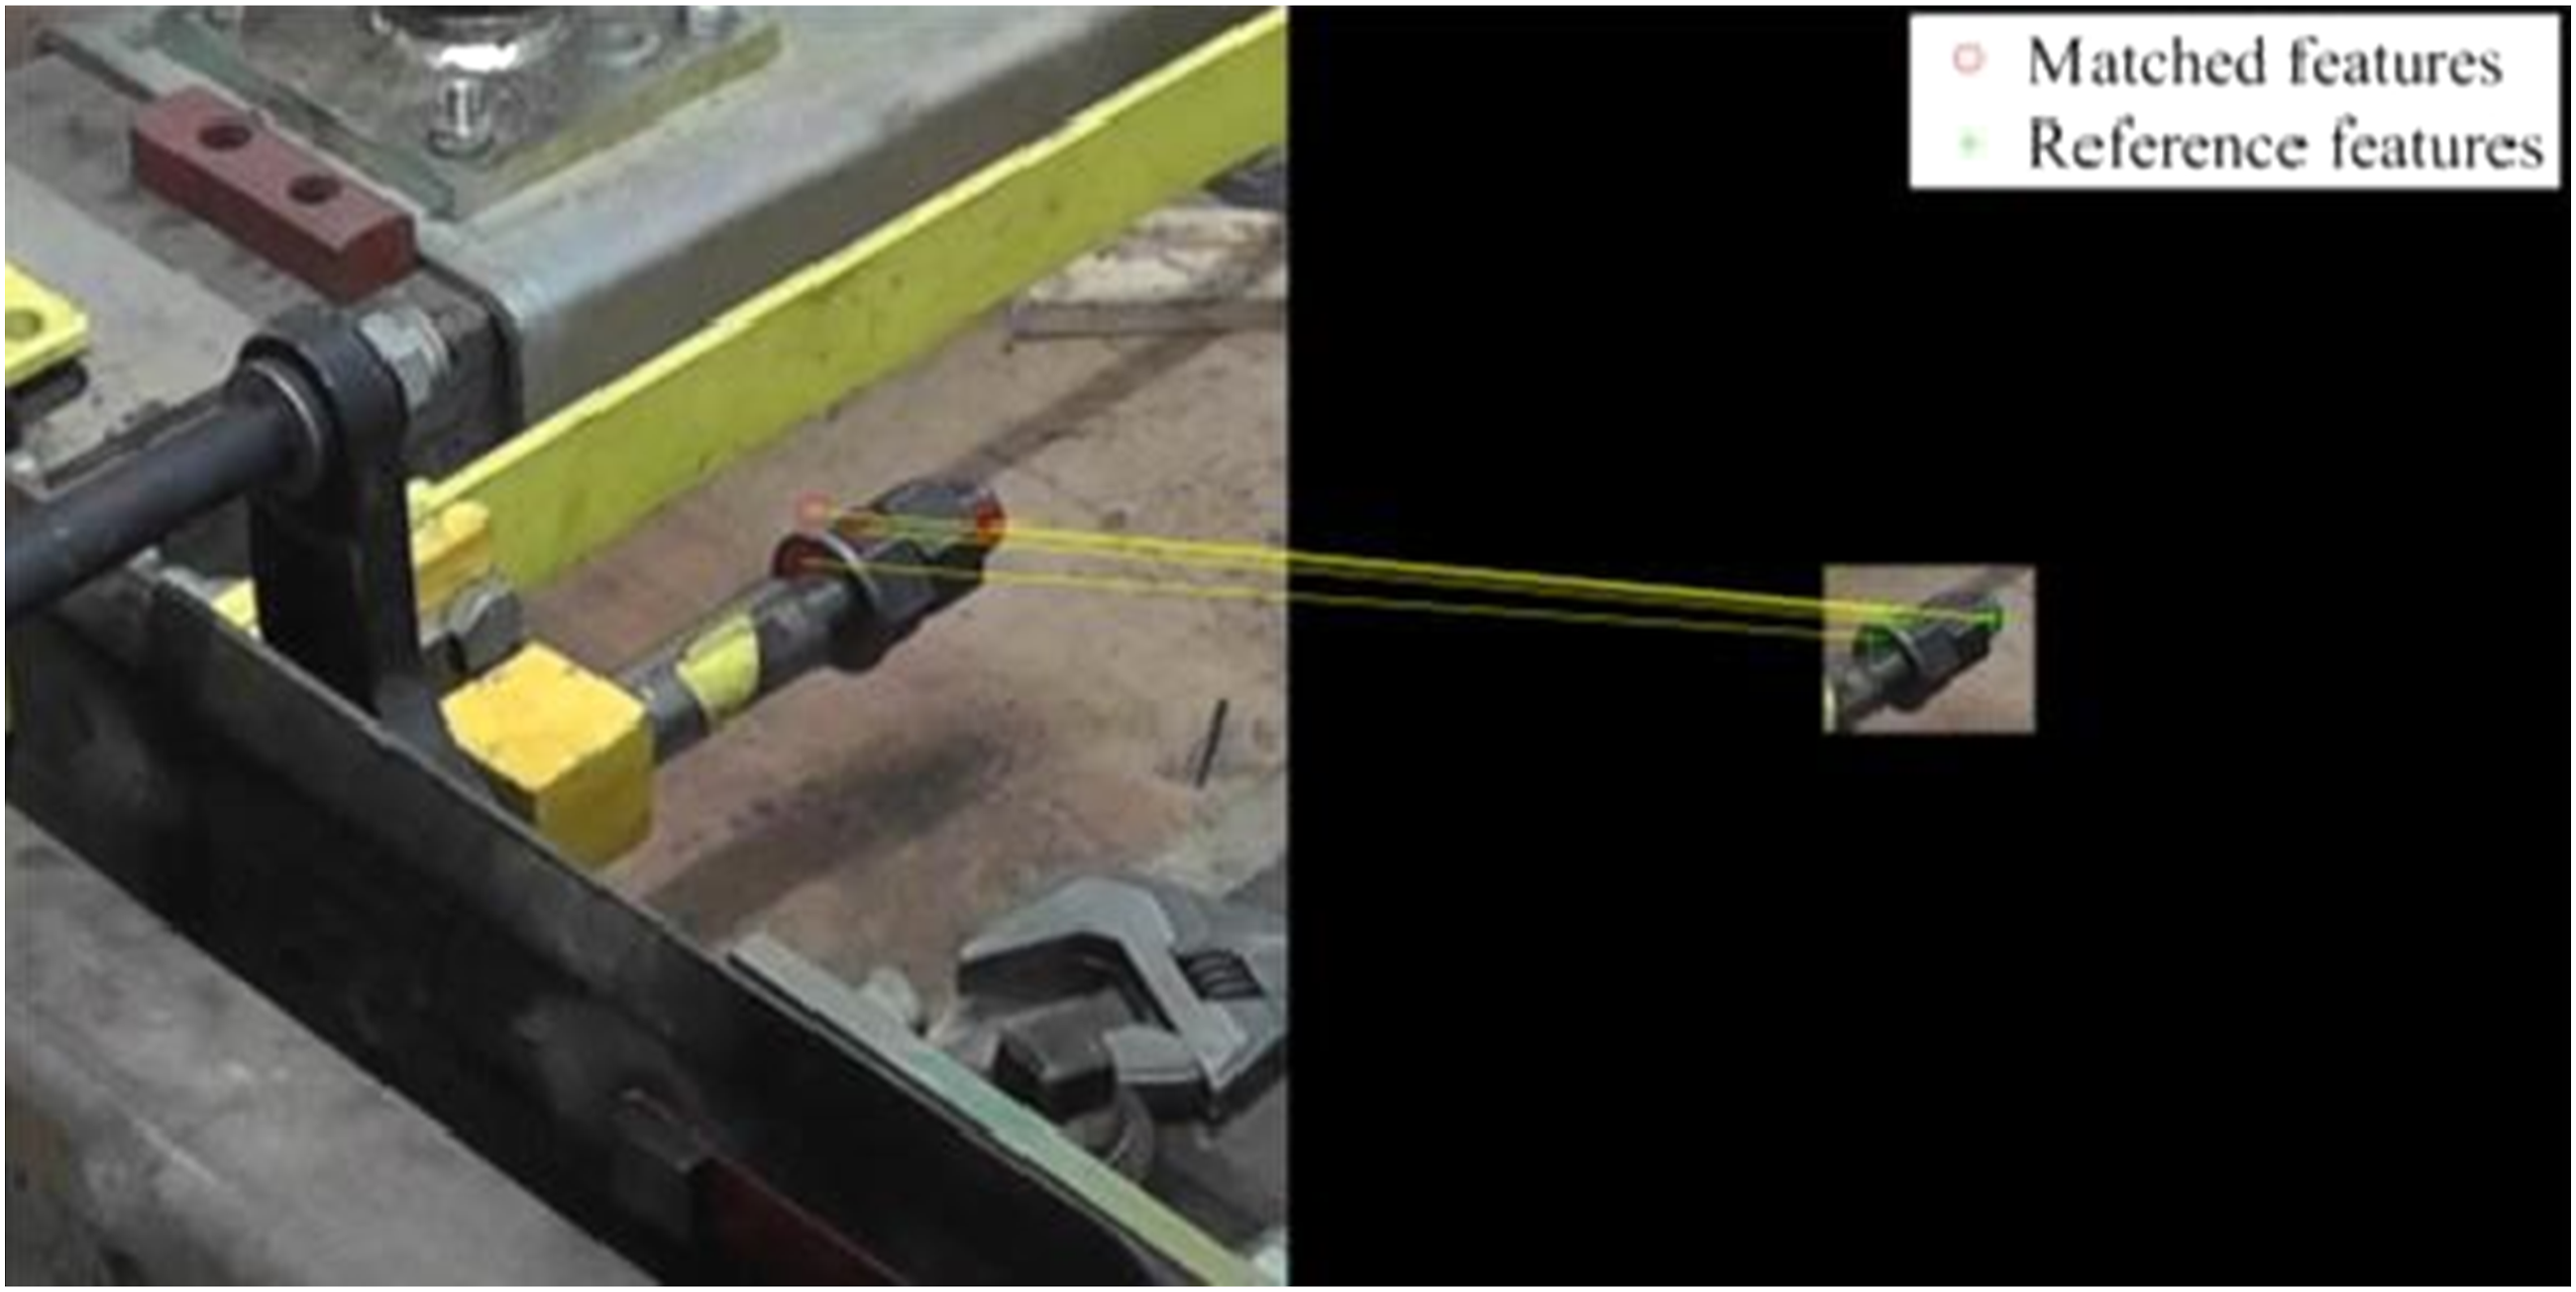
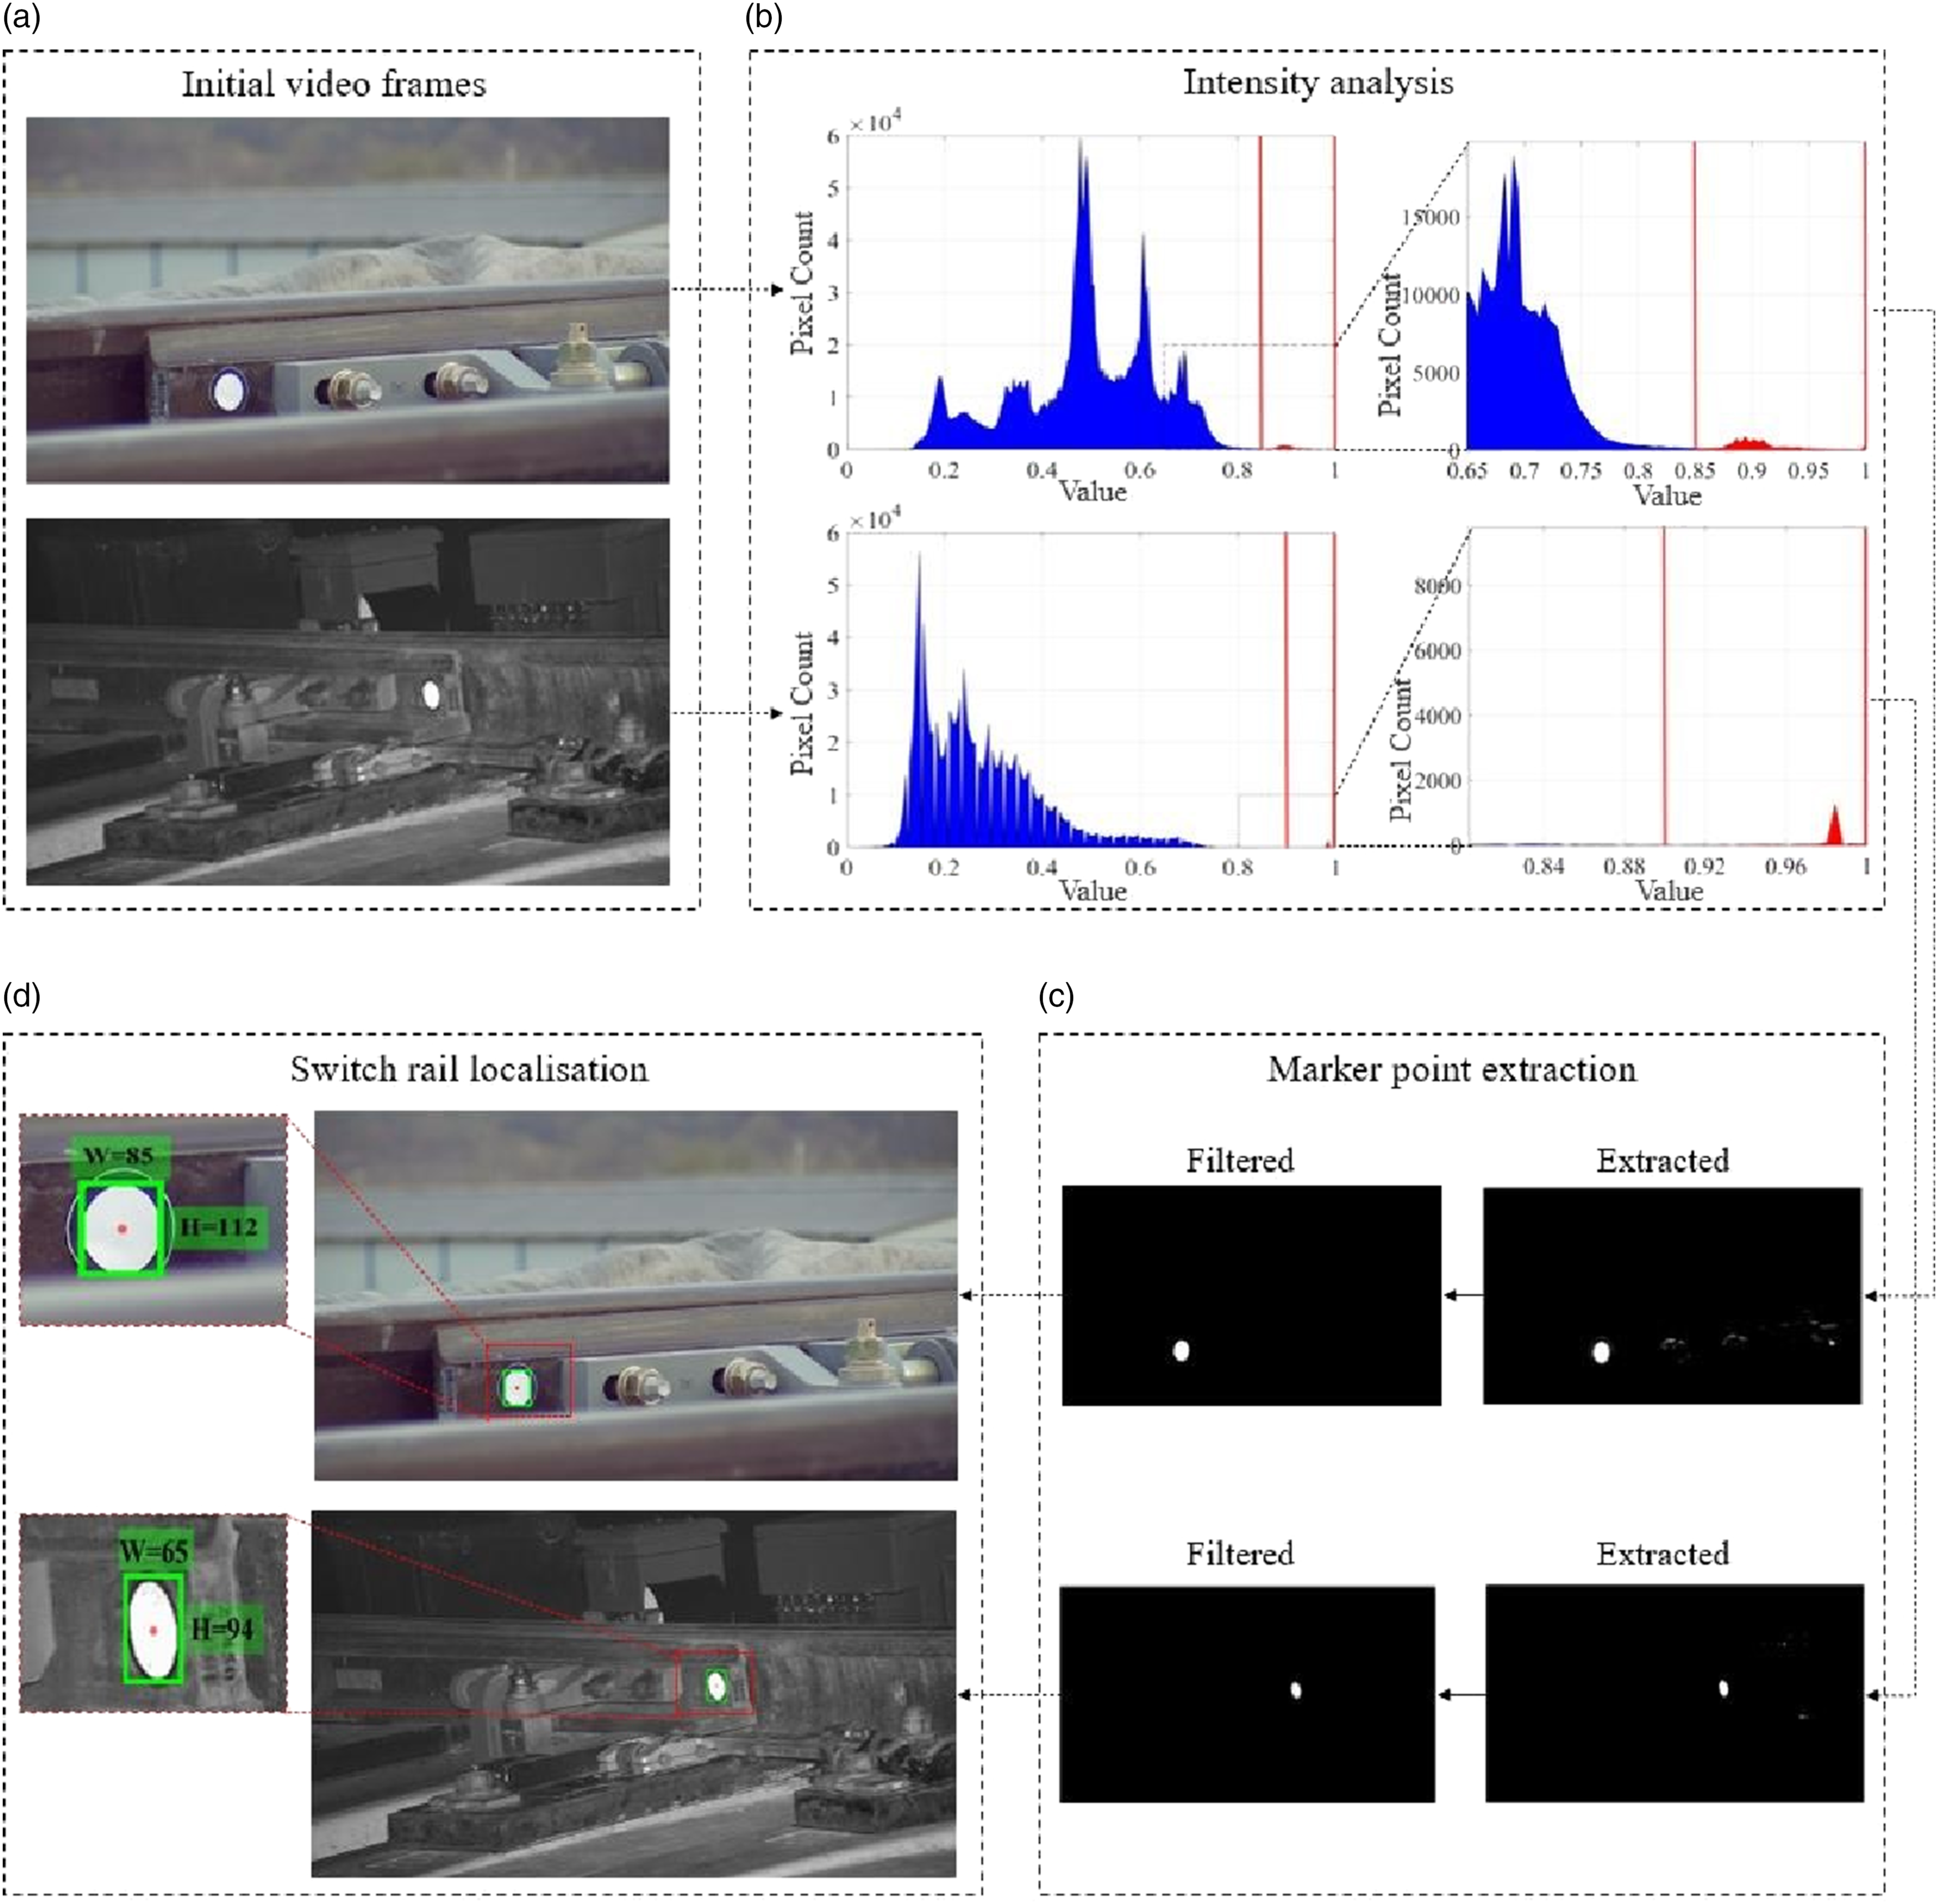
The marker point can be detected based on its shape or intensity within the image. During the experiment, it was found that the shape of the marker point can vary in terms of scale changes as the switch rail moves, which affects the accuracy of shape-based detection such as Circular Hough Transform (CHT). The intensity related to the colour or brightness properties of the marker point, by contrast, was more stable. Consequently, the HSV (Hue, Saturation, Value) properties of the marker point are considered, as these are more effective than working in the conventional RGB (Red, Green, Blue) colour space. Each property in the HSV model is relatively independent, and hence the markers are found to be more distinguishable.
27
During the field test, it was observed that the V-channel of the marker point related to the brightness has distinguishable ranges. Moreover, their intensity distributions are less affected by external factors such as changes in the background and ambient light. Figure 4(b) shows the intensity analysis of the V-channel of the video frames shown in Figure 4(a). From their partially enlarged views, clear valley and peak areas can be seen in the ranges, as indicated by the vertical red lines. The approximate range is 0.85 to 1.0 in the daytime and 0.9 to 1.0 at night. Accordingly, an adaptive threshold (V
thresholding
) is defined as (1):

The marker point can then be localised with a bounding box in the video frame to indicate the position of the switch rail, as shown in Figure 4(d). With the marker point detected, the ratio between the actual size of the marker point (30 mm) and its pixel size in each video frame can be calculated. Taking one of the partially enlarged views in Figure 4(d) as an example, the width (W) and height (H) of the detected marker point consist of 85 and 112 pixels, respectively. This means that each pixel represents about 0.35 mm (30/85 mm) in the longitudinal direction and 0.27 mm (30/112 mm ) in the vertical direction, which reflects the theoretical resolution of the system and helps to convert the corresponding pixel distance to actual distance in millimetres.
Detection of the stock rail
To access the toe gap between the switch and stock rails, the interface point (the line at the top of the stock rail) needs to be identified. In the short term, and in comparison to the switch rail, the stock rail can be considered to be a stationary component and hence the interface points on the stock rail are also fixed, it is unnecessary to detect them in each movement. In this initial work, the interface line is manually indicated by selecting the extremes in an initial video frame (Figure 5(a)) and inferring the entire interface line through interpolation (Figure 5(b)). This ensures the accuracy of the toe gap measurement while minimising computational cost. In a more developed solution, the stock rail location would be re-evaluated periodically depending on the local conditions. It should be noted that the accuracy of this interpolation may be affected by factors such as maintenance interventions. Therefore, recalibrations are also expected at such times to ensure the effectiveness of the interface line. Manual positioning of the stock rail (a) extremes marking (b) stock rail indication.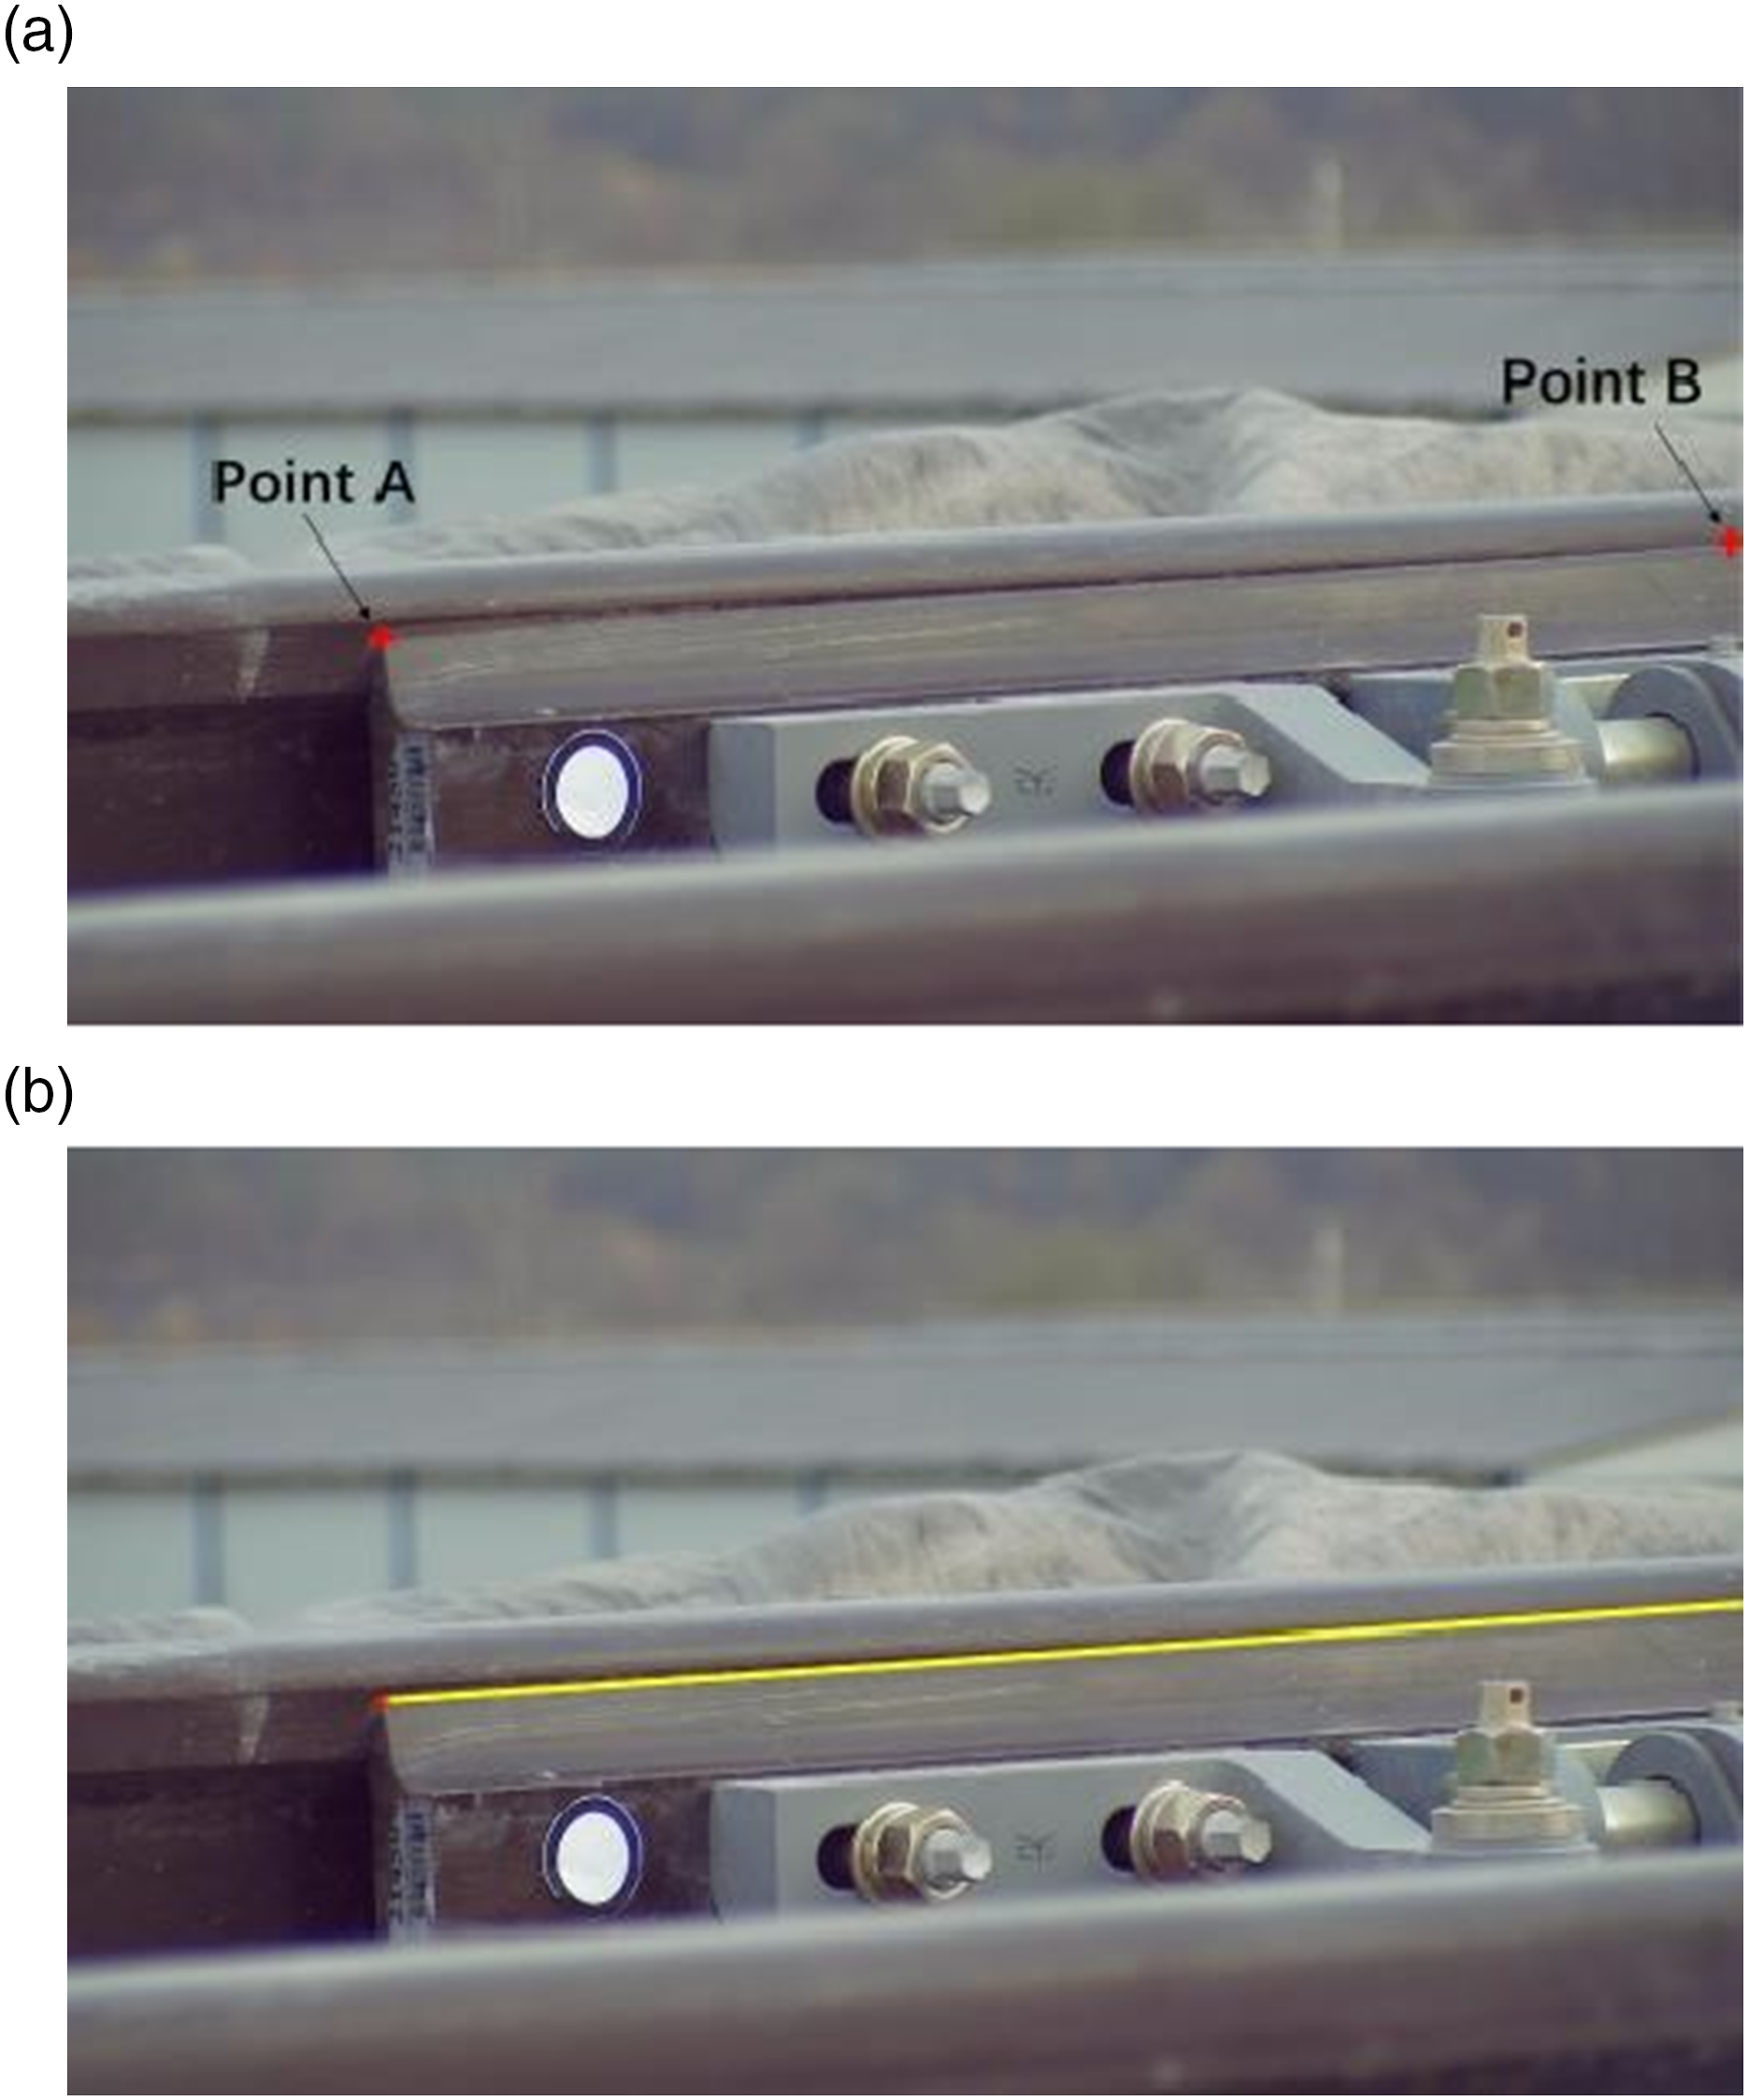
Switch rail tracking
To measure the toe gap at the right time, the system needs to know when the switch rail is in the locked position. As a non-intrusive system, this information is not accessible from other sources. The method used in this research is to localise the switch rail in consecutive frames to form a trace of its position relative to the stock rail. However, as a real-world system, external factors such as specular reflections may lead to missing or imprecise positions in some frames, for example, the centre point deviation of the reference marker. Considering the properties of periodic motion of the switch rail, which is also in a relatively constant velocity, a Kalman filter is used to predict and correct its location. The filter was set to use the displacement of the marker point in adjacent frames as a reference for the movement of the switch rail. It works by predicting the marker point location, first based on historical data and then using a newly detected location to correct the prediction. If a marker point is missing, the location can still be predicted solely by relying on historical data.
29
To avoid any confusion between the tracking error and the switch rail anomalies, a constraint of 15 mm (the radius of the marker point in this research) was set for the filter. If the deviation between the predicted and detected locations is above the constraint, the filter will ignore the predicted location and use the detected one. This improves the stability of the switch rail tracking and ensures that the tracking results reflect the motion model of the switch rail more accurately. Furthermore, the toe gap measurement was set to rely solely on the detection results, to ensure its independence. Figure 6 shows an example of the switch rail tracking results using the proposed system. In this application, two indices are as follows: 1) displacement of the switch rail in adjacent frames and 2) a threshold distance to the stock rail of 20 mm, are used to identify the status of the switch rail. This helps to divide the status of the switch rail into four different phases, namely, Closed (the switch rail stops moving and the lateral distance to the stock rail is under 20 mm), Opening (transition from closed to opened), Opened (the switch rail stops moving and the lateral distance to the stock rail is above 20 mm) and Closing (transition from opened to closed). The toe gap, hence, can be identified at the right time (when the switch rail is closed). The detailed logic is illustrated in Algorithm 1. Note, the aim of four phases introduced here is to build the trajectory of the motion of the switch rail and help the system to identify the toe gap at the right time. The closed status does not indicate that the switch rail is locked as the proposed system cannot access the locking mechanism of the switch rail, additional indicators would need to be included and tracked in order to demonstrate an engaged lock. Example of switch rail trace results.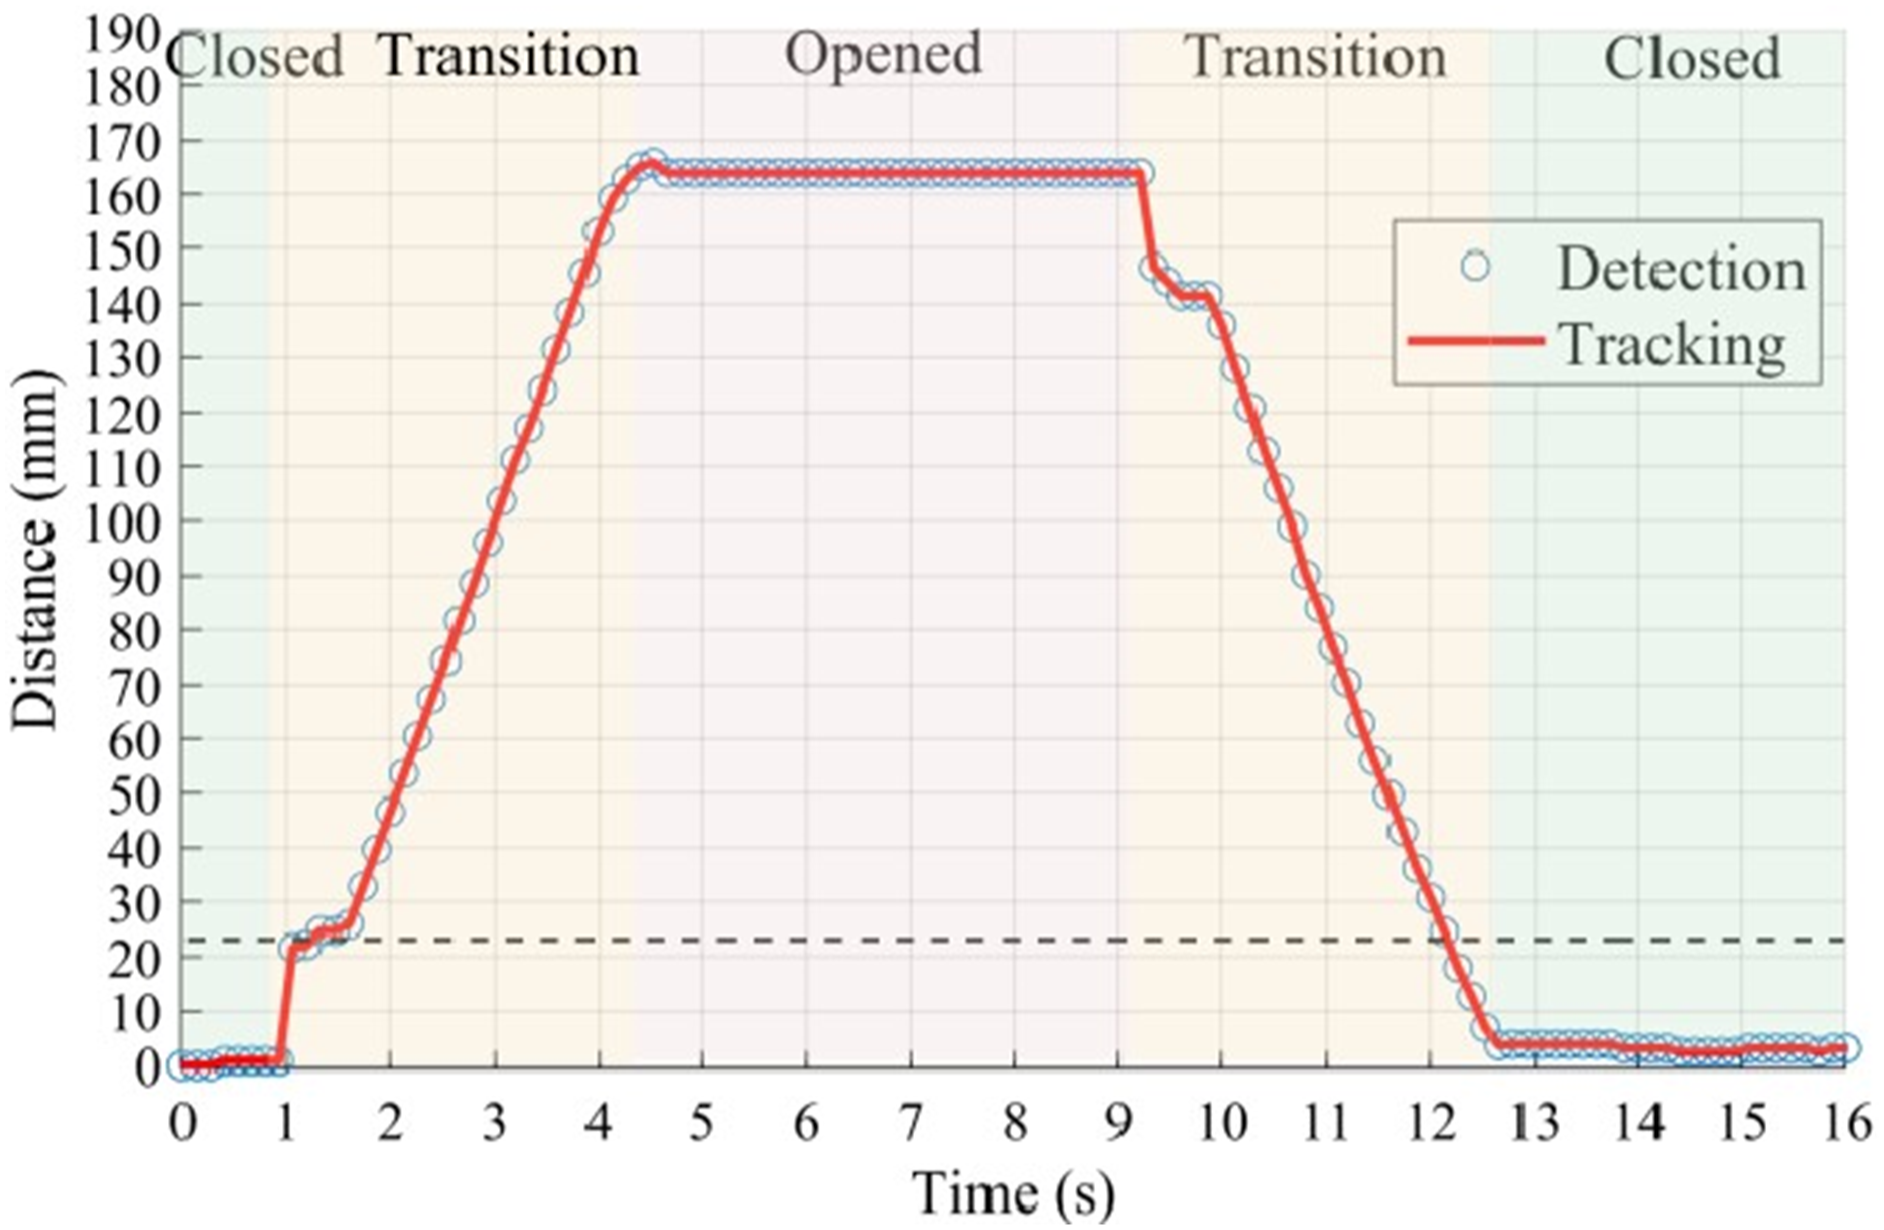
Switch rail tracking Input: interface point on the stock rail (PA), centre of the marker point at the video frame i (M
i
) and constant velocity (Mi − Mi−1). Initialisation: configure Kalman filter (K) with initial position (M
i
), constant velocity (M
i
− M
i-1
) motion model and a constraint of 15 mm from the detected location. Output: Corrected position C
i
, distance to the stock rail (D
i
), toe gap (Gap
i
) and status of the switch rail. Procedures: 1. While hasFrame do 2. Localise the position of the marker point (M
i
) 3. If M
i
exists, then C
i
= K (M
i
) and calculate D
i
4. Else, then Ci = K (Mi−
1
) and calculate D
i
5. End if 6. If C
i
− Ci−1 = 0 and Di ≤ 20 mm, then 7. Switch rail is closed, and Gap
i
= M
i
− P
A
8. Else if C
i
− Ci−1 = 0, then 9. Switch rail is opening 10. Else if C
i
− Ci−1 = 0 and D
i
> 20 mm, then 11. Switch rail is opened 12. Else if C
i
− Ci−1 < 0, then 13. Switch rail is closing 14. End if 15. i = i + 1 16. End while
Edge detection and evaluation
While the detection of the switch and stock rails can be used to directly evaluate the toe gap, detection of the edge of the switch rail at the point it approaches the stock rail is of particular importance, as any abnormal profile at this point can not only cause non-optimal wheel-rail contact but may also impact the toe gap. Commonly used edge detection methods include Sobel, Canny,
30
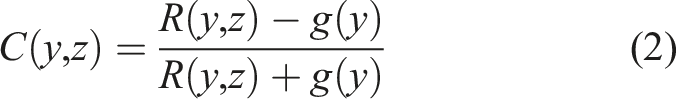
Prewitt and Roberts, all of which have been evaluated for this application. The Canny detector, which calculates the brightness gradient of neighbouring pixels using the derivative of a Gaussian filter, performs best in the application. Figure 7 illustrates the framework of the proposed edge detection and evaluation method. Firstly, the existence of the marker point makes it possible to extract the particular region around the switch rail toe (Figure 7(a)), which helps to filter the unrelated background to improve the accuracy of detection and reduce computational complexity. To further increase the contrast and eliminate the noise generated by external conditions such as ambient light fluctuations, a grey equalisation method based on (2) is then applied. Framework of the edge detection and evaluation (a) ROI extraction and grey equalisation, (b) edge detection of the switch rail toe and (c) affine registration for edge evaluation.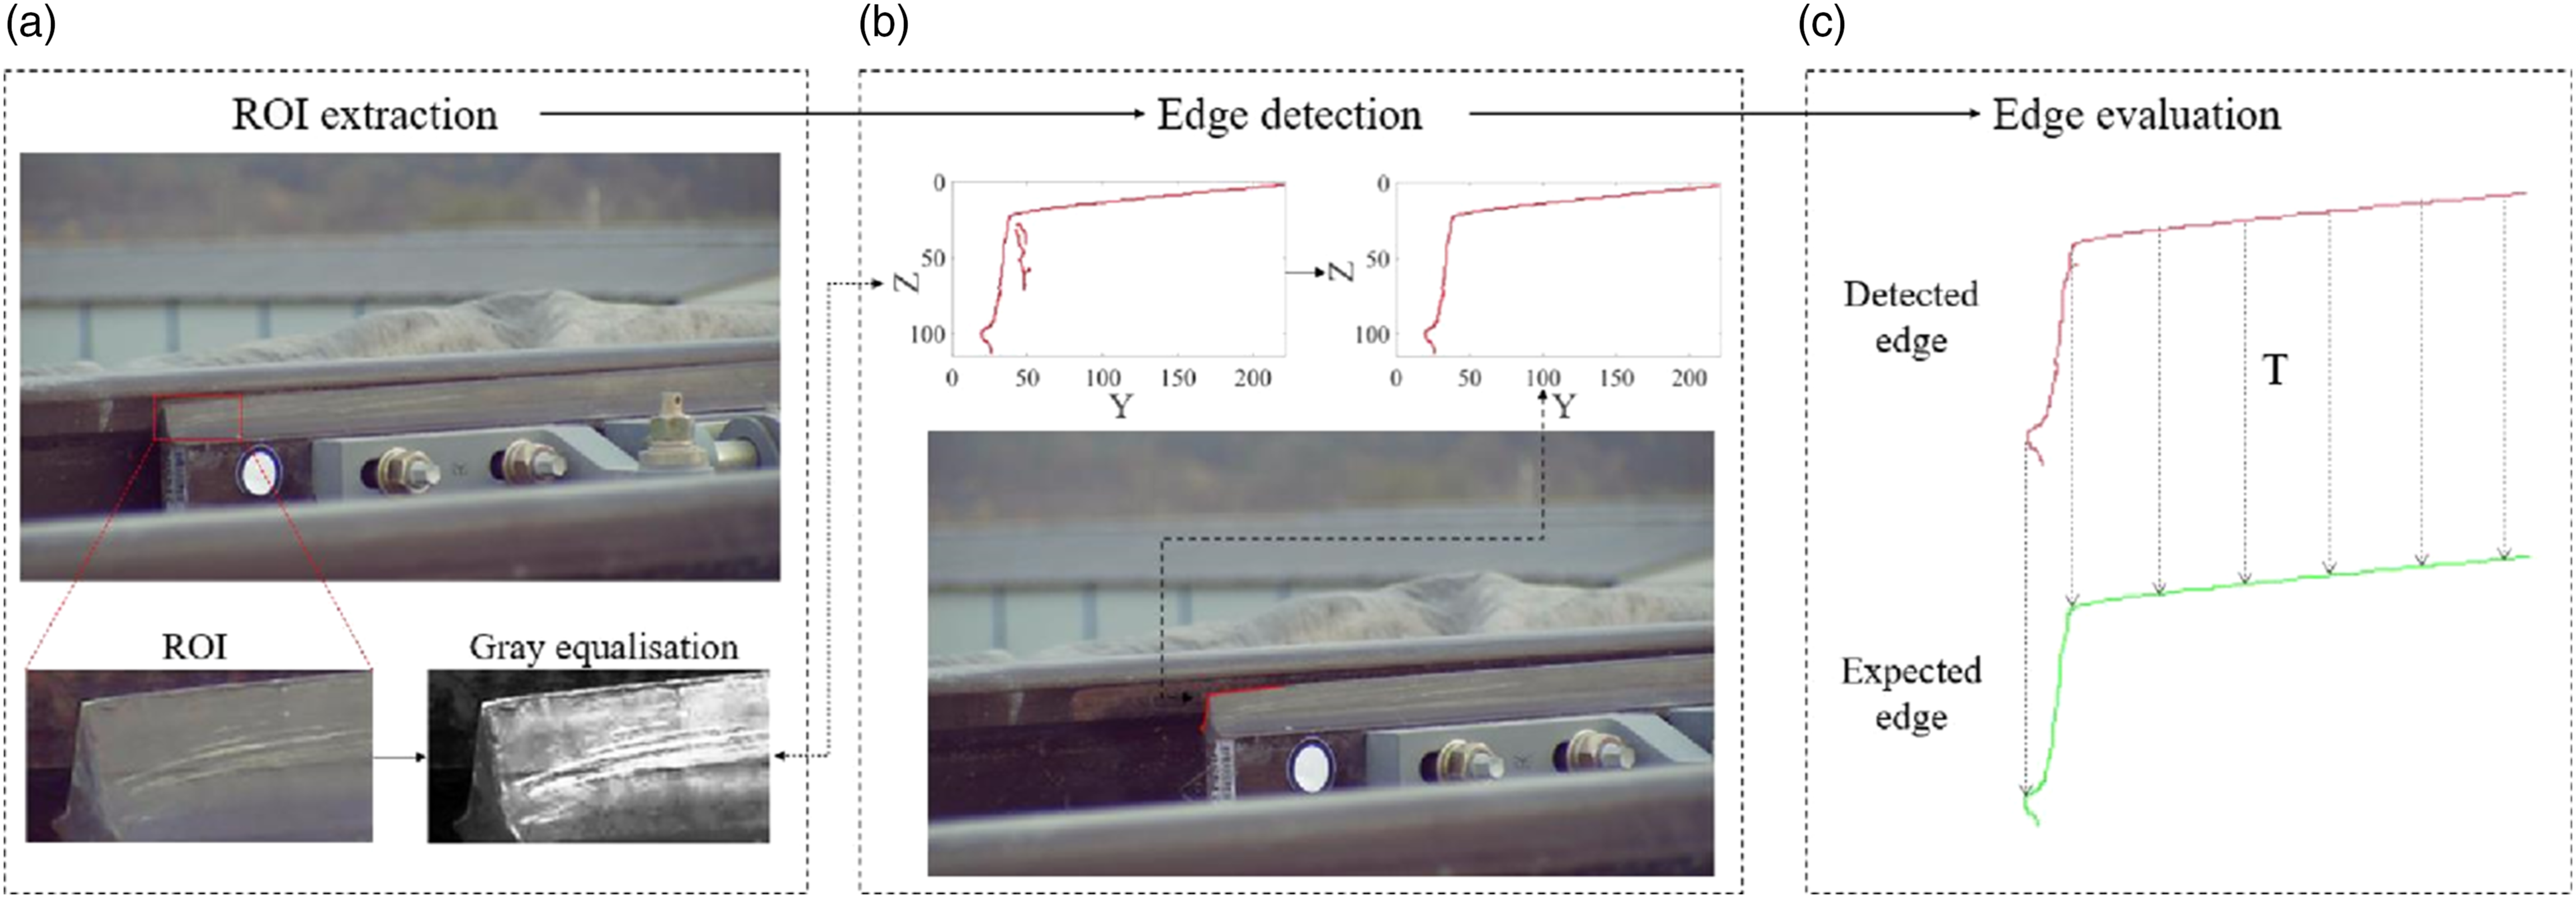

The contrast image can then be fed into the edge detector. In the Canny edge detection method, the selection of a pair of intensity gradient thresholds is key in the accuracy of detection.
31
Any pixels with a corresponding intensity gradient larger than the high threshold value are considered to be edges, while those below the low threshold value are ignored as non-edges. Pixels whose intensity gradient lies between the thresholds are classified based on their connectivity, that is, if connected to pixels considered above the upper threshold they are also considered to be edges. However, the intensity values of pixels within an image can change with variations of the ambient light. This makes it difficult to determine a pair of fixed thresholds that are suitable for varying conditions. Manual parameter tuning can be time-consuming and unreliable; hence, in this research, an adaptive Canny detector is applied to the ROI with low and high thresholds defined as (3) and (4):

In (3) and (4), σ is used to determine the sensitivity of the detector, which can be adjusted from 0 to 1 to adapt to different conditions. A larger σ indicates a higher sensitivity. The median referred to is that of image intensity which helps the low and high thresholds to adapt to images captured under varying illumination conditions. The brightness gradient of neighbouring pixels can then be compared to the thresholds to detect edges. Figure 7(b) shows the edge detection results. Any points arising from random noise can be eroded using morphological operations. The detected edges can then be attached to the video frames to indicate the status of the corresponding switch rail in real time.
To evaluate the status of the edge of switch rail toes, a commonly used method is to align the detected edge to the expected or ‘normal’ edge. Since the detected edge consists of a group of points (pixels), this process must identify those common to both the detected and expected edges and then calculate the transformation matrix between them in order to allow alignment. An affine point set registration method is used in this research.
32
This is based on the squared Euclidean distance metric (E(T)) defined as (5):

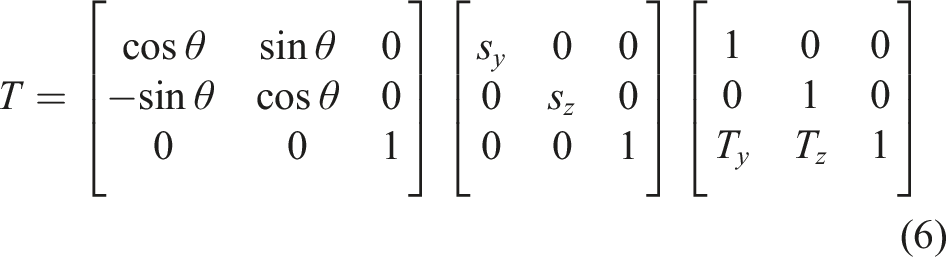
Figure 7(c) illustrates the process of the proposed edge evaluation method. For each application, an edge initially detected and identified as a switch rail toe is considered to be ‘normal’ and thus used as the expected edge for future registration. The following detected edges are periodically compared to the expected edge on a user-defined schedule. Using affine registration, the average value of the final Euclidean distance (E(T)) between the matched points of aligned edges is used to identify the status of the switch rail toe. A threshold of 1 mm is used in this research to distinguish registration error from actual faults. Since the location and the scale of the detected edge change with the movement of the switch rail, the transformation matrix (T) between the registered edges involves rotation, scale adjustment and translation. This is described in (6):
The proposed method can, therefore, monitor the status of the switch rail, measure the toe gap and evaluate the condition of the switch rail toe in real time. The flowchart in Figure 8 illustrates the basic logic of the proposed method for clarity. Flowchart of the proposed method.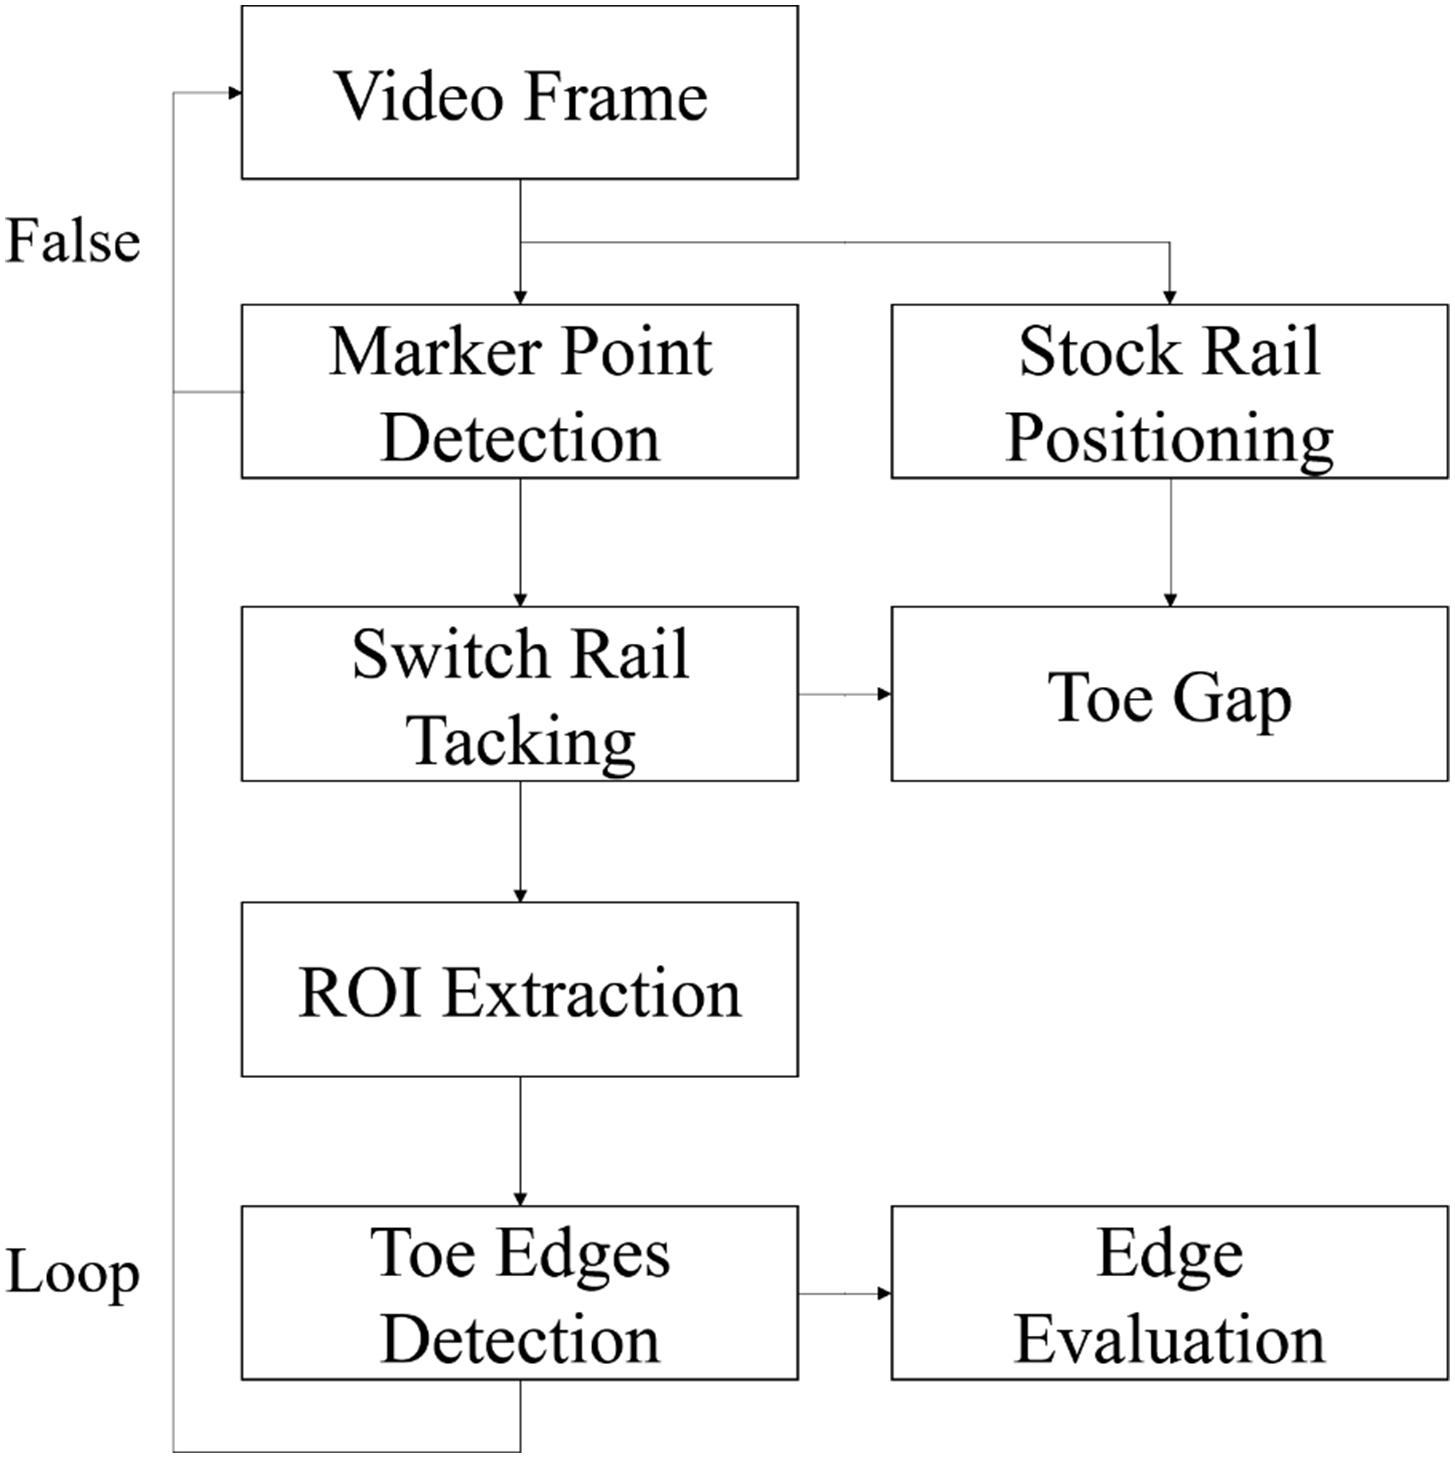
Field Test Results
The proposed system and algorithms have been tested in a high-speed train testing centre in China. Figure 9(a) shows the installed line-side cameras (A and B). Figure 9(b) shows an example of the testing results. The system can output real-time monitoring results for the targeted switch rail including the position of the switch rail, the toe gap between the switch rail and the stock rail and the edge of the switch rail toe. Field test results (a) completed prototype of the system, (b) monitoring results, (c) trace results of switch rails on both sides, (d) evaluation of the switch rail toe and (e) system accuracy and stability analysis.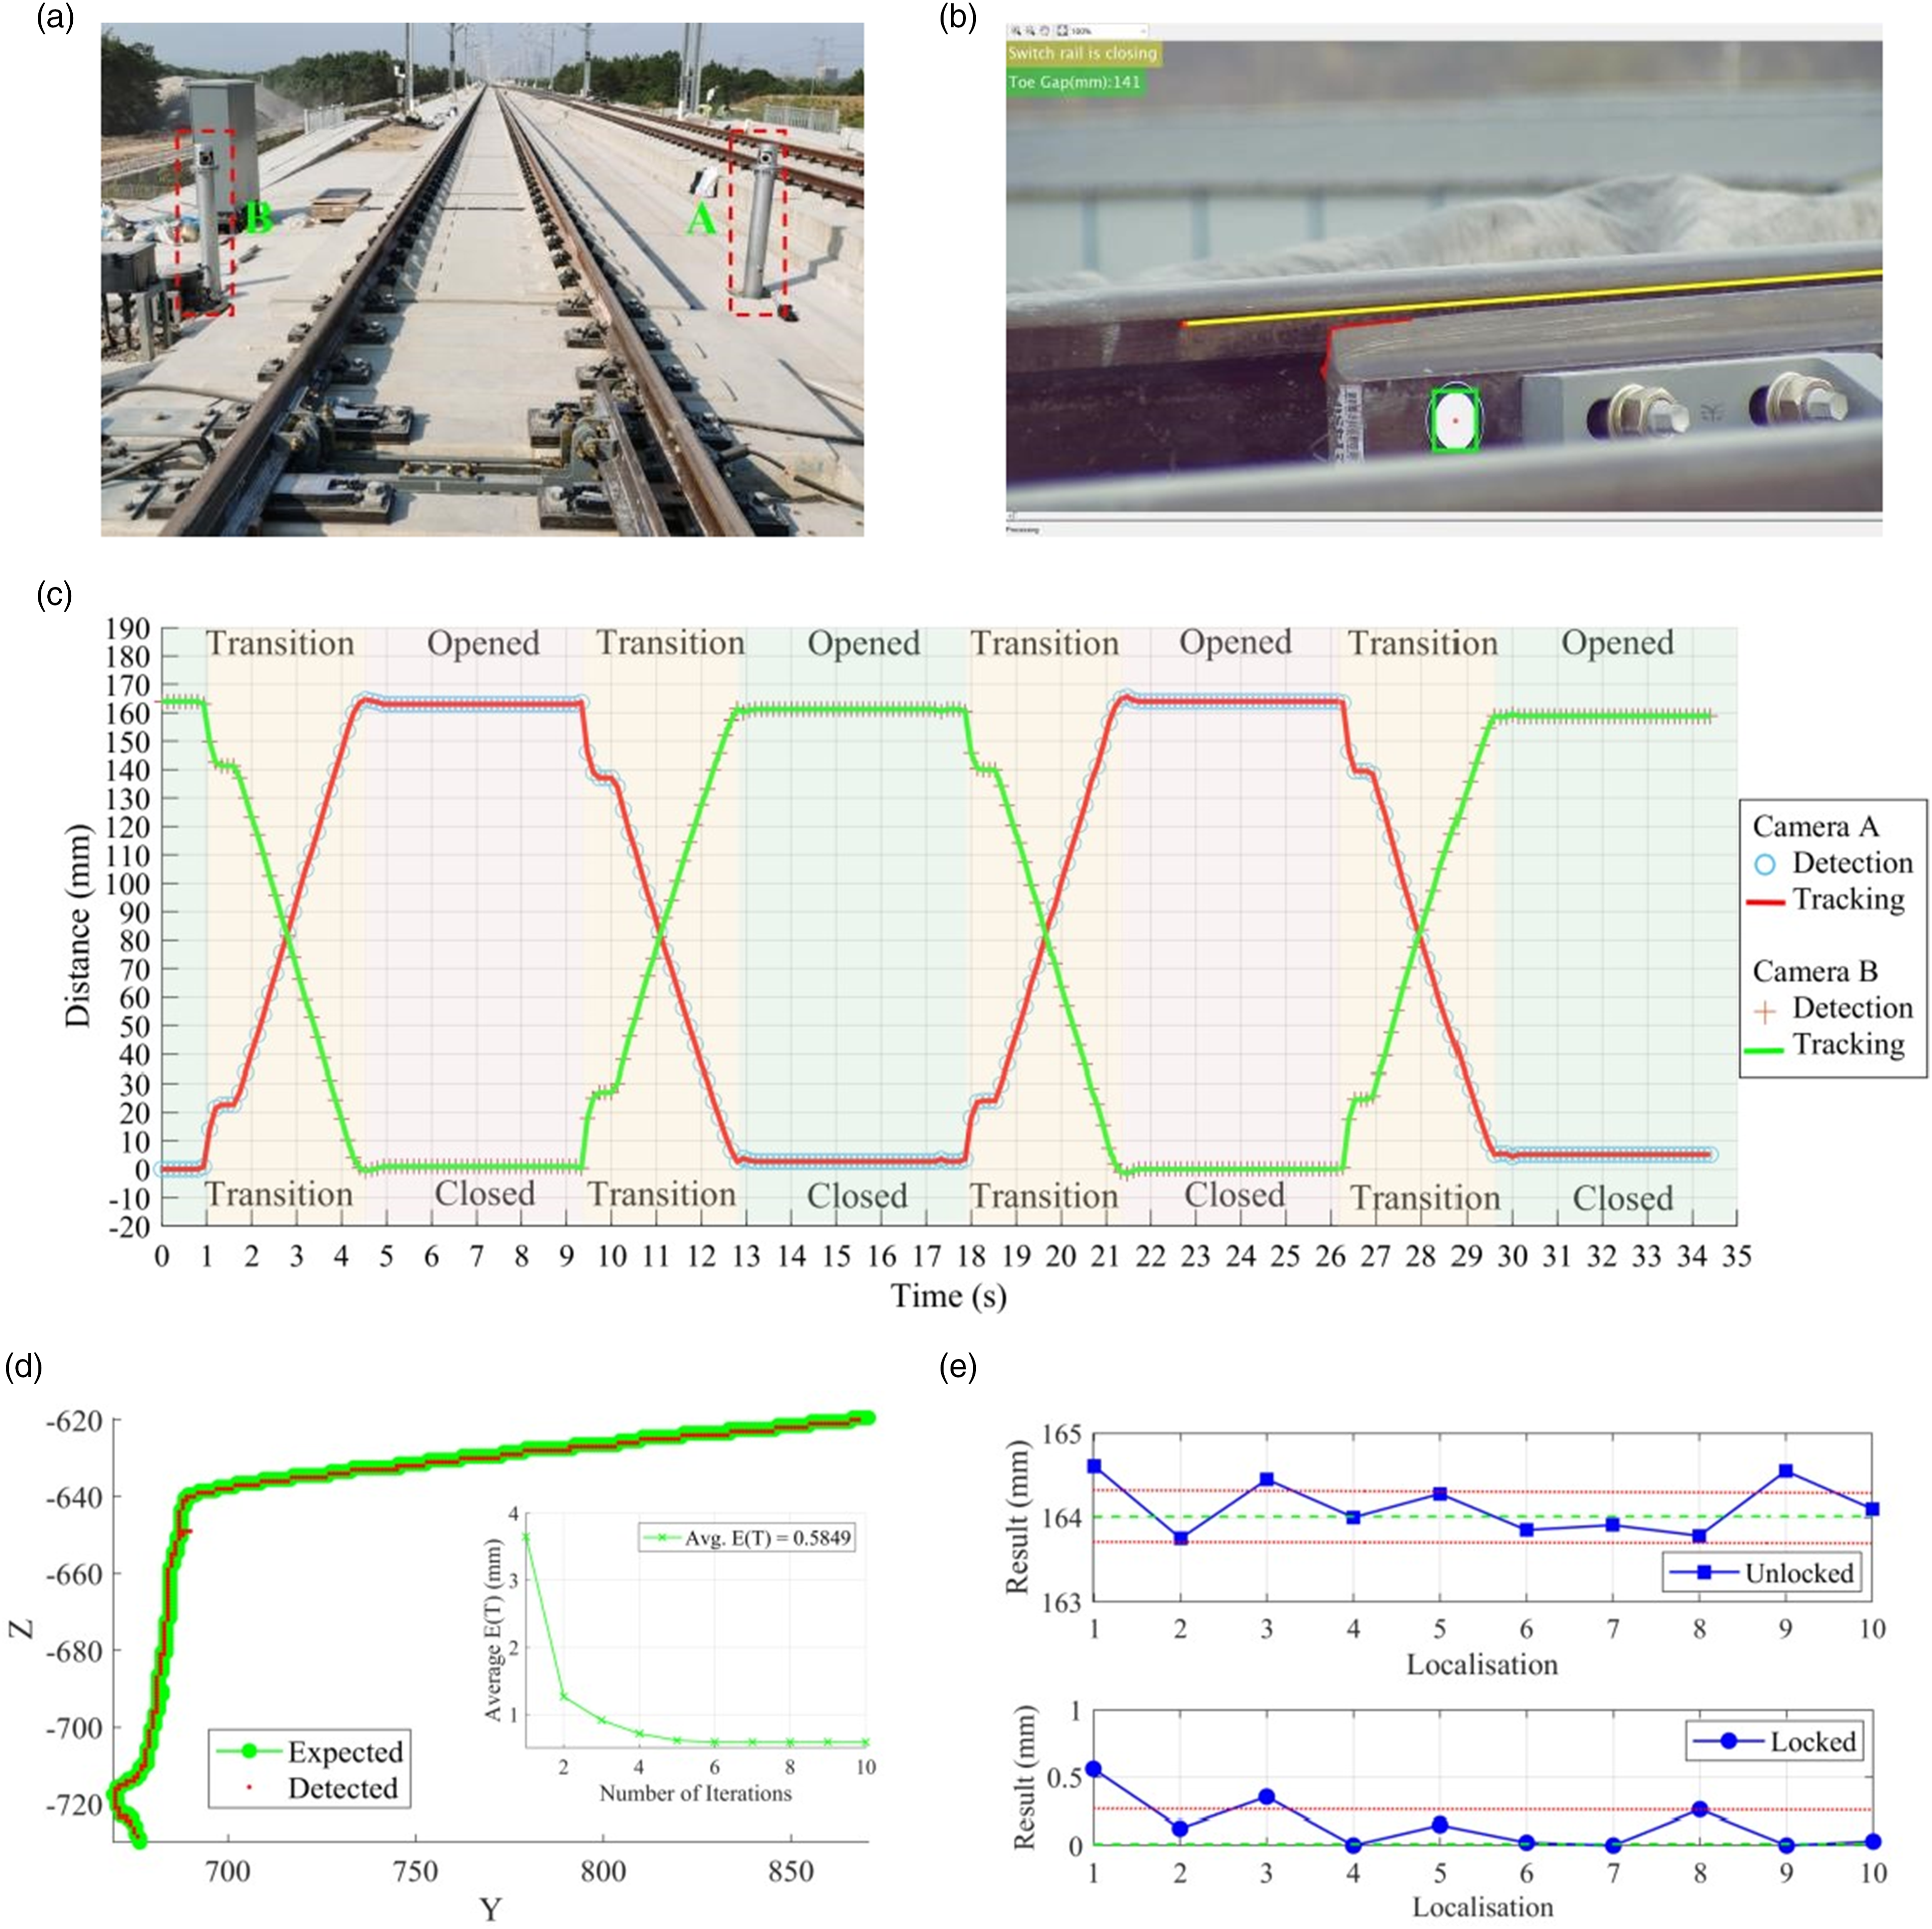
With the monitoring results from cameras A and B available, a real-time trace of switch rails on both sides can be generated (Figure 9(c)). The graph intuitively reflects the properties of periodic motion and normal patterns of the Switch rail. The toe gap information is available when the corresponding switch rail is in the closed phase, and the edge evaluation is carried out periodically. Figure 9(d) shows a comparison result and the process of registration between the detected edge and the expected edge. The initial average Euclidean distance between them is approximately 4 mm. During the registration progress, the detected edge can be iteratively aligned to the expected edge giving a final average E(T) under 1 mm, indicating the switch rail toe is normal. Additionally, tracking the movement of the switch rails, and identifying the locked positions and the corresponding toe gaps, provides a non-invasive alternative solution to understanding S&C performance and establishing S&C status including detection of route setting.
As a condition monitoring system, the top-level requirements are system accuracy and stability. Since the key procedure of the proposed method is the localisation of the switch rail, which determines the accuracy of the toe gap measurement, the accuracy of the switch rail localisation has been considered as the main index. Stability refers to the range of deviation of measurement results under consistent conditions. For this application, the system was tested in the daytime, repeatedly, under the same conditions (same configurations and short intervals). The localisation results of the switch rail were recorded at its locked and unlocked positions, which should be 0 mm and 164 mm, respectively. Figure 9(e) shows a group of recorded localisation results. The absolute value of the average localisation error is under 1 mm, with a standard deviation of approximately 0.3 mm (indicated by the dotted lines), which satisfies the common requirements for the accuracy and the stability of an automatic toe gap measurement system. 33
To further evaluate the performance of the system, various scenarios of application were also considered. These included testing the system under different ambient lighting conditions, using marker points of different sizes and simulating excessive toe gaps by putting obstacles between the switch rail and the stock rail. Figure 10 shows some representative results. Tests in different external conditions (a) monitoring results in the daytime, (b) edge comparison results with noise, (c) 3 mm toe gap test, (d) monitoring results at night and (e) 2 mm toe gap test.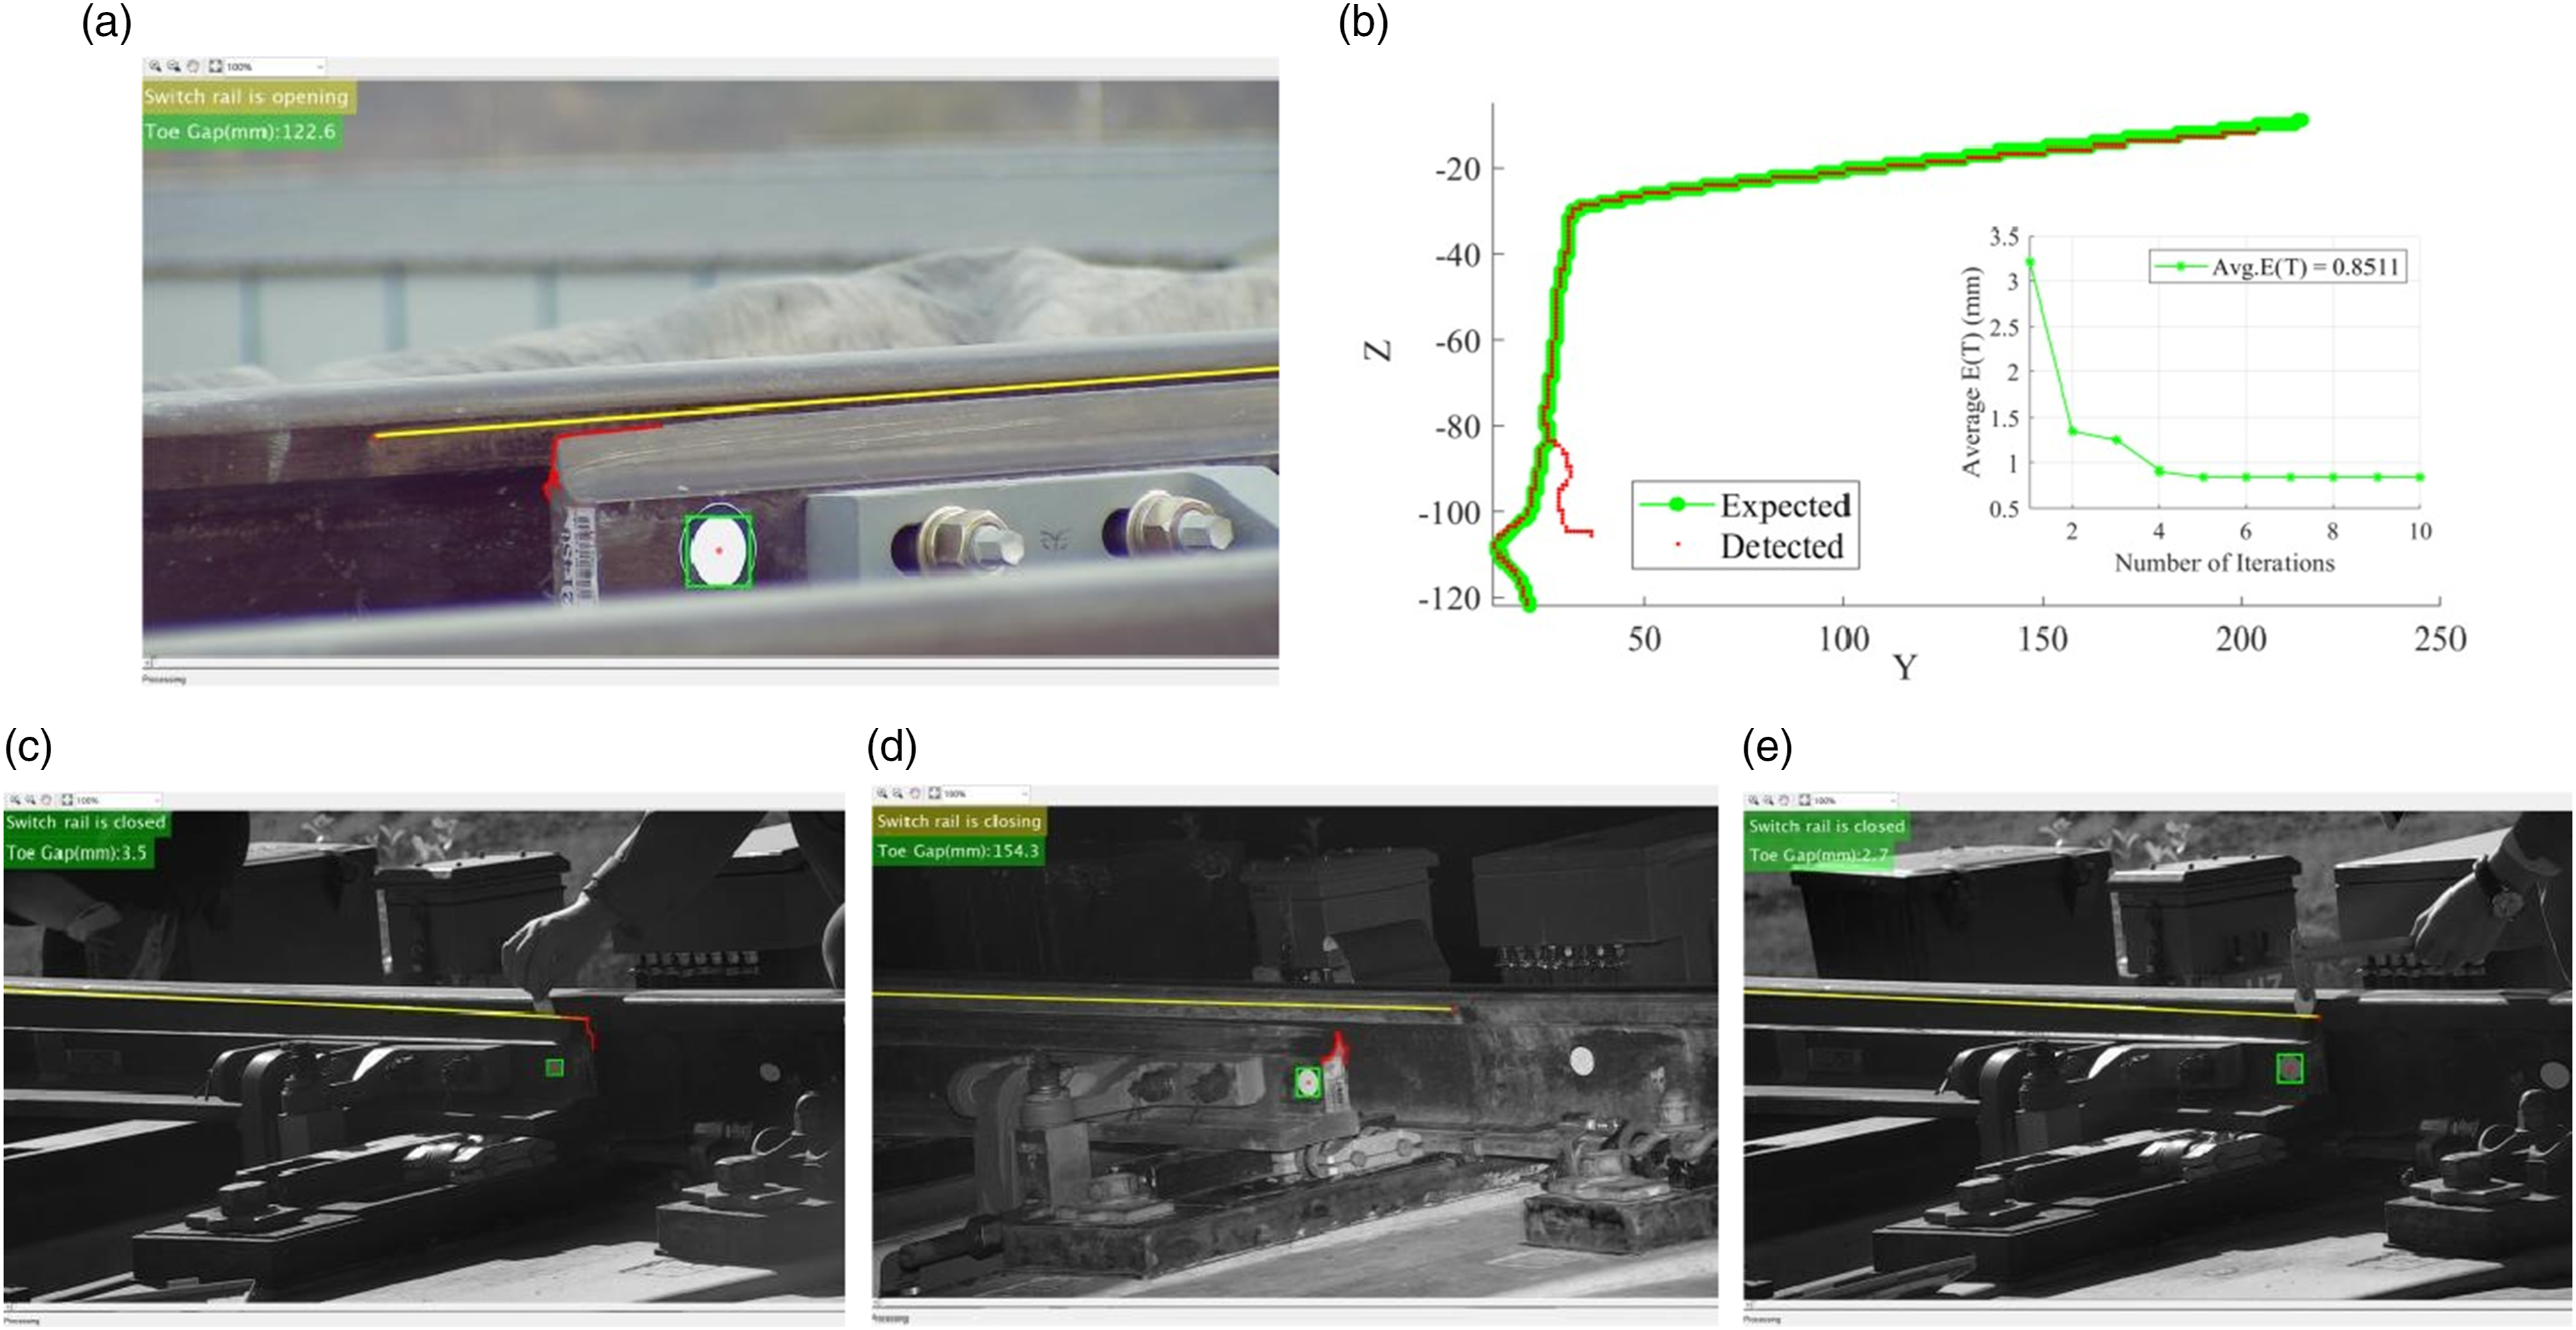
Discussion
Field test results considers the performance of the proposed system. However, it has not been possible to fully consider all aspects due to experimental constraints.12, 34 These factors are discussed here. 1) Surface cleanliness can be a major concern for all vision-based condition monitoring and inspection systems. For the proposed system, surface dirt on switch rails may lead to inaccurate detection results, and such augmentations on the lenses of cameras can even affect their ability to function. 2) Adverse weather conditions may affect the system’s imaging quality. Such weather conditions would include fog, rain, or snow, where the object may become partially obscured leading to noisy and inaccurate detection results. 3) Material degradation is mainly caused by long-term wheel-rail contact and may affect the effectiveness of the algorithm. For example, switch rail running surfaces may develop complicated profiles, which could affect the accuracy of edge detection. 4) Stock rail drifts can happen in practice which can affect the effectiveness of the stock rail localisation relying on absolute coordinates and cause errors in the toe gap measurement.
In railway systems, surface dirt on the rail is related to the application of grease, which accelerates the accumulation of particulates. To ensure the system’s effectiveness, key components such as the marker point should not be coved by grease. The proposed system protects the camera with a metal case and screen, which ensures the cleanliness of its lenses. However, a periodic cleaning process is still expected to ensure the surface cleanliness of these key components. This can be scheduled based on the actual performance of the system. Regarding weather conditions, the reflective marker point has higher intensity values than the backgrounds in the image, which ensures its visibility in most cases. The usage of external infrared lights can improve the system’s imaging quality when the visibility becomes poor. However, should more adverse effects occur such as adherent raindrops or snow, additional measures may need to be applied, such as adding a screen wiper onto the camera or using specific artefact detection and removal algorithms. The proposed system aims to provide continuous monitoring of the switch rail. Therefore, it is anticipated that changes in the switch rail profile can be detected in its early stage before it develops and becomes sufficiently complicated to disrupt the algorithms. However, the usage of indicators, such as applying a reflective coating on the switch rail, should be considered to increase its contrast against backgrounds and thus improve the accuracy of edge detection. Considering stock rail drift; the current system requires manual re-calibrations for the positioning of the stock rail to ensure accurate toe gap measurement. However, automatic stock rail drifts detection should also be considered to improve the robustness of the system. This can be achieved by adding additional cameras focussing on stock rail drift measurement or through the detection and location of stock rail features and re-calibrating the absolute coordinates automatically if any drift is detected.
Conclusion
This paper presents a line-side condition monitoring and inspection solution for S&C based on the position and condition of the switch rail. By using customised detection and tracking methods, key parameters such as the toe gap and the condition of the edge of the switch rail can be monitored in real time. Compared to other automatic inspection solutions, the proposed system can provide continuous or more frequent condition monitoring for switch rails with less impact on normal train services. Testing results have demonstrated the accuracy of the proposed system for switch rails localisation and toe gaps measurement with an error under 1 mm and the feasibility to monitor the condition of the switch rail toe. The proposed system, therefore, could potentially work to supplement existing inspection systems and to support the maintenance management of key components like S&C, further ensuring their safe operation. As exploratory research, there are still some deficiencies. Future work in this area will mainly focus on i) upgrading the hardware configuration to improve the system accuracy, ii) further testing and optimising the algorithm under the impact from different external factors as discussed in Discussion, to improve the system robustness and iii) with more samples and dedicated processors available, introducing more intelligent detection strategies, such as using deep convolutional neural networks (CNNs).
Footnotes
Acknowledgements
The authors thank the Birmingham Centre for Railway Research and Education (BCRRE) for the resources provided and the members of BCRRE who have given support through this project.
Declaration of conflicting interests
The author(s) declared no potential conflicts of interest with respect to the research, authorship, and/or publication of this article.
Funding
This work was supported in part by the Shift2Rail Joint Undertaking under the European Union’s Horizon 2020 research and innovation programme as part of the S-CODE project under Grant Agreement [No. 730849]; in part by the Hefei to Anqing, China high-speed railway [(2019) 001]; and in part by the China Scholarship Council.