
Abstract
In this paper, a novel multiscale and multi-stage structural design optimization procedure is developed for the weight minimization of hopper cars. The procedure is tested under various loading conditions according to guidelines established by regulatory bodies, as well as a novel load case that considers fluid-structure interaction by means of explicit finite elements employing Smoothed Particle Hydrodynamics. The first stage in the design procedure involves topology optimization whereby optimal beam locations are determined within the design space of the hopper car wall structure. This is followed by cross-sectional sizing of the frame to concentrate mass in critical regions of the hopper car. In the second stage, hexagonal honeycomb sandwich panels are considered in lower load regions, and are optimized by means of Multiscale Design Optimization (MSDO). The MSDO drew upon the Kreisselmeier–Steinhausser equations to calculate a penalized cost function for the mass and compliance of a hopper car Finite Element Model (FEM) at the mesoscale. For each iteration in the MSDO, the FEM was updated with homogenized sandwich composite properties according to four design variables of interest at the microscale. A cost penalty is summed with the base cost by comparing results of the FEM with the imposed constraints. Efficacy of the novel design methodology is compared according to a baseline design employing conventional materials. By invoking the proposed methodology in a case study, it is demonstrated that a mass savings as high as 16.36% can be yielded for a single hopper car, which translates into a reduction in greenhouse gas emissions of 13.09% per car based on available literature.
Keywords
Introduction
The increasing need to transport and deliver greater quantities of key economic resources at lower cost coupled with proliferation of environmental concerns has induced greater pressure on freight companies to reduce costs and emissions. It has been demonstrated that for an 10% reduction in vehicle mass, 5% energy savings can be attained, which can address these concerns simultaneously.1,2 As an added benefit, it is further found that structural weight reduction in rail vehicles can reduce yearly energy consumption while simultaneously improving life-cycle metrics. 3 While many efforts have been made to reduce car-body weight in passenger rail, freight rail remains scarcely investigated. In commercial freight rail, reduced weight of car-bodies can potentially result in a greater yield of transported cargo, which can significantly reduce costs or bolster profits.
Implementation of honeycomb sandwich panels has found much success in passenger rail. Magnesium alloy corrugated sandwich panel extrusions were proposed by Lee et al., where extrusion dimensions of each panel was optimized a priori. 4 Seo et al. developed a hybrid composite bodyshell for the Korean Tilting Train Express, which met all safety requirements and reduced car-body mass by 30%. 5 Cho et al. employed CFRP-Aluminum honeycomb sandwich composites to the underframe and roof of a K-EMU car-body, resulting in a weight reduction as high as 29%. 6 Using a multiscale approach where material data for composite sandwich structures was characterized at the coupon level and then gradually extrapolated to the component level, Zinno et al. developed a novel lightweight roof for a rail car, which abides by European Code. 7
To design for minimal mass, it is often advantageous to employ numerical optimization methodology. In this regard, MSDO has garnered much attention, and is used to bolster capabilities of numerical optimization. Catapano and Montemurro optimized sandwich panels for strength against buckling by integrating a FEM directly into the MSDO loop. 8 Wennberg et al. employed a topology optimization method to design a novel car-body shell at the mesoscale, and then optimized a sandwich panel to replace a characteristic section of the car.9,10 Molavitabrizi and Laliberte investigated the multiscale design optimization of hopper cars using octet core lattices optimized at the microstructural level and then extrapolated to the mesoscale. 11 Lee et al. employed a multiscale approach whereby topology optimization was used to determine where corrugation is to be concentrated in a rail car and then subsequently those panels were sized. 12 Harte et al. employed a multiscale approach to determine ideal CFRP shape and layer sizing of a passenger LRV. 13
This paper aims to develop a novel methodology whereby optimization of the structure at the microscale and its implementation toward the mesoscale are coupled in a MSDO procedure to ensure a successful global design. The proposed methodology employs a multi-stage study where, upon determination of the loads, a baseline structure is produced using conventional materials. Upon establishing the baseline, the novel MSDO is used to design a freight car-body of minimal mass employing honeycomb sandwich panels. While much of the available literature discusses static loading, a broader range of load cases is considered in this paper, which implements a dynamic load case that is modeled using Fluid-Structure Interaction (FSI). The Discrete Element Method (DEM) has gained prominence in FSI modeling of structures carrying a granular medium.14,15 However, until recently DEM remained computationally costly to implement.16,17 On the other hand, SPH is already used in prior work of Ushakov et al. to model granular cargo, and is known to be successful in implementation. 18 Accordingly, SPH is implemented in this paper to determine cargo dynamic load on hopper car structure, as it is available in a commercial form compatible with techniques for reduced solve times such as mass scaling. 19
This paper is organized into five body sections. The first section is an analysis of the available literature on sandwich panels, whereby the parametric studies from established literature are employed to determine the structural candidate of superior strength-to-weight characteristics. It is demonstrated in the review that hexagonal honeycomb sandwich panels are the candidate with highest potential for weight minimization when implemented in the roof and sidewalls of a hopper car under expected loads. In the second section, the load on a hopper car is characterized in further detail using explicit Finite Element Analysis (FEA) employing SPH to simulate sloshing of cargo under a dynamic load. Further load cases are introduced per regulatory standards in the implicit model as well. In the third section, a multi-stage optimization is introduced, where the hopper car is first optimized globally using topology optimization under all load cases of concern, which provides a car frame design which has been globally optimized for a high stiffness-to-weight ratio. Then, the second stage is introduced, whereby a MSDO is performed on a characteristic panel of the hopper car. In the fourth section, a case study employs the multi-stage design optimization for a generic hopper car. Results of the case study are discussed in the fifth section, and broader implications are summarized in the conclusions.
Analysis of literature and selection of structural candidate
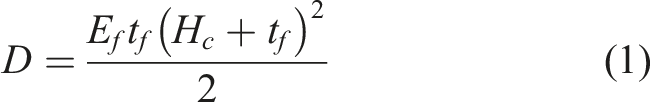
This section aims to perform a literature analysis to determine the sandwich core topology of highest strength-to-weight capacity under expected hopper car loads. Rigidity per unit width of a sandwich panel with very thin faces is given by the equation
20

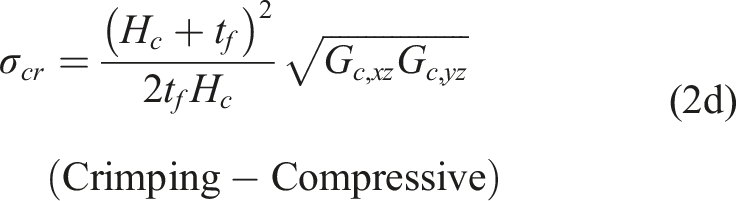
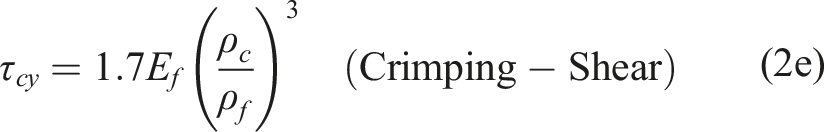
Equations (2d) and (2e) reference two forms of crimping, namely, compressive and shear. Though the failure modes are similar, shear crimping occurs due to out-of-plane shearing of the core, while compressive shear occurs when buckling of the panel results in earlier failure of the core than the face, resulting in out-of-plane shearing. Both forms of failure are investigated in this paper to ensure a sandwich panel which is structurally sound in all load cases.
Rathbun et al. investigated strength-to-weight ratios of various metallic sandwich panels of varying topologies in a parametric study using the failure characteristics laid out above.
22
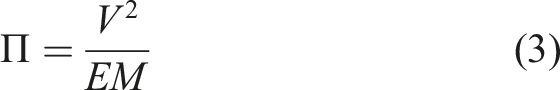
To characterize the load experienced by sandwich panels under bending in a parametric manner, Rathbun et al. introduce the load index, Π, of a sandwich panel as22,23
Next, Rathbun et al. establish the parametric relationship between the load and weight indices, Ψ, of a metallic sandwich panel.
22
Here, the weight index is a unitless property related to the load index based on the geometry of the core and the dominant sandwich failure mode. The development of the weight index is discussed extensively in the work of Rathbun et al.
22
and in the Thesis of Al-Sukhon.
24
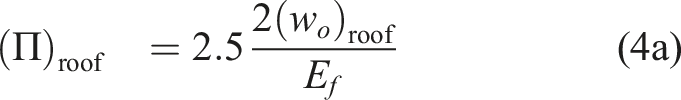
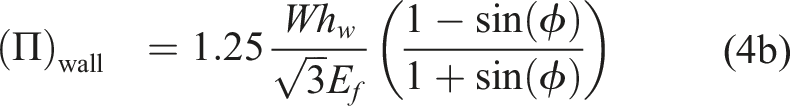
This relationship is plotted in Figure 1. For an example calculation to show the anticipated load index for each component, a wall height of 2.5 m and a cargo specific weight of 850 kg/m3 are used to give numerical value to the load index, while considering an elastic modulus of 210 GPa. From the plot, it is evident that the relationship between weight and load index is discontinuous. This discontinuity is because for each panel, there exists a weight index equation for each panel failure mode. The equation providing the highest weight index is taken to be the panel of conservative design. As the load index varies, so too does the dominant failure mode for each panel, and by extension the equation dictating the weight index. The result is a parametric comparison between the weights of core topologies of different forms of sandwich panels given the same loading and material. Weight-to-Load Index of sandwich panels with varying core topologies on a logarithmic scale based on the work of Rathbun et al.
22
Load indices of hopper car structural components are highlighted by the dashed vertical lines.
As shown in Figure 1, hexagonal honeycomb sandwich panels demonstrate potential to offer a design of minimum mass in the walls and roofs of hopper cars. Meanwhile, the floor of the hopper car is found to be in the high load regime where the weight index for a sandwich panel approaches that of a solid metallic plate, implying its implementation is not feasible. Therefore, the present study focuses on implementation of hexagonal honeycomb core sandwich panels in the wall and roof of a hopper car.
Numerical methodology
Scope of analysis
Design loads calculations are based on a combination of both explicit and implicit FEM, where explicit FEM is employed for determination of dynamic loading by FSI, and linear-static implicit FEM is leveraged for all other load cases. Four load cases from Section C, Part II – Design, Fabrication, and Construction of Freight Cars, M-1001 of the AAR MSRP are identified and used for analysis in the present work
23
: • Live Vertical Loading – A floor loading with a pressure P = Wh
w
to simulate the cargo – A side wall lateral hydrostatic load according Equation: – A roof pressure of 720 Pa, and a concentrated load of 1335 N on the middle of the roof.
To simulate inertial loads resulting from a sharp turn, a lateral acceleration of 0.3 g is considered.
23
All loads are multiplied by a safety factor of 1.25 per requirements of the MSRP. • Draft Tensile Load • End Compressive Load • Modal Analysis
Though the above load cases can produce adequate stress results for sizing and design optimization of the car structure, an additional FSI by means of explicit FEM is proposed. In this FSI load case, the entire structure and its contents are excited by a 0.3 g acceleration over a time of 1.85 s to simulate a sharp turn. The time of 1.85 s is selected based on how long it takes for the particles to settle after sloshing. In the LVL, this lateral acceleration can only act on the walls of the hopper car and is not applied to the cargo. Inclusion of the FSI as an additional load case is meant to correct for this by determining the distributed loads on the hopper car resulting from the cargo acting upon it. Details of the evaluation of this load case by means of explicit FEM is given below. Since many of the loads in the LVL are not applied in the FSI, a load factor of 1.5 is used rather than 1.25 in order to ensure conservative results.
Explicit finite element model
Material parameters for the steel and SPH cargo.
The simulation is performed in two stages over 1.85 s. In stage one, the simulation is run with kinetic energy relaxation in order to allow the SPH particles to settle in a rested position while eliminating artificially high deformations due to the settling process. In stage two, a 0.3 g lateral acceleration with a load factor of 1.5 is applied to simulate the sharp turn.
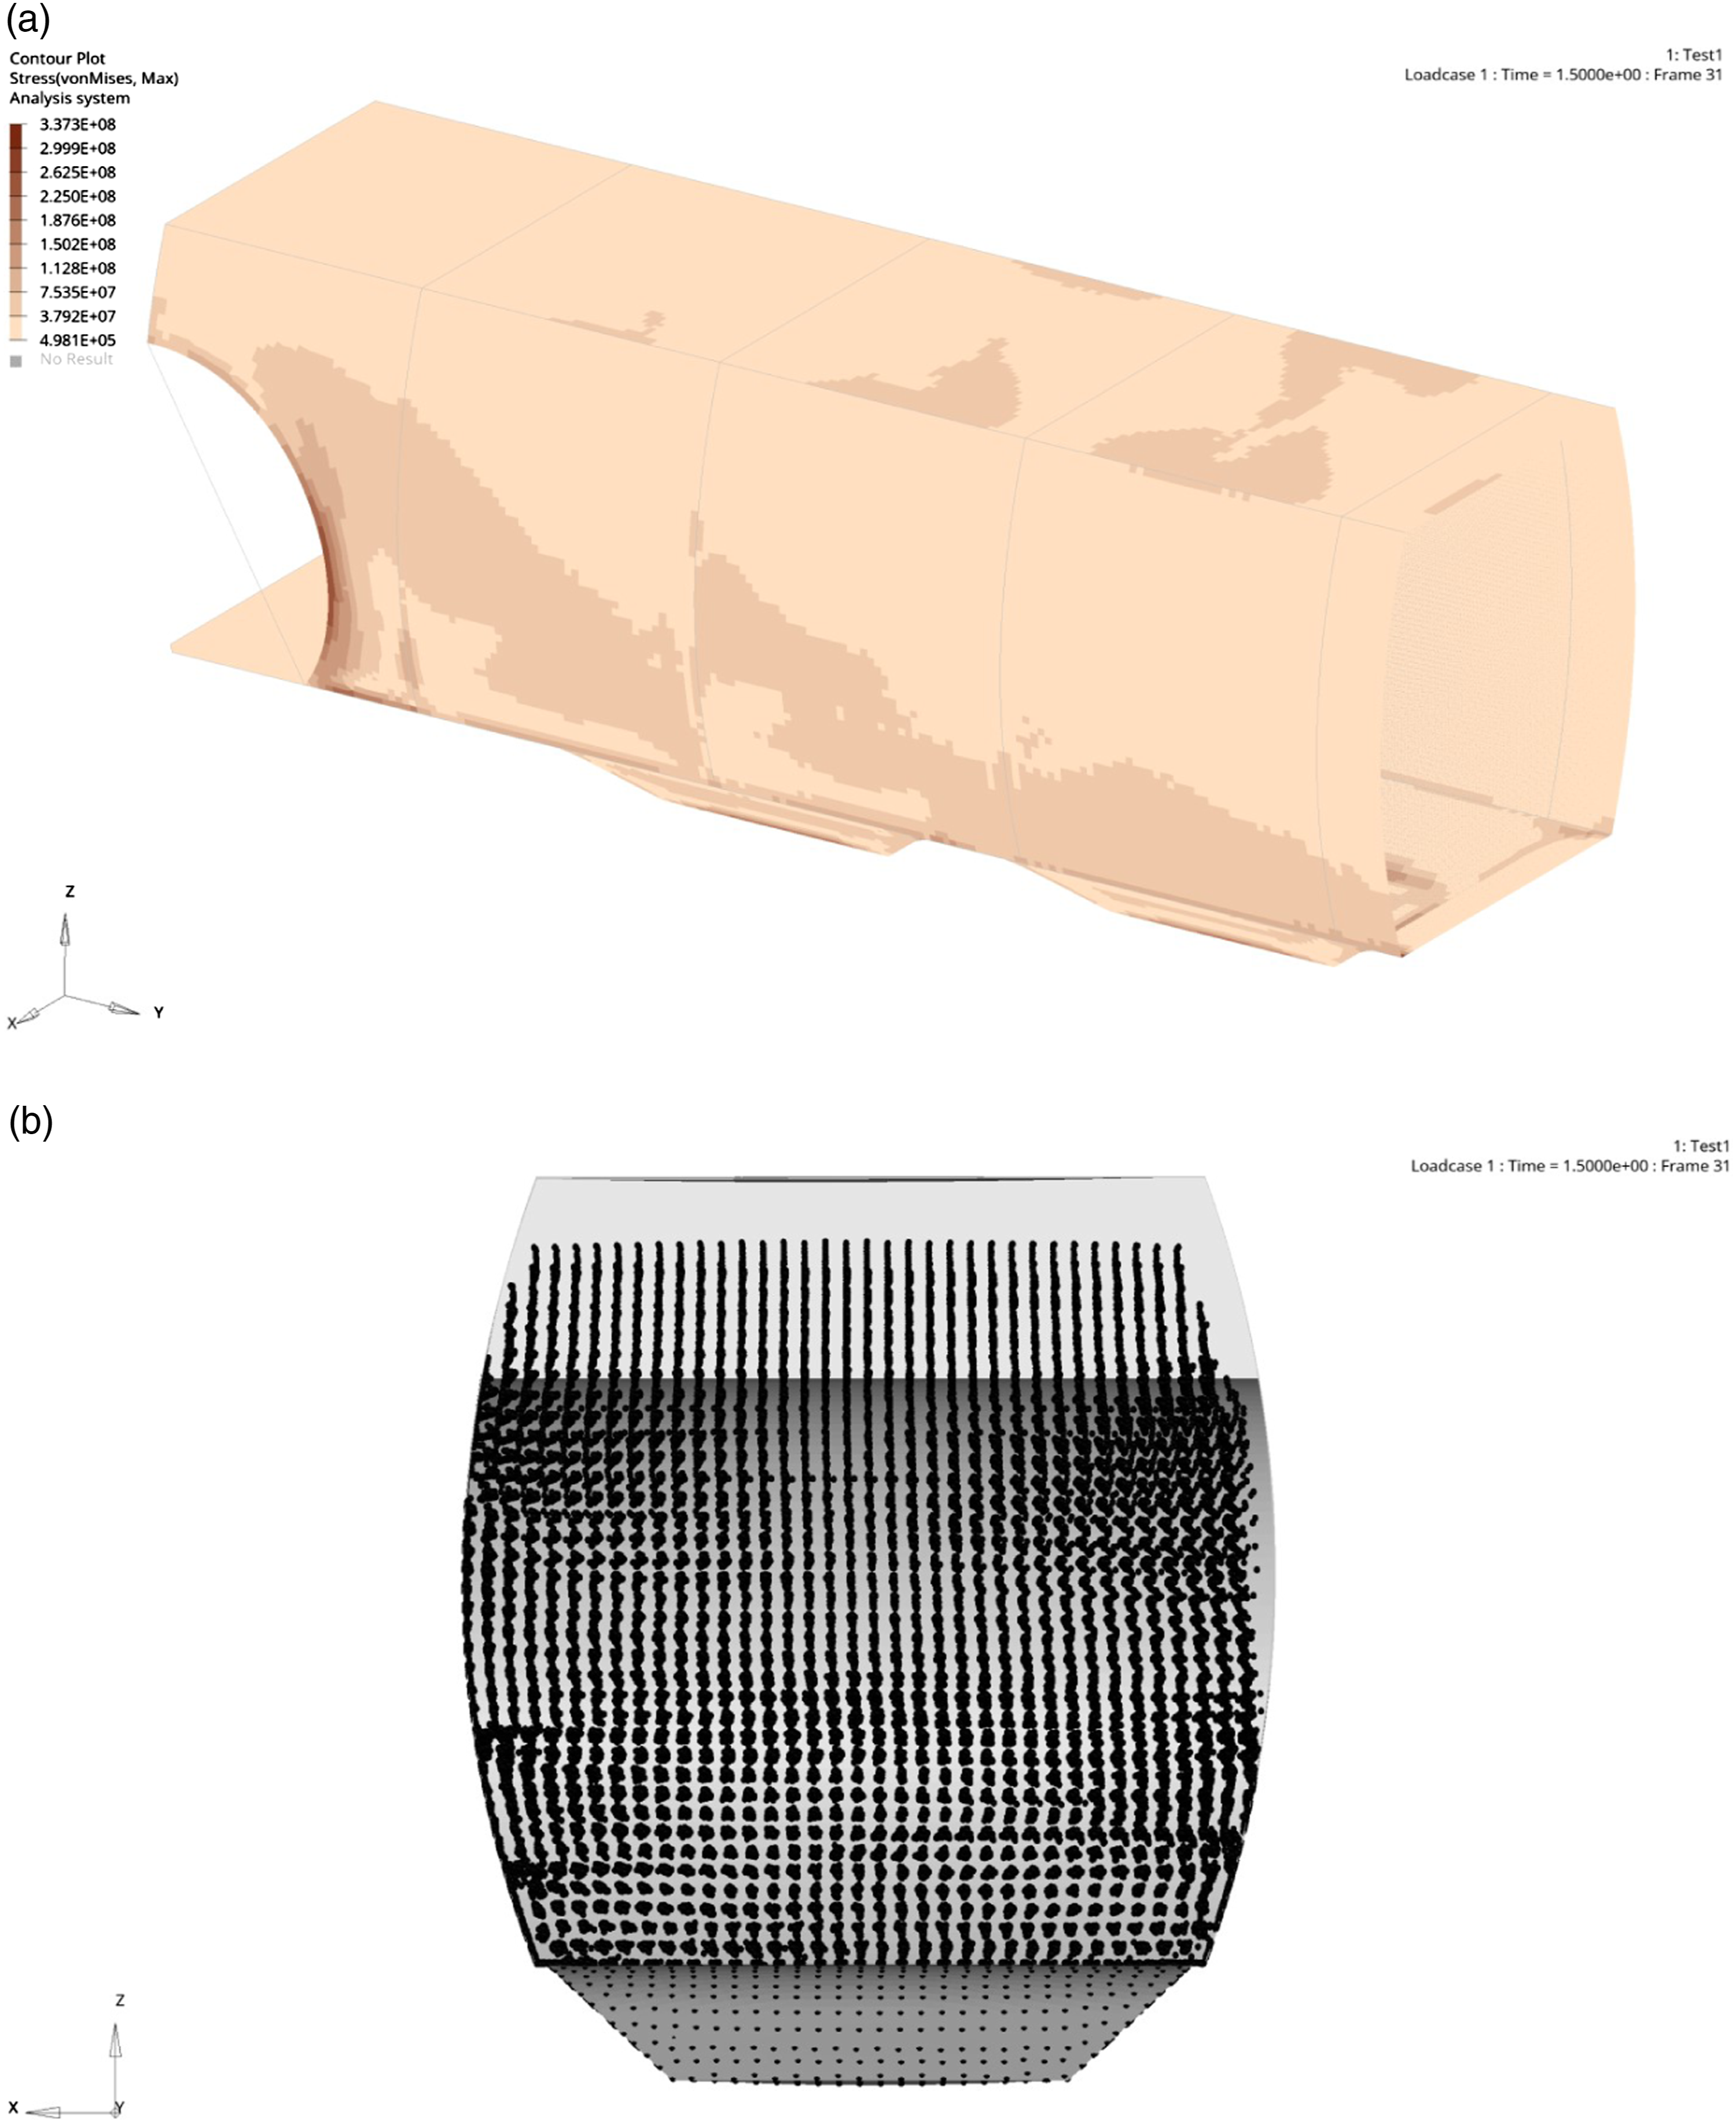
It is shown from Figure 2 that in the first 0.5 s of the simulation, the kinetic energy rapidly spiked and was subsequently relaxed as part of the settling phase. In the sloshing phase from 0.9 s onward, it is shown that the total and internal energies are equal, while kinetic energy is effectively zero, implying that all the energy in the system is translated into strain energy in the structure. This complete transfer of energy demonstrates that the simulation is successful and valid. The results of the FSI are shown in Figure 3. Time history plot of simulation energy in the explicit FEM. The energy plot shows that all kinetic energy is transferred to the structure in the form of strain energy, thus verifying the success of the model. Results of the explicit FSI model.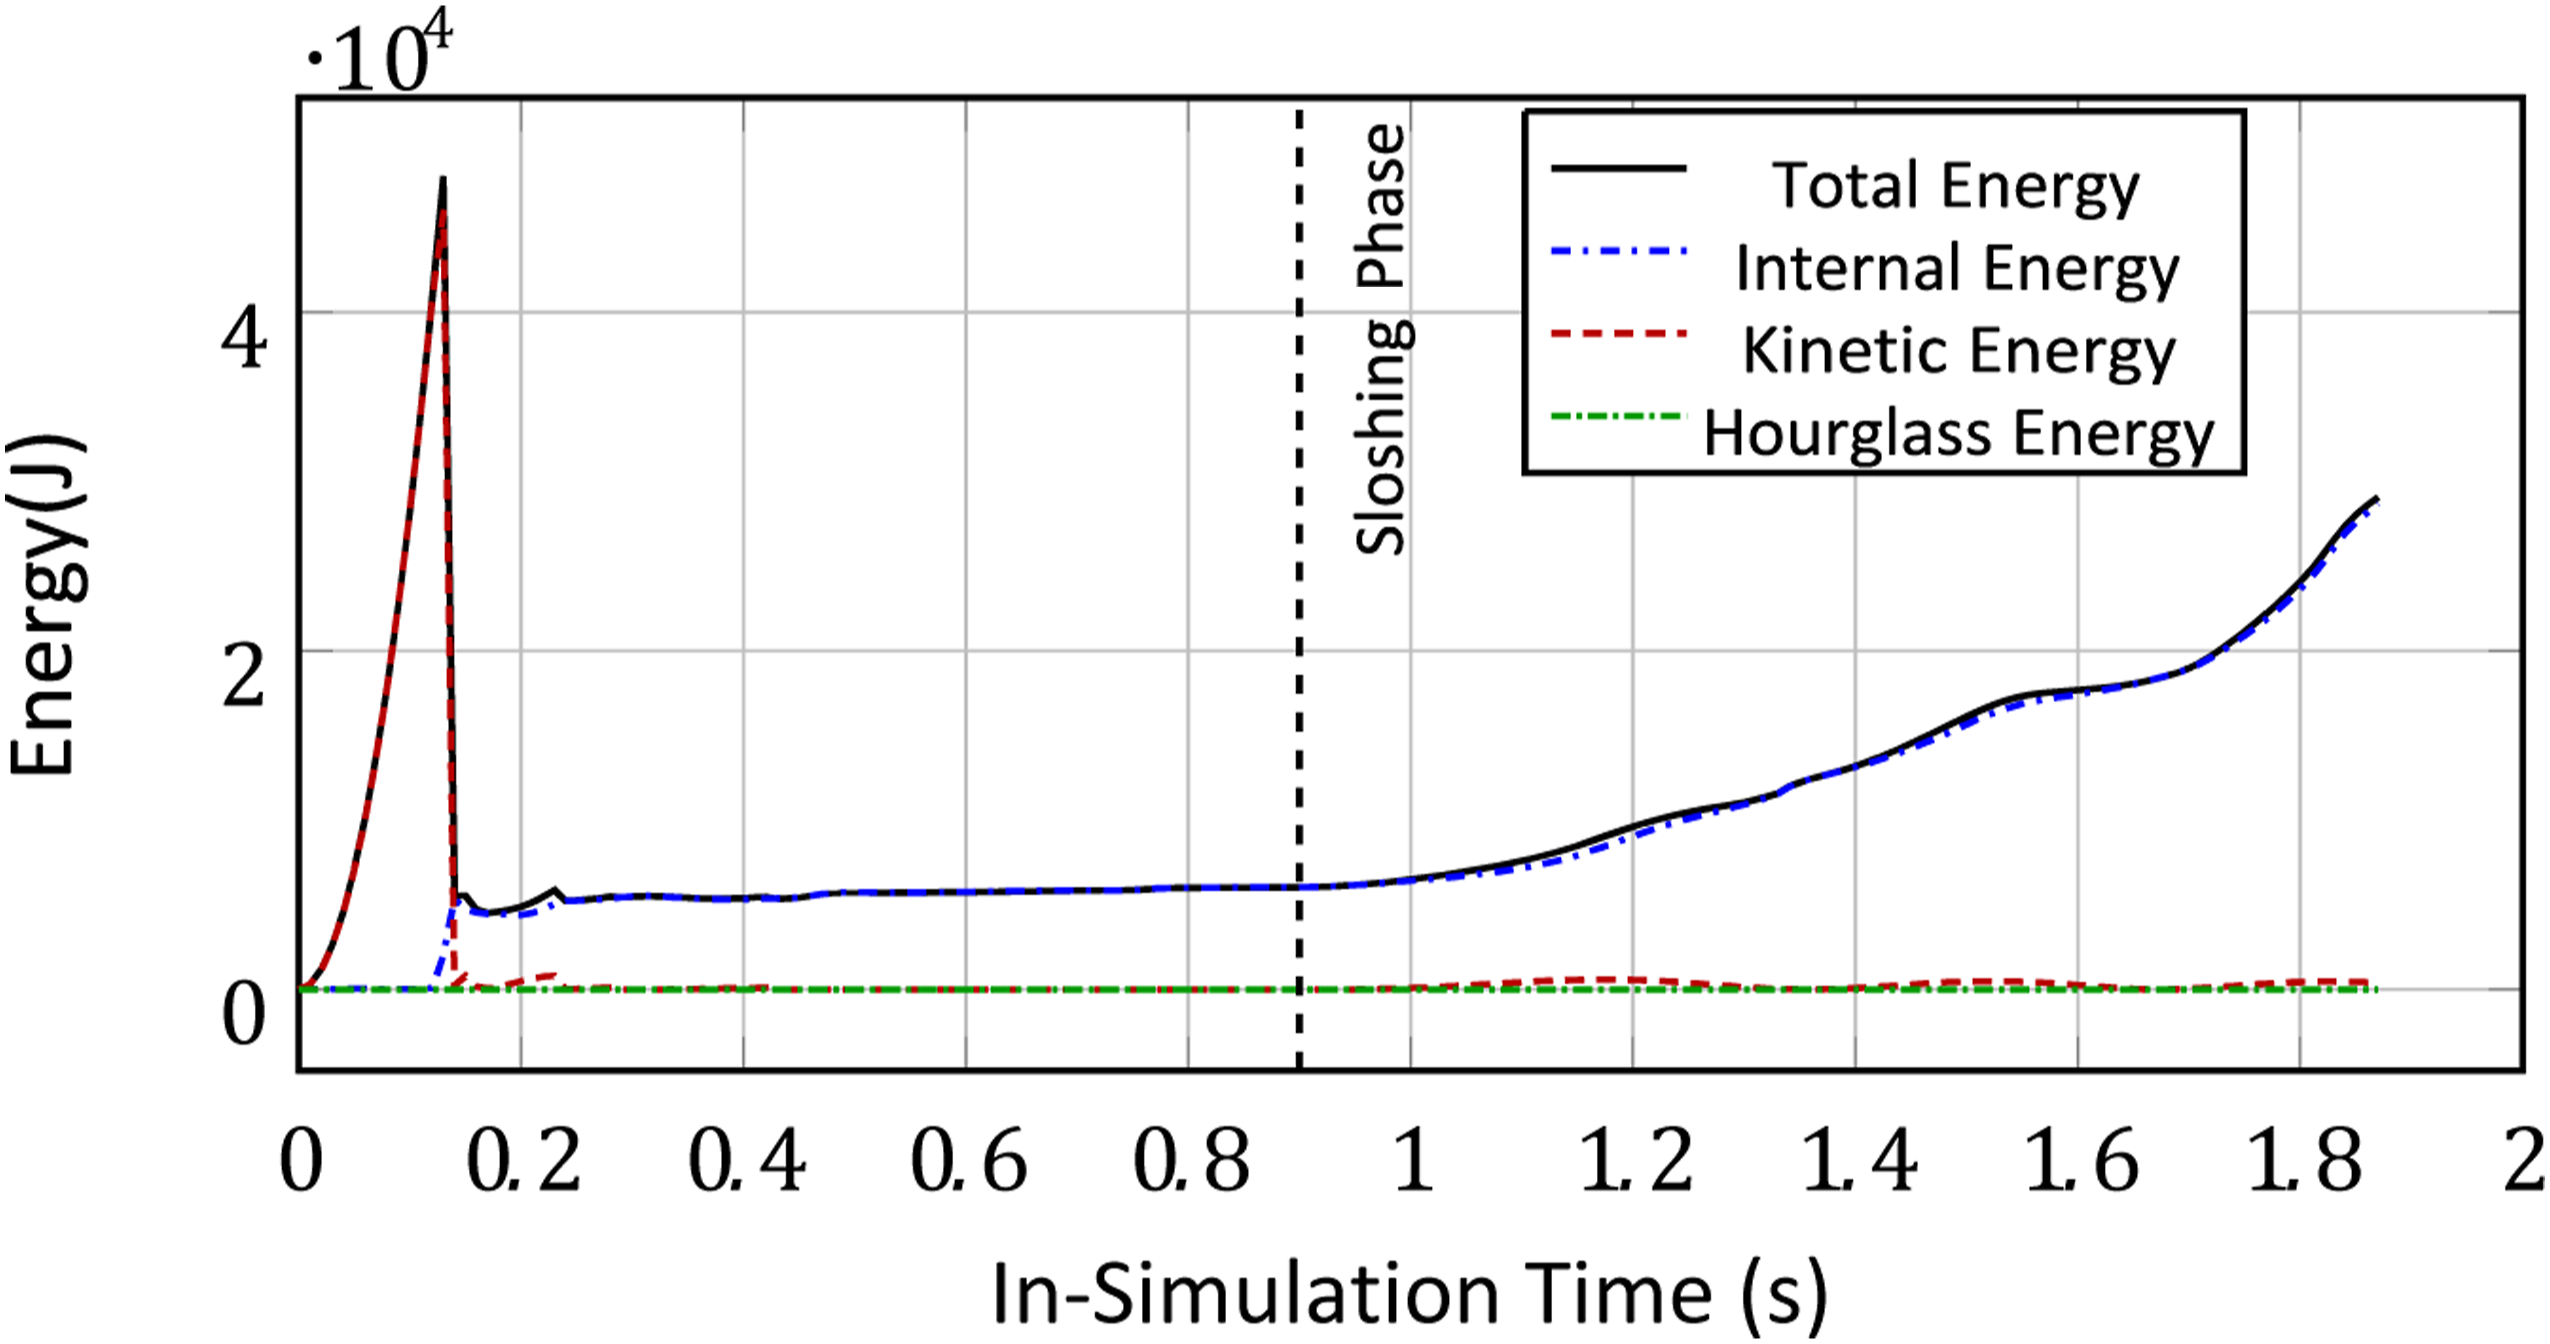
Implicit finite element model
From Figure 4, it is shown that after the settling phase, contact is initiated between the SPH cargo and the walls. During the sloshing, the lack of damping results in the excitation of the bending mode of the hopper car wall. This in turn causes the car wall to break contact with the SPH momentarily, then re-initiates contact as it reconnects. While this results in artificial fluctuation, the fluctuation is constant and continuous. Furthermore, application of damping would result in the reduction of the SPH contact load. Therefore, the response at the time of peak contact force is said to provide a conservative estimation of the FSI loading. This time is seen from Figure 4 to be at 1.5 s, thus the response at this time is transferred to an equivalent static model. Note that the peak at 1.5 s is the second of three peaks. This peak in specific is chosen because it is at this point where the SPH cargo is fully in contact with the wall, as opposed to the first peak, where the SPH has just begun to make contact. In taking this peak, it is ensured that the full weight of the SPH cargo is considered. Time history plot of total interface contact force of the explicit FEM.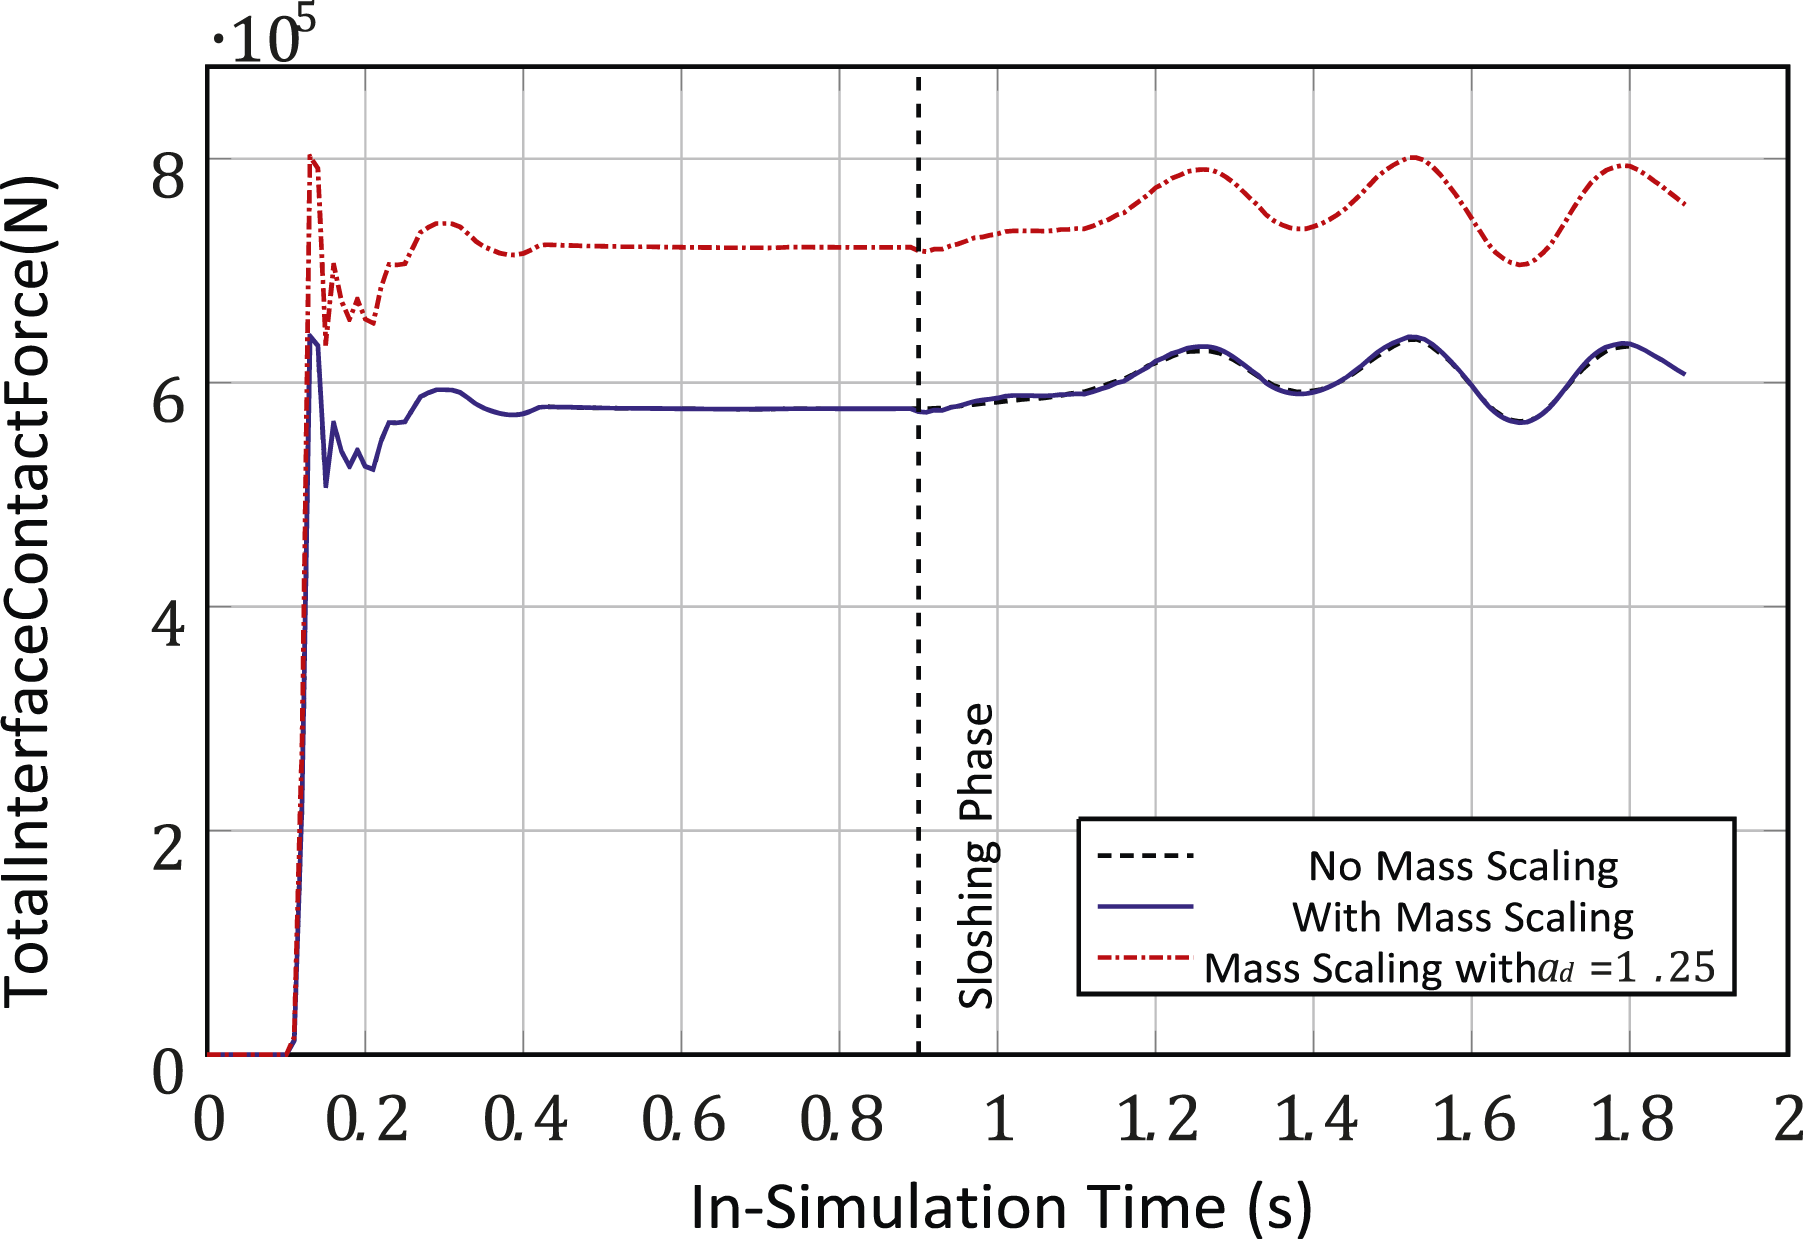
The equivalent model uses the dynamic displacements and accelerations of the time dependent explicit model in the following equation
The final solve time is found to be 18 s on an Intel(R) Core(TM) i7 CPU with a clock speed of 2.67 GHz. In the implicit equivalent static model, all other load cases mentioned previously are employed in separate sub-cases.
Optimization framework
A multi-stage approach employing a hybridization of various optimization algorithms and strategies is proposed. The first stage considers a topology optimization of the global structure, while the second stage considers a MSDO for the component level.
Stage I—Topology optimization
The first stage in the presented method employs a topology optimization at the mesoscale whereby optimal beam location is determined. Topology optimization is performed using the Solid Isometric Material with Penalization (SIMP) method by Bendsøe.
28
A process flow diagram of the procedure is shown in Figure 5. The topology optimization aims to find critical load paths for the placement of the support beam structures. In each iteration, topology optimization for minimization of compliance with a volume fraction constraint is performed thereby generating an element density distribution. This plot is subsequently leveraged to either add or remove beams in critical and noncritical loading regions, respectively. A threshold relative element density of ρ
i
≥ 0.67 is used to filter topology results. Topology Optimization process flow diagram.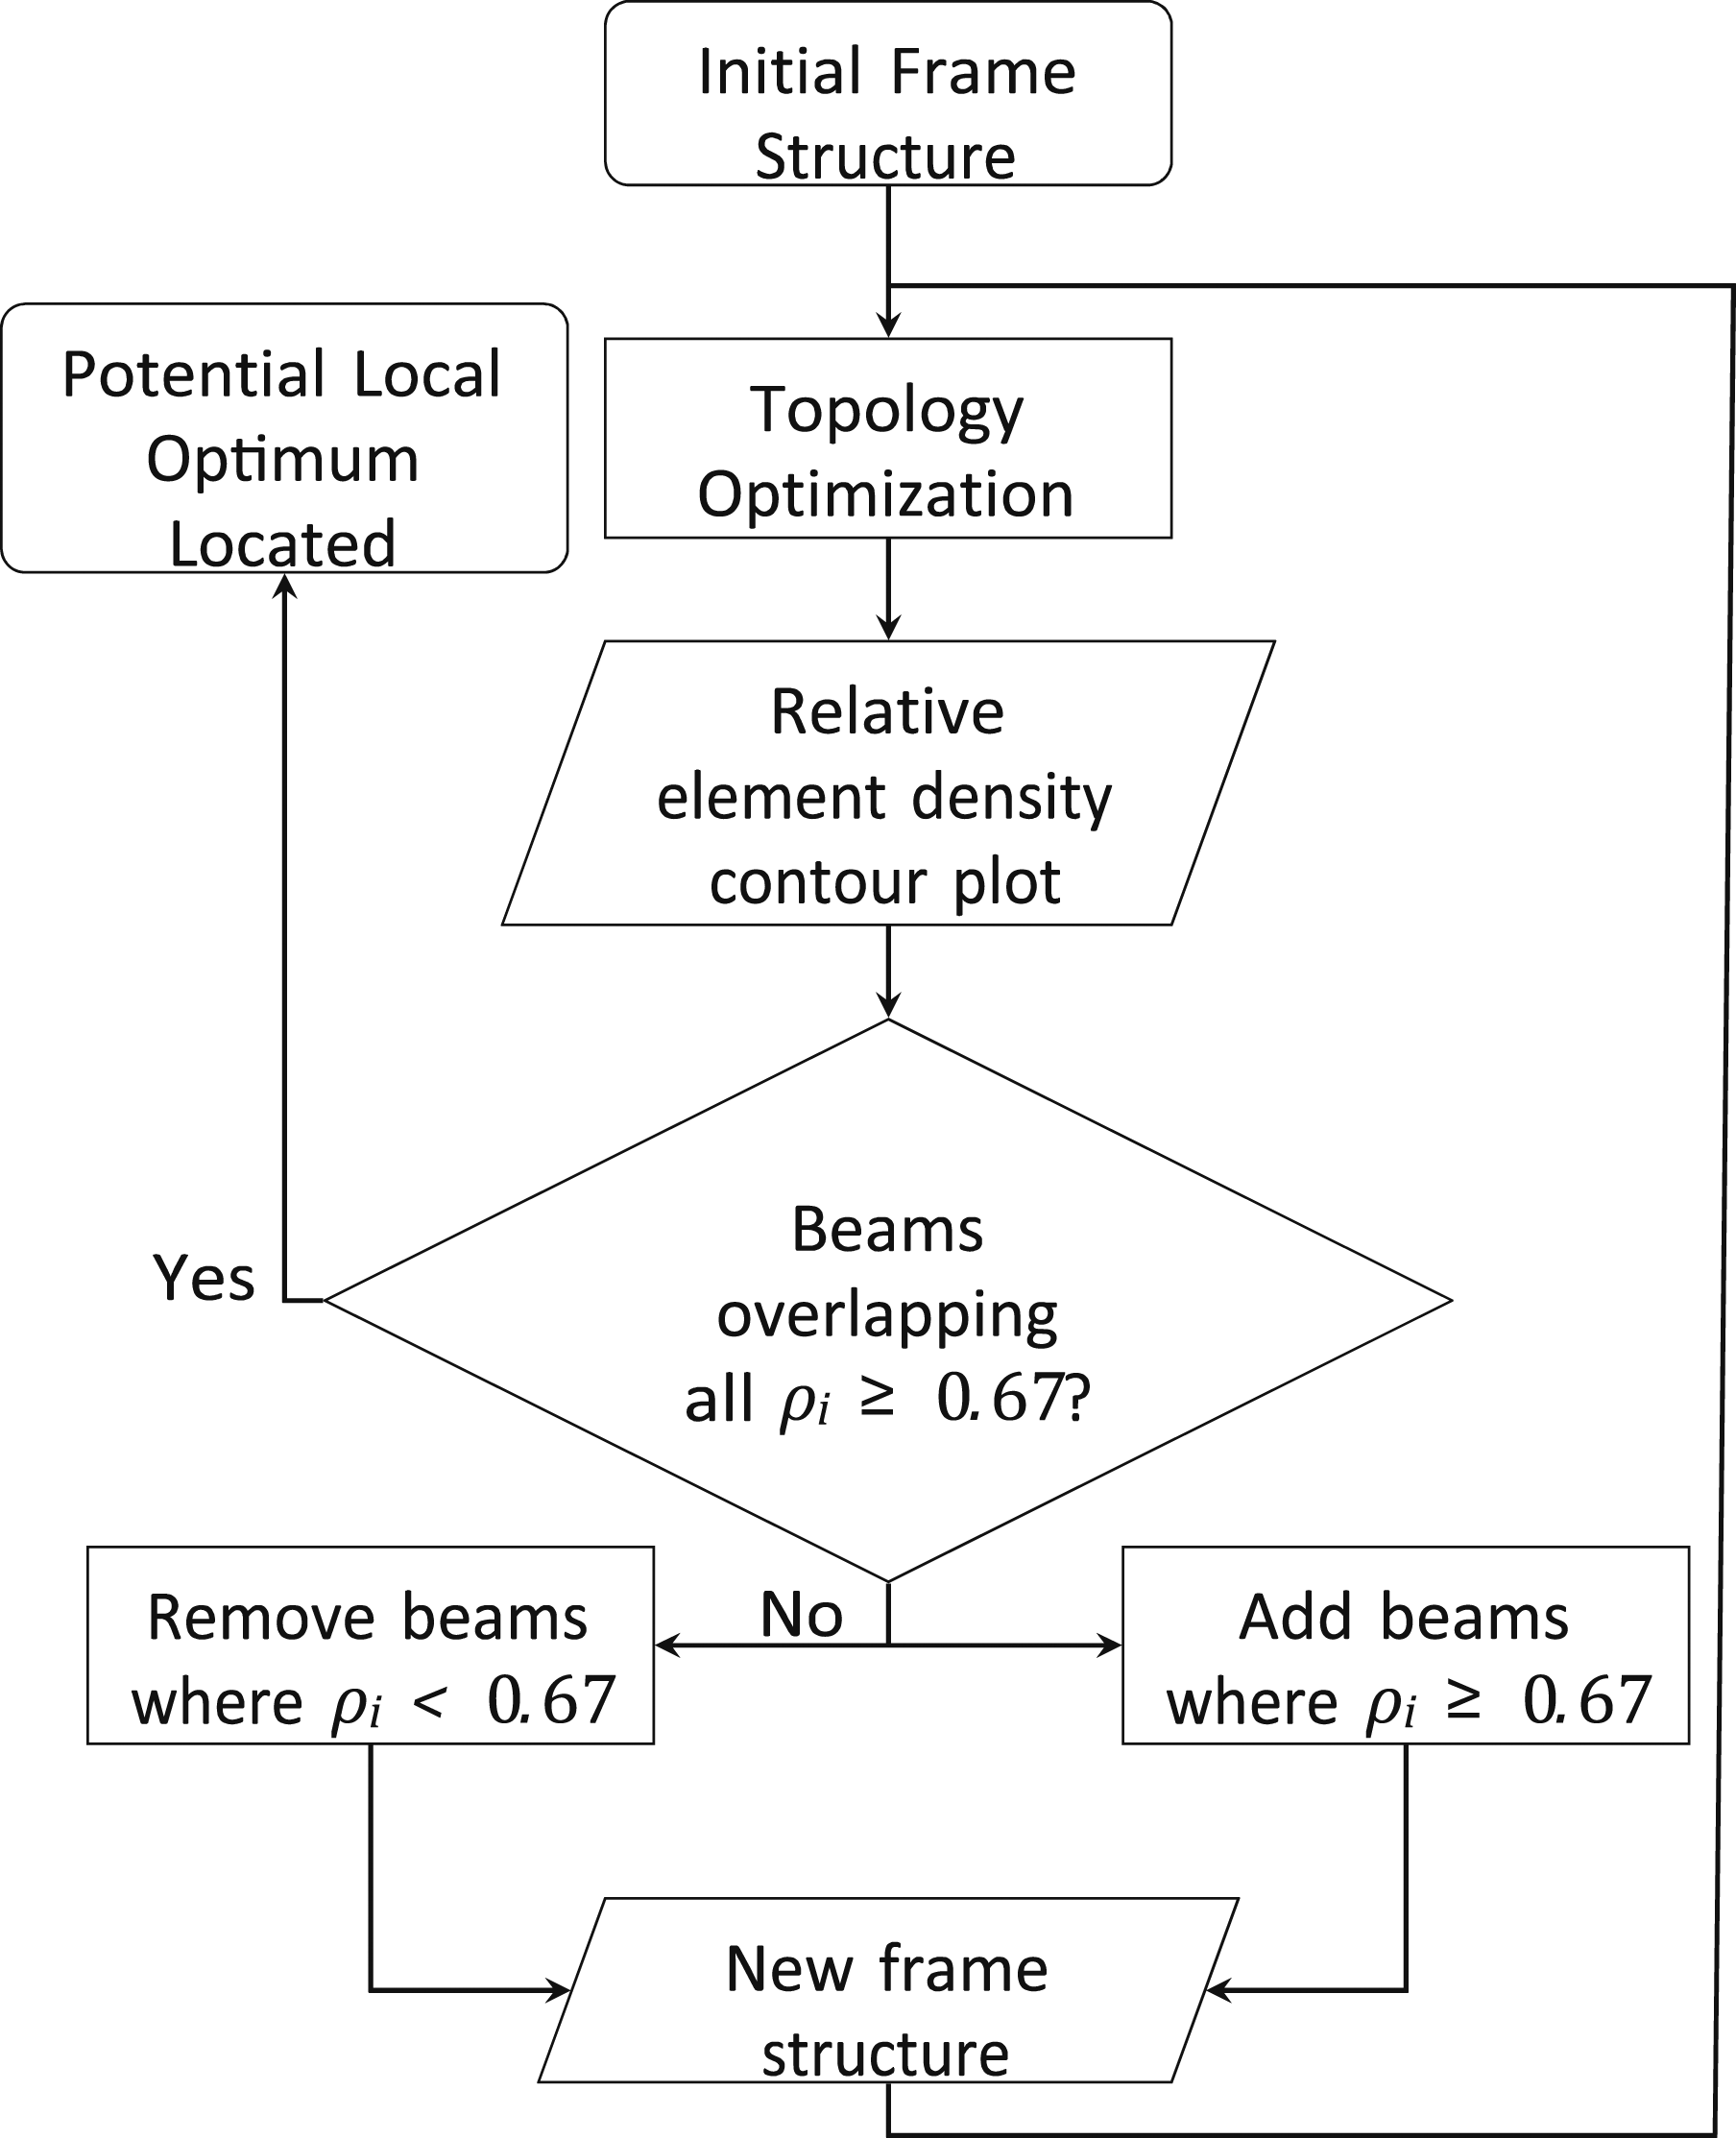
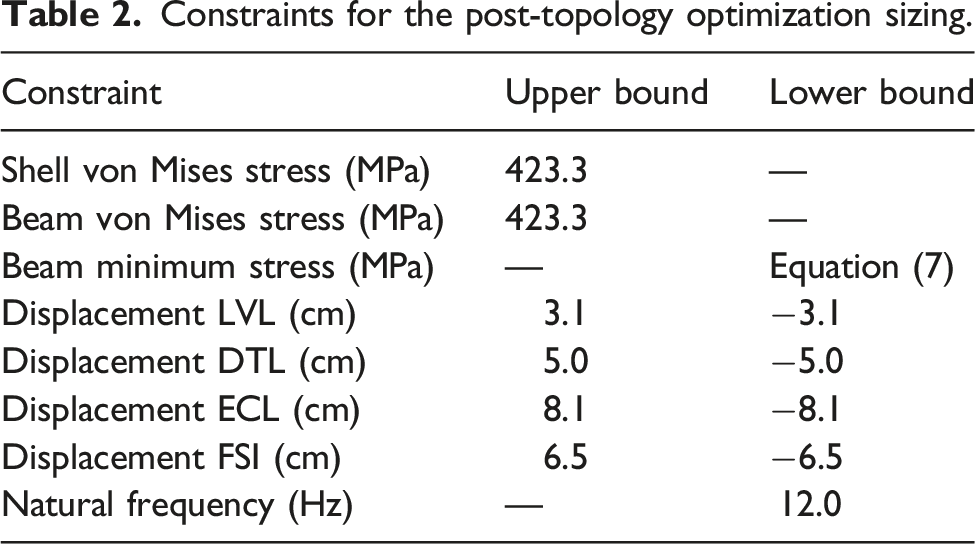
Upon conclusion of topology optimization, size optimization is performed using Altair OptiStruct’s the Global Response Surface Method (GRSM) for optimization. 29 The walls and beams of the structure are divided such that a minimum number of design variables provides a robust optimization while ensuring meaningful convergence. The variables are: a cross-sectional height, H, and width, B, are considered, along with a thickness perpendicular to each axis lying within the cross-sectional plane, T1 and T2. For each wall division, a plate thickness of T p is also considered.
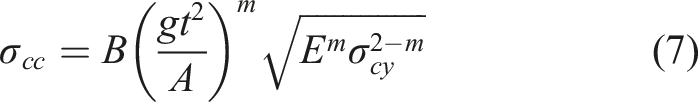
Constraints for the post-topology optimization sizing.
Stage II—Multiscale design optimization
Though traditional topology and sizing methods produce structures of minimal weight rapidly for traditional materials, it was demonstrated earlier in this paper that further savings can be achieved through implementation of sandwich panels in the walls of the hopper car. In the work of Al-Sukhon, a traditional multi-objective optimization methodology is performed to identify the design variables for a hexagonal honeycomb sandwich panel of maximum strength-to-weight ratio, with a section of the hopper car’s the sandwich panel wall modeled using basic statics. The optimization procedure produces a Pareto front which gives the ideal sandwich panel variables. However, it is determined that once these variables are implemented into the FEA of the hopper car, sandwich failure occurs. This is because any analytical and traditional optimization methodology used cannot adequately capture the loading on the hopper car, nor provide results specific to its requirements.
24
For this reason, the second stage of the optimization is performed on a critical region of the hopper car using a MSDO with an FEA of the hopper car embedded directly. Use of an MSDO with the FEA in each function evaluation presents two challenges. The first is that there exists no gradient to evaluate the cost function, thus stochastic methods must be employed. In stochastic methods, presence of infeasible design regions in the cost function result in many cost function evaluations since these solvers rely on a prior function evaluation to arrive at an optimal solution. The second challenge is that many of the constraints imposed on the design problem are related to stress in the structure. This means that the constraints can only be evaluated a posteriori; the FEA and cost function must be evaluated to acquire stress results to determine whether the design variables are feasible. Due to this limitation, constraints cannot be directly applied to the system, and must instead be integrated into the cost function in some manner. A penalty method for optimization employing the Kreisselmeier–Steinhausser (KS) equation is used. Though many methods exist for the synthesis of penalty-based cost functions, the KS equations have demonstrated success in prior work, and are therefore used in this paper.31–33 Through this approach, the constraints are calculated as a secondary term in a penalized cost function, Φ(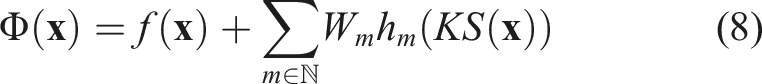

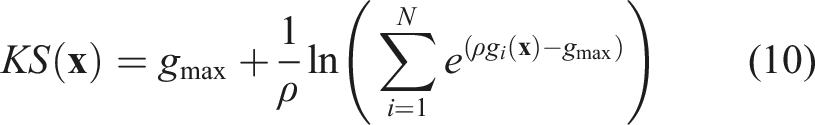
Now, an optimization problem is produced that considers constraints without directly constraining the design space, but has infeasible points penalized by equation (10).
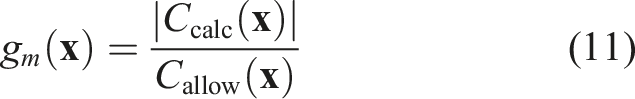
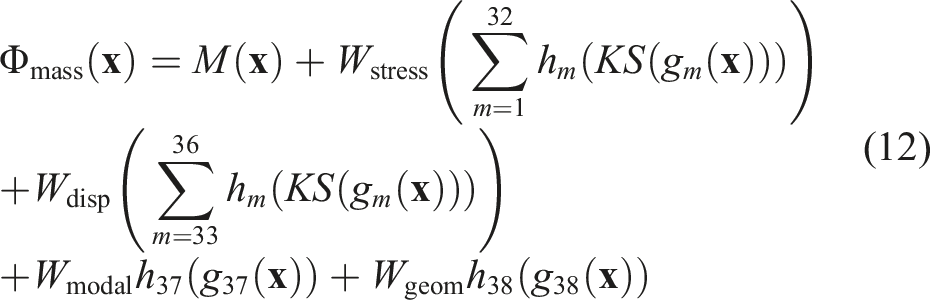
The penalized mass function
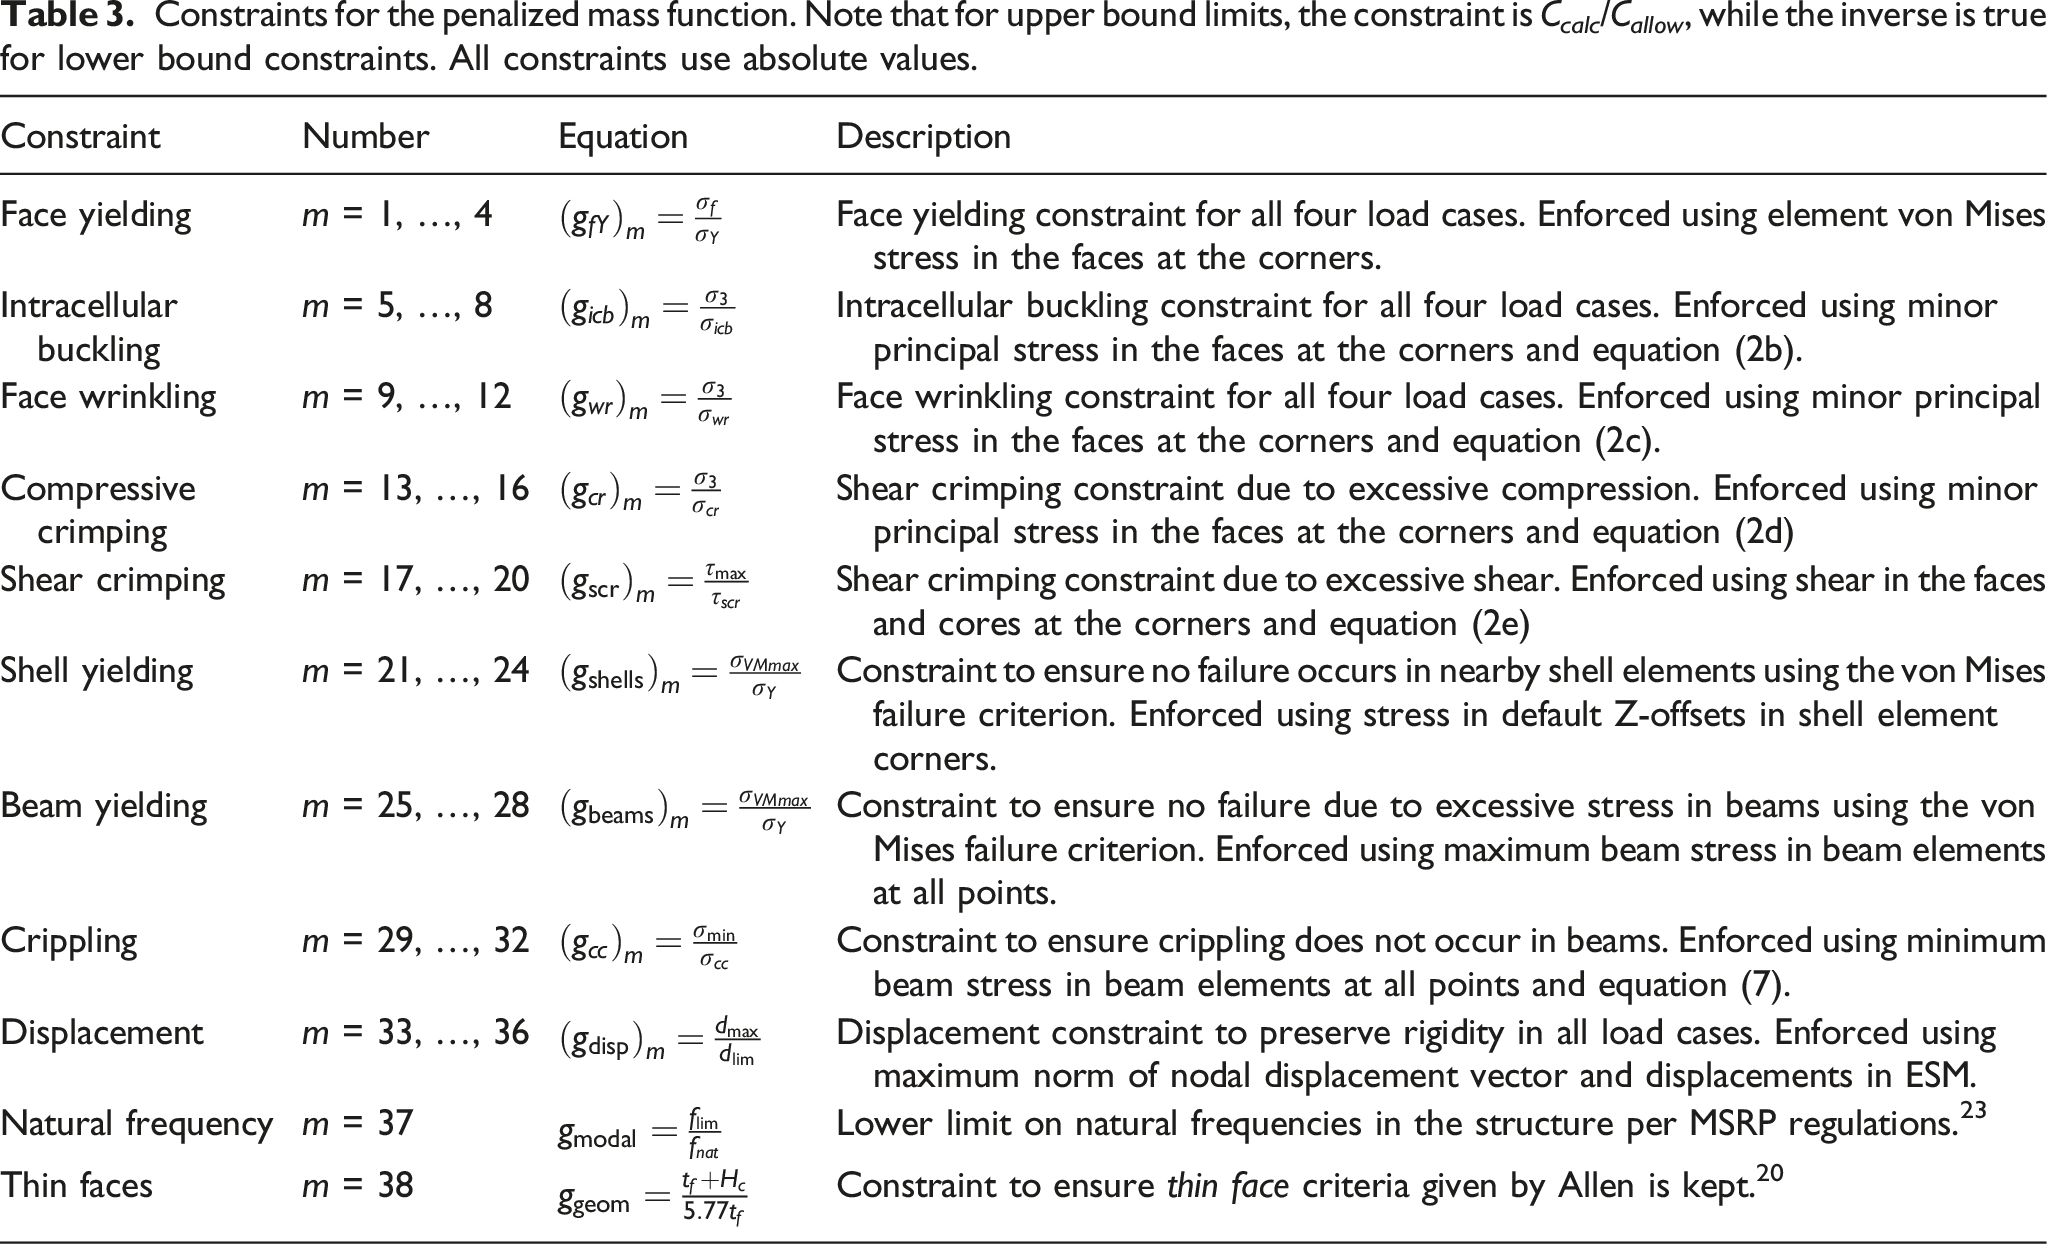
Constraints for the penalized mass function. Note that for upper bound limits, the constraint is C calc /C allow , while the inverse is true for lower bound constraints. All constraints use absolute values.
The penalized compliance function
The penalized compliance function is written as base compliance given by FEM in addition to all constraints applied as penalties in the form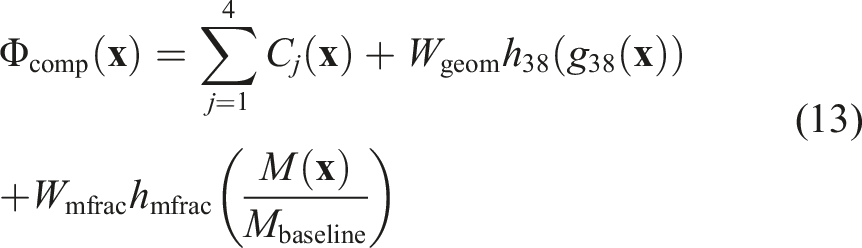
The procedure shown in Figure 6 is followed. First, a sub-model is defined and validated to reduce cost function evaluation time. After an appropriate sub-model is selected, two cost functions are defined using equation (8): one for a penalized mass, and another for penalized compliance. To gain a better understanding of the design problem and appropriately apply penalty weightings, response surfaces are created using each penalized cost function with constraints enforced using the Kreisselmeier–Steinhausser equations. Next, an individual optimization is run for minimal penalized mass and compliance. Finally, a Pareto front is found for the design space to determine the ideal mass-to-compliance ratio for the panel. Note that it is not always necessary to execute this solution in full. It is certainly possible to enter straight into the Pareto front generation. However, it is important to note that the Pareto optimization program requires a many function evaluations to produce a meaningful front. The motivation for each intermediary stage is that it leads to an increased understanding of the response of the optimization problem and the locations of the local optima. By finding the local optima and using them as seed points for each subsequent step, optimization search times are drastically reduced, leading to a faster solution. Overview of the Panel-By-Panel MSDO procedure.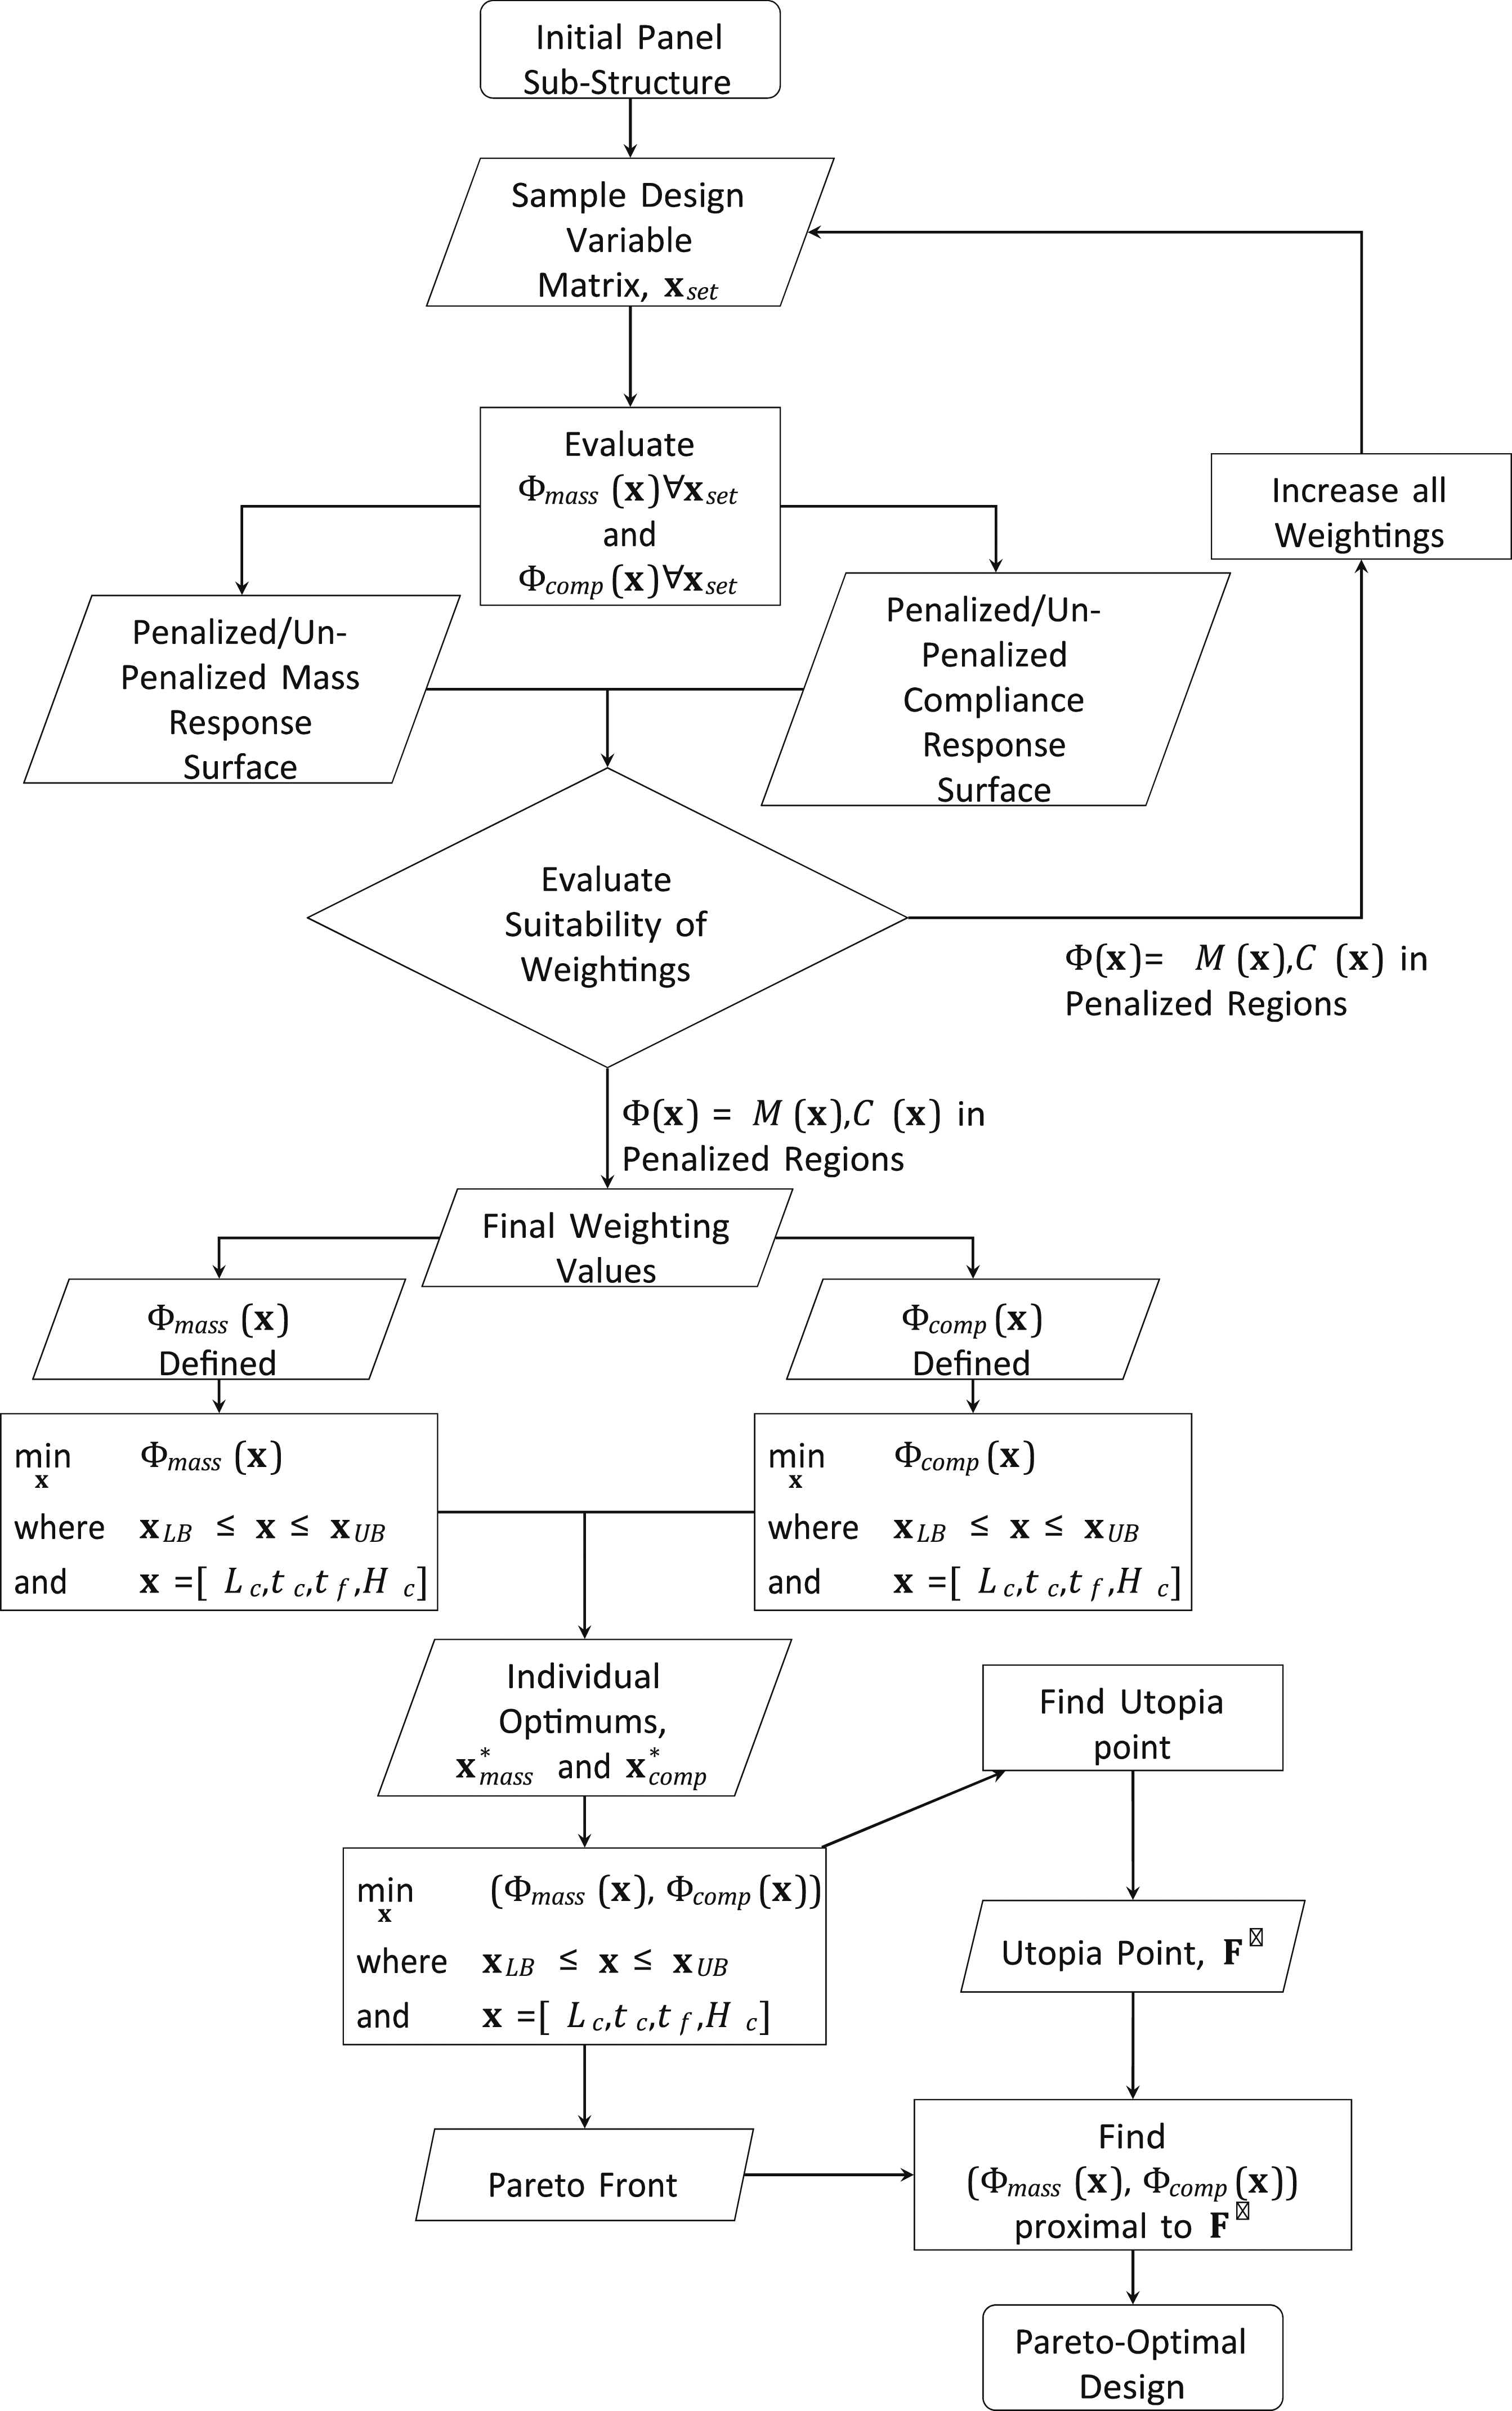
Case study and results
Stage I—Topology optimization of a global hopper car structure
Topology optimization is performed by minimizing compliance of the structure, and with a volume fraction limit of one quarter. Results for each iteration of the topology optimization are shown in Figure 7, with initial models for each iteration on the left and element density contour plots on the right. From the element density contour plot shown in Figure 7(f), it is apparent that most of the wall structure is of low relative density, indicating that the beams are providing most of the rigidity in the design shown in Figure 7(e). Element density contour plots from the different topology optimization iterations in ascending order. Shown on the left are the beam layouts used in each iteration. Black indicates beams which are added for the present iteration, while light gray indicates beams which were initially present or present in previous iterations.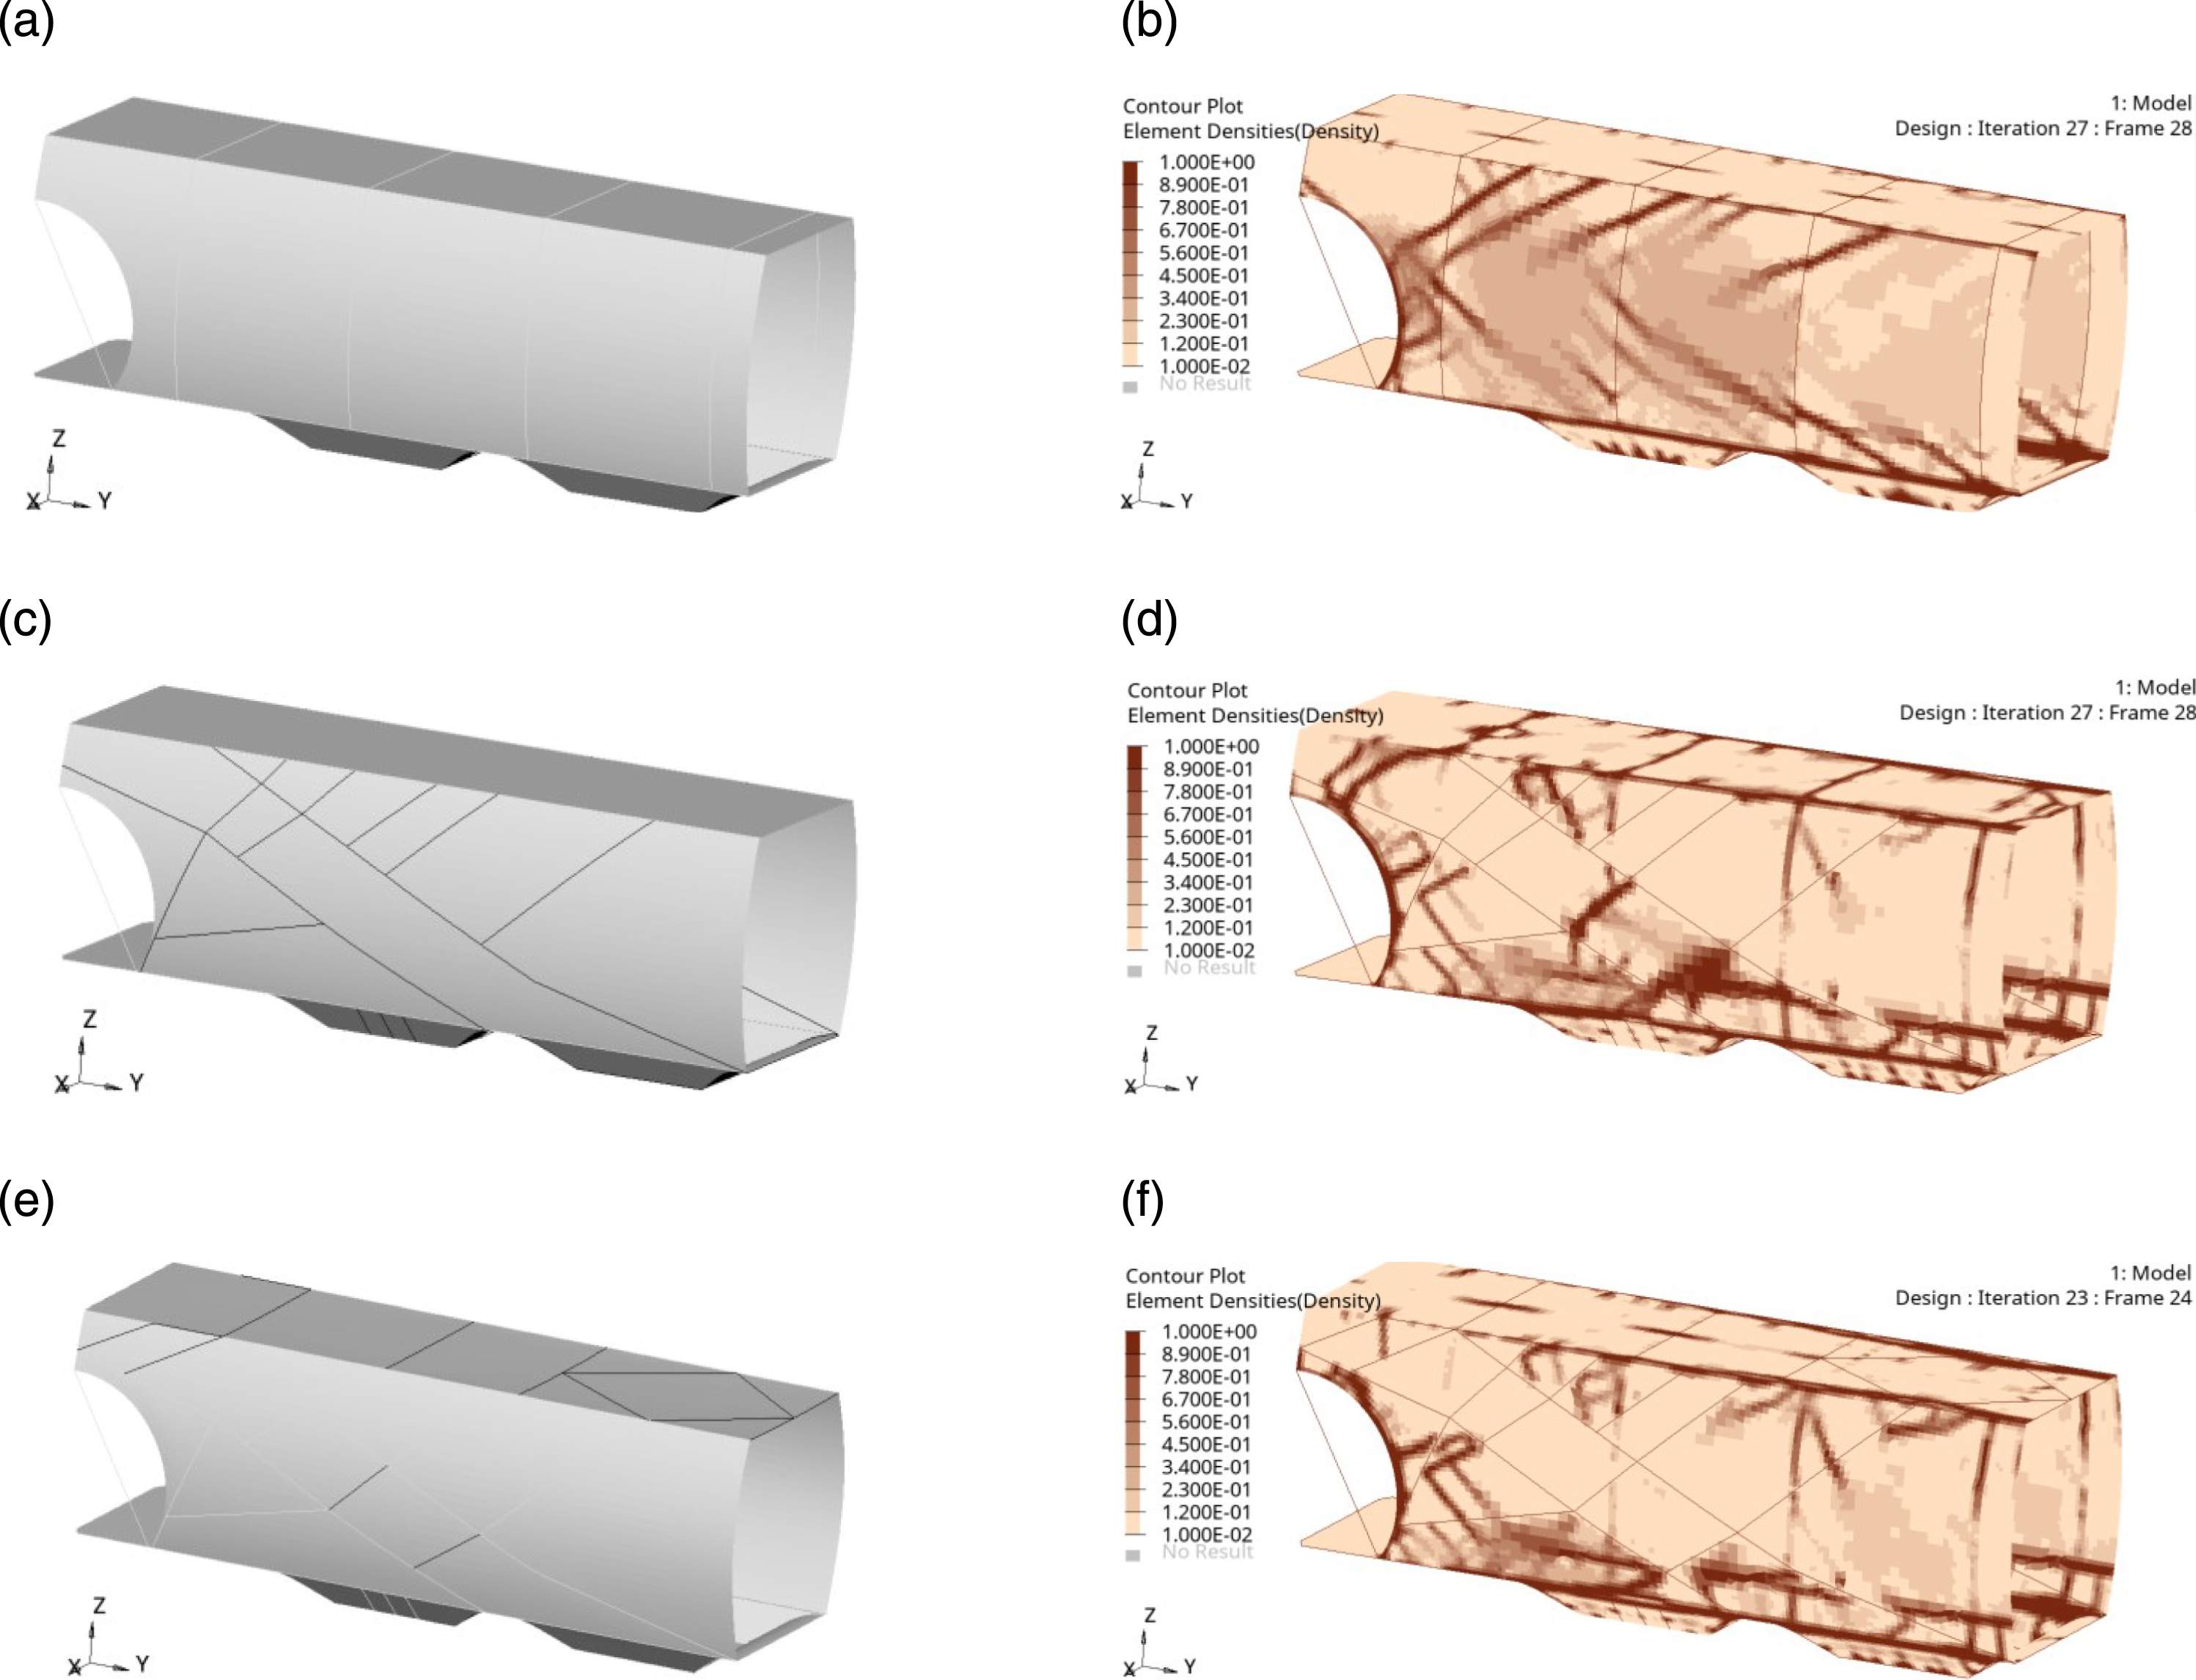
Upon completion of the topology optimization procedure, size optimization is performed using Altair OptiStruct 29 for minimal mass subject to the constraints in Table 2. The mass of the half model converges to a final value of 6644.2 kg, implying a total car-body mass of 13,288.4 kg. Now that a car-body with optimal beam placement is identified, sandwich panels are readily applied in the car walls and roofs with less concern for major changes in rigidity and stresses.
Stage II—Multiscale design optimization of a hexagonal honeycomb panel wall on a hopper car
To determine the sandwich variables giving the structure of minimum weight, a MSDO is performed on the walls of the hopper car. A reduced order model using the Superelement method is produced for timely results on the design space of interest. In Figure 8, the wall panel of interest for this case study is highlighted in black. The residual sub-model is highlighted in dark gray, while the portion of the model reduced input via the Superelement method is highlighted in light gray. Depiction of the sub-model of interest. Here, the black portion is the design space, the dark gray is the residual sub-model after model reduction, and the light gray is the portion of the model reduced to direct matrix input.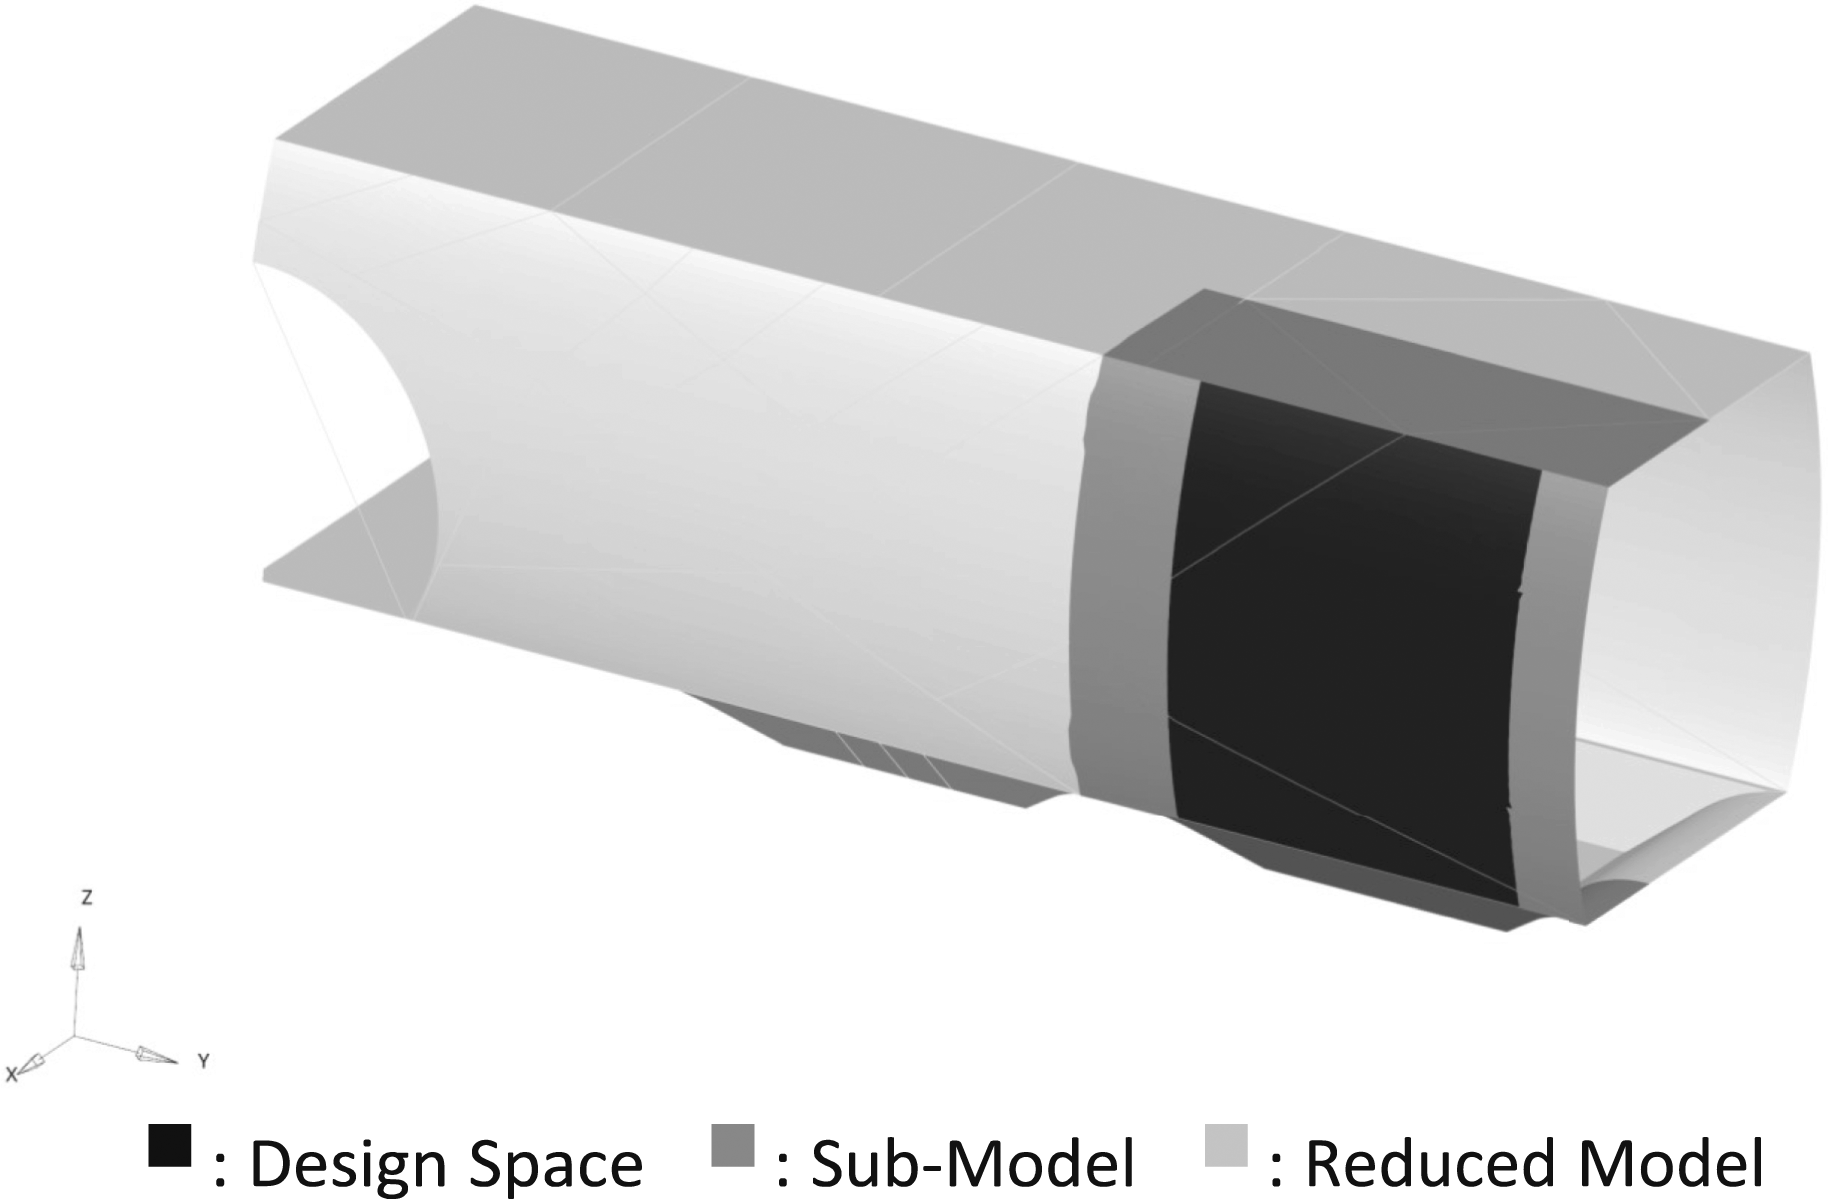
Weighting values for penalty factors by constraint category.
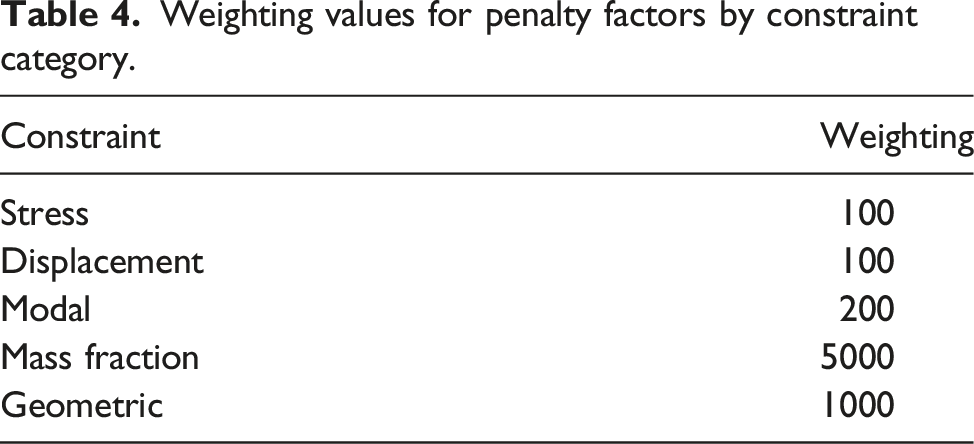
Response surfaces are created by bringing into play the listed weighting factors and running the cost function in a sample set of 625 equidistant points for two of the four variables at a time, while fixing the other two. Linear interpolation between points is used to create the resultant response surface. Figure 9 shows response surfaces with respect to face thickness, t
f
, and core thickness, H
c
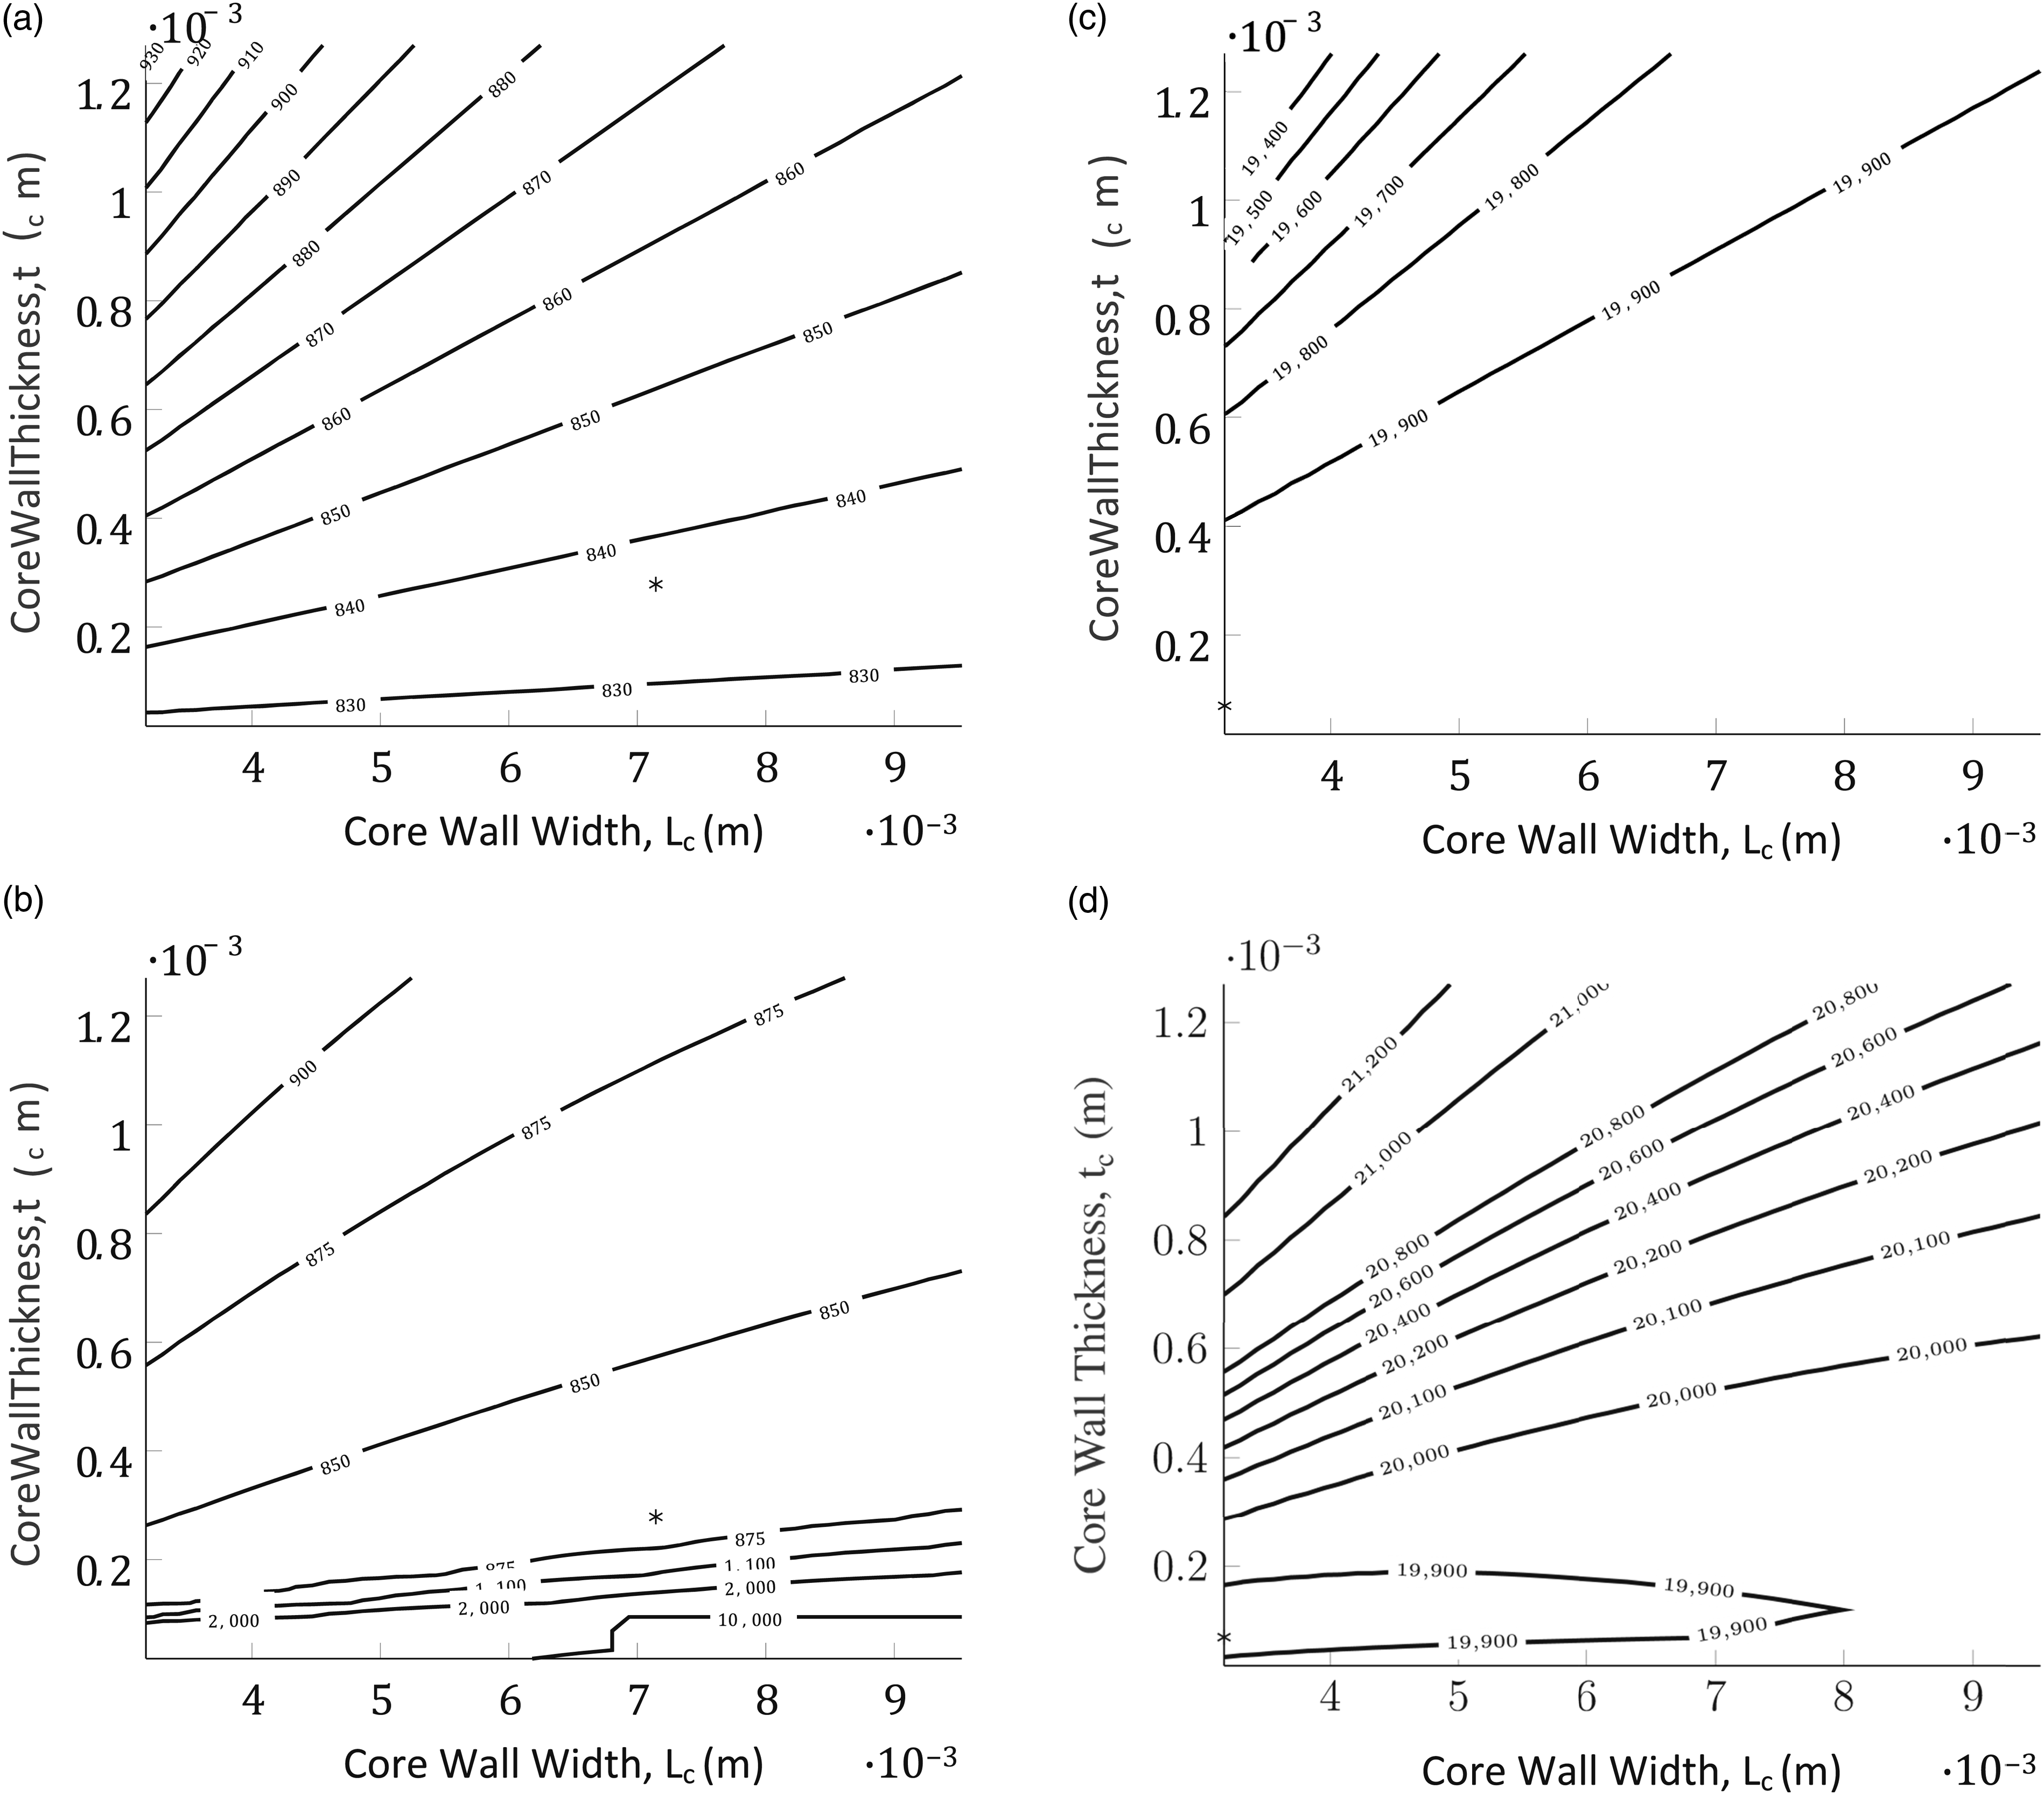
. Conversely, Figure 10 shows the response surfaces with respect to core wall width, L
c
, and core foil thickness, t
c
. Response surfaces achieve two primary goals. First, response surfaces allow for confirmation that weightings applied to the KS equations appropriately penalize the design. Second, response surfaces offer preliminary design intuitions and a starting point for optimization algorithms. Objective contour plots as a function of t
f
and H
c
to test sensitivity and determine close-to-optimum starting points. For this plot, L
c
= 6.35 × 10⁻³ m and t
c
= 5 × 10⁻⁴ m. Objective contour plots as a function of L
c
and t
c
to test sensitivity and determine close-to-optimum starting points. For this plot, t
f
= 5 × 10⁻⁴ m and H
c
= 6.35 × 10⁻³ m.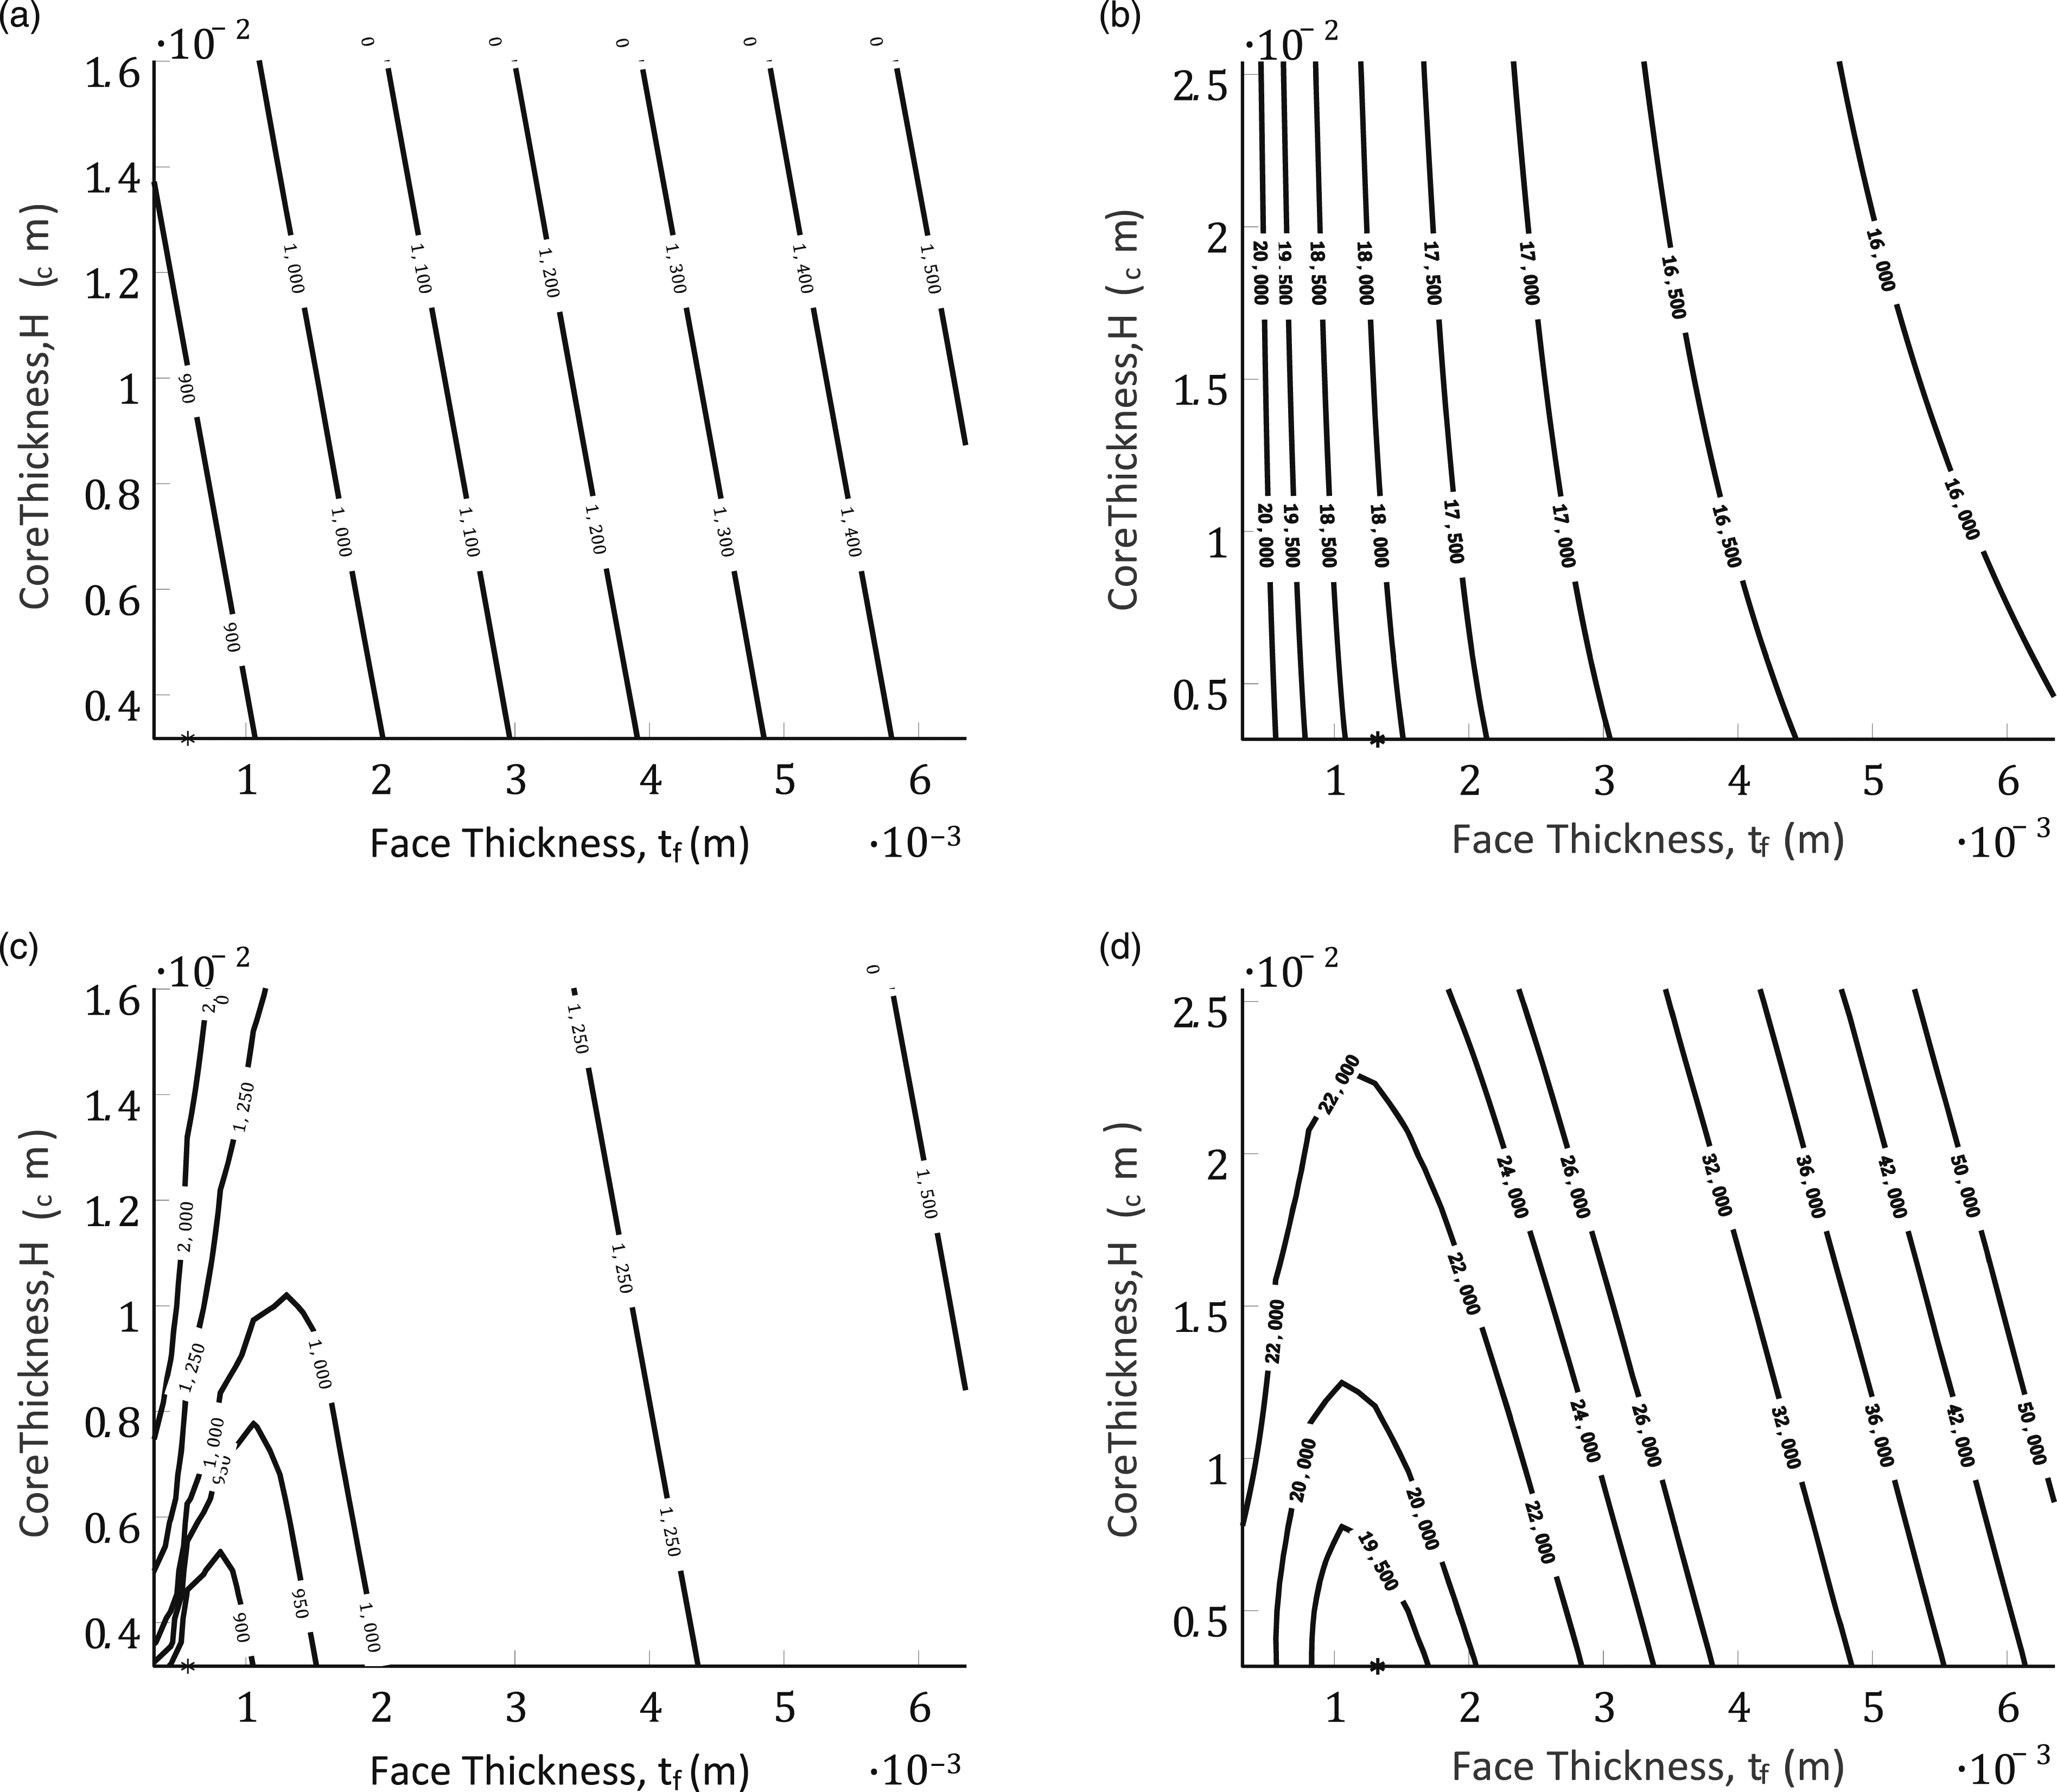
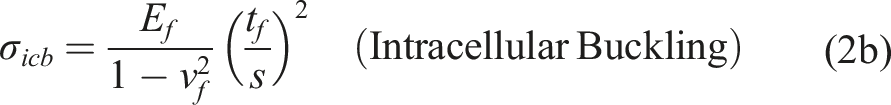
Response surfaces for mass and compliance plots with respect to face and core thickness fall in line with sandwich theory. As expected, a linear relationship exists between mass of the panel and both face and core thickness. The penalized mass plot, shown in Figure 9(c), shows that as face thickness is increased, the linear relationship is preserved. This indicates that for a thick face, the design remains feasible despite mass increasing. Meanwhile, by increasing core thickness and maintaining a thin face, the design enters the infeasible design space and is penalized by the KS equations due to a high susceptibility to wrinkling per equation (2b). The compliance contour plot appears to show compliance is minimized with a thick face, while core thickness has a lesser effect. This disproportionate effect of face thickness on compliance reduction occurs because the upper bounds of the face thickness are allowed as high as 6.35 mm. The penalized compliance contour plot in Figure 9(d) assigns an appropriate cost to penalize this phenomenon, as a thicker face is infeasible due to the resulting excessive mass, thus resulting in a corrected cost function for the MSDO.
In Figures 10(a) and (c), mass and penalized mass response surfaces are shown with respect to core wall width and core foil thickness. The optimal point is near the barrier of the feasible region because a large core wall width and small foil thickness can reduce mass significantly as they are the sole factors in core density but can result in high susceptibility to failure of all forms. Therefore, the optimal point should be close to the barrier where mass is the lowest without initiation of failure.
Finally, Figures 10(b) and (d) show compliance and penalized compliance with respect to core wall width and core foil thickness. As predicted by theory, compliance has virtually no sensitivity to these variables since core density and stiffness is not a factor of importance unless it approaches the density of the faces. At the top left of the plots, where wall thickness is high and wall width is low, the core effectively behaves more as a solid material, and so an improvement in compliance is observed. Based on the penalties encroached in these areas from the KS equations due to unreasonably high mass, it is demonstrated that modification of these variables for the purpose of improving compliance is inefficient.
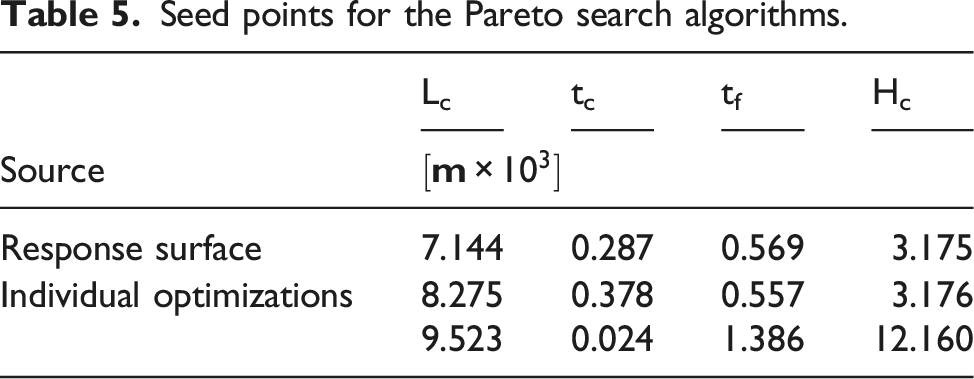
Points of lowest cost from all penalized cost response surface plots are denoted by the asterisks. Since two of the four design variables are fixed for the creation of the response surface, the allotted material for the design of the sandwich panels is not be optimally distributed between the sheet thicknesses and the core geometry. By plotting the response surfaces, only near optimal points are found which accordingly give useful design intuitions for refined optimization.
Seed points for the Pareto search algorithms.
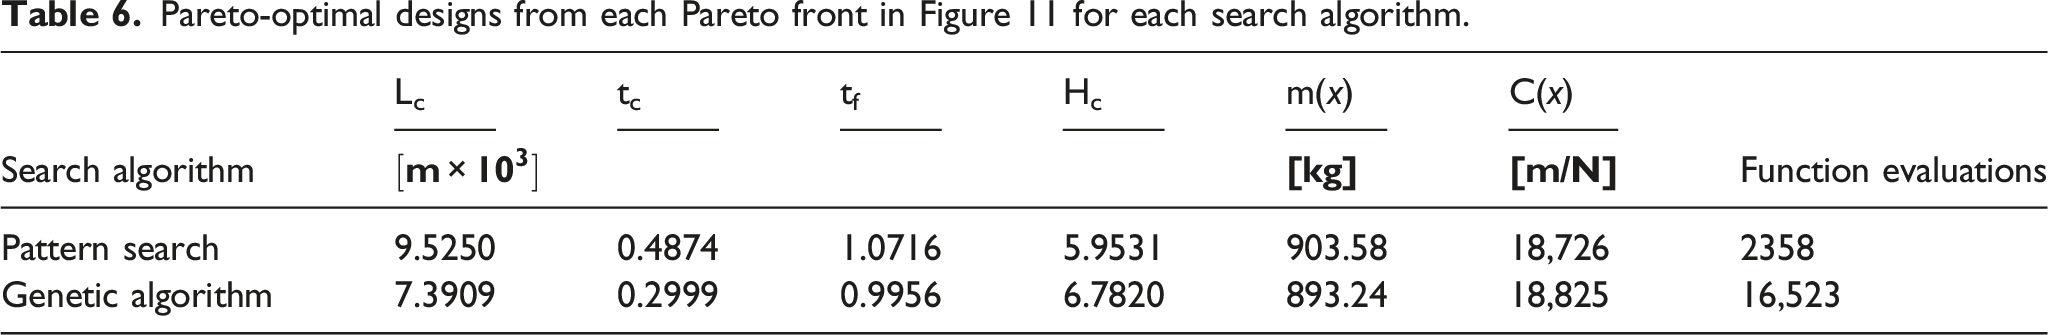
The Pareto front produced by a multi-objective optimization for minimal mass and compliance is shown in Figure 11. Note that the mass fraction penalty constraint in the penalized compliance function has been removed for the multi-objective optimization, since mass is now part of the objectives. Two algorithms are employed to produce one front each: the first uses a pattern search-based approach, while the second uses a genetic algorithm. The Pareto front resulting from the multi-objective optimization of penalized mass and total unpenalized compliance. The Utopia point has a mass of M(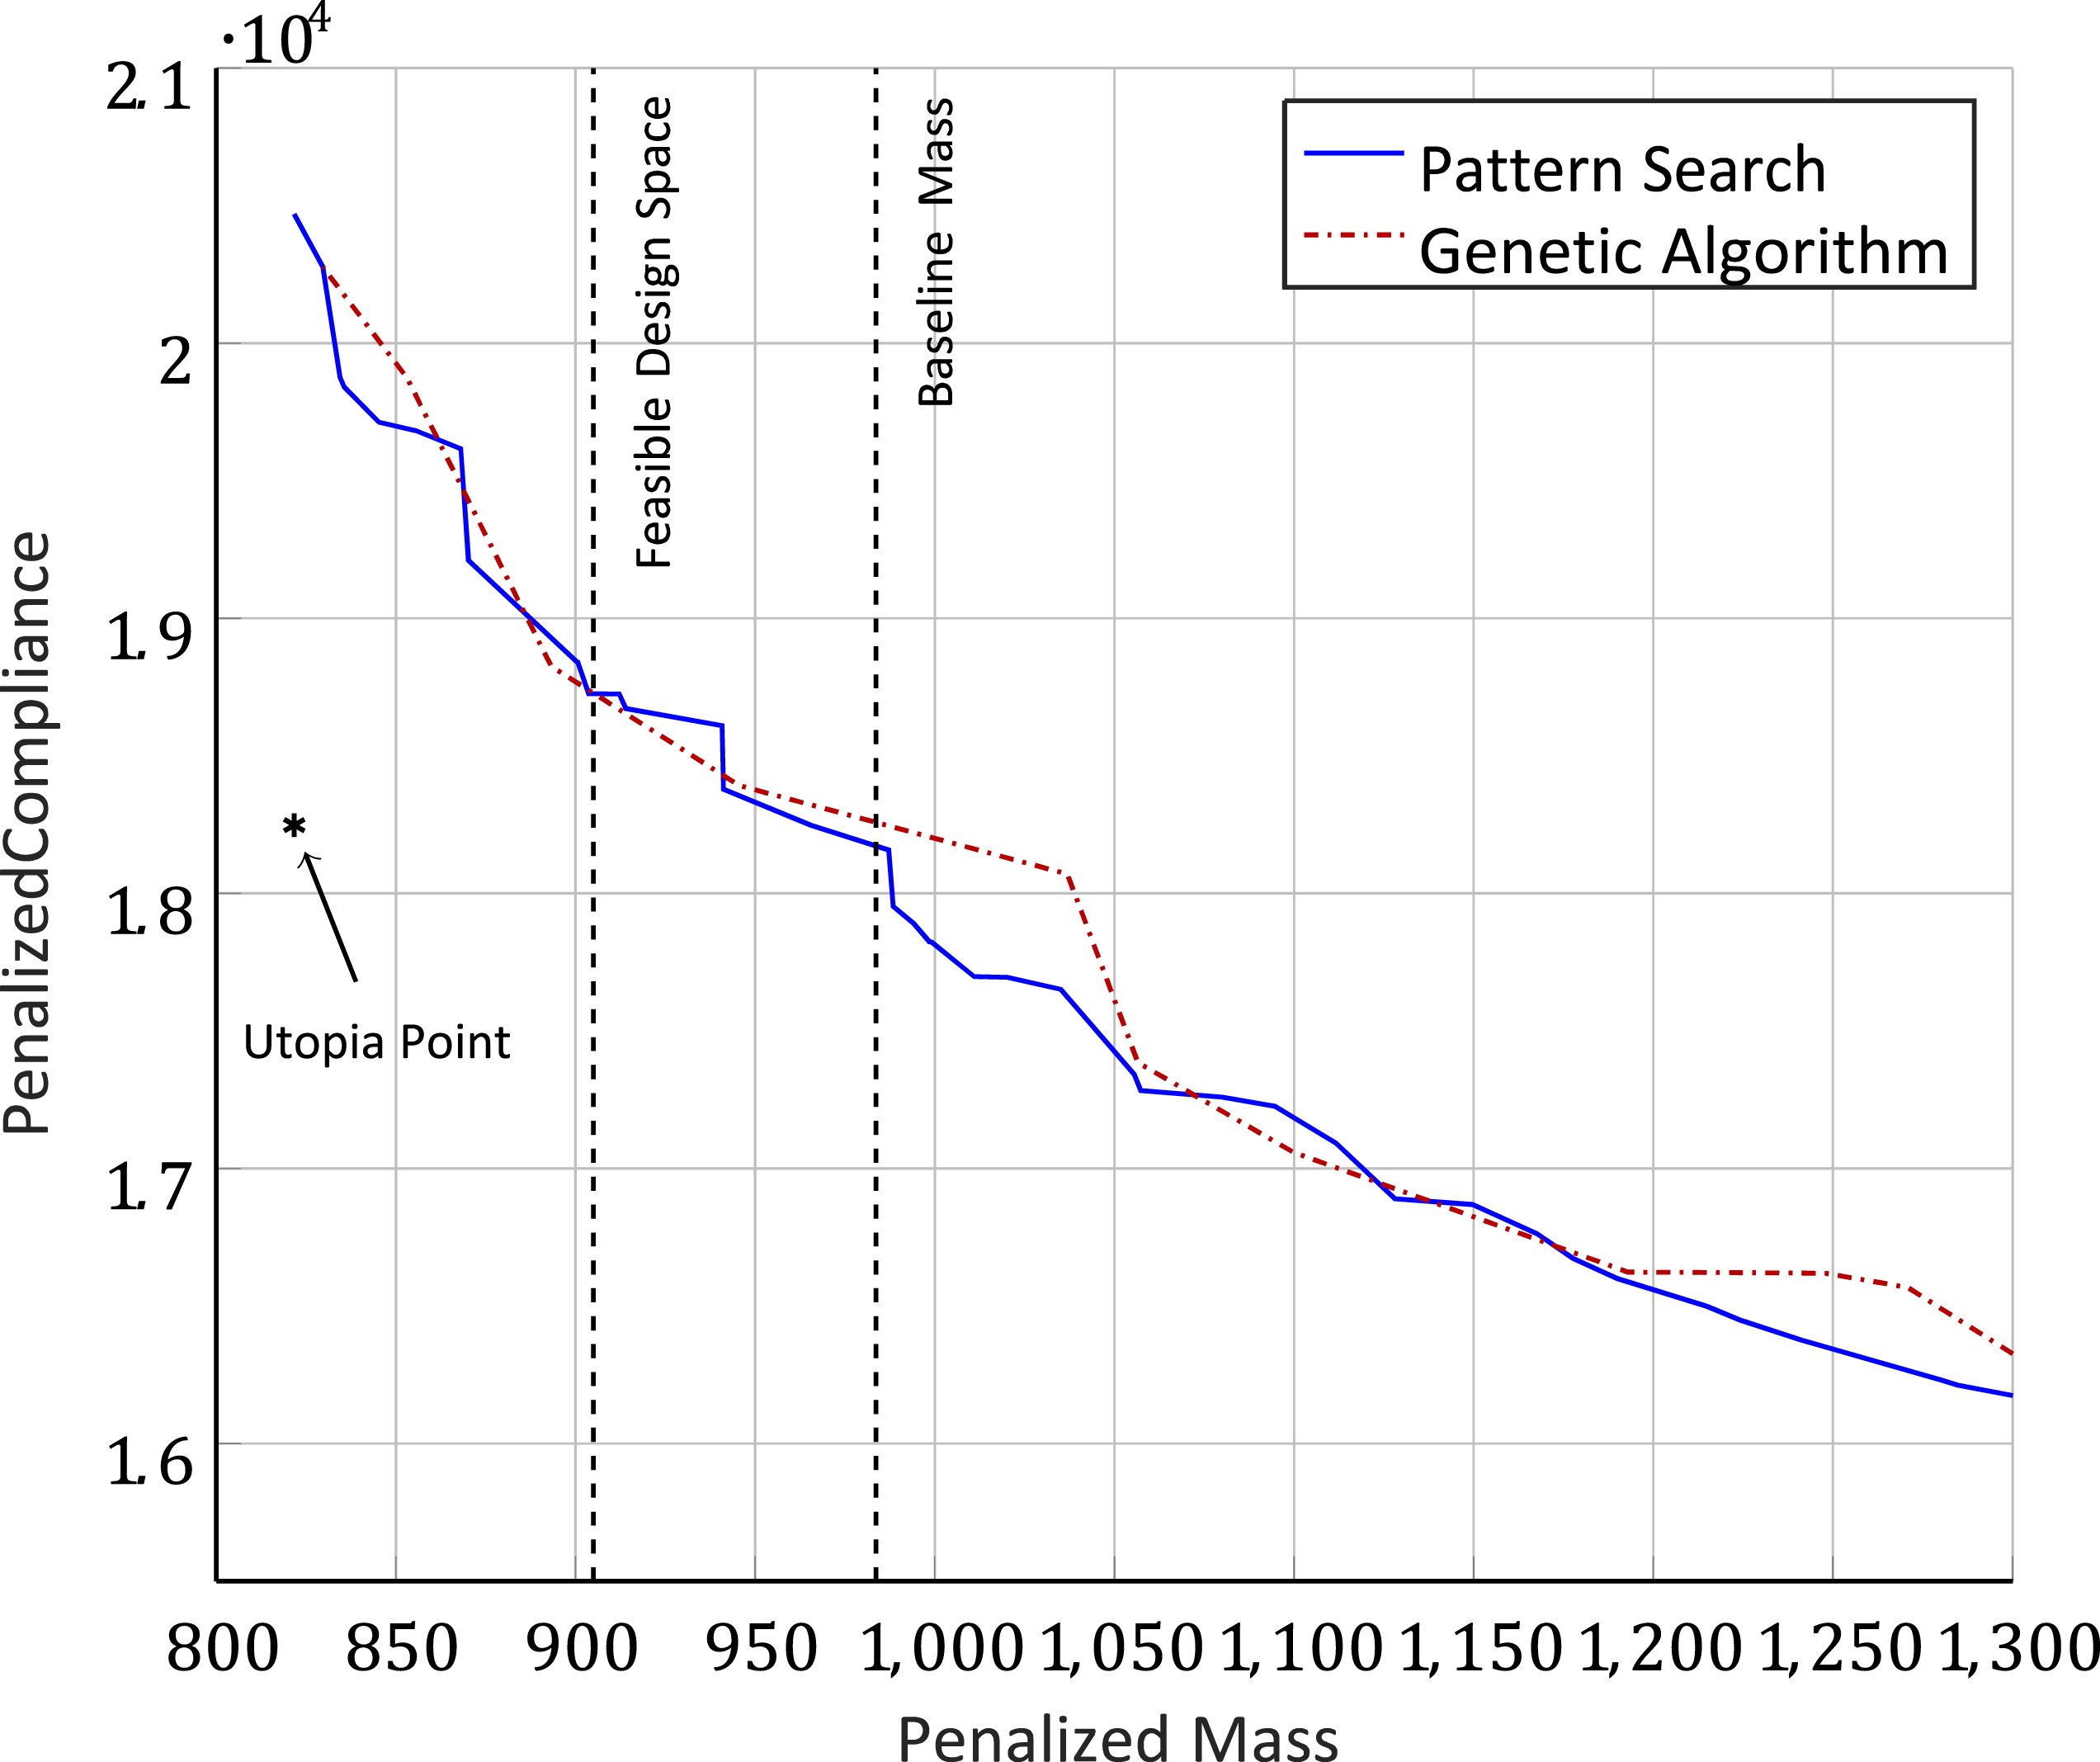
Selection of Pareto-optimal solutions from each front a Utopia Point is carried out using definitions provided by Marler and Arora according to the theorem
35

Pareto-optimal designs from each Pareto front in Figure 11 for each search algorithm.
Discussion
The Pareto-optimal points have been determined for the design of a characteristic panel. For a full design, it is possible to repeat the optimization in more panels for a further reduction in mass. For the sake of brevity, only a single panel is considered in this case study. Though the genetic algorithm search provides a lower result for mass, it required eight times as many function evaluations and produced half the number of pareto front points. Therefore, results from the pattern search are used for the final result. To demonstrate the viability of the results, the Pareto-optimal design from Table 6 employing the pattern search is extrapolated over the full structure and re-analyzed.
As a sample result, Figure 12 shows the von Mises stresses in the sandwich panel faces for all load cases considered. A full set of structural results are listed in Table 7. Note that while the structure experiences yielding in one local area upon results extrapolation, further sub-division of the optimization into smaller panel sizes is certain to resolve the failure since the maximum stress barely exceeds the allowable limit. The lowest natural frequency from the modal analysis is 12.08 Hz, which is above the allowable lower limit of 12.0 Hz. Element stress contour plots for maximum von Mises face stresses in element centers. Stress averaging is applied for post-processing, therefore element centers are used. Stress results from extrapolation of optimized side panel to all wall and roof components of the structure.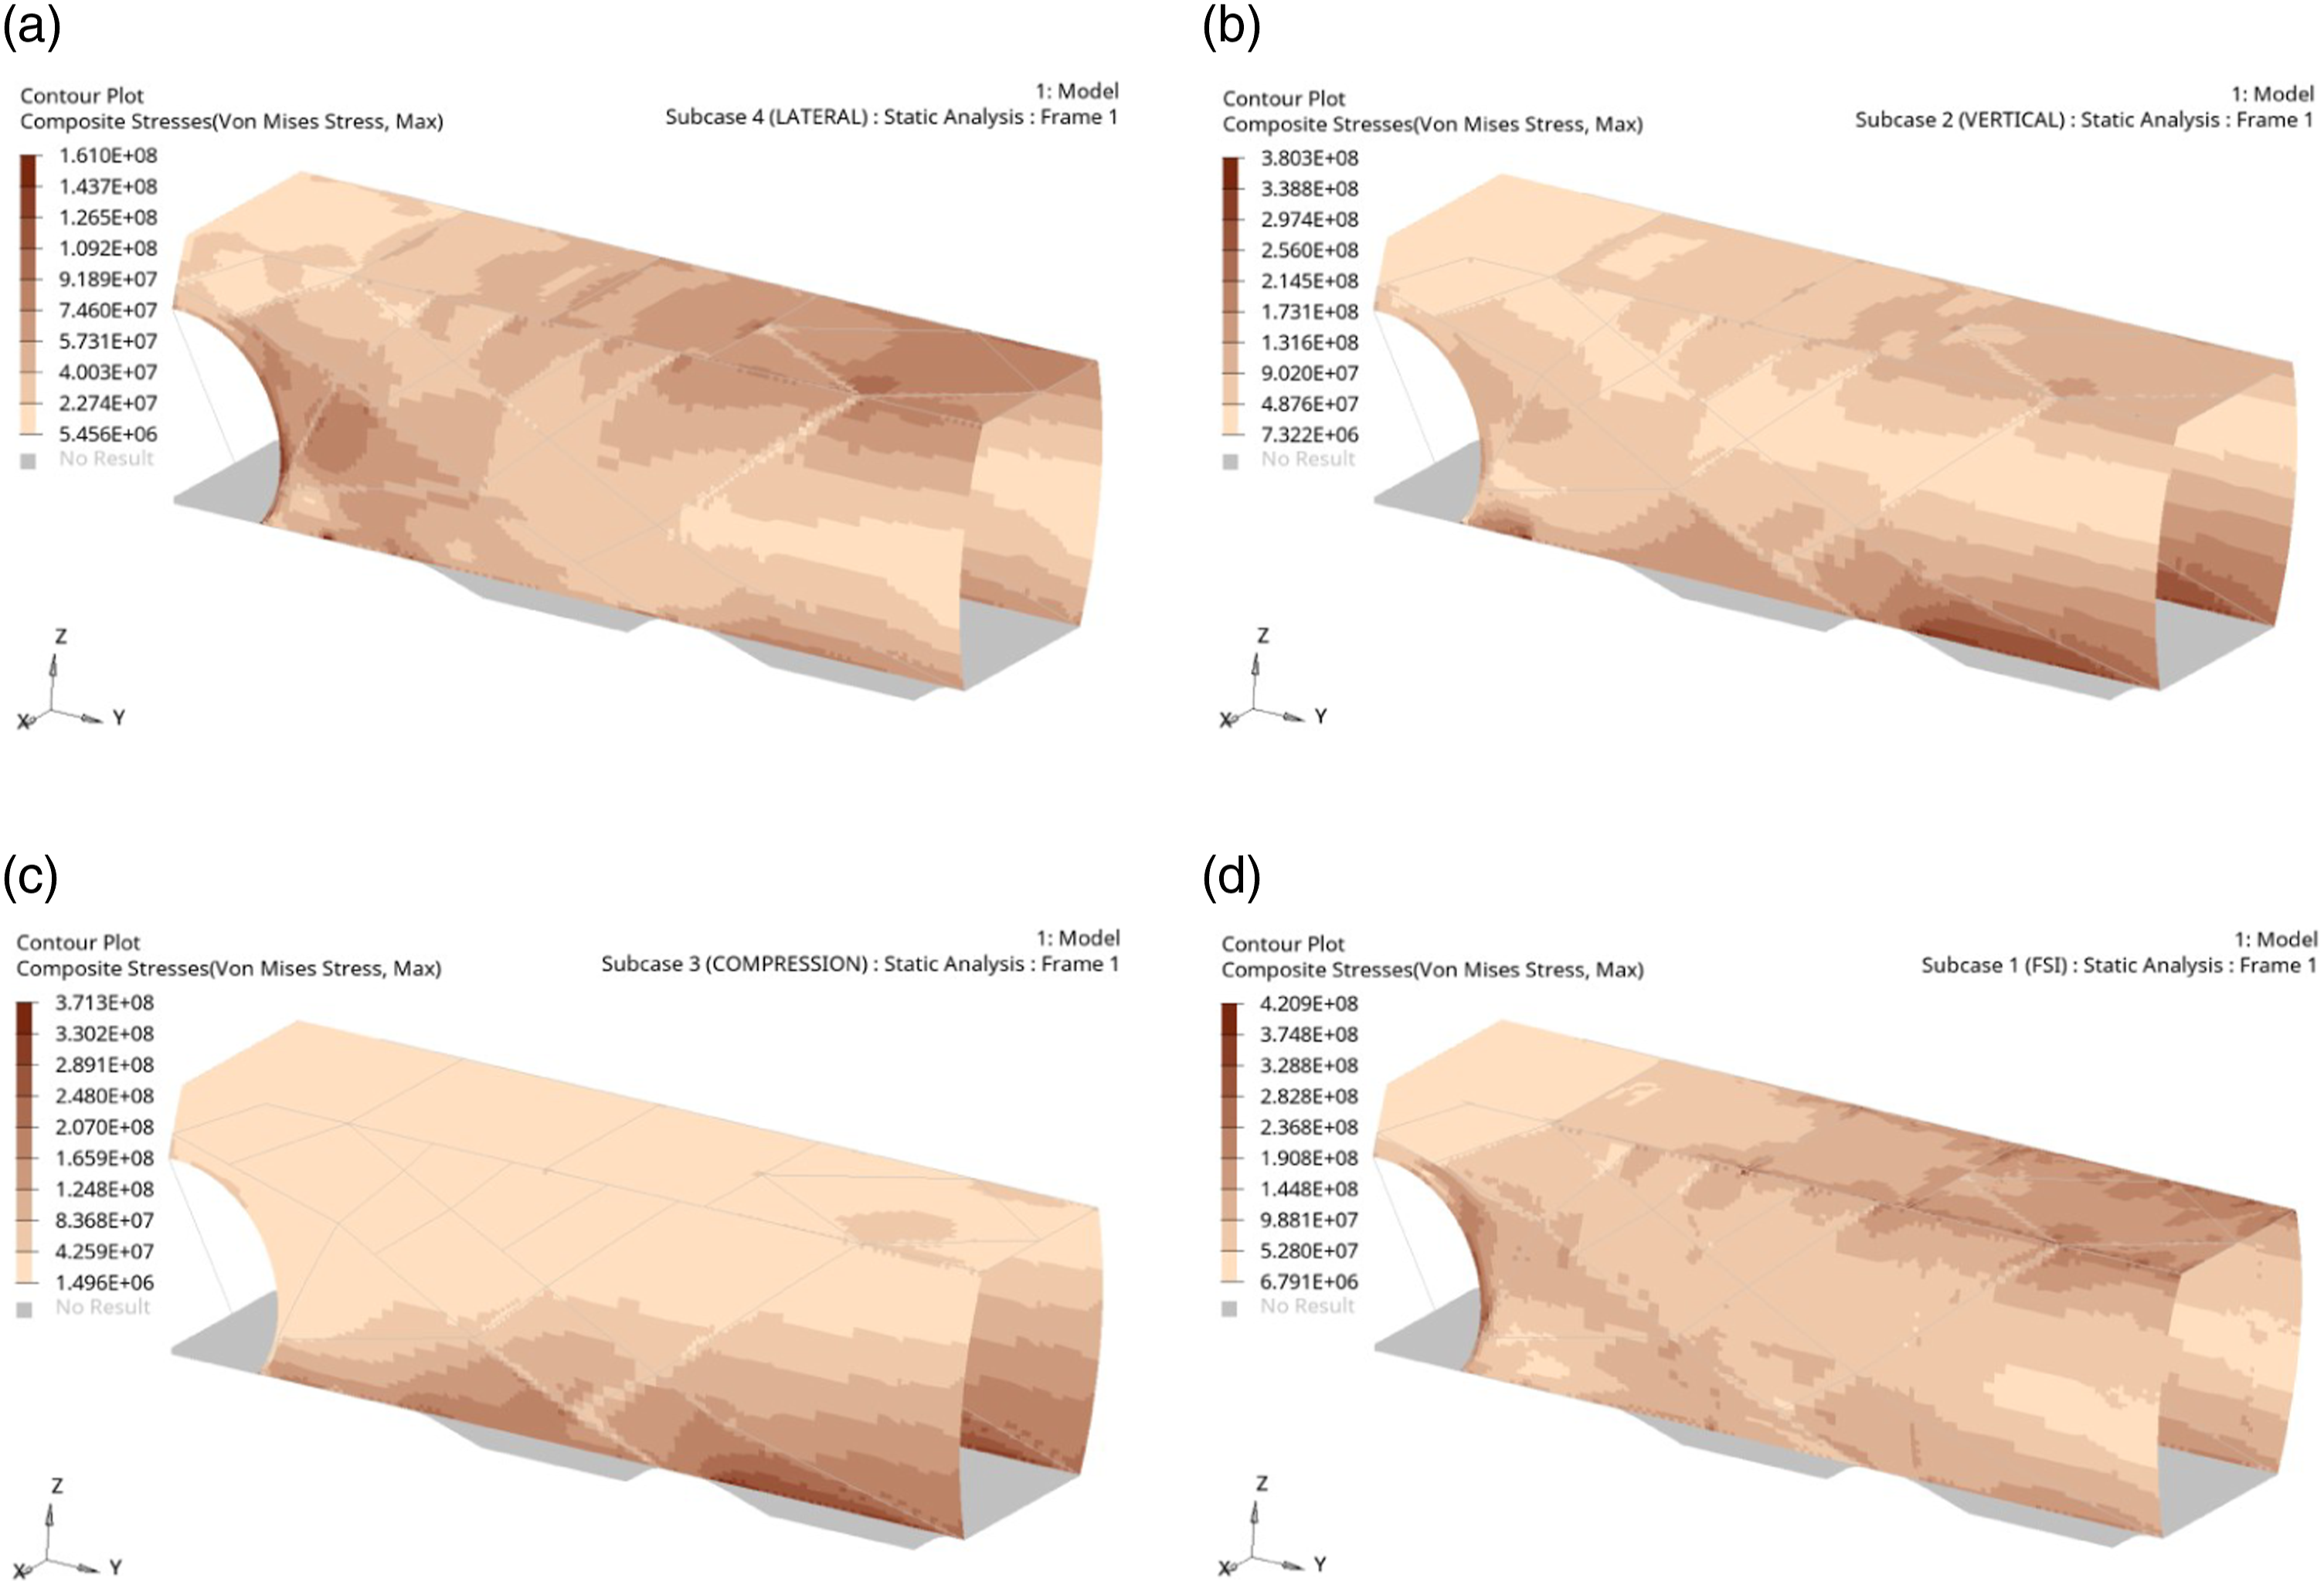
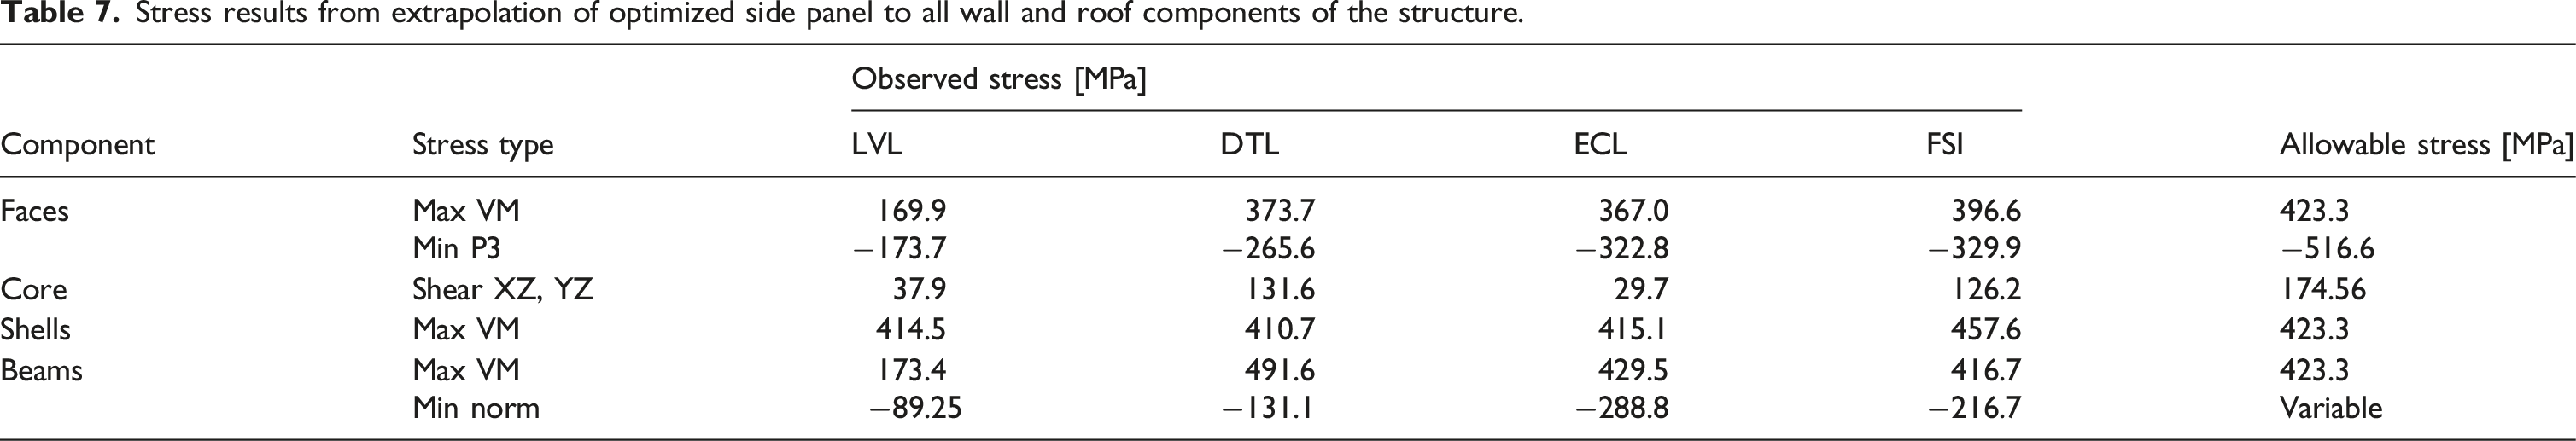
The baseline structure has a half model mass of 8518.8 kg, while the structure at the end of Stage I has a mass of 7110.0 kg. The structure produced by the presented method employing hexagonal honeycomb sandwich panels has produced a mass of 5731.4 kg without compromising on overall rigidity of the structure. This implies that an average mass savings of 32.72% can be anticipated by employing the novel multiscale design optimization procedure, while an average mass reduction of 13.74% can be expected over the use of conventional materials without compromising the rigidity of the structure.
Conclusion
In this paper, a novel multi-stage and multiscale design optimization methodology is introduced and successfully employed in the weight minimization of a covered hopper car. An analysis of the literature reveals that hexagonal honeycomb sandwich panels are demonstrated to offer superior strength-to-weight ratios under the expected loading experienced by a hopper car, thus making them the ideal structural candidate for optimization. A two-stage optimization procedure is then established, with the first stage determining the ideal frame structure by means of topology optimization. Meanwhile, in the second stage, a novel MSDO is introduced whereby the design variables of a characteristic honeycomb sandwich panel are optimized at the microscale and homogenized to the mesoscale to predict structural integrity. A Pareto front is produced by the MSDO, for which the Utopia point is found to determine the Pareto-optimal point. Assuming the car-body is half the mass of the hopper car, a mass savings of 16.36% can be expected, suggesting a reduction in greenhouse gas emissions of 13.09% based on available literature. Though implementation of this methodology is costly as compared to traditional methodologies, results show that for the case of a hopper car, it is able to produce results which are more reliable than those traditional methods, which can produce optimal design variables that result in failure. 24
Footnotes
Declaration of Conflicting Interests
The authors declared no potential conflicts of interest with respect to the research, authorship, and/or publication of this article.
Funding
The author(s) disclosed receipt of the following financial support for the research, authorship, and/or publication of this article: The authors acknowledge the financial support provided by Transport Canada Clean Rail Academic Grant (Grant Number 300515).
Appendix
The derivation of the wall load index is presented here as an example to show how the load indices plotted in Figure 1 are determined. Per the AAR MSRP, the pressure at the base of a sidewall on a covered hopper car is given as
23
The AAR MSRP mandates that the load in equation (15) be applied as a linearly distributed load decreasing to zero at the top. For a simply supported beam under a linearly distributed load, the maximum bending moment using basic statics is