
Abstract
Long freight trains up to 1500 m in length are currently not in regular operation in Europe. One of the important reasons for the same is high inter-wagon forces generated during the operation, especially when pneumatic (P-type) brake systems are used. For long trains with multiple locomotives at different positions along the train, radio communication with necessary fail-safe mechanisms can be used to apply the brakes. Long freight train operation on a given line is subjected to various attributes such as braking/traction scenarios, loading patterns, wagon geometries, brake-block materials, buffer types, track design geometries, etc., which are referred to as heterogeneities. The complex longitudinal train dynamics arising in the train due to various heterogeneities play a major role in determining its running safety. In this context, the maximum in-train force refers to the maximum force developed between any two wagons along the train during operation. The tolerable longitudinal compressive force is the maximum compressive force that can be exerted on a wagon without resulting in its derailment. Here, the authors adopt a bottom-up approach to model pneumatic braking systems and inter-wagon interactions in multibody simulation environments to study the complex longitudinal train dynamics behavior and estimate maximum in-train forces and tolerable longitudinal compressive forces, subjected to various heterogeneities. These two force quantities intend to facilitate a given freight train operation by providing guidelines regarding the critical heterogeneities, that currently limit its safe operation. In doing so, the authors propose the notion to have an operation-based approval for long freight trains using the simulations-based tool.
Keywords
Introduction
For extensive rail freight transportation, one action to improve its capacity and efficiency is to run long trains. From a European perspective, this typically means running freight trains longer than 800–900 m. However, there are technical challenges associated with the same, especially with the usage of more traditional pneumatic (P-type) braking systems, side buffers, and screw-coupling systems. For instance, during traction (acceleration) the longitudinal tensile coupler forces can be significant, in particular if all locomotives are positioned in the front of the train. This might cause coupler breakage and thus loss of train integrity and safety risks. At the same time, during braking, the longitudinal compressive forces (LCF) between the wagons can become very large, especially when the braking is applied only from the front and when the braking signal is propagating slowly by the pneumatics in the main braking pipe (MBP). Additionally, there are issues emanating from the way trains are built as well, for instance when payload-dependent braking devices of the wagons and the type of brake block materials result in application of different braking forces along the train. The large compressive forces arising from one or a combination of these issues may cause derailment when the train negotiates curves, in particular tight S-curves with radii such as 150 m, 170 m, etc.
The complex longitudinal train dynamics (LTD) for long freight trains, subjected to various operating attributes, referred to as heterogeneities are studied through numerical simulations. A lot of prior work exist in this field. An extensive review on LTD is given by Wu et al. 1 and Cole et al. 2 regarding modeling methods for wagon connection systems, numerical solvers, and potential research directions. LTD is nonlinear and there exist several longitudinal train simulators (LTS) that simulate the same. Cantone 3 in his work introduces TrainDy that is used to calculate the inter-wagon interaction in long trains, the braking systems modeled after the UIC pneumatic brake. The model calculates the braking pressure time histories along the train and the forces exchanged in the longitudinal direction and was validated for use by the UIC. Similar software packages have been developed elsewhere such as CRE-LTS, 2 UM, 4 TSDYN, 5 and ATTIF. 6 Many of the simulation packages usually provide time histories of longitudinal in-train forces that develop along a long freight train, subjected to various vehicle attributes, gradients and operating scenarios such as braking, traction, etc. An international initiative for benchmarking of LTS was undertaken by Spiryagin et al. 7 in which nine international institutions participated, the results being published in Wu et al. 8 With increased computational capabilities, three-dimensional (3D) simulations, coupled along with 1D in-train force calculations of long trains for analyzing derailment risks in sharp curves are also being undertaken as seen in the works of Pogorelov et al., 9 Belforte et al., 5 and the MARATHON project. 10 Additionally, from wagon certification's point of view, standards such as UIC 530-2 11 and EN15839 12 exist that specify conditions to carry out propelling tests that determine the running safety of the wagon when subjected to high LCF.
DYNAFREIGHT, 13 a Shift2Rail project was tasked with the proposal of safety precautions in train configuration and brake application by simulating and analyzing the longitudinal forces and the derailment risks in long freight train operation. The safety precautions are to be used to define and implement functional, technical, and homologation requirements for a radio remote-controlled traction and braking system, in order to be ready for certification. Also, it would aid in proposing adaptations needed in the infrastructure for the operation of long freight trains up to 1500 m. The task was undertaken jointly by the three academic institutions1–3 in collaboration with industrial partners. The work builds upon the activities undertaken in the European project MARATHON. 10 The braking pneumatics, 1D LTD (actual in-train forces), and 3D derailment analysis (tolerable LCF) are the three key elements of this work for which individual simulation tools have been further developed. For in particular long trains, there are many possible heterogeneities in the train configuration such as wagon classes, running gear design, coupler design, brake block material, brake rigging efficiency, brake regime, brake performance dependent on payload, actual payload, and actual position of each wagon along the train. The second (or third, etc.) locomotive can also be positioned differently. Further, the trains run at different (initial) speeds and negotiate different track layouts with gradients and horizontal curves. This complex parameter space has been systematically analyzed with the help of tools developed by the authors and main safety precautions that should be taken in long-train operation are found. This is done with the calculation of inter-wagon forces along the train. The radio communication protocols through which traction and braking actions are transmitted between multiple locomotives, are provided by the FFL4E consortium 14 for different scenarios.
This paper is structured in the following way. The next section describes the overall framework, explaining how the different simulation tools are aligned in the workflow. “Train selection and braking scenarios” describes the overlong train configurations, vehicle compositions, and braking scenarios, studied in the context of providing in-train forces and tolerable LCF for relevant cases. “Modeling methodologies” briefly describes the different tools used in the work, whereas “Simulation results and discussions” discusses key factors enabling a safe operation of overlong trains. Finally, conclusions and suggestions for further work are put forward.
Numerical framework
Workflow
The workflow to obtain safety precautions for the operation of long freight trains is described in Figure 1. For decision on approval of a given long freight train operation, the two quantities maximum in-train forces and tolerable LCF are calculated.
The maximum in-train forces refer to the maximum forces developed between any two vehicles along the train. They are longitudinal tensile forces (LTF) and LCFs. For this:
The braking and traction inputs were used to calculate the time histories of the brake cylinder pressures in the braking pneumatic tool. Using the time histories of the braking cylinder pressures from the braking pneumatic tool as input, the braking forces are calculated in the 1D simulation tool. Further, the braking forces are applied to a 1D, multibody simulation (MBS) model of the freight train and the in-train forces are calculated for each inter-wagon connection along the train. Overall conceptual framework.
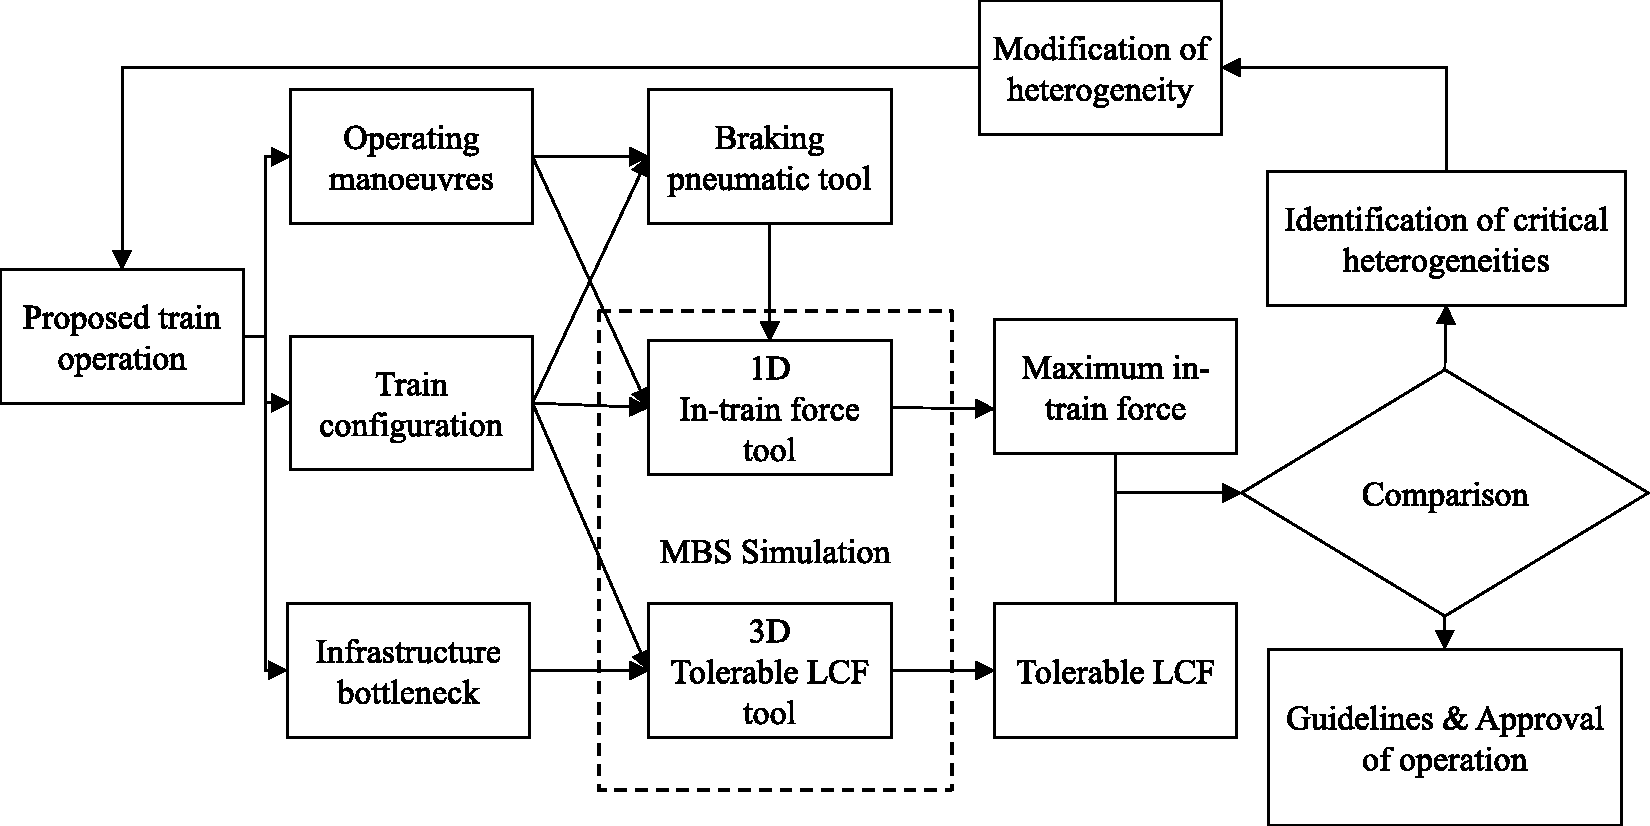
Both the braking pneumatics and 1D simulation tools simulate the whole train.
The tolerable LCF is the maximum compressive force exerted on a wagon without resulting in its derailment. Unlike the braking pneumatic and 1D simulation tools, it is currently too computationally time consuming to simulate the whole train. Therefore, a smaller three-wagon train with static LCF applied on either ends is simulated in the 3D simulation tool. The tool was introduced and applied for coal wagons of the wagon class Falns by Krishna et al.
15
The two force quantities would help judge the safety of the long freight train operation. However, it is not possible to account all possible combinations of trains and track infrastructure points as will be seen in the next subsection. Hence, only critical combination of different heterogeneities will be checked.
Heterogeneities
Long freight trains (defined by total payload or length) can vastly differ from each other in terms of their construction and sometimes also be a combination of two dissimilar smaller trains. For example, an iron-ore train has a vastly different load distribution along the train (and hence traction/ braking requirements) as compared to a similarly long train composed of long and flat intermodal freight wagons. Further, within a long freight train there can be various heterogeneities such as wagon dimensions, brake block materials, loading, buffer types, distance from the locomotive, and as a consequence also different braking forces at a given instant. Further, depending on the kind of infrastructure and the route of operation, the long freight train could also be subjected to different lateral/vertical forces. Some key heterogeneities that are important from the freight train's longitudinal dynamics point of view have been identified and listed in Figure 2. The heterogeneities are accounted differently across the different simulation tools as seen in the figure.
Heterogeneities and the simulation tools to assess their effect.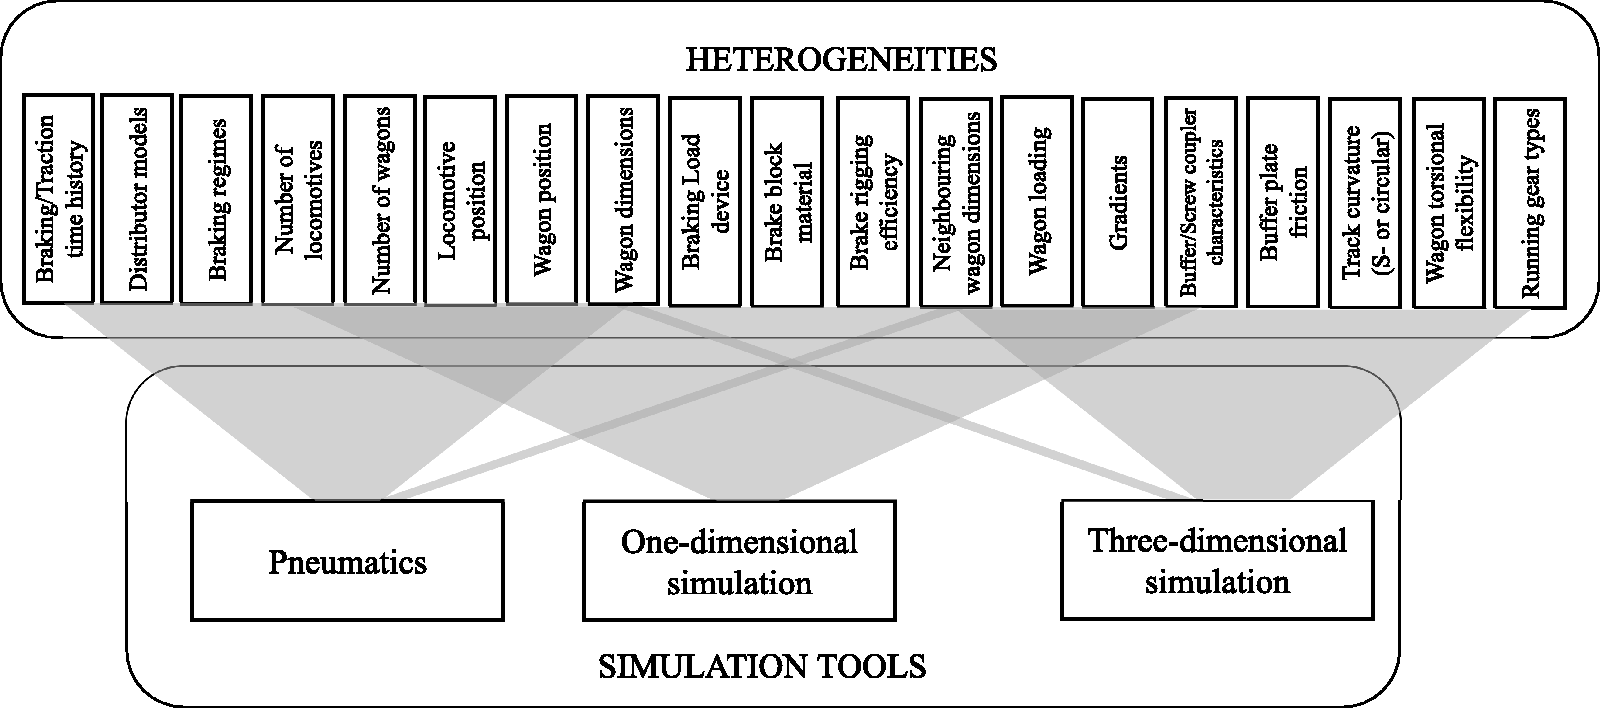
The heterogeneities could vary greatly from train to train. A single train could be composed of two or more different types of wagons, each having different types of brake blocks and buffers. For example, fleet data for Falns-type wagons obtained for freight wagon traffic in Germany show that the majority of them are equipped with K-brake blocks while the remaining are equipped with cast-iron blocks. There exist similar differences in terms of other heterogeneities such as buffer types, braking regimes, etc. as well. These heterogeneities are emphasized in the further sections.
Train selection and braking scenarios
Variation amongst different heterogeneities can generate an almost infinite number of different freight trains. Hence, building a “truly” random train to represent any possible set of combinations is not possible, especially not in the bottom-up methodology being used. Therefore, the approach used in DYNAFREIGHT is to analyze a limited number of trains, where different heterogeneities are studied in discrete steps and the critical ones retained for further variation throughout different tools in the procedure. At the same time, since the inference from the simulations should be as big and universal as possible, extreme heterogeneity values (minimum and maximum values in the heterogeneity range) and sometimes also intermediate values are used for the variations.
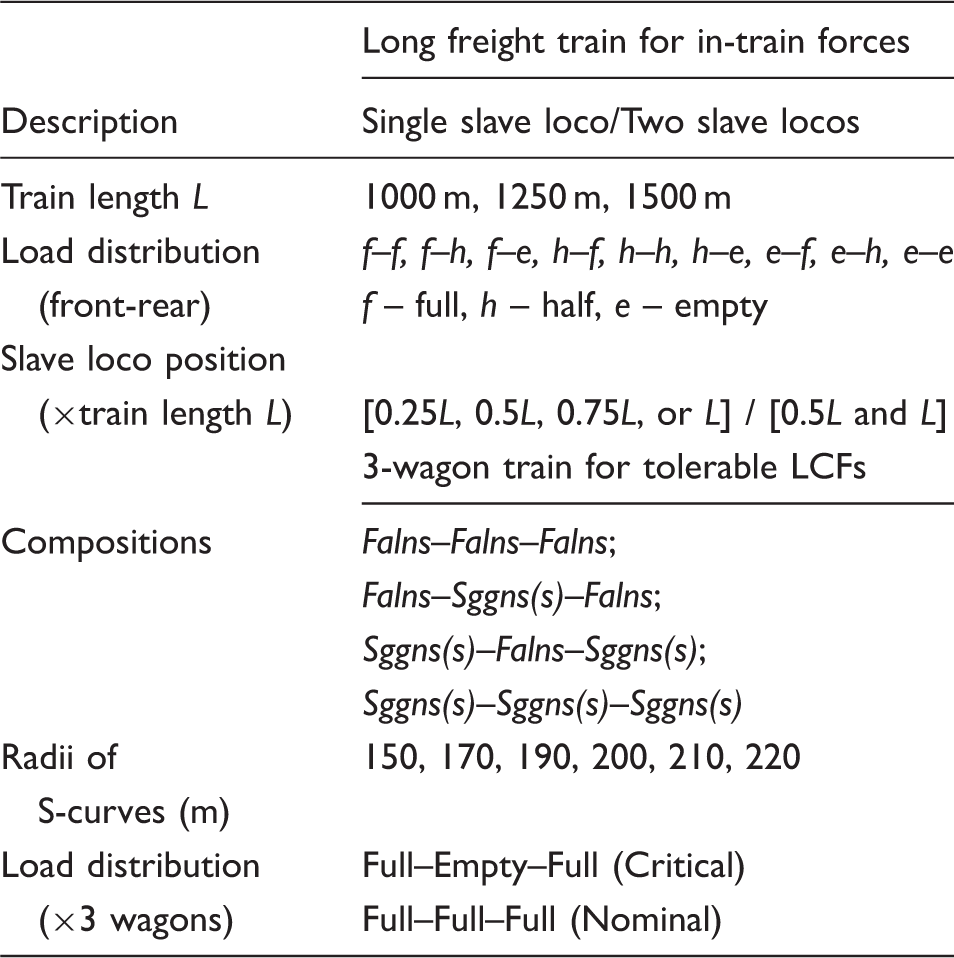
Parameter variations for freight train generations to calculate in-train forces and tolerable LCF.
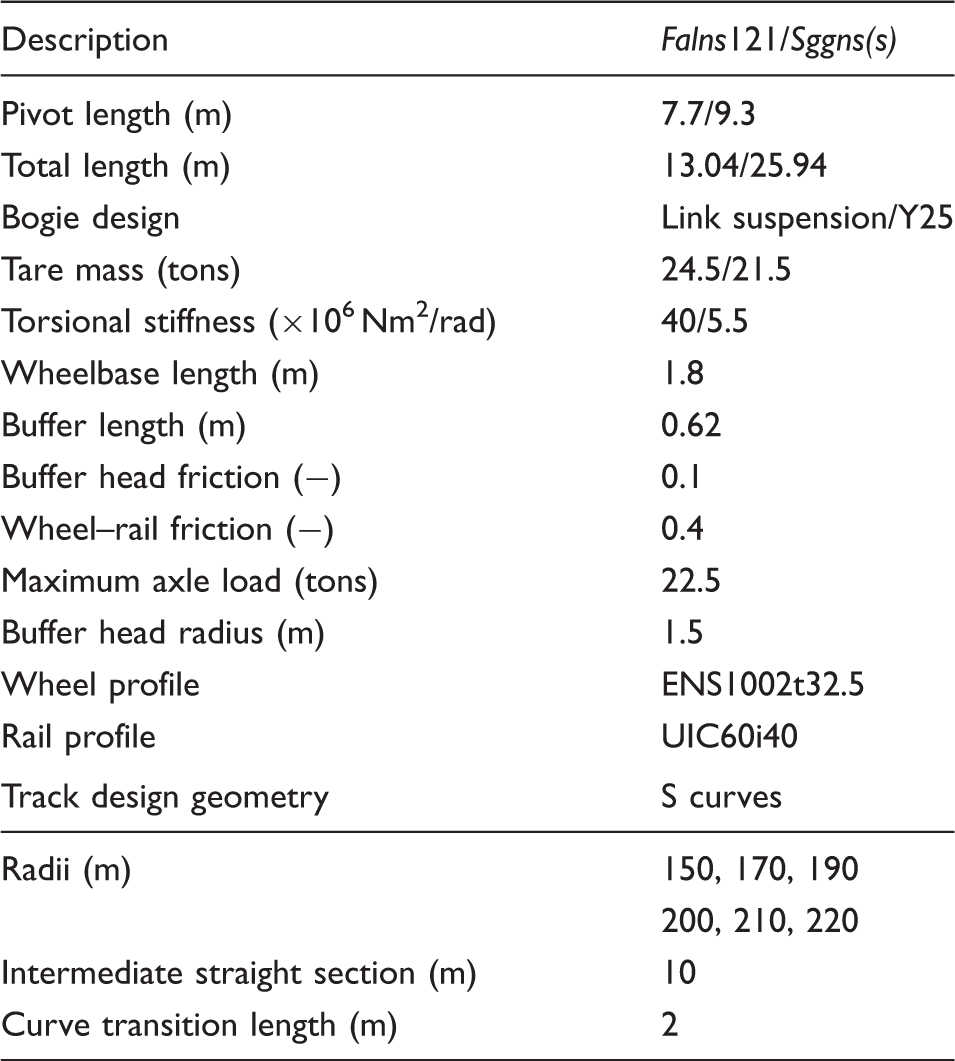
Wagon construction parameters and track design geometries.
Several freight trains made up of either of these two wagon types were generated, according to the parameters listed in Table 1 for the calculation of in-train forces along the train. Each train is assumed to be composed of the same wagon type but with different payload distributions for the braking pneumatics and 1D in-train force MBS tools. Once the wagon type is selected, trains of the three lengths, 1000 m, 1250 m, and 1500 m are generated respectively. These represent overlong trains from a European context. Each train is divided into front and rear halves, with different payload distributions assigned. For instance, in Table 1, load distribution f–h means that the front half of the train is fully-loaded and the rear half of the train is loaded to half of the maximum permitted axle load. In a similar way, e–f means that the front half of the train is empty (tare condition) and the rear half is fully-loaded. In addition to the controlling master locomotive in the front, several positions for slave locomotives are also studied. When a single slave locomotive is present, it can be located at either 25%, 50%, 75%, or 100% of the train length. When two slave locomotives are present, they are located at 50% and 100% of the train length respectively. Altogether, 270 different trains were considered in the long train simulation in the 1D simulation and braking pneumatic tools. This allows to address the effect of heterogeneities related to: wagon type (×2), train length (×3), payload distribution (×9), slave locomotive(s) placements (×5) in the calculation of in-train forces. Other variations were also investigated for the more critical cases.
The brake application's effect on running safety was analyzed for three emergency braking maneuvers:
The emergency brake applications from low speeds constitute the more critical scenarios as reported by Cantone et al.
16
Accordingly, an initial speed of 30 km/h has been used. Simulating maneuvers A and B aim at investigating the effect of additional venting points (due to the presence of multiple locomotives along the train). In maneuver A, slave locomotives behave like wagons since they only brake when the triple valve detects a pressure drop in the MBP. In other words, the slave loco does not actively control the MBP pressure as the command comes only from the master loco. Even if it is not very realistic, it can still be a reference case where the braking operation of the shorter standard freight trains is directly transferred on to overlong ones. Maneuver C is more critical due to the sudden switch from traction to braking, thus affecting the LTD. Furthermore, maneuver A also simulates a communication loss between master and slave locomotive(s) (degraded operating condition). A two-second delay was assumed between the brake applying command of the master locomotive and that of the slave locomotive(s) when the communication functions normally. Braking operations of freight trains equipped with pneumatic braking systems follow specific braking regimes
13
that define the rate of pressure drop of the main braking pipe along the train length. All the simulations were carried out with all the vehicles operating in the G-braking regime.
17
The calculation of the tolerable LCF, however, considers a three-wagon train, inspired by the UIC 530-based simulation methodology developed in a previous study. 15 The methodology focuses on heterogeneities from a more local inter-wagon interaction level as illustrated by Figure 2. The previous study identified the high influence of carbody torsional stiffness, horizontal track curvatures, loading patterns, and wagon arrangements on the tolerable LCF. Among the three wagons, the leading and the last vehicles are kept the same for simplification (Falns or Sggns(s)), while the middle wagons are varied between the two wagon classes. In this way, it also counts the heterogeneities attributed to neighboring wagons. The critical load distribution where an empty wagon is surrounded by two loaded wagons, and the nominal load distribution where all the wagons are loaded have been considered (see Table 1).
Modeling methodologies
This section describes the modeling procedures of the tools. As described in Figure 2, different heterogeneities are addressed in different simulation environments.
Tolerable forces
The 3D MBS tool for the calculation of tolerable LCF values was developed by KTH in the GENSYS 18 environment. A detailed description of the modeling procedure, methodology, and the critical heterogeneities that influence the derailment risk of a wagon due to additional lateral forces when it passes through infrastructure bottlenecks such as flat S-curves was discussed by Krishna et al. 15
The simulation methodology to calculate tolerable LCF draws inspiration from the UIC 530-2 and the EN 15839 based on-track propelling tests. The empty test wagon is surrounded by two loaded barrier wagons, resulting in a height difference between the side-buffers. This three-wagon assembly is propelled on a tight S-curve (R = 150 m) by a locomotive at a low speed from the behind while the wagons ahead of it brakes simultaneously, giving rise to inter-wagon compressive forces. The wheel lift and the lateral track shift forces among other criteria are checked for derailment safety and the corresponding compressive force measured, giving the permissible compressive force for the test wagon. The three-wagon assembly system here is implemented in a 3D simulation environment while the propelling forces are applied as constant forces acting on either ends of the three-wagon train. This methodology simulates derailment conditions arising due to lateral forces in complex curves, which is otherwise not possible in the 1D simulation environment. Simulations are performed iteratively with increasing static LCFs to the point one of the wagons derails. The maximum applied static LCF is kept as 2000 kN, below which the tolerable LCF is usually found. This gives the tolerable LCF for the middle wagon of the three-wagon train. This contrasts the propelling test procedure11,12 that only checks up to a maximum LCF of 280 kN. An example of a three-wagon train simulation model with both Sggns(s) and Falns wagon classes on an S-curve is presented in Figure 3(c).
Modeling schematics of the present tools: (a) lumped parameter scheme of the braking pipe (MBP); (b) generation of 25 random one-dimensional 40-vehicle trains with variation in total wagon mass to calculate in-train forces; (c) three-dimensional simulation model of a three-wagon train passing through a S-curve to calculate tolerable LCF.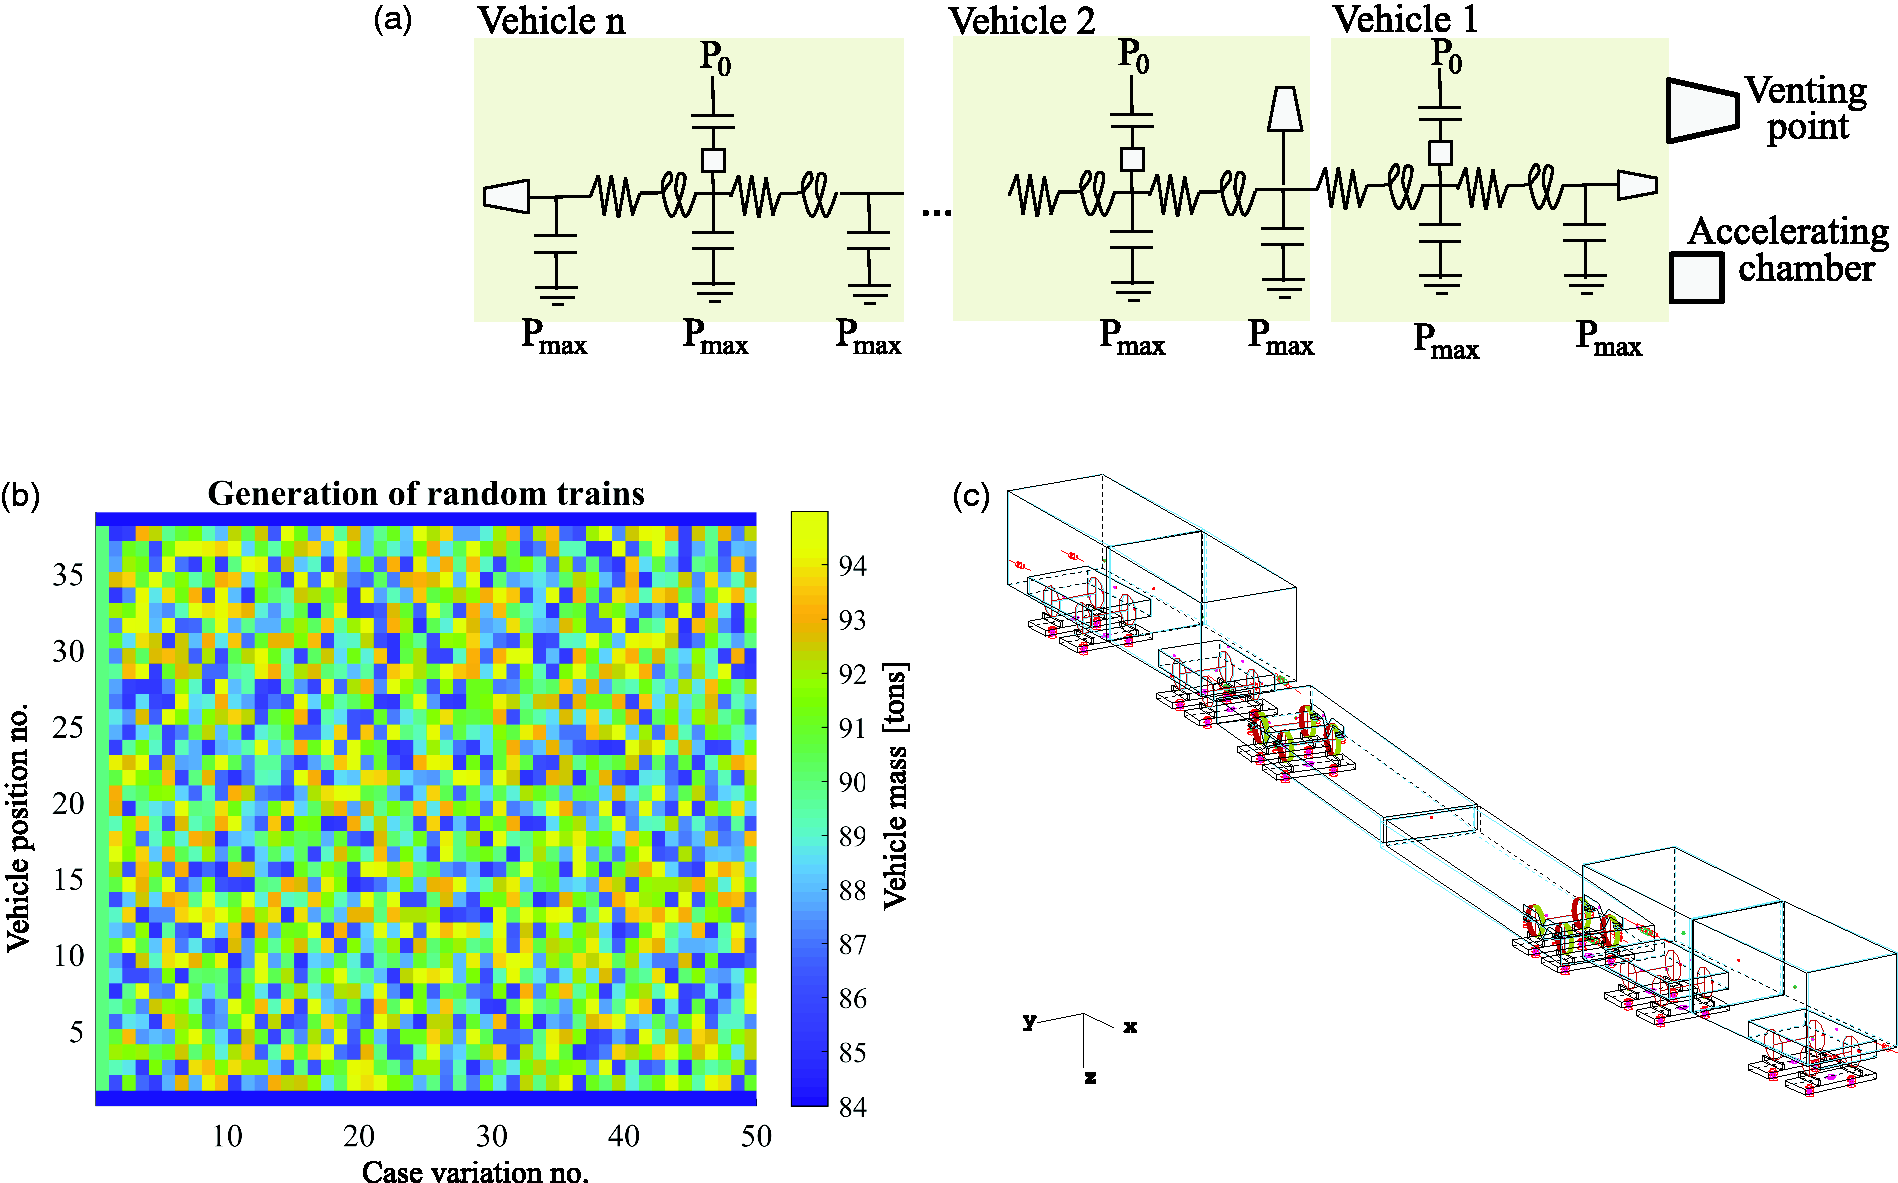
The numerical modeling procedure was categorized into three parts: wagon, wagon connections, and track design geometry. The Falns and Sggns(s) wagon classes were modeled in the 3D simulation environment with all the nonlinear characteristics of the suspensions taken into account. Two primary types of running gear, link suspension bogie (Falns) and Y25 bogie (Sggns(s)), were modeled. The detailed modeling procedure of running gear is described by Jönsson 19 and Stichel. 20 Since the torsional stiffness of the carbody plays a crucial role in determining the tolerable LCF, the carbodies are modeled as lumped mass elements, connected in the middle with a force element acting along six degrees of freedom. Some key parameters and variations in heterogeneities of these wagons are presented in Table 2.
The wagons are equipped with a pair of side buffers and a draw gear on either ends. A polymer-type buffer with standard loading and unloading characteristics used commonly in Europe has been modeled. The force exchanged are calculated as a function of the relative velocities, i.e. loading or unloading velocities to model the transition between the loading and unloading curves. 3
Flat S-curves of varying radii were designed with parabolic variation of track curvature along the transition between the straight and the circular sections. The transition length is 2 m while an intermediate straight section of 10 m was provided between the reverse curves. The S-curves were chosen because of the wagons’ high vulnerability to derail due to simultaneously high LCFs. The empty wagon in the middle was seen to mostly derail near the point when it aligns with maximum yaw angle, exerted from its neighboring wagons on either side. This gives rise to high understeering yaw moment 21 and high moments due to opposing lateral buffer forces on either side of the wagon. The tightest S-curve (S150) represents the S-curve used in the on-track propelling tests while S190 represent the tightest S-curves found in the German railway network. The track cases for which the tolerable LCFs were calculated are given in Table 2.
Braking pneumatics
The brake model describes the dynamics of compressed air inside the main brake pipe (MBP) and the transient pressure build-up in the brake cylinders. The MBP is a long pipe with pressurized air that runs across the length of the train. The venting of the MBP at venting point(s) results in a pressure drop across the wagons, leading to brake application by engaging the braking cylinders. A drop in MBP pressure engages the auxiliary reservoir located in each vehicle that pressurizes the braking cylinders, leading up to brake application. The detailed mathematical modeling procedure of the UIC brake along with its experimental validation is provided by Melzi and Grasso. 22 The analytical model of the MBP is based on an equivalent electrical scheme as described in Figure 3(a).
The MBP is divided into several segments where resistors are used to model the dissipations associated with fluid internal friction, inductors represent the fluid inertia while capacitors are introduced to account for fluid compressibility. Each wagon's braking system is divided into two parts comprising a resistor and an inductor, representing two segments of the pipe. Each vehicle is also provided with three capacitors. One is at the wagon centre while the others are at the wagon extremities and can be shared with the adjacent vehicles. As reported in Melzi and Grasso, 22 the values of inductances, capacitances, and resistances are derived on the basis of semi-empirical models and depend on geometrical parameters of the pipe (cross sections, length) and on the temperature of the fluid (which is computed assuming adiabatic flow). Additionally, the resistances are nonlinear functions of mass flow and their value is increased by 7.5% to account for the effect of connections that join pipe segments at the wagon extremities. Altogether, the MBP is described through a lumped parameter model where pressures at nodal points (i.e. voltages) and mass flows in various segments (i.e. currents) represent the independent variables.
Several valves are distributed along the pipe connecting it with the air at atmospheric pressure P0 as depicted in Figure 3(a). The venting process from multiple points of the MBP at the same time can be simulated. Mass flows across the valves are nonlinear functions of the braking type and the pressure drops across them. The valve cross-section used to simulate an emergency braking maneuver is significantly larger than the one used for service braking. Each wagon is also provided with an accelerating chamber, a volume maintained at atmospheric pressure that is automatically connected to the MBP as soon as pressure drop is detected. The flux is therefore unidirectional and only stops when the pressure inside the accelerating chamber is equal to the pressure in the MBP.
The pressure drop in the MBP at the central node of each wagon represents the input for the brake distributor model. Distributors connect the auxiliary reservoir with the braking cylinders in the wagon and influence the pressure build-up process in the latter. In particular, MBP pressure drops between 0.3 and 1.5 bars are considered since: (a) connection between the auxiliary reservoir and the braking cylinder requires a pressure drop of 0.3 bar to open and (b) a pressure drop of 1.5 bars corresponds to the maximum force developed by the braking cylinder. To summarize, the pressure drop signals between 0.3 and 1.5 bars are used as command signals for the brake cylinder. This signal is processed considering the crossing of thresholds associated with the intervention of the first-phase device. This activates as soon as the connection between auxiliary reservoir and braking cylinder is established and allows for passage of compressed air through a large-opening valve, thus speeding-up the filling of cylinder. As the pressure in the braking cylinder reaches 0.7 bar, the large-opening valve is excluded and the pressure increases with the gradient associated with the braking regime (P or G) up to a level determined by the pressure drop in main braking pipe.
In-train forces
The time histories of pressure in the brake cylinders and MBP obtained from the previous section are input data for the 1D simulation tool. This tool was developed by TU Berlin and is based on the commercial MBS software Simpack 23 and MATLAB. The MBS software solves the equations of motion of the 1D train model while MATLAB is used for simulation setup, simulation control, and result evaluation. The MATLAB tool generates models for locomotives, wagons and couplers from base models. The train models then combine the individual vehicle models and also operating conditions such as topography, initial speed, etc.
The individual vehicle's 1D MBS models consist of masses and different force elements depending on the vehicle type. All vehicle models consist of additional force elements that model the friction brake force and the running resistance forces. The locomotive models also use a force element for the traction forces. By default, rotational effects of wheelsets or traction motors have not been modeled. The kinetic energy of the rotational motion of such elements is, however, considered in the longitudinal motion of the vehicle by means of a factor. However, more detailed vehicle models along with wheel–rail–contact may be added at any position along the train. Bosso and Zampieri 24 show such an application.
The force element representing the friction brake takes various parameters as input. Besides the type of brake (block brake vs. disc brake), its technical parameters such as the brake cylinder pressures, friction law of the brake block/disc material, and the type of empty/load devices are essential. Different friction laws are added, ranging from the well-known Karwartzki law 3 for cast-iron brake blocks to polynomial expressions for composite brake block materials, derived from measured data. The models for the empty/load device represent the ones used in European freight wagons, according to requirements given by UIC. 25 There are two types to be distinguished. The first type is a manual device that adjusts the brake force discretely between the empty and loaded conditions. The second type is an “auto-continuous” system that proportionally increases the brake force with the wagon load of up to 65% of the total wagon mass. Beyond this point, the brake force stays constant.
Models of the European buffers and screw couplers link the vehicle models in the train. The coupler models use hysteresis curves from quasi-static measurements of buffers and draw gears. Previous investigations by UIC 26 and Wu et al. 27 show that quasi-static curves are suitable for the simulation of (maximum) in-train forces during a train run. However, other scopes of investigation, e.g. collisions or fatigue simulations require other and/or more complex models. Wu et al. 27 give a good overview on this matter.
All parameters that define the different vehicle models (e.g. mass, resistance coefficients, and force element characteristics) and the entire train setup are listed in a parameter file and controlled using the MATLAB tool. A train setup consists of a variable number of vehicles n (both locomotives and wagons) and n-1 inter-wagon connections. Furthermore, the tool allows for varying values of different heterogeneities. This facilitates the investigation of influences of the heterogeneity value scatter which is inevitable in a real train operation. The scatter can be normally or randomly distributed and be varied in sequence or at the same time. For example, Figure 3(b) shows a variation with 50 cases of randomly distributed total vehicle masses within the range of 85 to 95 tons. The x-axis shows train variations and the y-axis shows the corresponding loading status of vehicles in each variation. Variation number one on the far left is the standard (unvaried) train where each wagon has a nominal total mass of 90 tons (vertical green/grey bar). As the weight of the locomotives in the train is not varied, it stays at the nominal value of 84 tons for all variations (horizontal blue/black bars). However, it should be noted that setting up a train in reality is not a random process. Cantone and Ottati 28 describe a method to generate trains that resemble typical train configurations in a real operation.
The MATLAB tool initializes the parameter values for the MBS environment and starts the solver. After the simulation, the MATLAB tool fetches the raw output data of the MBS environment for post-processing. This procedure enables a new scenario to be automatically set up, depending on the results of previous scenarios. Besides the time histories of kinematic quantities and coupler forces, maximum absolute values of in-train forces (LCF and LTF) along with the position(s) of their occurrence are obtained. The in-train forces hence obtained from the workflow consists of the influences of heterogeneities ranging from the brake pneumatics to the vehicle- and track-based heterogeneities covered during the modeling process in this section. The calculated tolerable LCFs are static in nature as opposed to the dynamic nature of the in-train forces. Moreover, the in-train forces are calculated at higher running speeds. Hence, the maximum value of the in-train forces averaged for a 1 s time interval was chosen to compare with the tolerable LCF in the current work. This is only intended to be a reference LCF value to understand the relative criticality with respect to (w.r.t.) major heterogeneities such as braking maneuvers and train length, and not necessarily as an absolute comparison between two quantities.
Simulation results and discussions
A 1250 m long train operation, comprising Sggns(s) wagons is used to exemplify combined results from all the three simulation tools. However, the influence of individual heterogeneities can be separately seen in each of the following subsections in different tools.
Tolerable LCF
The tolerable LCFs provide a measure of the wagons' resistance towards derailment due to the high longitudinal forces acting when negotiating tight S-curves. They reflect the influence of the more localized heterogeneities in the train formation, such as the neighboring wagons, buffer types, wagon construction, etc. In this context, the buffer angle (ψ
ij
) is the yaw angle between the buffers of two adjacent wagons i and j. The difference in buffer angles made by the jth wagon with its neighboring wagons denotes the buffer angle difference ( (a) Buffer angle difference (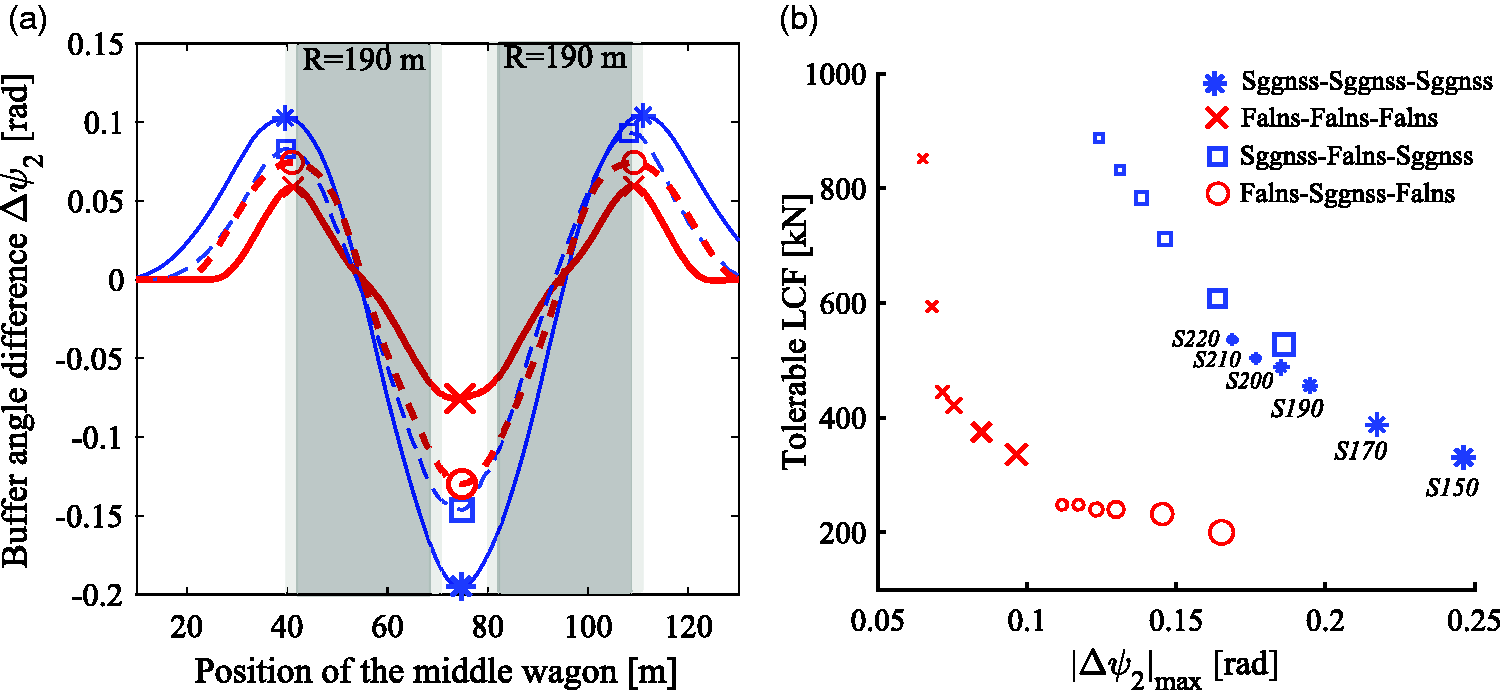
The tolerable LCFs for the three-wagon train compositions on all six S-curves with the
The trends in Figure 4 isolate the influence of carbody torsional stiffness, wagon geometry, wagon arrangements, and track curvature on the tolerable LCF. For a given freight train operation with knowledge of the critical track section along its route and train composition, it is possible to utilize similar trends to find the tolerable LCF. This coupled along with the knowledge of the location of the maximum occurrence of the in-train LCFs obtained from the in-train force tool, the critical neighboring wagon compositions w.r.t. payload can be positioned along the train where minimum in-train forces occur.
For comparison with the in-train force in the forthcoming sections, LCF limit value of 536 kN is considered for the Sggns(s) train compositions with empty/ half-loaded wagons. This value corresponds to the tolerable LCF obtained for the Sggns(s) × 3 trains for the critical loading distribution on an S220M10 curve (see Figure 4(b)). For the nominal loading distribution, however, the train did not derail on the S-curve up to the 2000 kN upper limit considered in the simulation methodology. So this value was considered as the LCF limit for the loading pattern f–f.
Braking pneumatics
Manoeuvres A and B from the braking scenarios above were considered for the simulation of pneumatics since the tractive operation in maneuver C is modeled in the in-train force tool. Simulation of the braking pneumatics allows to compare the performances of the system w.r.t. delay in braking command and application of braking force. Reduction of the delays has a positive effect on stopping distances. From an ideal viewpoint, the braking forces should be applied simultaneously along the train to reduce the peaks of both LTF and LCF values as demonstrated by the 1D in-train force tool.
Considering the case of 1250 m long train made up of Sggns(s) wagons only, Figure 5(a) shows the time required to achieve a pressure drop of 1.5 bar in the MBP for all the vehicles along the trains. The figure presents three train configurations for maneuver B. Along with the master locomotive in the front, there is/are:
a slave locomotive at the train center, a slave locomotive at the train end, two slave locomotives each at the centre and at the end of the train. For wagons across the 1250 m Sggns(s) train: (a) time required for a 1.5 bar pressure drop in MBP; (b) time required to reach 99% of the maximum pressure in braking cylinders; cases marked bold in Table 3.
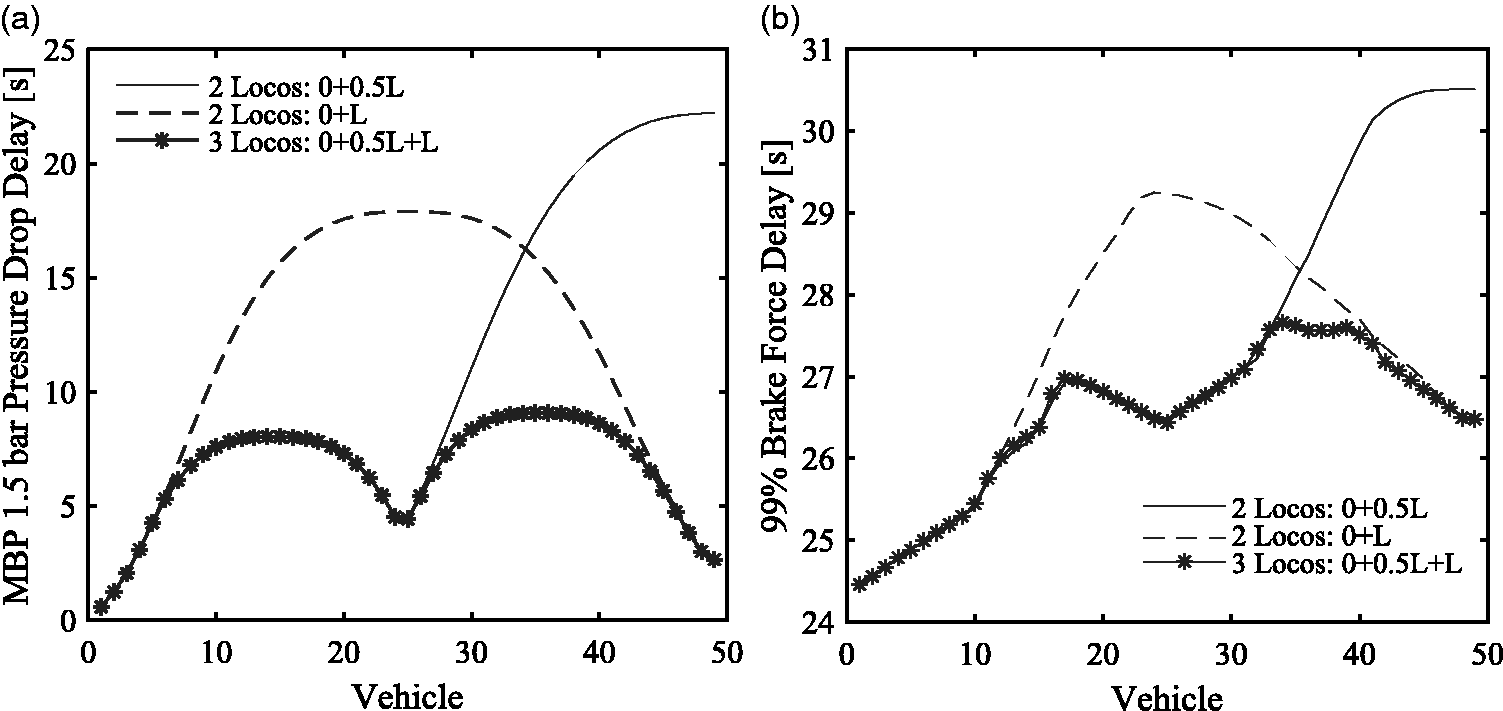
Figure 5(b) shows the time required to reach 99% of the maximum pressure in brake cylinders as a function of vehicle position along the train. The configuration with two slave locomotives leads to time delays between 24.5 s and 27.5 s with a rather uniform distribution (illustrated by solid lines with points). When a single slave locomotive at the train end is used, the delays are between 24.5 and 29.2 s. Using a single slave locomotive at the train centre however causes the maximum time delay to rise up to 30.5 seconds. Therefore, the build-up to maximum braking force application along the train is very far from an ideal simultaneous activation, required to minimize the generated in-train forces.
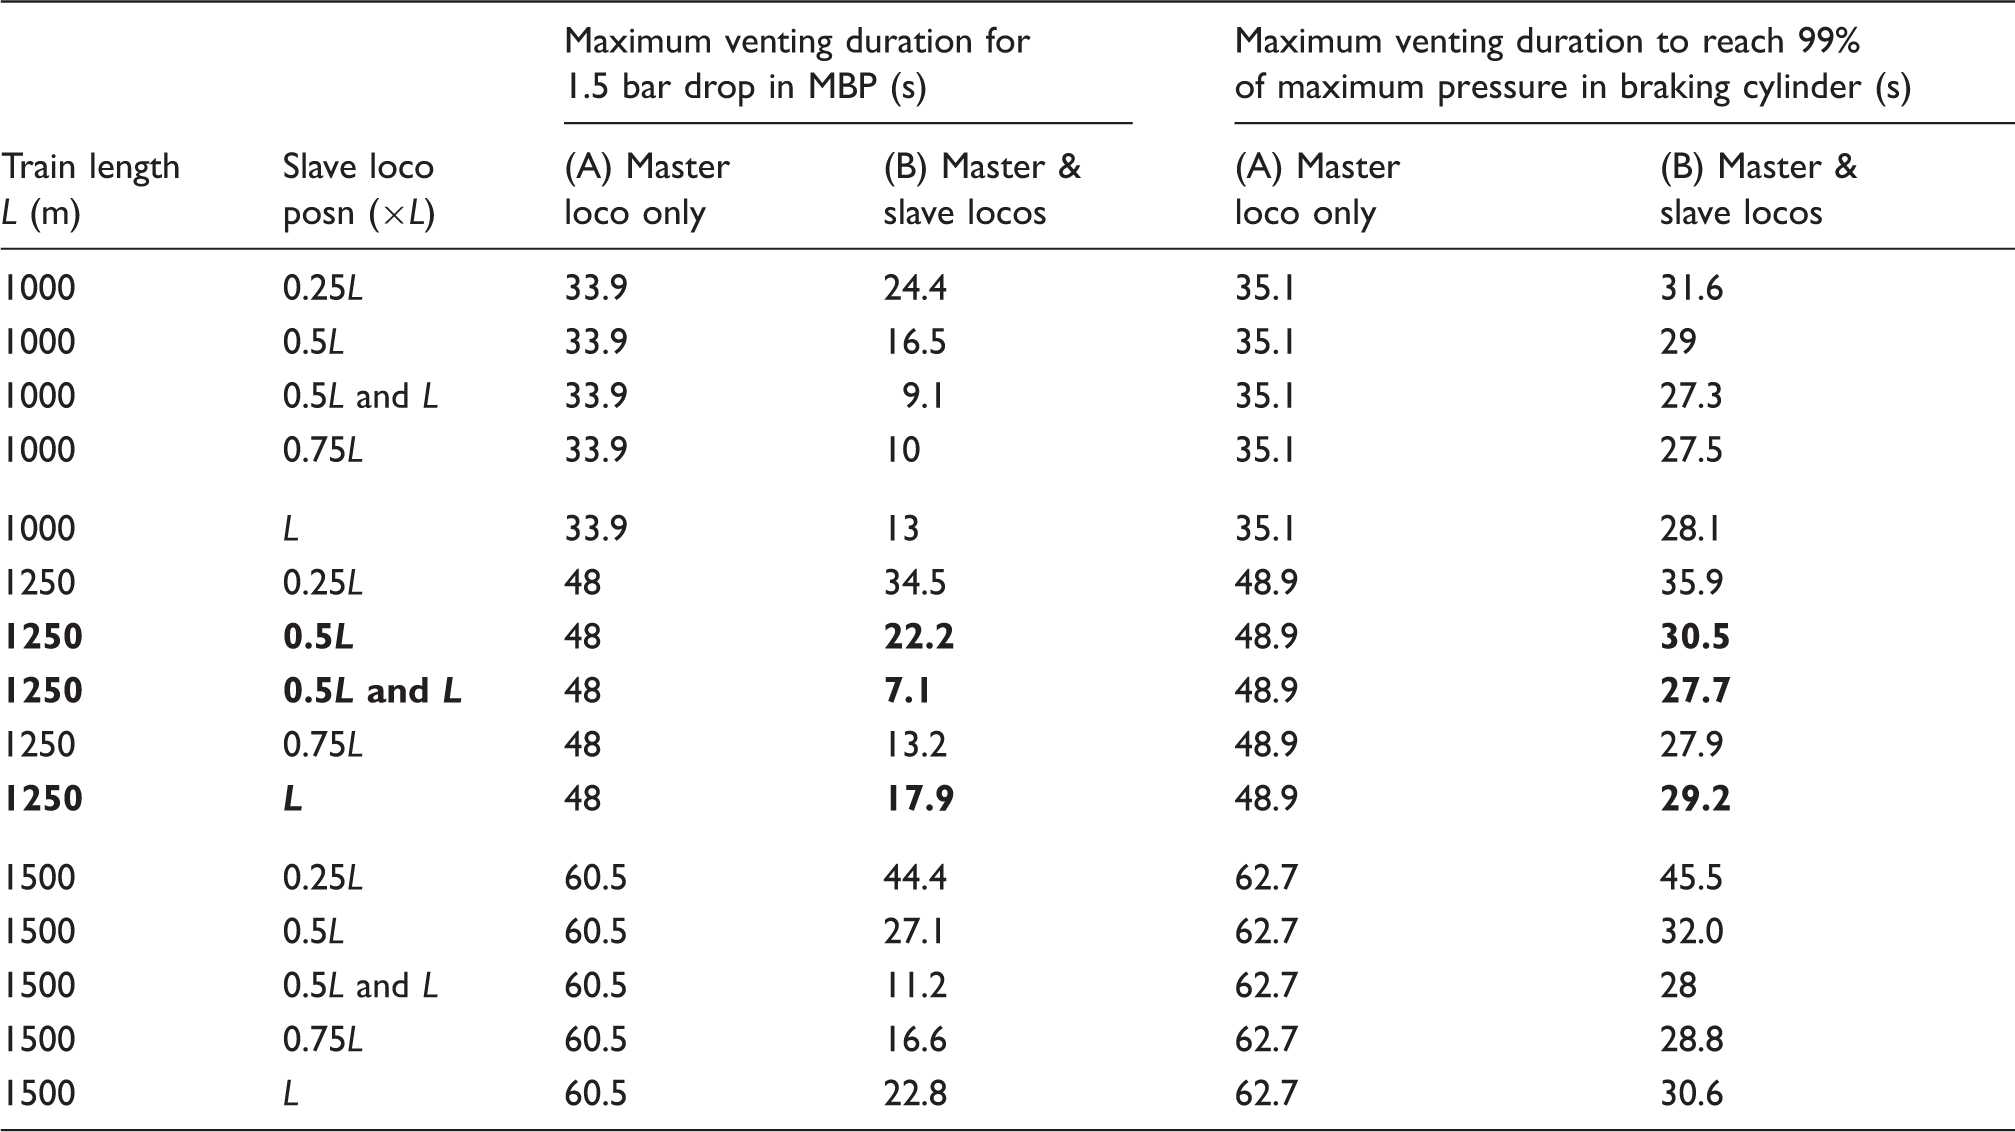
Venting durations to reach maximum pressure in braking cylinders of all wagons, resulting in maximum brake application.
In-train forces
The 1D in-train force simulations have two main goals, after turning pneumatics into 1D forces. The first goal is to compare the maximum values of LCF and LTF against their limit values obtained from the tolerable LCF tool earlier, thus identifying suitable train configurations. The second goal is to identify major influences of the heterogeneities in train configurations on the resulting LCF and LTF values. As illustrated in Figure 2, the 1D in-train force tool accumulates the effect of maximum heterogeneities and on further comparison with the outputs coming from the 3D tolerable LCF tool, a complex parameter space of heterogeneities would have been accounted for. The results for a 1250 m long train composed of Sggns(s) wagons with a single slave locomotive is discussed in detail as an exemplary case.
Figure 6 illustrates a 4D matrix (4 × 9×2 × 3) of in-train forces. The larger 2D array of bar plots (4 × 9) illustrates variations for four slave locomotive positions (indicated by the larger vertical axis) and nine loading patterns (indicated by the larger horizontal axis). Each cell in the larger array comprises a barplot each for the maximum LCF (white background) and LTF (grey background) values (×2), respectively. Each barplot further has three bars representing different braking maneuvers A, B, and C (×3), indicated on their individual vertical axes. The values are normalized w.r.t. respective limit values. The letters lim:e, lim:h, and lim:f indicate the relevant limit values for empty, half and fully loaded train sections respectively. A LTF limit value of 850 kN was chosen since it denotes the minimum breaking load of the screw-coupling as given by EN 15566.
29
The relevant limit values are provided at the bottom of the figure. When the value is below the limit, the bar is white/yellow (less than 1) and is black/blue when above the limit (greater than 1). The vertical black line at unity indicates the normalized limit. Grey/green bars indicate LTF values, which are below the limit but may be in the range where fatigue might occur.
In-train force summary for 1250 m long Sggns(s) trains with a single slave locomotive. Horizontal direction – variation in loading patterns; vertical direction – variation in slave locomotive positions.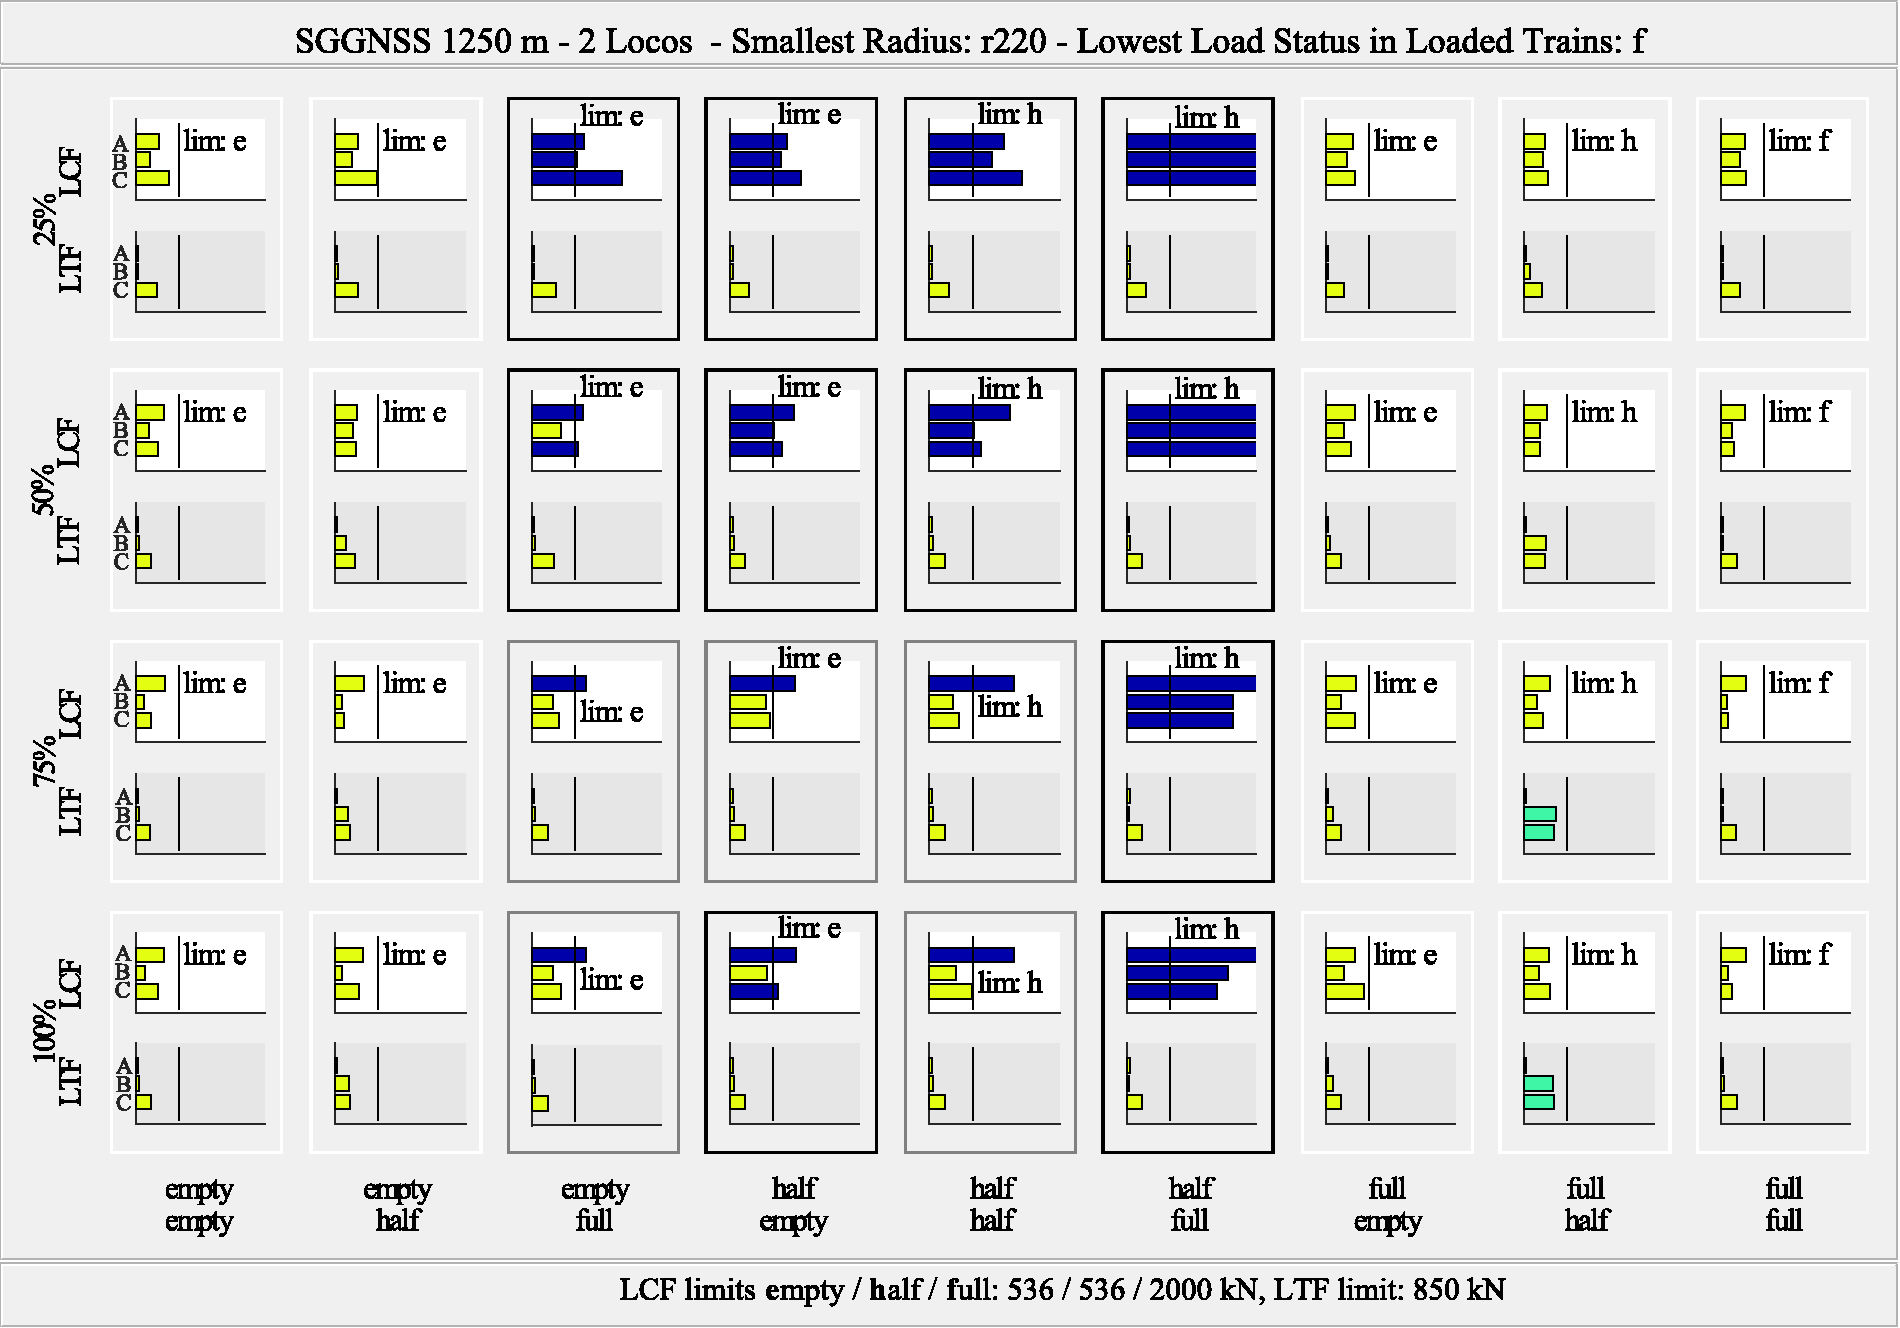
Furthermore, a white, grey or black frame around cells of LCF and LTF bar plots summarizes the results. A white frame indicates that all bars for all maneuvers for a specific combination of loading status, slave locomotive position, and braking maneuvers are below the limit. A grey frame means that the bars for maneuvers B and C for a specific combination of loading pattern and slave locomotive position are below the limit but not those of maneuver A (degraded braking mode). A black frame indicates a combination where at least one of maneuvers B and C exceeds a limit.
Such plots allow for identifying suitable train configurations in a very compact way, which is the first goal. Also, the second goal of identifying the influence of the heterogeneities in train configurations is achieved by these plots. As expected, Figure 6 shows that braking maneuver A always leads to high LCF values for loading patterns e–f, h–e, h–h, and h–f (cf. Table 1). The results for maneuvers B and C with the same loading patterns meanwhile strongly depend on the slave locomotive positions. The slave locomotive positions at 0.25L, 0.5L, and L appear to be less favorable than the 0.75L position, which concurs with the results from Table 3. An important observation is that all the trains with the highest LCF values have the h–f loading pattern. This is due to the large differences in the brake force to mass ratio. A half-laden wagon has the same brake force as a fully laden wagon for both manual and auto-continuous empty/load devices (see the modeling section). The same brake force acting on wagons with significantly different masses leads to large differences in deceleration, and thus results in high in-train forces. The loading pattern h–f is the most critical for in-train LCF since the faster decelerating portion of the train is at the front. The converse loading pattern f–h therefore is the most critical w.r.t. LTF values, as the faster decelerating part of the train is in the rear portion of the train as Jobstfinke 30 explains in detail. These are some examples of influences of heterogeneities in train configurations such as loading patterns, braking maneuvers, locomotive positions, empty/load devices, etc. that were identified as a part of the second goal.
Conclusions and future work
A numerical framework to explore the large and complex heterogeneity space in the operation of long freight trains has been put forward in this work. An exemplary overlong freight train operation was discussed and guidelines proposed w.r.t numerous heterogeneities in the same, using different tools. This multimodular approach allows for studying long freight train operation while justifying its overall heterogeneous nature. It is difficult, however, to account for all heterogeneities in a single tool, owing to the scale and complexity of the heterogeneity parameter space and computational requirements. In addition to this, certain heterogeneities are also correlated (e.g. payload and empty/load devices in in-train force tool; torsional stiffnesses and wagon geometries in tolerable LCF tool). Therefore, the integrated framework comprising these three tools allows to better study the correlated heterogeneity space.
The 3D simulation tool is better suited for studying more localized heterogeneities that could result in wagon derailment. The results indicate the criticality of placing empty, long and flexible wagons in a heterogeneous train setup. Also, the neighboring wagons' characteristics, rather than the derailing wagon itself (middle) governed the trend w.r.t the geometric parameter (
A validated pneumatic brake model was used to obtain reliable predictions of pressure build-up in brake cylinders, consequent to braking applications along the entire train length. It is well-suited to investigate the effect of heterogeneities that concern the train composition like length, number, and position of wagons. Additionally, the more intrinsic features of the braking system such as the time delays between venting activations from multiple points due to different maneuvers can be analyzed. This is particularly important when designing the communication systems for remote-controlled traction/braking. The advantages of placing the slave locomotive at three-fourths of the total train length and the additional benefits obtained with a second slave locomotive are reported alike for both the braking pneumatics and the in-train force tools. The 1D LTD simulation tool analyzed a variety of train configurations and operational scenarios. This module was able to account for maximum heterogeneities and formed the bridge between the braking pneumatics and the tolerable LCF tool. The result visualization utilized a matrix of bar plots to give a compact yet detailed overview of a large amount of individual simulations. This allowed for the identification of an advantageous slave locomotive position (75% in most cases), challenging loading patterns and most critical operational braking/traction maneuvers w.r.t both LCF and LTF values. In-train force summaries similar to the ones in Figure 6 for more train compositions are reported in Berg et al. 13 The characteristic of the auto-continuous empty/load devices was identified as disadvantageous, especially when it comes to the loading pattern h–f that resulted in higher values of in-train LCFs. The tool is flexible and allows for a variety of heterogeneities, the examination of which is only limited by the available computational power. Taking the work further, future analysis should consider more slave locomotive positions and more loading patterns (e.g. more than two different loading sections across the train) and more operational maneuvers. However, the challenge is to identify generally working concepts rather than possible individual train configurations. Also, for the braking maneuvers studied, LCF seemed to be a more severe problem than LTF.
An integrated framework such as the one presented in the current work should ideally be able to identify the feasibility of a long freight train operation, considering the whole system comprising the vehicles, infrastructure, and operating maneuvers, leading to proposing operation-based approval for long freight trains.
Footnotes
Acknowledgements
A vote of thanks goes to Deutsche Bahn (DB) for providing valuable information and support.
Declaration of Conflicting Interests
The author(s) declared no potential conflicts of interest with respect to the research, authorship, and/or publication of this article.
Funding
The author(s) disclosed receipt of the following financial support for the research, authorship, and/or publication of this article: The authors thank the European Commission and members of the DYNAFREIGHT consortium (Grant agreement no. 730811) for the support received over the course of the study.