
Abstract
This paper proposes a new, two-stage methodology to estimate the relative marginal cost of different types of vehicles running on the rail infrastructure. This information is important particularly where the infrastructure managers wish to differentiate the track access charges by vehicle type for the purpose of incentivizing the development and use of more track-friendly vehicles. EU legislation requires that the European infrastructure managers set the access charges based on the incremental (marginal) cost of the running trains on their networks. The novelty of the approach derives from the combination of: (1) engineering simulation methods that estimate the track damage caused by the rail vehicles; and (2) econometric methods that estimate the relationship between the actual maintenance costs and the different damage mechanisms. This two-stage approach fills an important gap in the literature, given the limitations of the existing “single-stage” engineering or econometric approaches in obtaining the relative marginal costs for different types of damage. The authors demonstrate the feasibility of the method using 45 track sections from Sweden, for which the data on maintenance costs are available together with relevant track and vehicle data for 2012 (supplied by the Swedish Transport Administration). The authors demonstrate the feasibility of producing summary, section-level damage measures for the three damage mechanisms (wear, rolling contact fatigue, and track settlement), which can be taken forward to the second stage. The econometric results of the second stage indicate that it is possible to obtain sensible relationships between cost and the different damage types, and thus produce relative marginal costs by the damage mechanism and in turn the vehicle type. Based on this feasibility study, tracksettlement has been found to be the most expensive (in terms of maintenance cost) of the three mechanisms, followed by the rolling contact fatigue and then the wear. Future applications should focus on larger datasets in order to produce the required degree of precision on the estimation of the marginal cost.
Keywords
Introduction
European policy since the mid-1990s has emphasized the promotion of competition as a way of revitalizing the fortunes of the European railways. Progressively, freight and international passenger rail services have been opened up to the competition. The proposals contained in the European Commission’s Fourth Railway package (European Commission 1 ) envisage further liberalization of the domestic passenger services. Vertical separation of infrastructure and operations or, at least, fair access to infrastructure and transparent prices for access, is seen by the Commission as a key enabler of competition in the sector.
The above developments mean that understanding the cost, and in particular, the marginal (infrastructure) cost, of running an extra train service on the network has become more important than ever. The existing legislation requiresthat the charges for access to the infrastructure must be based on “costs directly incurred as a result of operating the train service” (European Commission 2 ). This can be interpreted as what economists would call the short-run incremental (marginal) cost imposed on the infrastructure by the service running on the network. This paper focuses on one element of short-run marginal cost, namely the additional maintenance and renewal cost required to rectify the incremental damage caused by a train service (the marginal wear and tear cost).
The need to estimate the marginal cost of infrastructure use is not solely for the purpose of meeting the EU legislation. Economic efficiency considerations mean that the train operators should pay at least the short-run marginal cost of running an extra train service. Further, track access charges that vary according to the different damage and cost imposed by different vehicles should ensure that the “right” vehicles are run on the network and that new rolling stock designs are developed that reduce the whole costs of the system.
The previous academic literature, and practice by bodies responsible for charging, contains three approaches for estimating the marginal costs of the traffic and also different types of traffic : cost allocation methods; econometric approaches; bottom-up engineering methods. From an engineering perspective, the main role of the track is to support and guide the railway vehicle. The forces between the vehicle and the track are carried through the wheel–rail interface and include vertical support, lateral guidance, acceleration, and braking. These forces lead to different forms of damage, which in turn result in interventions and cost. In practice, the approaches used by the charging setting bodies can be a hybrid of engineering and econometric methods, such as that used by the British Office of Rail Regulation (ORR). 3 However, each of the approaches has significant drawbacks. The aim of this paper is to propose an alternative, a two-stage approach that combines the engineering and econometric methods in a way that seeks to exploit the best features of both, and thus overcome some of the weaknesses of the previous approaches. This is the unique contribution of the paper.
The remainder of the paper is structured as follows. We first review the previous literature on the estimation of the marginal cost of the rail infrastructure. We then define the relevant damage measures covered by our study and how these are measured, before providing an overview of the two-stage methodological approach. Following this, the engineering stage (stage 1 of the method) is explained via an example for one of the track sections used in the analysis, demonstrating how the damage estimates are obtained in the form needed for the second stage. The econometric results of the second stage, which draw on the damage estimates from stage 1, are then set out and discussed. The final section concludes and suggests future directions for the research.
Previous approaches to measuring the marginal cost of the rail infrastructure
Alternative approaches for estimating the marginal costs.
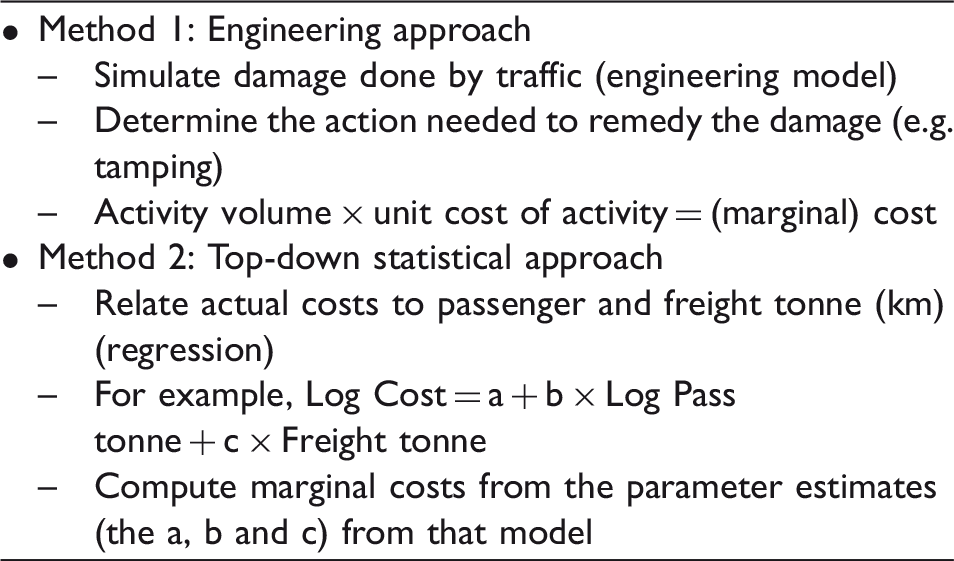
Note: a, b and c are parameters to be estimated by the econometric model (a is a constant term, b and c are elasticities of cost with respect to the relevant variable).
Both methods have strengths and weaknesses. The advantage of the top-down methods is that they use the actual cost data. Their weakness lies in the fact that it is likely to be very hard to capture the complexity of factors that will affect the relationship between traffic and cost, and in particular, it has been proved difficult to get sensible estimates of the relative cost of the passenger and freight vehicles. The bottom-up method is very good at capturing the complexity and it is possible to model and gain estimates of the relative damage of the different types of vehicles. The problem is how then to translate these damage estimates into cost.
It is important to note, more precisely, why there is a difficulty in getting from damage to cost in bottom-up approaches. First, traffic results in different types of damage. In practice, one vehicle may cause more of one type of damage and less of another, thus meaning that information is needed on the relative cost of the different types of damage to obtain estimates of the relative marginal costs by the vehicle type. This leads to a second problem, namely that assumptions are needed on what type of activity and how much of it are needed to rectify the damage done. This potentially requires a very detailed model, or alternatively simplifying assumptions are needed which might be wrong.
Added complexities include the fact that the mix of the damage types will affect what activity should be undertaken (e.g. some types of traffic might cause damage but at the same time alleviate the need for other forms of remediation, such as rail grinding) and the fact that some damage mechanisms lead to more maintenance activity, whilst others result in more renewal (and the costs of these can be very different). Finally, it is hard to estimate the unit costs of activities, as these will depend on, inter alia, the location, the nature of the job, the length of possession, and the scale of the activity.
The research question therefore is as follows: how can we obtain better estimates of the relative cost of different damage mechanisms, which in turn can then help estimate the relative marginal cost of different types of vehicles?
In terms of its relation to other approaches, in the past, ORR has used a top-down cost allocation approach, based on the engineering judgment, to determine the general level of cost variability, and then used an engineering formula to allocate costs to vehicles based on their relative damage (vertical forces only). Since then, Network Rail has developed its bottom-up cost modeling approach, which is now based on the vehicle track interaction strategic model (VTISM) 5 to estimate the marginal costs from the bottom-up. This approach measures the overall variability of costs with respect to traffic. Engineering approaches, based on both vertical and horizontal forces, are then used to allocate that element of costs that is deemed variable down to individual vehicles (see ORR 3 ). This approach means that Britain, unlike other European countries, has highly differentiated charges, by vehicle, which should incentivize the use of more track-friendly vehicles.
At the same time, top-down econometric methods relating actual costs to traffic volumes, controlling for other factors, have been extensively used and the results are used by the European Commission (see, e.g. Johansson and Nilsson, 6 Wheat and Smith, 4 Wheat et al., 7 for a summary, and Andersson et al. 8 for subsequent developments in modeling of renewal costs). These studies have covered a range of European countries, and suggest that the marginal cost of the maintenance of rail infrastructure is in the region of 20–35% of the maintenance costs (or up to 45% for heavily used sections). Wheat et al. 7 found that the available evidence was much less strong for renewals, though the authors suggested an indicative overall cost variability proportion of around 35% of renewal costs. More recent evidence has put this at a higher level, at approximately 55%. 8 As noted above, these methods have been useful in determining the extent of the cost variability with the traffic in general, but less effective at allocating to types of traffic or vehicle. It is worth further noting that the engineering-based bottom-up approach used by Network Rail puts the variability proportion at less than 10%, which is out of line with the top-down econometric evidence from across Europe.
Our proposed approach is therefore positioned within the existing literature (academic and regulatory) and has the potential to enhance the track access charging regimes in Europe by providing new evidence on the relative cost of different damage mechanisms, in turn leading to better estimates of the relative marginal cost of different types of vehicles. The approach could also be used to determine the absolute marginal cost and cost variability levels to compare against the results of top-down and other engineering models.
Overview of the two-stage methodology
The method in this paper consists of two stages. The first stage involves an engineering simulation exercise in which traffic (of certain vehicles and a mixof vehicles) is run on a network of known characteristics to produce estimates of the resulting damage (denoted as D1, D2, and D3, to represent the three main damage mechanisms: track settlement, wear, and rolling contact fatigue, respectively and discussed in more detail in the next section). For this exercise, 45 actual track sections were chosen from Sweden where data were available on the maintenance and renewal costs, the traffic volumes, and the infrastructure characteristics. The second stage involves establishing a statistical relationship between actual costs (maintenance and/or renewal) for actual track sections on a network (in our case the Swedish network) and damage. The approach is summarized in Figure 1.
An overview of the methodology.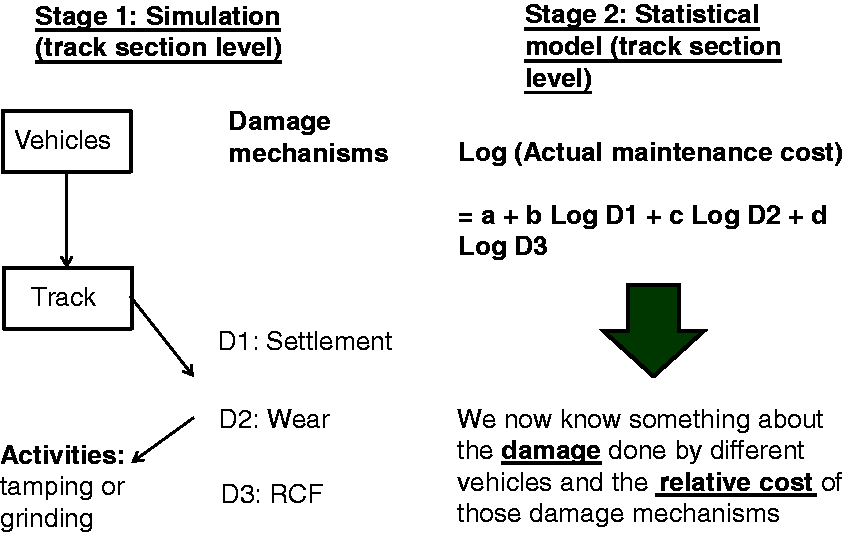
Estimates of the relative cost of different damage mechanisms can be obtained from the parameters in this second stage regression (the b, c, and d parameters in Figure 1), which in turn allows us to estimate the relative cost of different vehicles. In addition, a more complex relationship could be assumed in the second stage statistical model, for example to include interactions between the types of damage (e.g. D1 × D2). The detailed assumptions for stage 1 and of the approach, as they apply in practice, are set out below, after first defining the damage mechanisms and their units of measurement.
Damage mechanisms and modelling of damage
In this paper, we consider the three main damage mechanisms: rail wear, rail rolling contact fatigue, and track settlement. These are described in the following sections.
Wear and rolling contact fatigue
Wear of the rail is a natural process in which the material is removed from the head and/or the inside (gage) corner of the rail when the railway vehicles run. The rate of removal is affected by the forces and contact conditions. Severe wear can change the cross-sectional profile of the rail, resulting in a change of the running surface seen by the wheel. Rolling contact fatigue (RCF) occurs if the rail surface is subjected to repeated plastic deformation as is often caused by repeated wheel passages.
The ‘Tgamma’ value is the product of the tangential force (T) and the creepage or slip (gamma) in the contact patch between a wheel and rail. It is a measure of the energy dissipated in the contact patch and can be used to drive models of the wear and RCF likely to take place at each wheel as defined below. In this work, the Tgamma value is averaged over 40 m to produce an indication of the level of the wear produced by each wheel.
Work by Burstow
9
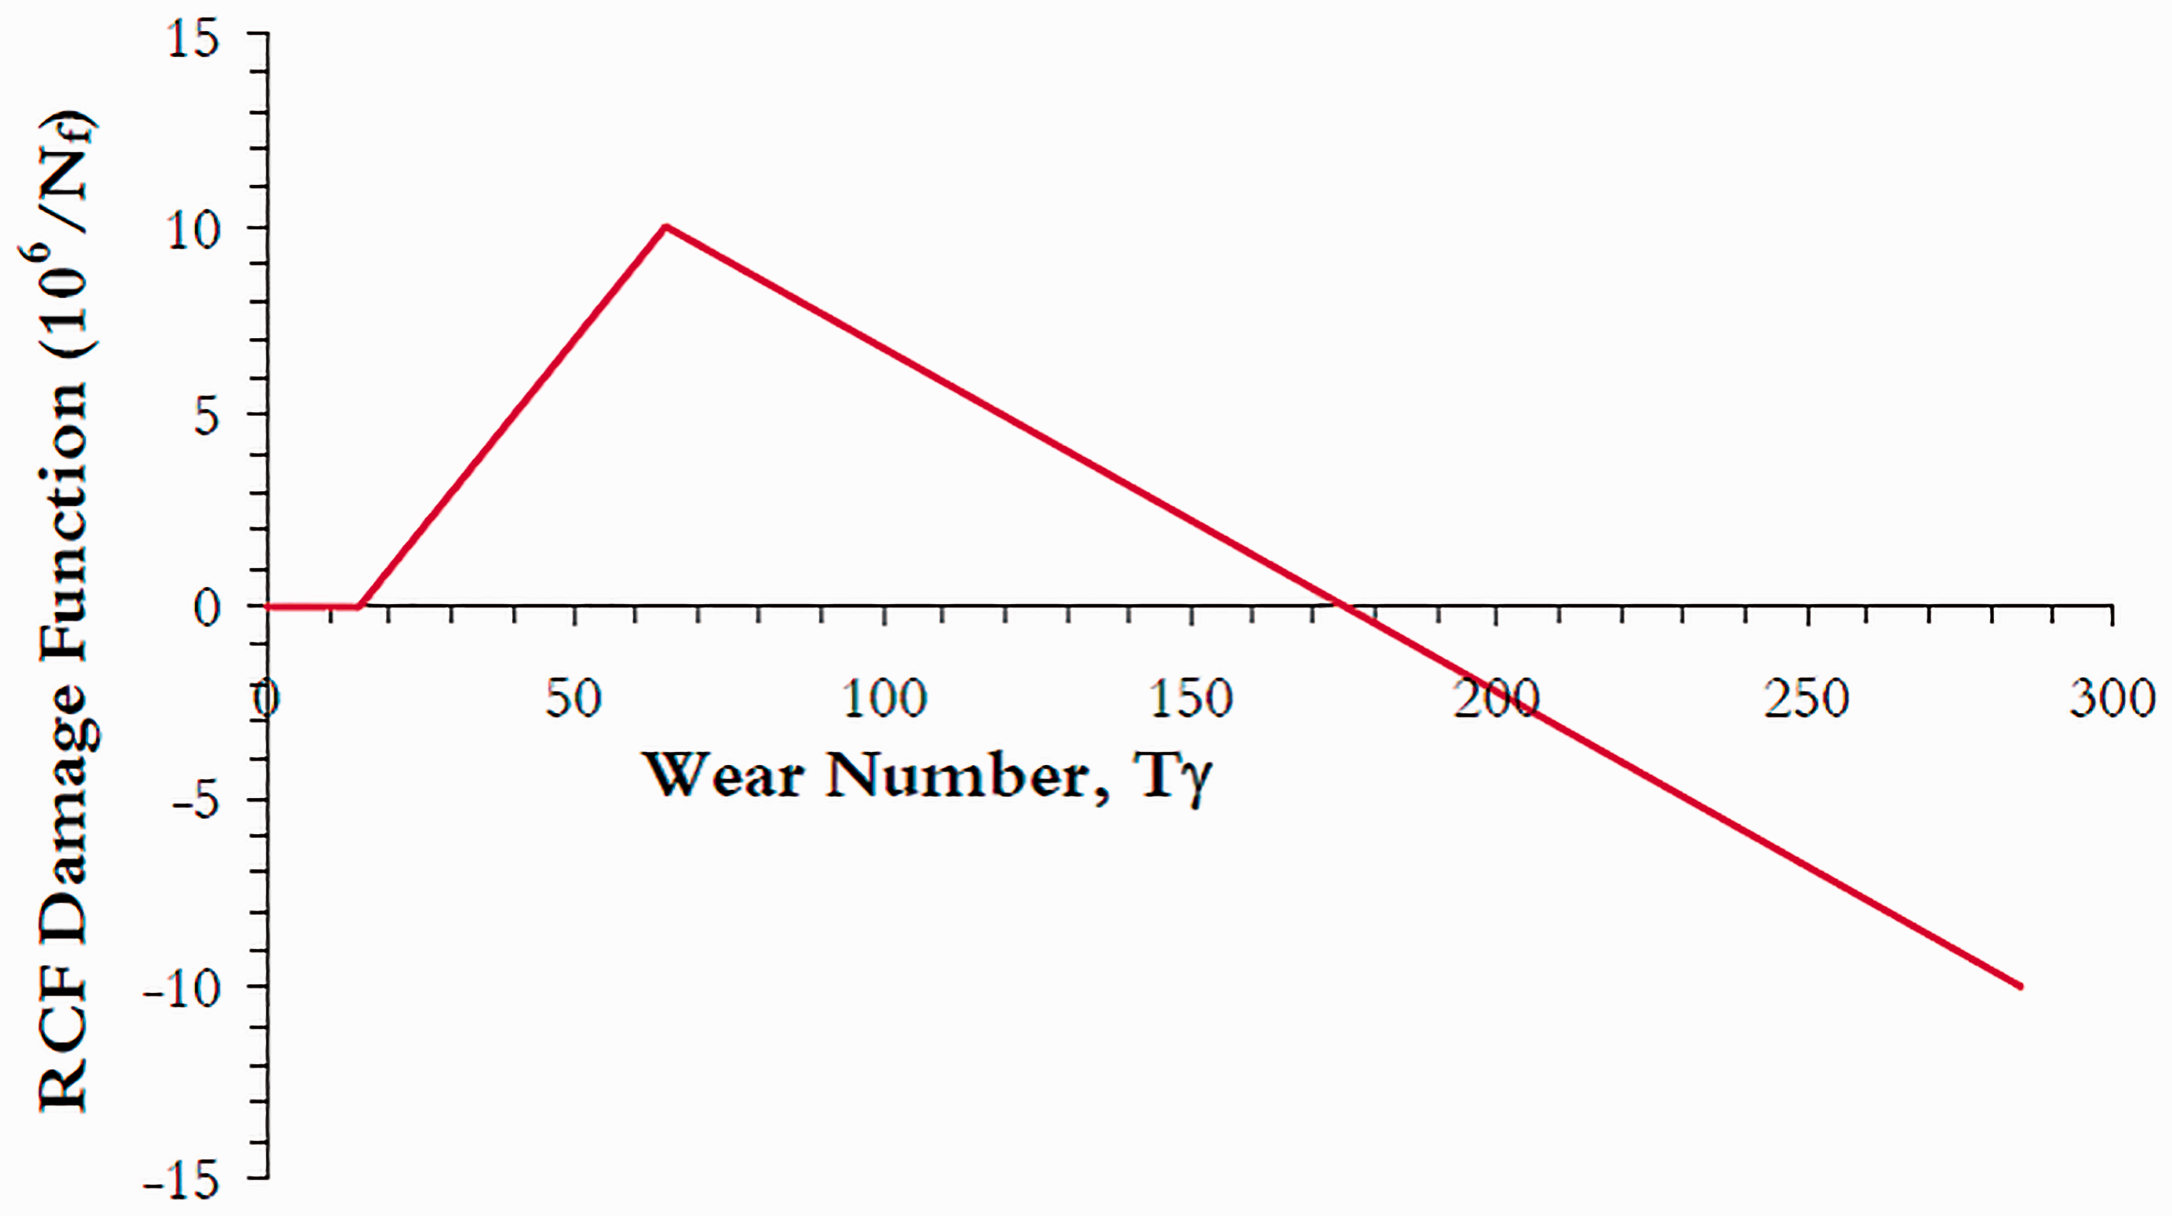
and others has shown that Tgamma combined with a nonlinear damage function produces an RCF damage index as shown in Figure 2. This recognizes that:
Below a Tgamma value of 15 J/m there is insufficient energy to initiate the RCF cracks. Above 15 J/m, the probability of RCF initiation increases to a maximum of 1 at a Tgamma value of 65 J/m. As Tgamma increases further from 65 to 175 J/m, the level of energy is such that the dominant form of surface damage is the wear (rather than the crack initiation), and therefore the probability of RCF damage decreases as the wear increases. Tgamma values greater than 175 J/m result in wear but no RCF initiation. The units of the RCF damage index are 10−5 per axle. This indicates that for a damage index of 1, 100,000 axle passes would result in the RCF initiation.
Relationship between wear number (Tgamma (J/m)) and RCF damage index (–) from Burstow.
9
Track settlement
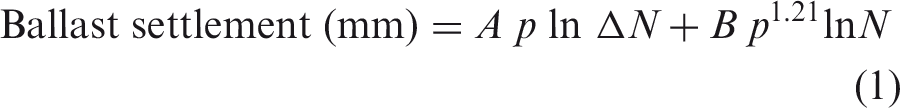
Track settlement results in the track sinking vertically into the ballast under the passage of railway vehicles. Differential settlement results in increased track irregularities and requires maintenance action typically by tamping. A number of models have historically been used to predict the track settlement. 10 Initially in this work, the model defined by the Technical University of Munich (TUM) and the Sato model were considered. However, after investigation, a simplified method was used. This method has been used earlier to estimate the track settlement where the calculation of the ballast pressure has not been necessary. Instead of calculating the ballast pressure, this method uses peak vertical force at the wheelset to calculate the settlement.
The TUM model
The simplified model

In summary, the following indices are used in this work:
Rail wear index – the Tgamma value calculated for each wheel over an average of 40 m and then summed; Rail RCF index – the Tgamma value calculated for each wheel and weighted by the nonlinear damage function and summed for each wheel; Track settlement index – the peak vertical force at a wheelset weighted according to equation (2).
Engineering method and case study results: Stage 1 methodology
We now explain the stage 1 method and illustrate this for one case study section (denoted as section 629 in the Swedish Transport Administration database).
Outline of the engineering method
Vehicle description.
A number of modeling techniques, in combination with computer simulation packages, can be used to estimate the different damage mechanisms. As noted earlier, the damage mechanisms of interest are rail wear, rail rolling contact fatigue, and track settlement. The determining factors behind the mechanisms are the vertical and lateral wheel–rail forces and the energy dissipation at the surface of the rail. In order to make an accurate prediction of damages, a detailed description of the track and the vehicles is required. This includes details of the masses and geometries of the vehicle and its suspension and the track design and irregularities.
Track data were obtained from track measurement vehicles running on the infrastructure, provided by the Swedish Transport Administration; the latter also provided the vehicle data.
Case study of the track section 629: Data
We explain the method and results by focusing on one of the track sections (track section 629 in Sweden). This route is dominated by freight traffic, which is 80% of the total traffic–km run. The length of the track is 5.1 km (from the track geometry data).
The track quality data were provided by the Swedish Transport Administration as noted. The data were obtained using a track geometry recording coach, which measures the distance, curvature, cross level, vertical irregularity, lateral irregularity, and gage. These track data were then used as input data for the simulation and includes:
Cross level versus distance along the track; Curvature versus distance along the track; Lateral irregularity versus distance along the track; Vertical irregularity versus distance along the track; Gage variation versus distance along the track.
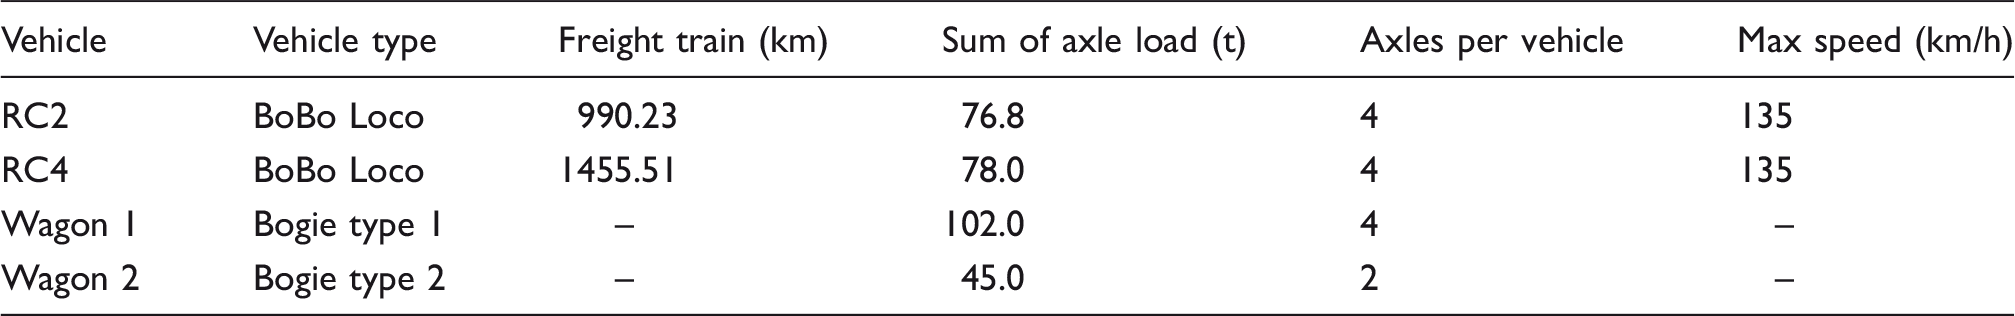
The details of the vehicles running on the section and their traffic volumes are shown in Table 2. This information was provided by the Swedish Transport Administration as noted and revealed the generic type of vehicles and their usage on the network. The vehicle models were described in terms of mass properties, geometry, axle load, unsprung mass, wheel radius, and suspension characteristics. Representative worn wheel profiles were selected from a library of measured profiles for each vehicle type. The Vampire simulation package uses the model description to generate equations of motion for the vehicle, which it then solves with the track input. Once the simulation is complete, outputs are available for the wheel–rail force vehicle motions and can be used to estimate the damage. It should be noted that there were some gaps in the precise details of the individual vehicle types, which meant that the data had to be supplemented with information from the EU-funded research project, INNOTRACK. (A link to the concluding technical report of this EU-funded project can be found at: http://publications.lib.chalmers.se/publication/129645. 11 ) The latter project provided information on typical freight and EMU vehicles running on the EU network.
Case study of the track section 629: Results
Results of different damage mechanisms.
Vehicle models for RC2 and RC4 locomotives were run on this track route and the results of the track settlement for each vehicle are shown as a percentage distribution in Figure 3. As RC4 makes a larger proportion of traffic on this route, it causes more settlement as seen in Figure 3. From the data available, it was estimated that in a fixed period of time, 192 RC2 locos are operational on this track section, whereas in this same period 282 RC4 locos carry freight on this route.
Percentage distribution of settlement by actual damage by locomotives.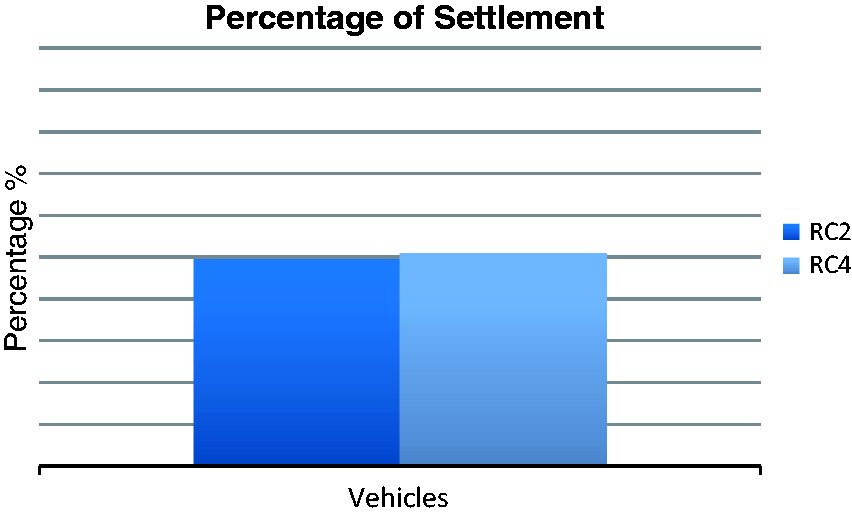
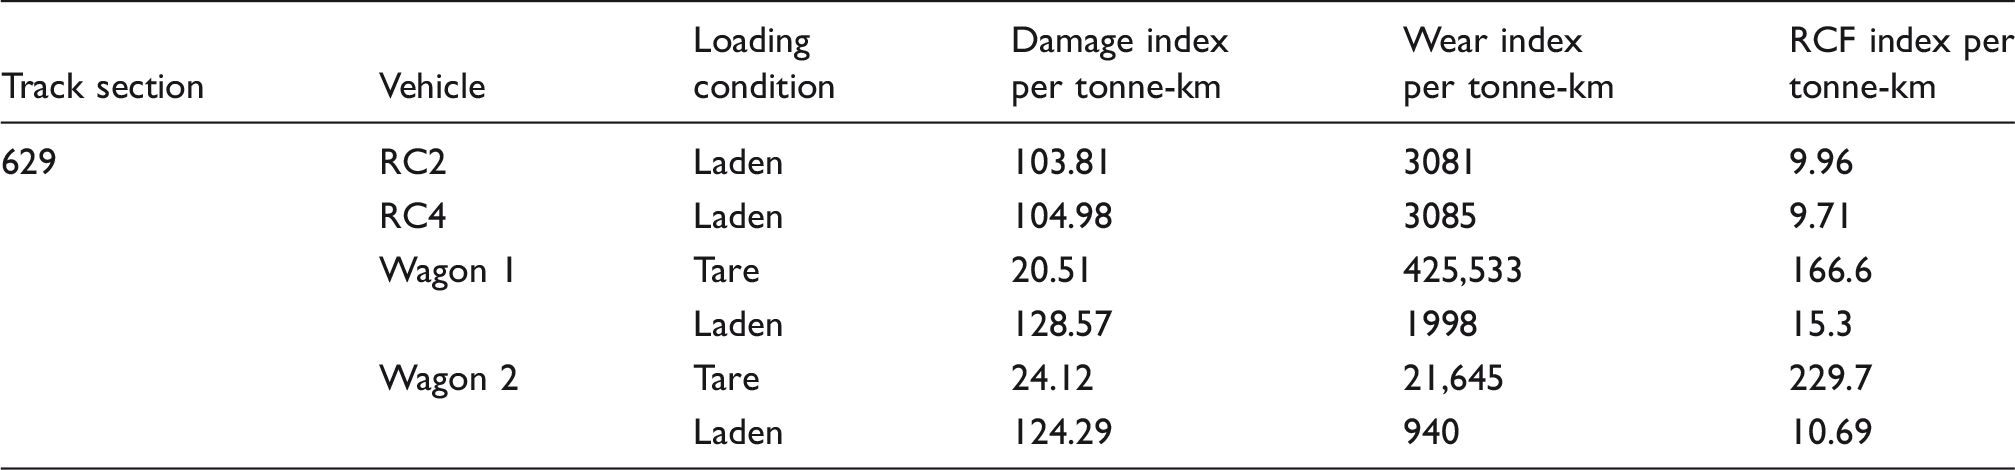
It should be noted that, as described in more detail in the description of the stage 2 modeling, since the vehicles that we have modeled do not quite represent 100% of the traffic, there is a need to scale up the damage measures in the above table 3 so that they represent an estimate of the total damage on the section in a given year.
Figure 4 represents the percentage of settlement per tonne of axle load for the locos. RC4 is a later version of the RC2 loco and is slightly less damaging to the rail compared to RC2 even though RC2 has a lower axle load.
Percentage distribution of settlement per tonne of axle load by locomotives.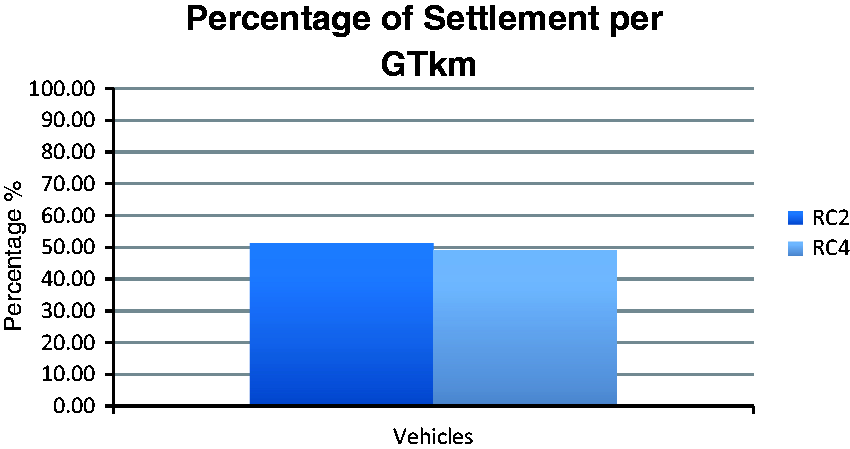
A comparison of the damage caused by two kinds of wagons was also carried out. Figures 5 and 6 show the settlement damage by the different wagons operating on this section of track. As can be expected, a laden wagon causes more settlement compared to a tare wagon. There is no significant difference in the percentage of damage per GTkm caused by the wagons with different types of bogies.
Percentage distribution of settlement by actual damage by wagons. Percentage distribution of settlement per ton of axle load by wagons.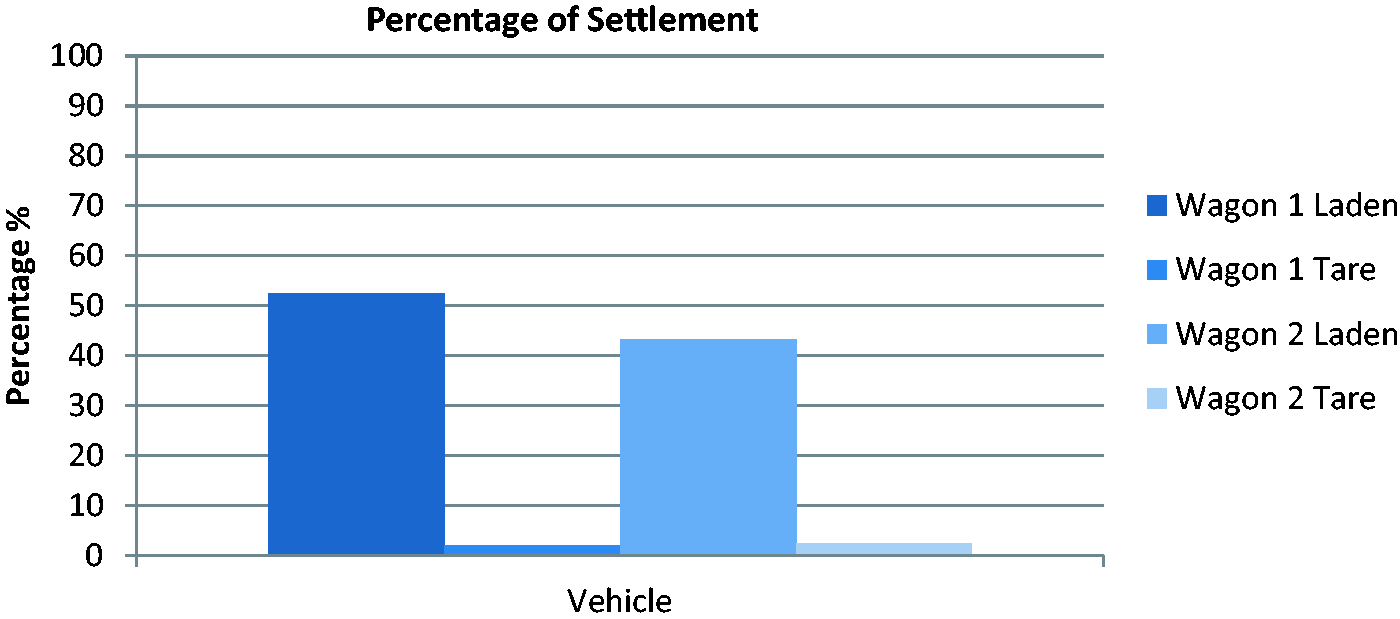
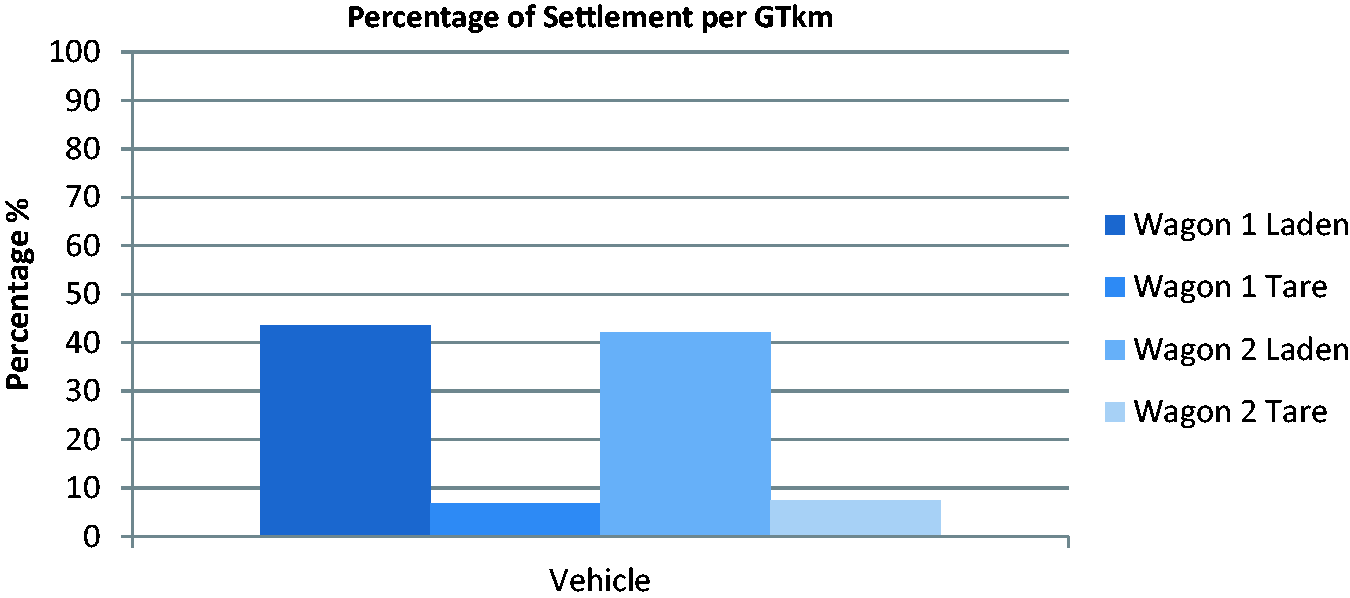
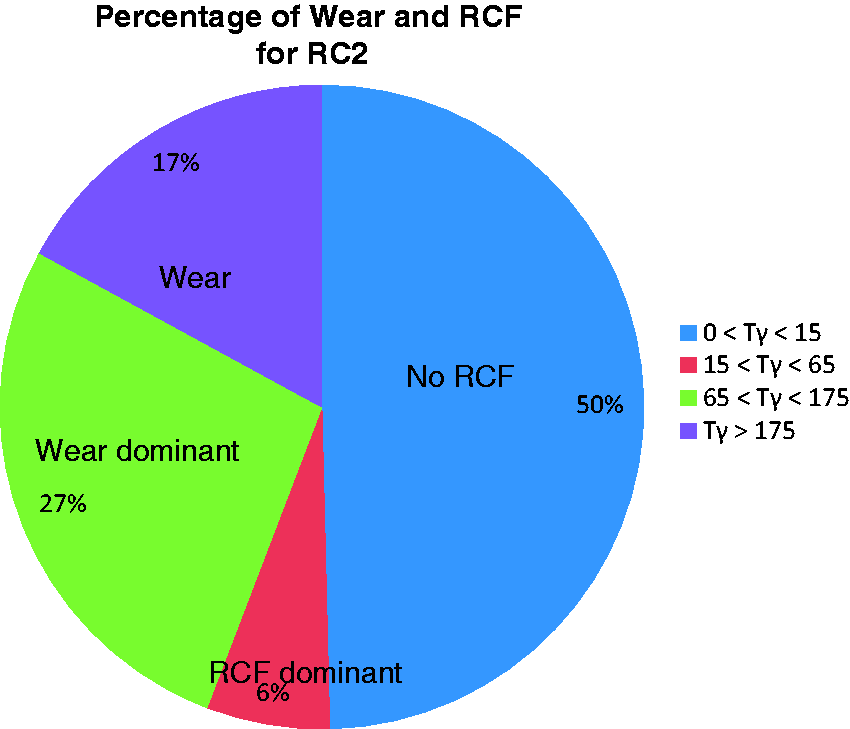
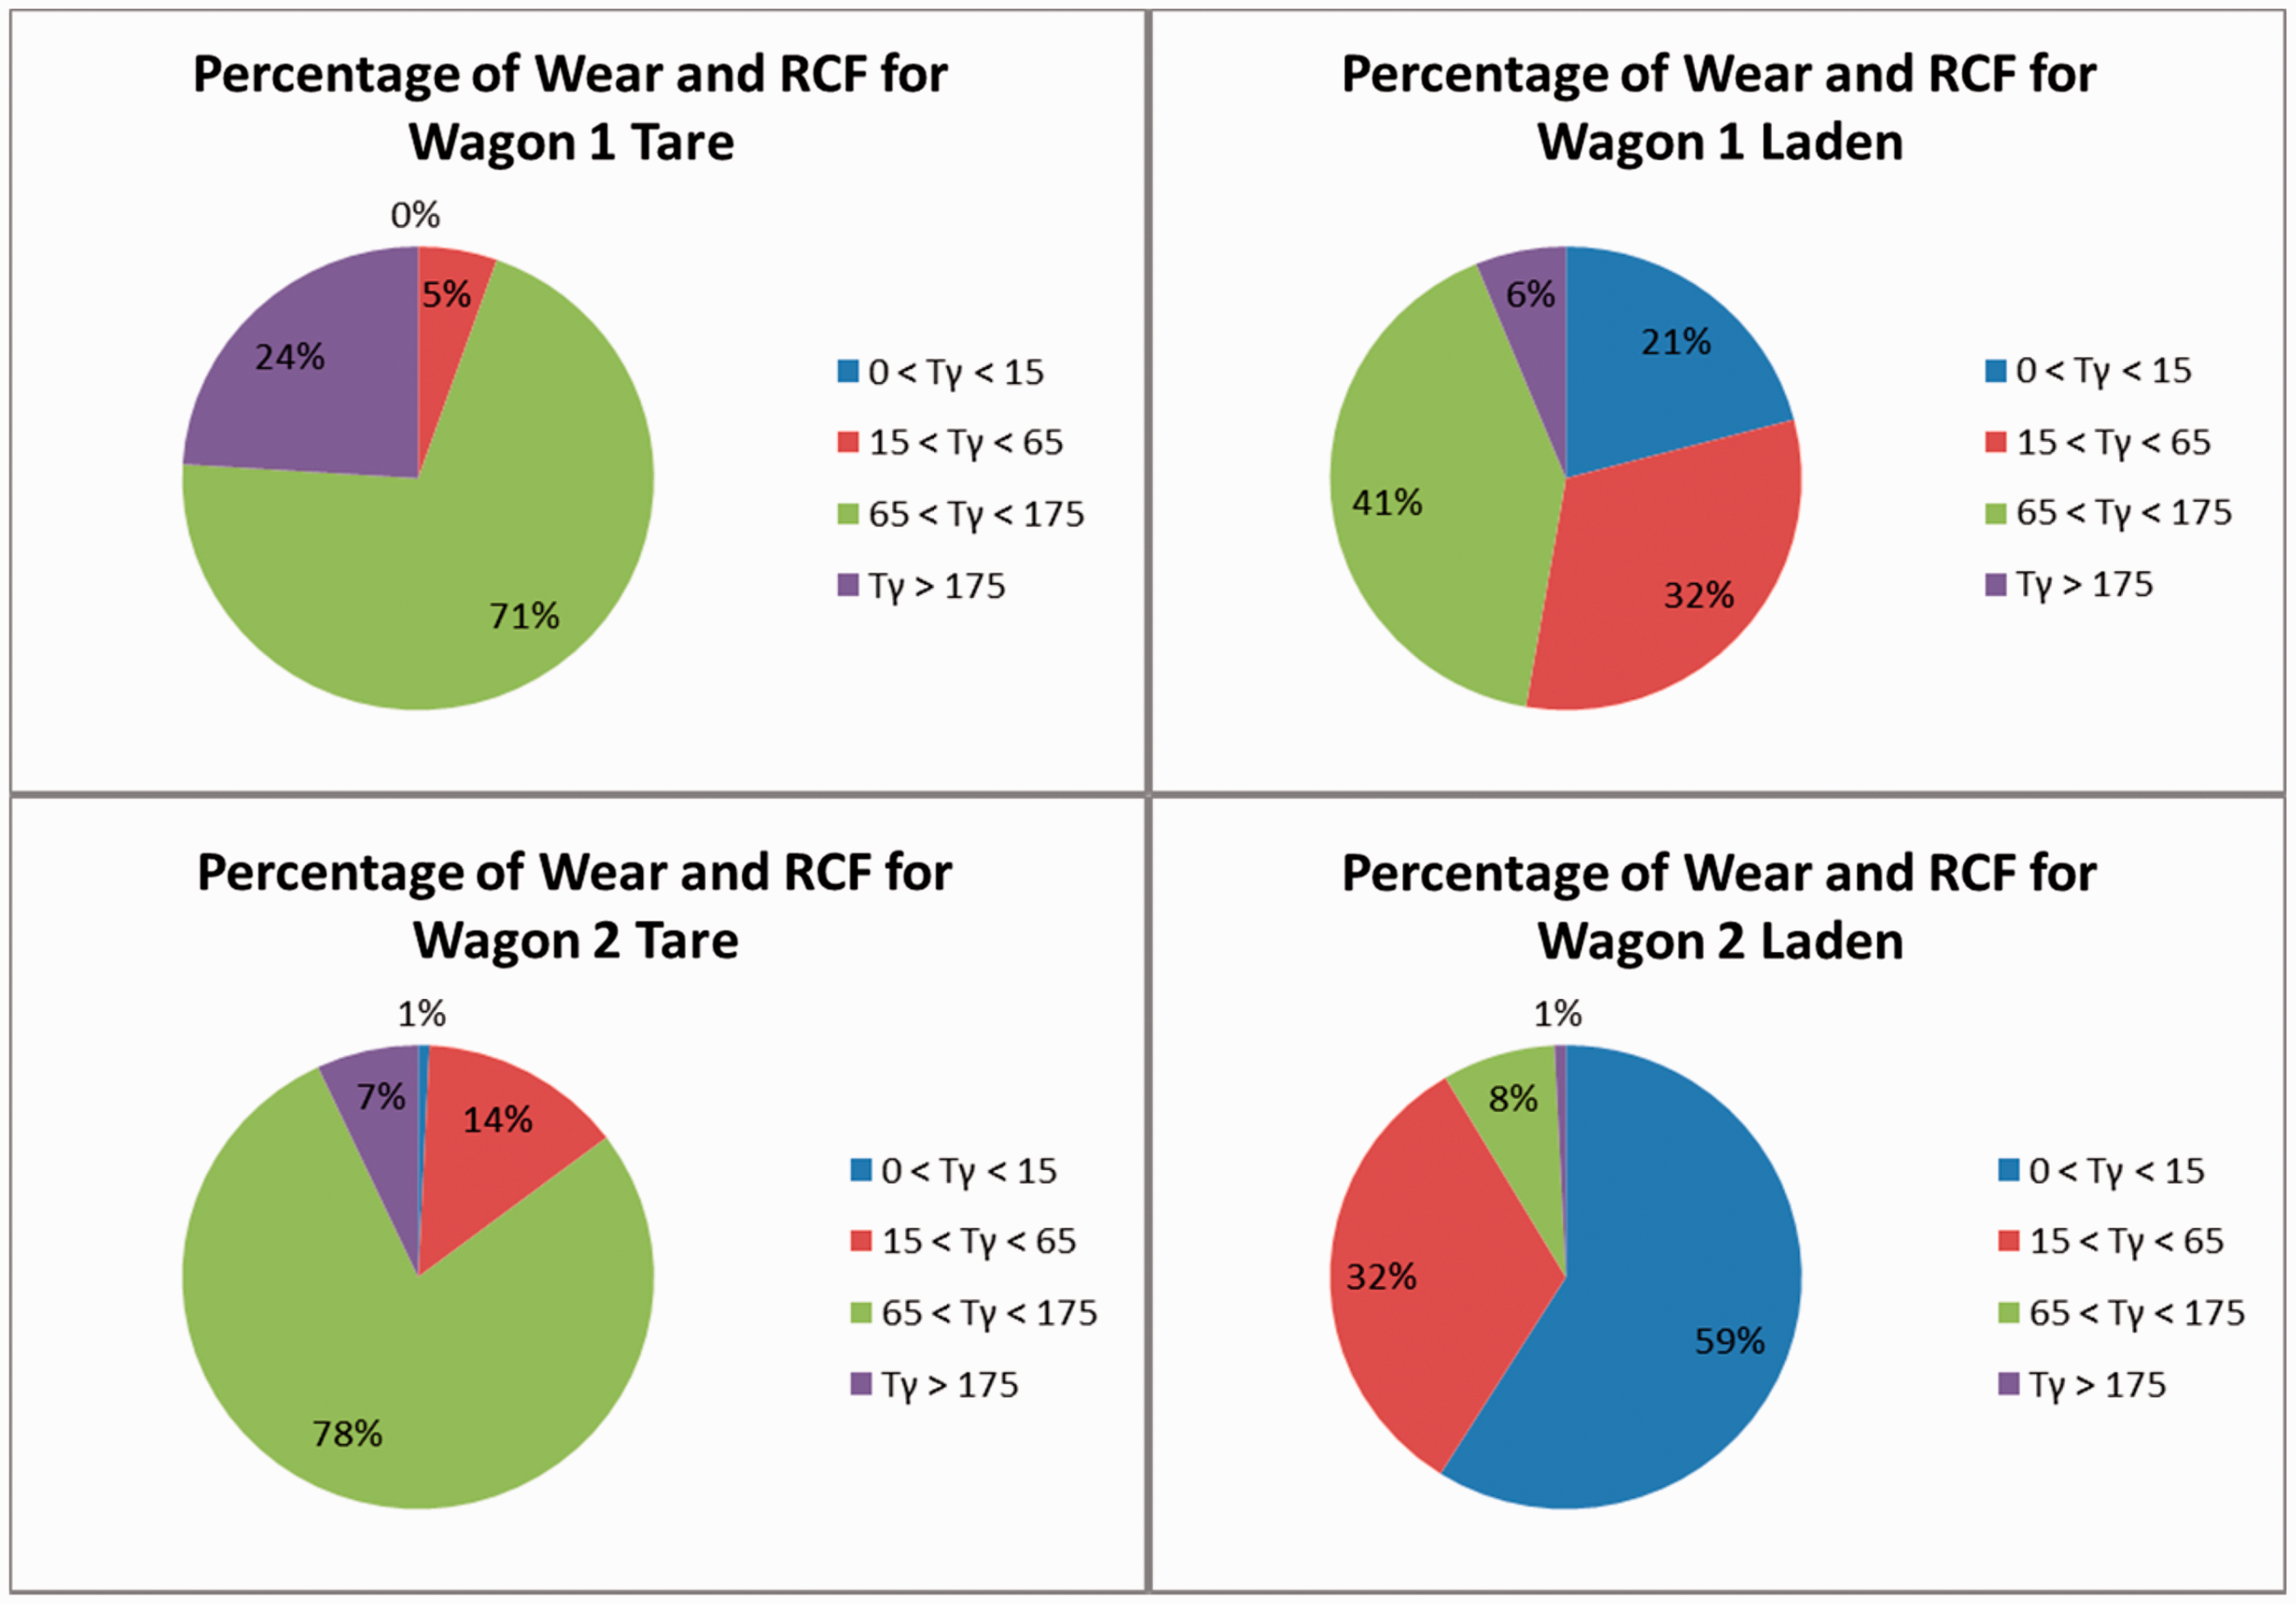
Figure 7 shows the distribution of the Tgamma and RCF indices along the track. Negative values of RCF index imply a large amount of wear. This can be seen in the section of track between 4500 m and 5000 m where Tgamma values are high (meaning greater wear). Figure 8 shows the percentage of track where high wear, RCF, or a combination of both occurs. Both RC2 and RC4 cause similar levels of wear and RCF damage. Figure 9 shows the percentage distribution of wear and RCF damage by the two-axle and the four-axle wagons.
Tgamma and RCF index for section 629. Percentage distribution of wear and RCF by RC2. Percentage distribution of wear and RCF by wagons.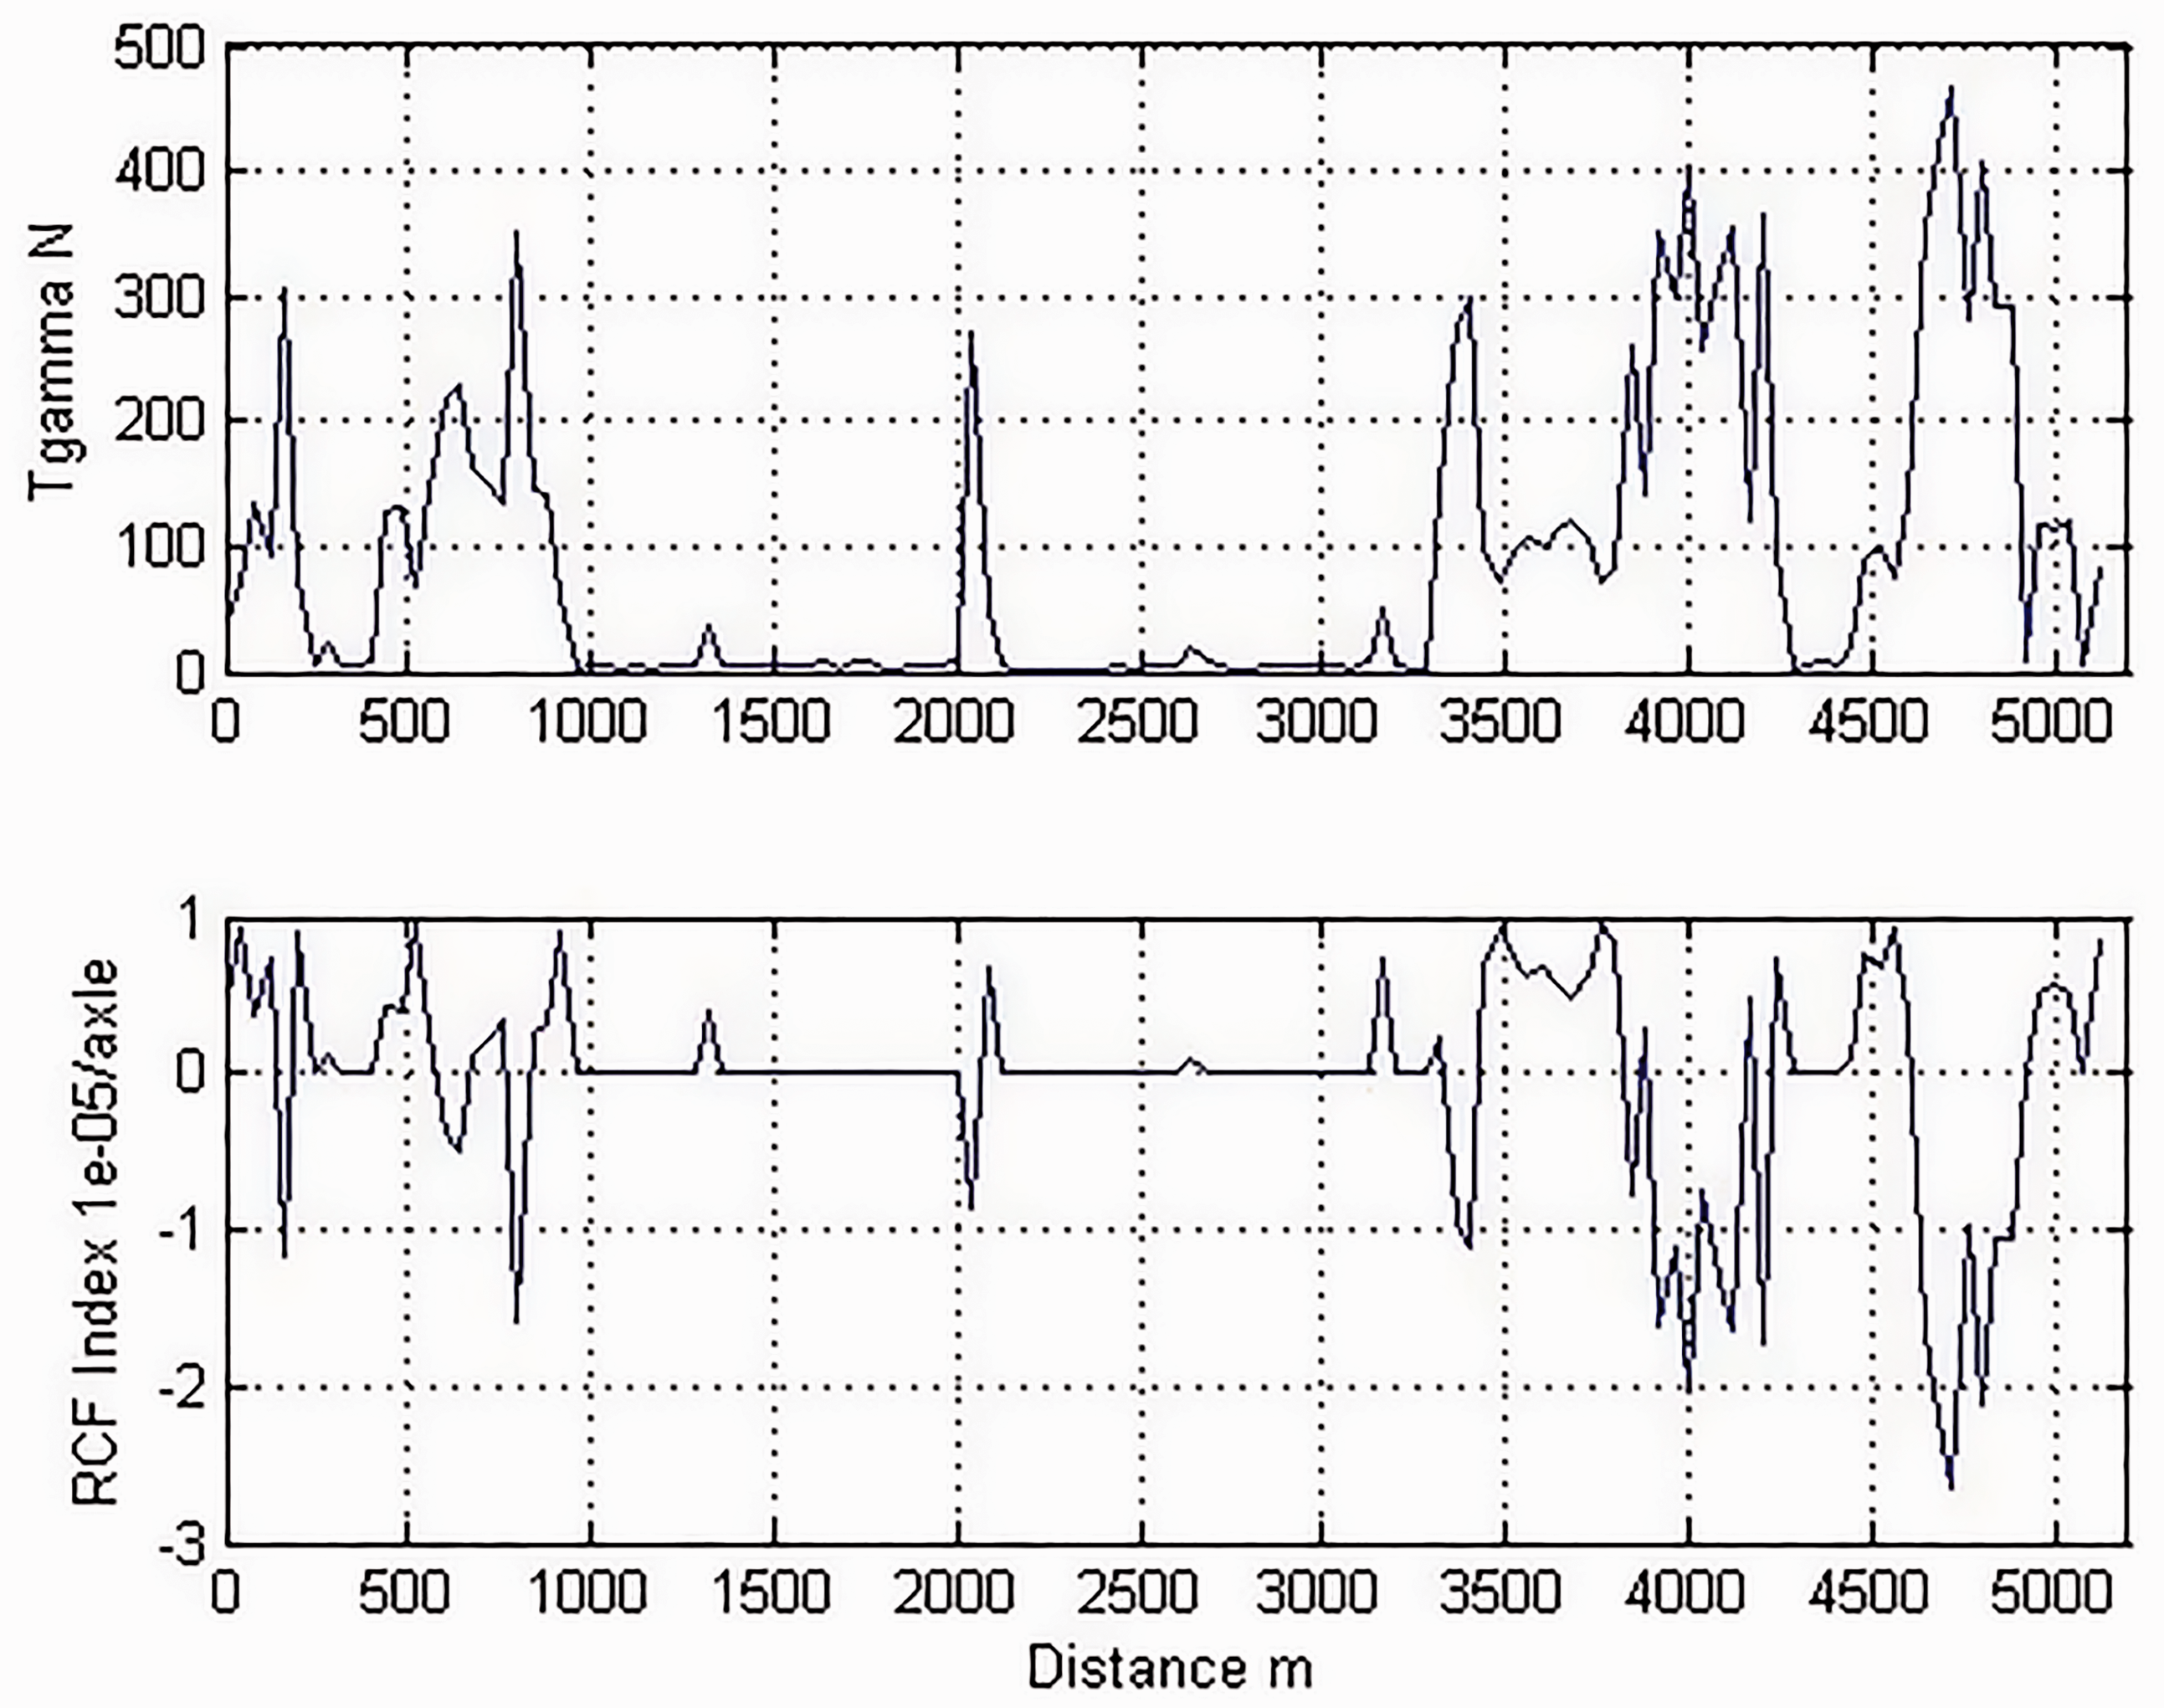
Case study of track section 629: Summary
From the simulations carried out on track section 629, it is seen that the locomotives RC2 and RC4 cause a similar level of track settlement, rail wear, and rail RCF damage per gross tonne-km. The two wagons considered lead to similar amount of track settlement. Track settlement, however, depends on the payload of these wagons. A tare wagon is less damaging than a laden wagon as the vertical forces at the wheelset are lower. Rail wear and rail RCF damages are, however, different for both wagons as they have dissimilar bogie configuration. Rail wear is the dominant form of damage for wagon 1 in tare and laden conditions. Propensity for rail RCF is higher for a laden wagon when compared to a tare wagon.
Whilst this section only shows the results for one section, the same simulations were carried out for 45 track sections as noted above and the resulting damage measures are used in the analysis of the second stage. The second stage, described in the subsequent section, explores the relationship between the damage and cost, with the aim of better understanding the relative cost of the different damage mechanisms and in turn the types of vehicles.
Econometric modeling: Stage 2 methodology
Introduction
As explained in the overview of the methodology in the earlier section, the first stage engineering simulation model produces damage estimates, which initially were reported for five track sections. 12 It has now been possible to carry out the engineering simulations for 45 sections. In stage 2 of the methodology, the objective is to relate the maintenance (and also renewal) costs to these damage estimates. In carrying out this exercise, it is important to control for factors such as the length of section and the characteristics of the section, as these could affect the cost of the rectifying damage, quite apart from the damage itself. This control is akin to including the track length and traffic volumes, alongside the track characteristic variables in the rail infrastructure marginal cost studies in the wider literature. 7 In terms of a priori expectations, there may be scale economies which, for a given level of damage, reduce the cost of rectification; likewise, the cost for rectification may be different depending on the track standards required for different levels of the permitted linespeed.
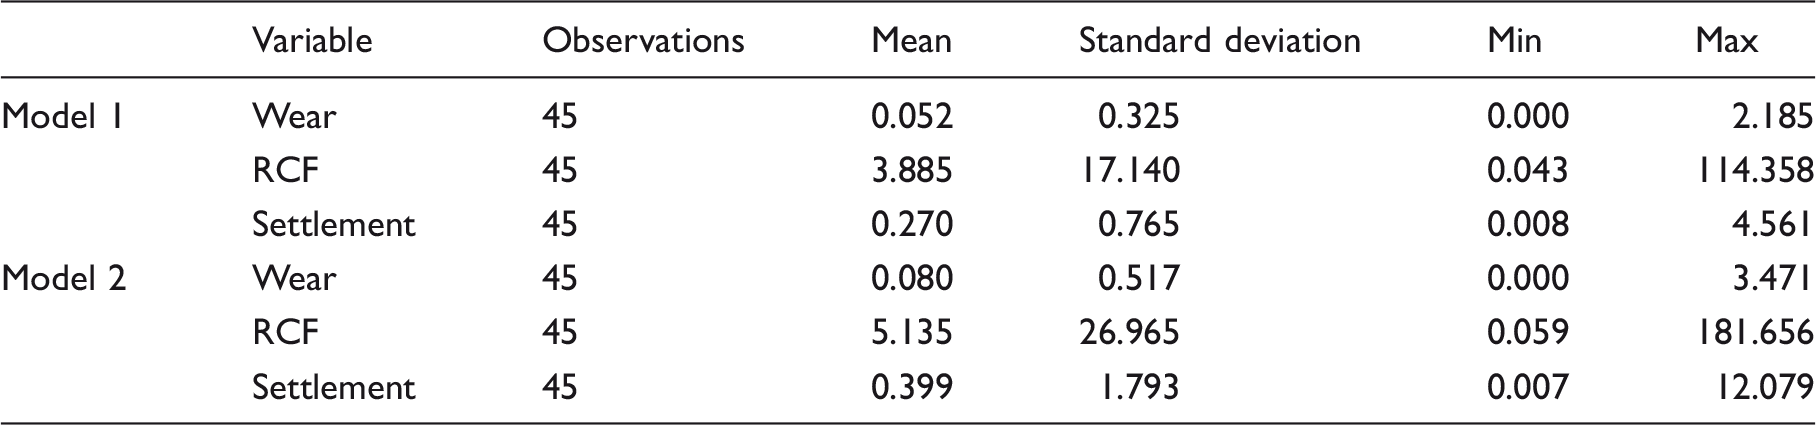
Descriptive statistics
Descriptive statistics.
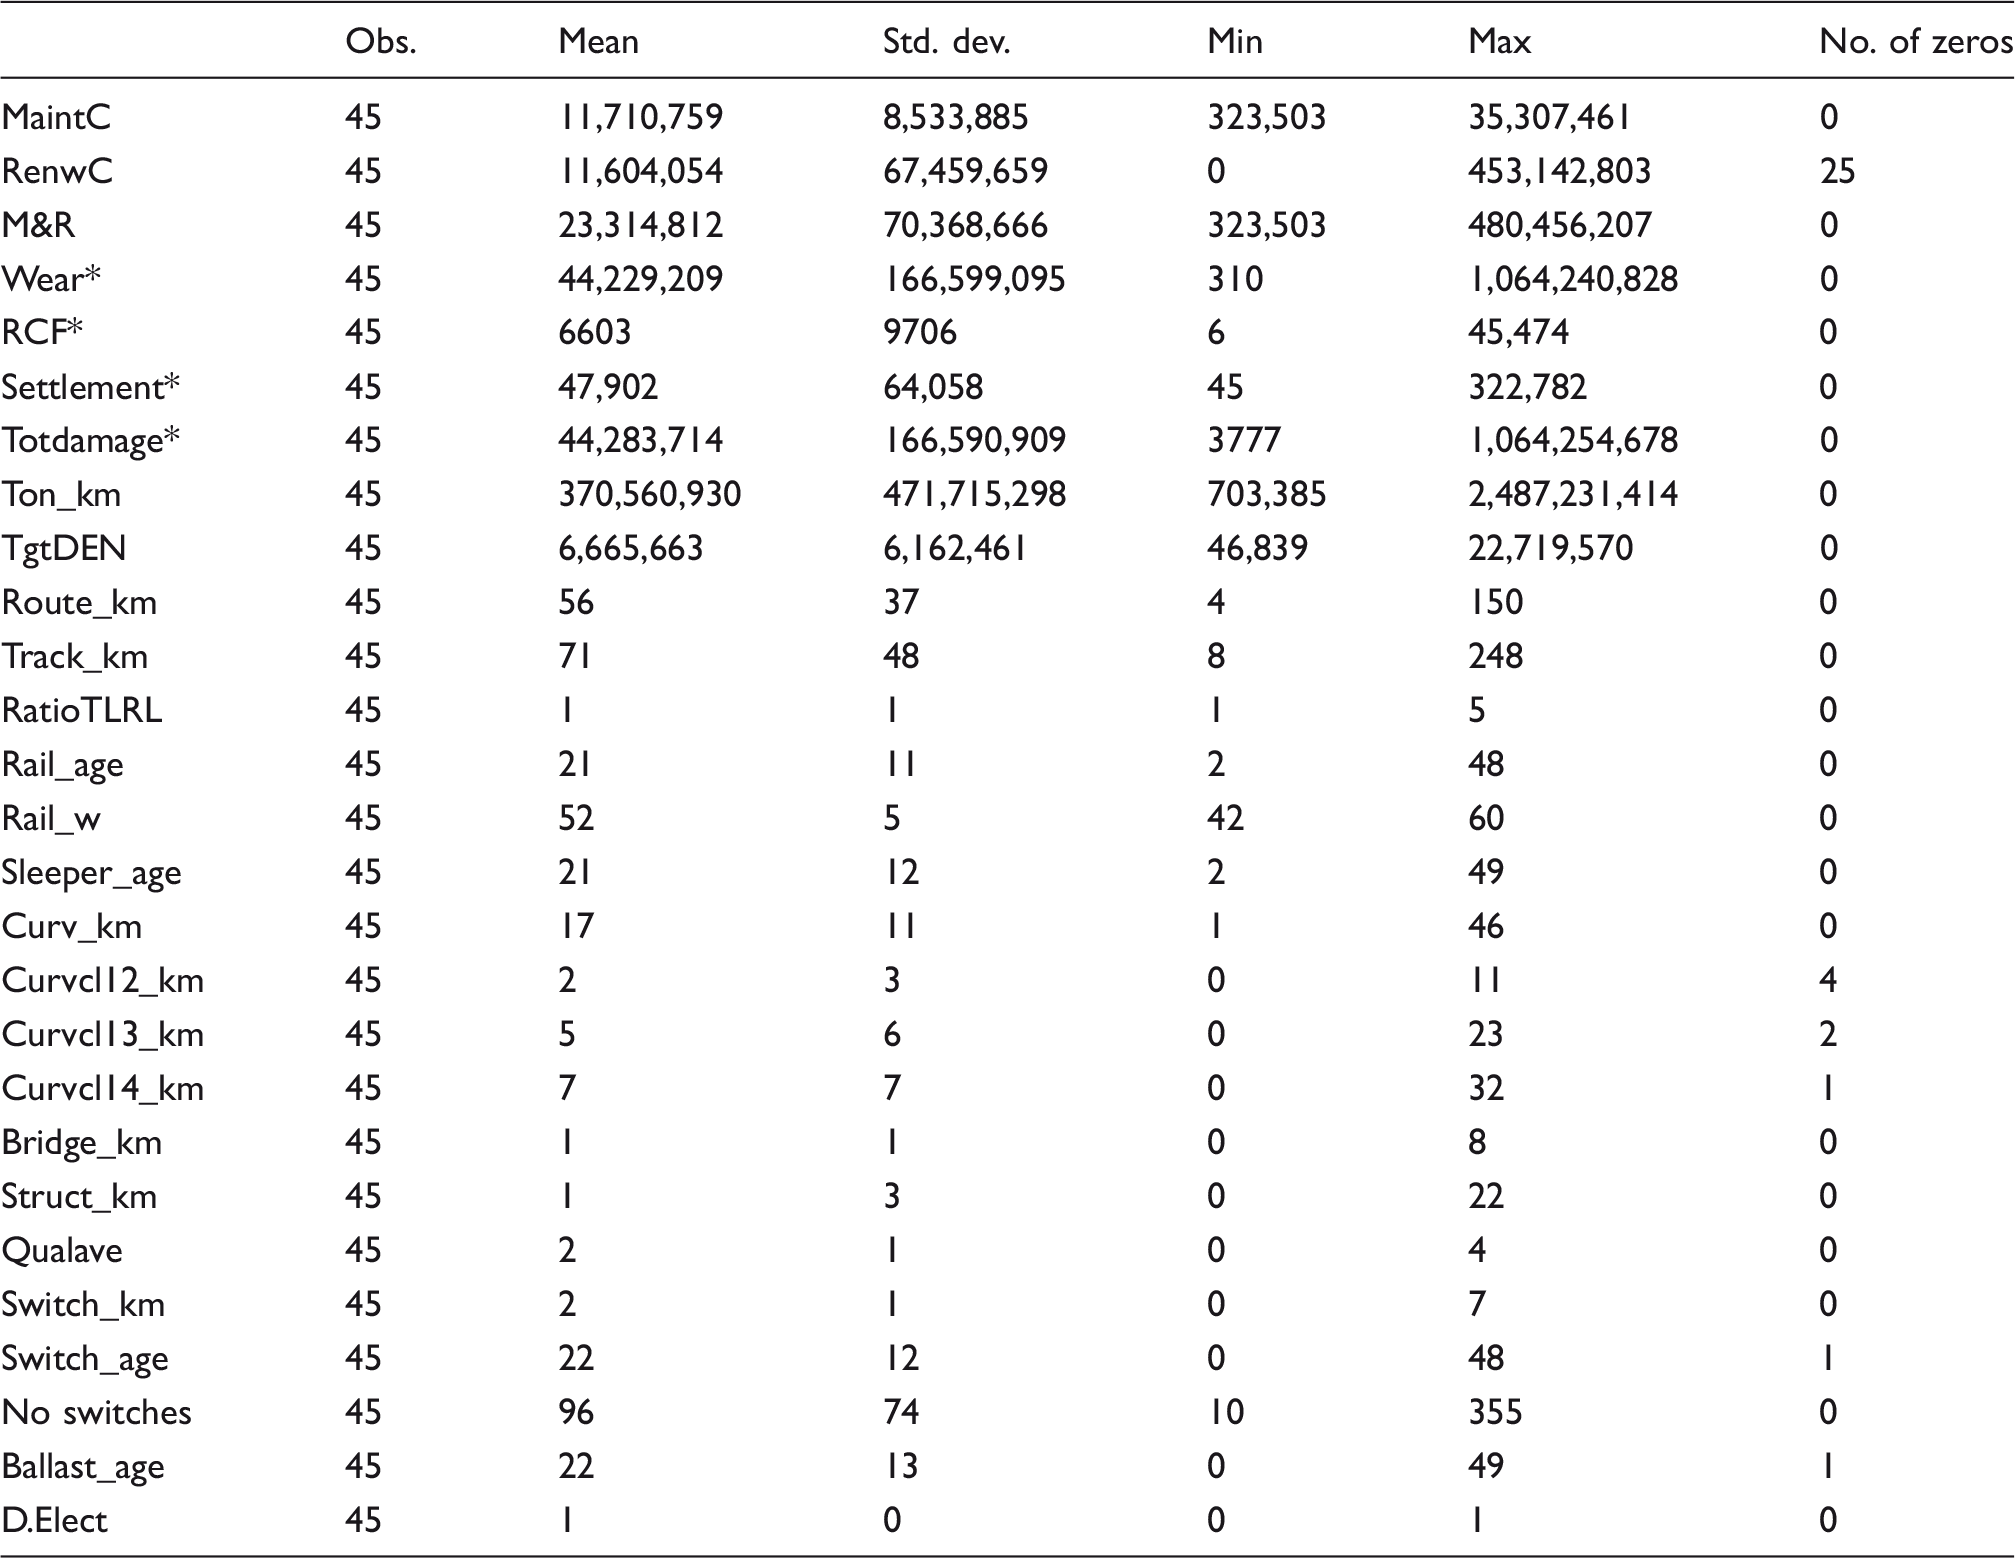
MaintC: maintenance costs, SEK (Swedish Krona); RenwC: renewal costs, SEK; M&R: maintenance + renewal costs, SEK; Wear*: wear index/1,000,000; RCF*: RCF index/1,000,000; Settlement*: settlement index/1,000,000; Totdam*: (wear index + RCF index + damage index)/1,000,000; Ton_km: tonne-km; TgtDEN: tonne-km/route-km; Route_km: route-km; Track_km: track-km; RatioTLRL: track-km/route-km; Rail_age: average rail age; Rail_w: average rail weight kg; Sleeper_age: average sleeper age; Curv_km: track curvature km; Curvcl12_km: track curvature with absolute value of radius
Scaling up assumptions
The simulation runs do not include all the different types of vehicles running on each track section. Hence, we have an additional share of tonne-km from other vehicles to consider when calculating the total damage on each track section. The damage caused by these vehicles is assumed to be proportionate to the damage caused by the types of vehicles in the simulation runs. We therefore calculate the share of tonne-km for each vehicle type in the simulation and use their respective damage measure to estimate the damage caused by vehicles not included in the simulation runs.
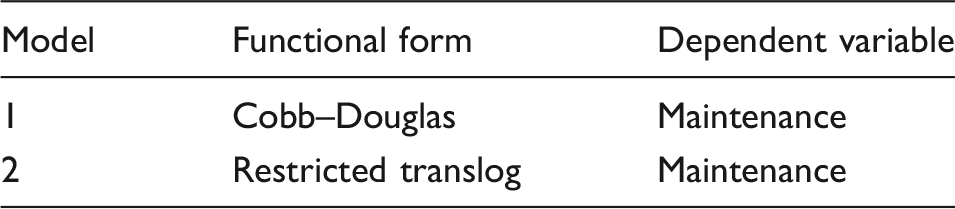
Model specification and estimation results
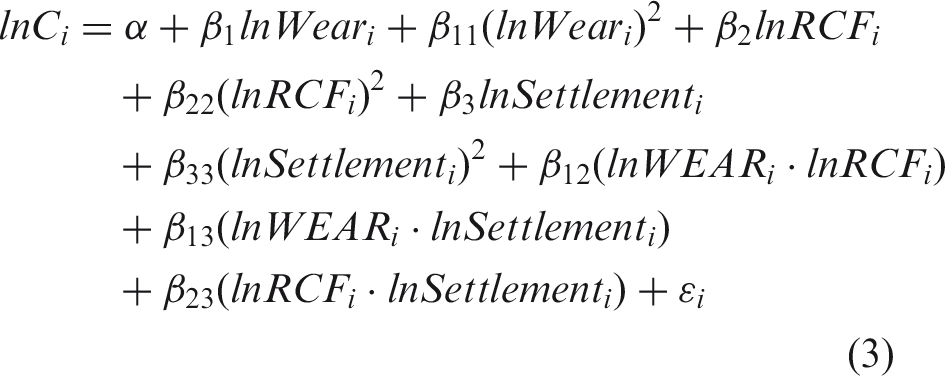
The literature contains a range of functional forms that may be estimated. The simplest model is the Cobb–Douglas model (this is a double log or log-linear model). The Cobb–Douglas model, however, is quite restrictive and the cost modeling literature typically favors the more general translog functional form (this model is a logarithmic model but includes squared and interaction terms; see equation (3)). The translog offers greater flexibility with respect to the relationship between the cost and the explanatory variables, which may offer more intuitive economic interpretations. See, e.g. Coelli et al. 13 for more details on the functional forms used in the estimation of the cost function.
Models.
In model 1, we only include the damage measures (wear, RCF, and settlement) as explanatory variables. In line with the literature, we start with a translog model
We then test the Cobb–Douglas restrictions (the Cobb–Douglas model does not have the squared or interaction terms)


The results of the estimation, model 1.
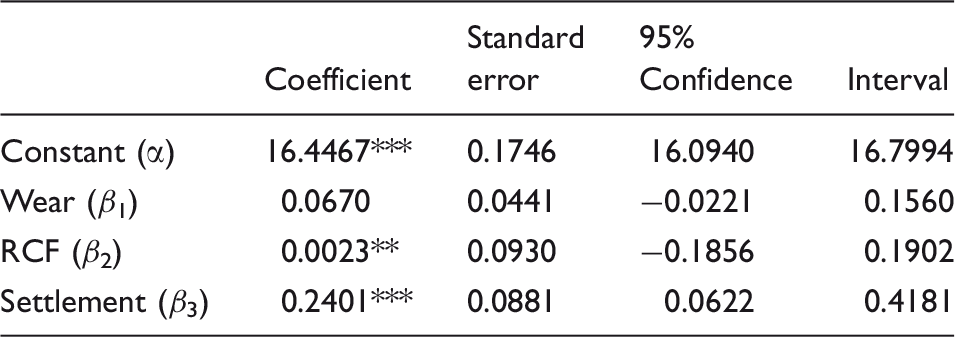
R2 = 0.3787, Adjusted R2 = 0.3333, Mean VIF = 2.08.
Statistically significant at the 1% level.
Statistically significant at the 5% level.
RCF: rolling contact fatigue.
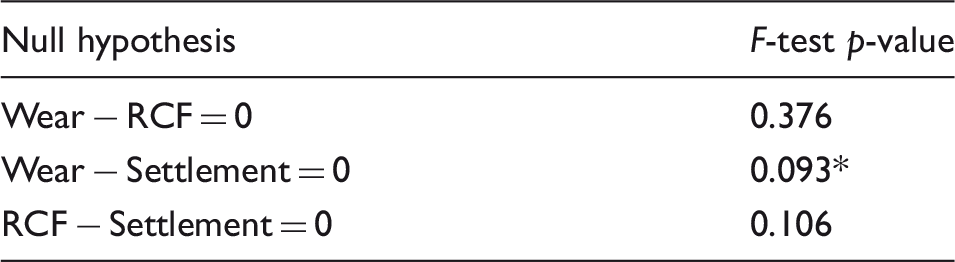
F-tests for difference between damage coefficients, model 1.
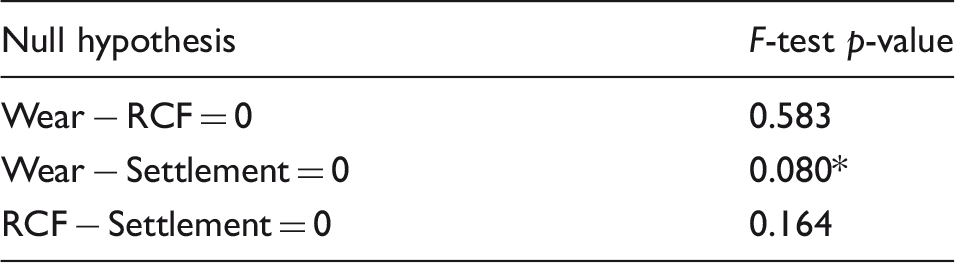
Statistically significant at the 10% level.
RCF: rolling contact fatigue.
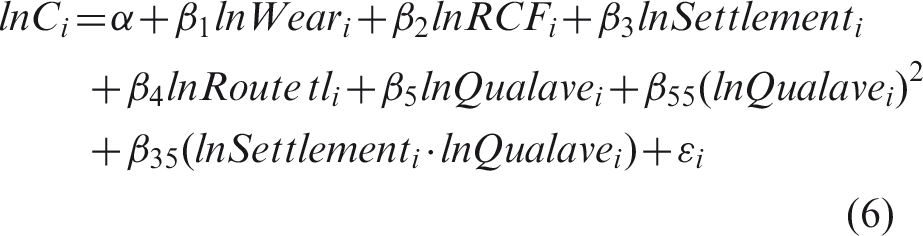
In model 2, we include route length (Route tl) and average quality class (Qualave) as control variables. We start with a full translog model and test the Cobb–Douglas restrictions.
Most of the second-order terms were insignificant and were dropped from the model. The parameter estimate for the interaction variable between RCF and route length is significant and negative, as is the first-order coefficient for RCF. This suggests that an increasing RCF interacting with the route length decreases the maintenance costs, which seems implausible. We therefore exclude this variable, and the first-order coefficient for RCF is then no longer statistically significant (though remains negative). We also drop the interaction variable between Qualave and wear on the basis that the first-order coefficient for Qualave is not significant (p = 0.79). This results in a first-order coefficient for Qualave that is nearly significant at the 10% level (p = 0.112). The final model that was estimated is as follows
Estimation results, model 2.
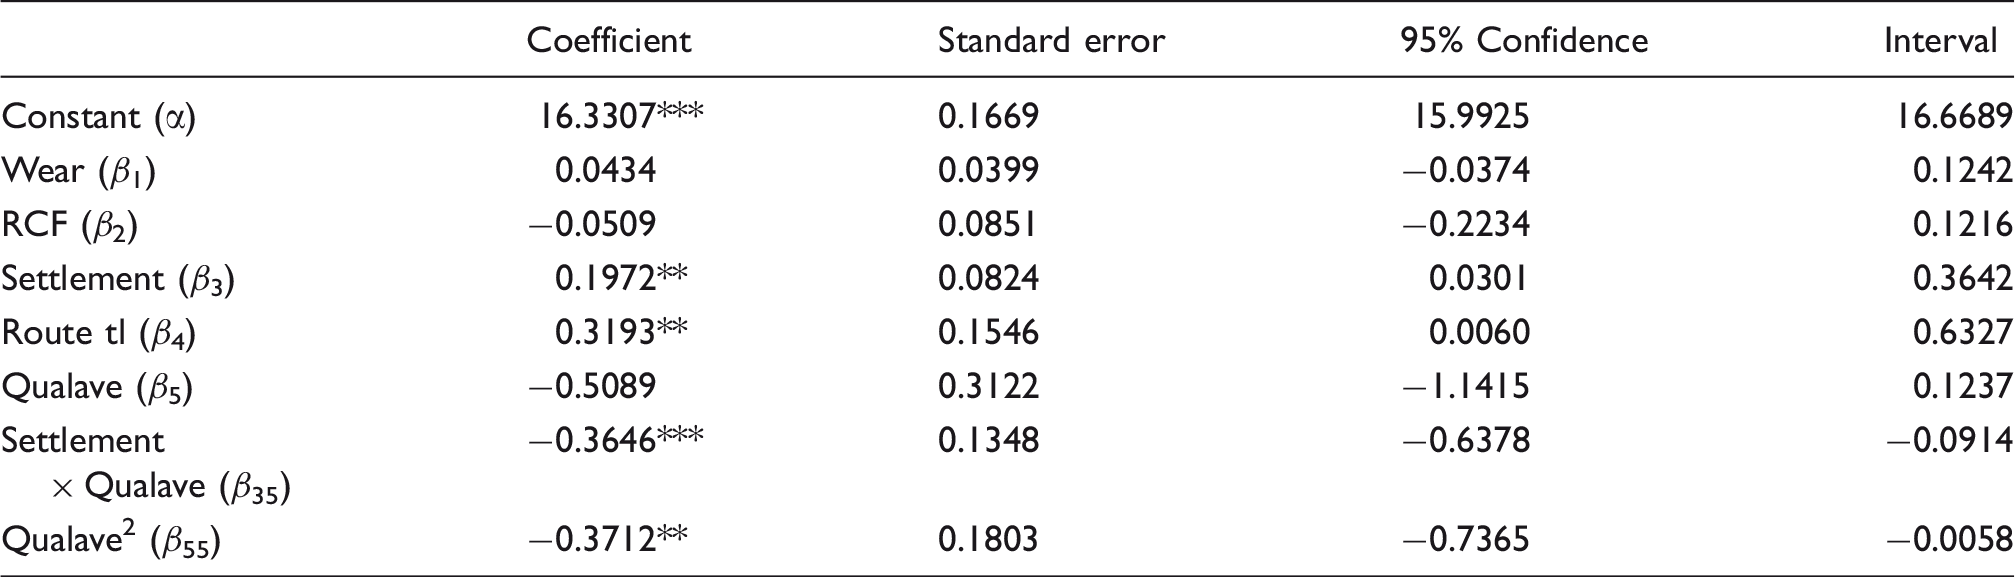
Model 2: R2 = 0.5560, adjusted R2 = 0.4720, mean VIF = 3.18.
Statistically significant at the 1% level.
Statistically significant at the 5% level.
RCF: rolling contact fatigue.
F-tests for difference between damage coefficients, model 2.
Statistically significant at the 10% level.
RCF: rolling contact fatigue.
The conclusion from models 1 and 2 is that it is important to control for the size of the section and also the characteristics of the infrastructure (e.g. the quality class variable, which principally reflects the permitted linespeed on the section). As noted earlier, there may be scale economies which, for a given level of damage, reduce the cost of rectification; likewise, the rectification costs may be different depending on the track standards required for different levels of the permitted linespeed. The settlement elasticity is the largest in absolute terms and is statistically significant at the 1% and 5% levels in models 1 and 2, respectively. In model 1, the wear coefficient is close to being significant at the 10% level, but the RCF coefficient is highly insignificant. In model 2, both the wear and RCF coefficients are highly insignificant and the RCF coefficient is a wrong sign (though statistically insignificant as noted). The coefficient on settlement is fairly stable between the two models.
Since the model includes only maintenance costs, it is not entirely surprising that only settlement damage is significant in the model, since tamping is the remediation action for settlement (and this cost is included in maintenance). By contrast, remediation action for wear and RCF includes rail replacement (which is a renewal cost), though grinding and re-profiling may also occur, which is included in the maintenance costs. The problem of not being able to obtain statistically significant estimates for all the damage types may also result from only having 45 observations.
Whilst in principle the renewal costs can also be included in this methodology, in practice, as we are working at the track section level, many of the sections have zero renewal costs. We therefore do not report a model with the dependent variable constructed based on the sum of maintenance and renewal costs. (Note: We did estimate such a model and it produced results very similar to the maintenance-only model. A corner solution approach, as set out in Andersson et al. 8 would be more appropriate for renewals at section level, and such an approach is beyond the scope of the current study.)
It is worth to note the overall cost variability with respect to the damage resulting from the models run. At the sample mean, the sum of the elasticities on the three damage mechanisms is approximately in the range of 20–30% (models 1 and 2). The CATRIN project 7 found a range of (mean) maintenance elasticities with respect to about 20% to 35% of traffic . Whilst the elasticities in this paper are elasticities with respect to the damage and the elasticities in the CATRIN project are elasticities with respect to the traffic, clearly, the damage results from traffic running on the network. Therefore, in terms of the proportion of cost variable with traffic/usage, our results are in line with the previous estimates in the literature.
Computation of relative marginal costs
The marginal cost is calculated by multiplying the average cost for each track section by the cost elasticity for that section


Since the elasticities in model 1 were all positive, we use model 1 to draw conclusions. The results suggest that settlement is the most expensive damage mechanism, with a marginal cost that is just over 7 times that of the RCF and 21 times that of the wear. The RCF damage is in turn three times more costlier, per unit of damage, than wear. As noted earlier, in interpreting these findings it is important to remember that the estimation is based on 45 sections and not all the parameter estimates were statistically significant. Further, as noted, the dependent variable only includes maintenance. If renewal had been included in the model, thus permitting a more complete comparison of relative costs, it is likely that the relative damage costs would be very different.
It is possible, in principle, to cross-validate these results against other estimates. For example, rough estimates of different deterioration mechanisms’ share of track maintenance and track renewal costs were used in the bottom-up approach to estimate the costs for different vehicle characteristics in Öberg et al. 15 The estimates were given by the Swedish Rail Administration and relate to the whole railway network. The Swedish Rail Administration states that 25% of the costs are attributed to the deterioration of the track settlement, 40% to wear + RCF, and 35% to deterioration of other components. These are not directly comparable to our study, which focuses on maintenance only. Since our intention in this work is merely to illustrate the approach, we do not take this comparison further. In subsequent work, we would seek to expand the sample size and then make a fuller comparison of this method with alternative methods.
This is, to our knowledge, the first time that the relative cost of damage mechanisms has been estimated in this way, based on the engineering simulations combined with the actual cost data. As noted earlier, whilst engineering models are adept at estimating damage, the challenge is to convert damage into cost. The traditional “bottom-up” approaches face many problems, since an assessment needs to be made of the remediation activity that should be done, and also its timing, and then the unit cost of these activities. Depending on the nature of the network, and the combination of the types of damage, these estimates could vary widely. The advantage of our top-down approach is that it uses the actual cost data to derive the relative marginal costs.
Average costs, ÖRE (1 ÖRE = 1 SEK/100).
RCF: rolling contact fatigue.
Average marginal costs, ÖRE (1 ÖRE = 1 SEK/100).
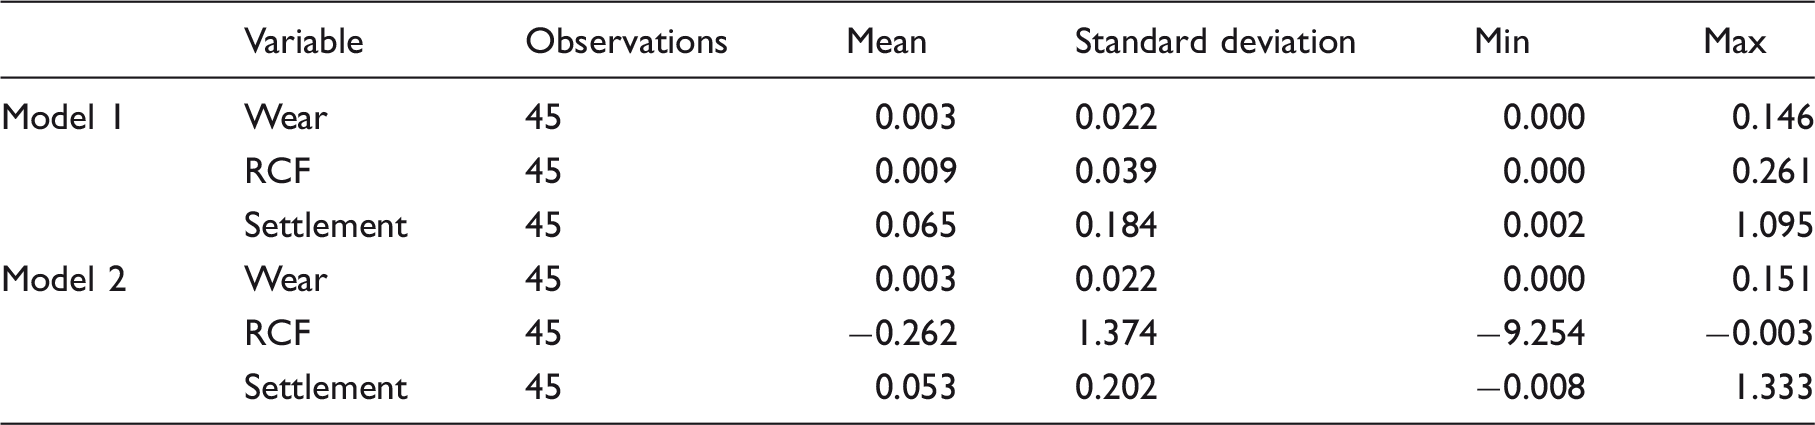
Illustration of the outputs of the methodology.
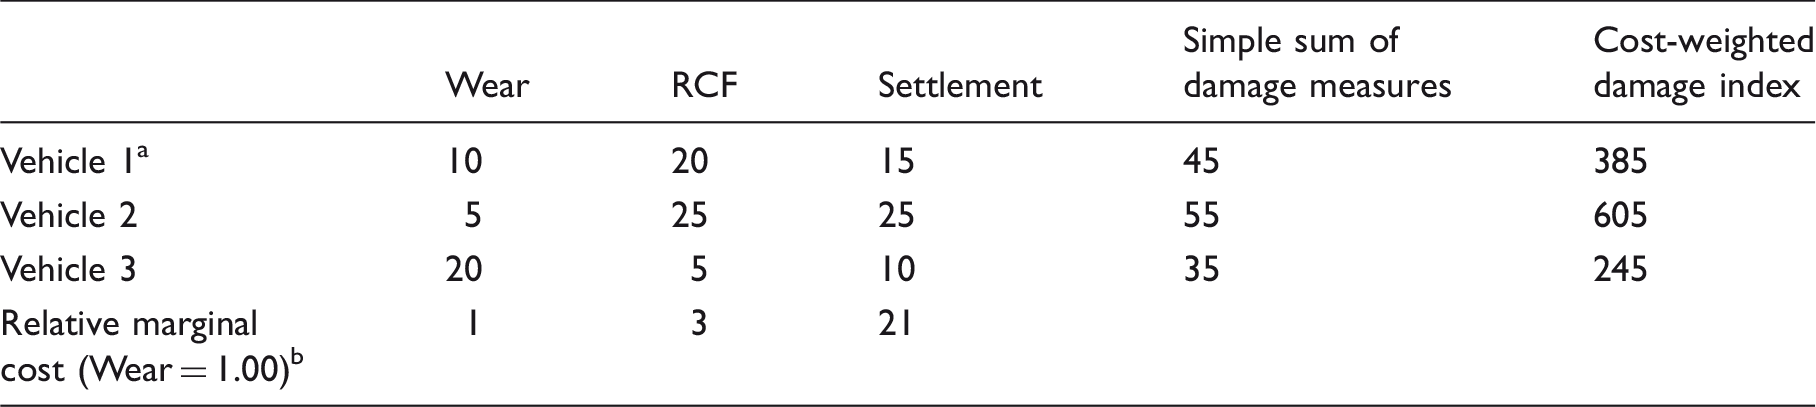
The damage numbers are simply created for the purpose of the illustration for three types of hypothetical vehicles.
This is based on the results of model 1, with the marginal cost of wear normalized to unity.
The different vehicles in Table 12 produce different amounts of the different types of damage mechanisms; some resulting in more of one type of damage and less of other types. This situation therefore creates a problem as it is therefore not clear which vehicle results in the highest incremental cost which, as noted, is important for the charging purposes. One might be able to produce a summary measure indicating the total level of damage (the fourth column in the table). Since the units are not directly comparable, this measure is not terribly meaningful. The final column of the table shows that, by using the relative marginal costs coming out of model 1 (reported above), we can construct a weighted damage measure, weighted according to the relative marginal cost. Since settlement is the most damaging mechanism, according to model 1, vehicle 2 has, by far, the highest cost weighted damage index, and thus would attract a higher charge for the track access. Of course, as noted, we are not claiming that this is a definitive result, for the reasons set out earlier, but putting this forward to demonstrate the potential power of the approach.
Conclusions
This paper fills an important gap in the literature concerning the translation of damage measures into measures of the cost of damage remediation. It does so by combining engineering simulation models (stage 1) with top-down econometric methods linking cost and damage (stage 2). This is the first time a direct relationship between the actual cost and track damage has been estimated econometrically. The approach has been implemented using the track section data provided by the Swedish Transport Administration. The combination of these two approaches provides a new methodology for comparing the relative cost of damage caused by different vehicles on the rail infrastructure, which in turn can be used to inform track access charges differentiated by the type of vehicles.
The advantage of this two-stage method over its single-stage counterparts are as follows. As compared to the bottom-up engineering approaches, our two-stage method is grounded in the engineering simulation models in the first stage, but uses actual costs on track sections to estimate the relative cost of the different damage mechanisms in the second stage. The current bottom-up engineering methods rely on assumptions about the remedial work required, and the unit costs of those activities, to convert damage measures into costs. These assumptions can be potentially hard to justify and are highly uncertain, which is a significant drawback. As compared to the single-stage econometric approaches, our approach permits a more precise estimation of the relationship between costs and the damage caused by different types of vehicles. Existing econometric approaches often struggle to obtain sensible relationships between costs and different types of traffic.
We consider that our research has demonstrated the feasibility of the approach. We find, as expected, that it is possible and relatively straightforward to model the damage resulting from running vehicles on the network at section level. We have further shown that it is possible to produce summary, section-level damage measures for each of the three damage mechanisms (settlement, wear, and RCF), which can be taken forward to the second stage. Whilst the time taken to undertake the engineering simulations is not trivial, it is also not prohibitive.
The econometric results indicate that it is possible to obtain sensible relationships between cost and the different damage mechanisms; though the statistical significance of some of the findings has been limited in this case by the relatively small sample size (45 sections). Bringing together then, information on damage and the relative cost of different damage mechanisms, is potentially a powerful means of obtaining cost information that can be used to produce vehicle-differentiated track access charges. In turn, more cost-reflective access charges should incentivize the development and use of more track-friendly vehicles. Such information is also highly valuable to the industry and policy makers as it will allow the cost implications of different technologies that reduce damage to be more clearly assessed.
In this work, established vehicle dynamics tools have been used to predict the forces at the wheel–rail interface. These forces are then used to predict the levels of damage that will develop with traffic. It would in principle be possible to take measurements from vehicles (e.g. of wheelset of bogie accelerations and/or displacements) and to use these with a simpler model to predict the wheel–rail forces.
We find that settlement is the most costliest (with respect to maintenance cost) of the three damage mechanisms, followed by RCF and then wear, with settlement being approximately seven times more costlier than RCF and RCF approximately three times more costlier than wear. As noted, we caveat this finding because of the relatively small sample and the fact that we have only been able to include maintenance costs in the approach. Taken at face value, this result suggests that vehicles resulting in more settlement and RCF damage should attract higher track access charges, though of course the results are only indicative. The overall variability of cost with respect to damage—of roughly between 20% and 30%—is also in line with previous evidence on the variability of costs with respect to traffic for maintenance of around 20–35%. This finding is important for charging purposes as it establishes, in aggregate, the quantum of cost that variable access charges should be seeking to recover.
Whilst the approach has been shown to be feasible, we offer some comments about future research. Further work might focus on generating more observations (more sections and / or exploiting panel data). This approach should be feasible using Swedish data, though it would be a significant research project. The approach is in principle applicable to many European railways where track section data is available, though again we do not claim that the approach is straightforward or trivial. That said, given that previous approaches rely, in any case, on the engineering simulations, which is the most time-consuming aspect of the work, we consider that the econometric second stage has the potential to contribute greatly to the better understanding of the relative marginal cost of different types of vehicles (and indeed different types of vehicles running on different types of infrastructure), particularly in view of the well-established problem with the existing approaches for translating damage into cost.
There are also a number of aspects to the research where assumptions have been used, for example, concerning the precise nature of the vehicles running on the network (we could identify passenger versus freight vehicles, and locomotive versus EMU, but had to use generic models with appropriate parameters for these rather than the detailed models of specific types of vehicles). It has also been assumed that the damage caused by one vehicle is independent of the damage caused by other vehicles, and that the damage measures from one vehicle run can be scaled up in a simple manner. These are limiting but pragmatic and sensible assumptions; however, relaxing them would be interesting and useful areas for future research. Validation of the damage estimates, as compared to the actual measurements would also be a useful addition if the necessary information can be obtained.
Footnotes
Acknowledgements
We thank Vivianne Karlsson and Martin Li at the Swedish Transport Administration for providing data and for their helpful answers to our questions.
Declaration of Conflicting Interests
The author(s) declared no potential conflicts of interest with respect to the research, authorship, and/or publication of this article.
Funding
The author(s) disclosed receipt of the following financial support for the research, authorship, and/or publication of this article: This study was supported by the European Commission funded ‘SUSTRAIL’ project (grant reference 265740 FP7).