
Abstract
Polymer foams are difficult to characterise due to rapidly evolving physical features from liquid to porous solid. Swift changes in volume, porosity and moduli render many techniques challenging for the characterisation of the foam curing during a manufacturing process. A technique that employs the longitudinal speed of sound of an ultrasonic signal, informed by a thermokinetic model, is proposed as an in situ, in-line, non-destructive and continuous monitoring tool during the production of rigid polyurethane foams. This study demonstrates that speed of sound measurements are suitable for (a) continuous characterisation of different foaming stages in the polymer reaction and curing; (b) determining the degree of cure for the continuous monitoring of foams, and (c) predicting mechanical properties (i.e., stiffness and Poisson's ratio) of cured foam samples. The validity of this monitoring technique is confirmed by comparison with well-established methods that use physical characteristics (e.g., expansion rate, electrical properties), thermo-kinetic models and mechanical testing. This method positions itself as a monitoring tool and convenient method for determining material stiffness during production.
Introduction
Rigid polyurethane thermosetting foams are widely used as structural and insulation materials in many sectors 1 due to the broad range of physical properties attained by altering chemical formulation or manufacturing process. The prediction of these properties presents opportunities for manufacturers who wish to fabricate engineered porous polymers tailored for hi-tech applications. There is however a need to monitor and characterise the polymerisation and expansion of the foam during manufacturing to ensure the desired product is created and to optimise manufacturing times and material usage.
When appropriately mixed, thermosetting resins (e.g., polyurethanes or epoxies) change in physical character from a viscous liquid to a gel, and finally to a solid through stages that have been well documented. Monitoring this evolution informs the degree of cure (α) of the polymer along with properties through the development of the solid-phase moduli. In the specific case of expanding polyurethane foams, there is an intrinsic production of the chemical blowing agent (CO2 gas) from the polymerisation, which governs the foam stages of nucleation and rising, and is responsible for producing the porous structure. 2 The rate at which polymerisation reaction takes place determines the structure of the foam. The rapid expansion by the production of CO2 makes the foam difficult to characterise. A robust monitoring tool that can determine the cure state of the foam and the foam stages in situ, in-line, non-destructive and avoiding sample extraction, would add value to the manufacturing process in industrial settings.
Traditional techniques for the detection of the degree of cure in thermoset polymers are rheometry, 3 thermal analysis, 4 spectroscopic methods, 5 expansion rate, 6 dielectric measurements 7 and ultrasonic methods.8–11 Some carry the disadvantage that they cannot be implemented in-line (e.g., thermal analysis and rheometry) or be performed in situ without a destructive effect on the sample (e.g., thermal analysis). Many of these methods are restricted and/or sensitive to sample size. For example, differential scanning calorimetry requires samples of 10–20 μl which is prohibitively small for expanding foams. Rheometry is extremely sensitive to the sample size and shape, which should be constant throughout the data collection procedure. As a consequence, many of the aforementioned techniques are challenging, if not impossible, for monitoring expanding foams, especially if the monitoring process is desired in-line with manufacturing.
The use of sound to monitor material properties is prevalent in applications such as non-destructive testing and medical imaging. Ultrasonic wave propagation has been employed to assess changes in material properties over time, such as cure of concrete 12 and foam coarsening in liquid foams. 13 It is suitable to monitor the reaction extent and curing of epoxy thermosets. 8 Ghodhbani et al. 9 and Macrechal et al. 10 used ultrasonic properties to study the cure of epoxy resins and compute reaction kinetics. In its application to thermosets, ultrasonic testing has been proposed to be capable of dynamic mechanical analysis. 11 One of the key advantages to the use of ultrasound for the monitoring of cure in thermosets is its suitability to industrial applications, allowing large samples to be tested. The ultrasonic transducer(s) can be built into the walls of the mould or cavity in which the sample sits,8,9 allowing for in situ measurements. The speed of sound in a material can be used to infer mechanical properties of elastic solids.14,15 This provides a convenient non-destructive method of assessing the cure of the polymer and of predicting the resulting stiffness of the part before demoulding. To the best of the authors' knowledge, there is no technique reported that uses the acoustic (i.e., ultrasonic) method to monitor cure and predict the cured properties of polymeric foams.
This paper reports the use of speed-of-sound as a method for the monitoring and characterisation of reaction stages assisted by autocatalytic thermo-kinetics that model the degree of cure in polyurethane foams. The method is assessed against other techniques and its merits are validated for potential implementation as an online process and quality control tool. The mechanical properties predicted through ultrasonic wave propagation are then compared with both values measured by quasi-static compression tests and from the literature.
Experimental
Materials
The polyurethane foam used was a rigid two-part system (LD40, MB Fibreglass Ltd, UK). Parts A and B were mixed at a ratio of 100:109 by weight. Speed of sound, electrical resistivity and expansion tests required volumes >10 ml. Ingredients were mixed using a mechanical stirrer for 15 s at 1000 r/min and poured into the experiment vessel. When smaller volumes were required a 3 ml two-barrel syringe with a mixing nozzle was used. In timed experiments
Experimental procedure
Three experiments were performed:
Speed of sound to characterise different foaming stages in the polymer. To validate the robustness of this method, other techniques such as expansion rate and electrical resistivity were also employed for comparison. The degree of cure was computed from the speed of sound to observe the progress of the reaction, assessing its faithfulness to an autocatalytic kinetic model, as reported in the literature, and measured using heat measurements of the foam at different starting temperatures. Predicted stiffness of the cured samples and quasi-static moduli were calculated from soundwave speeds and compared to uniaxial compression tests for cured foams.
Speed of sound measurements
A cylindrical vessel of 52 mm length and 118 mm diameter was fabricated so that a volume of foam was always present between the transducer faces (Figure 1) and for the sound to travel perpendicular to the foam rise. The vessels remained open throughout the experiment to allow the foam to expand, avoiding the formation of pockets with a high internal pressure that could collapse bubbles.
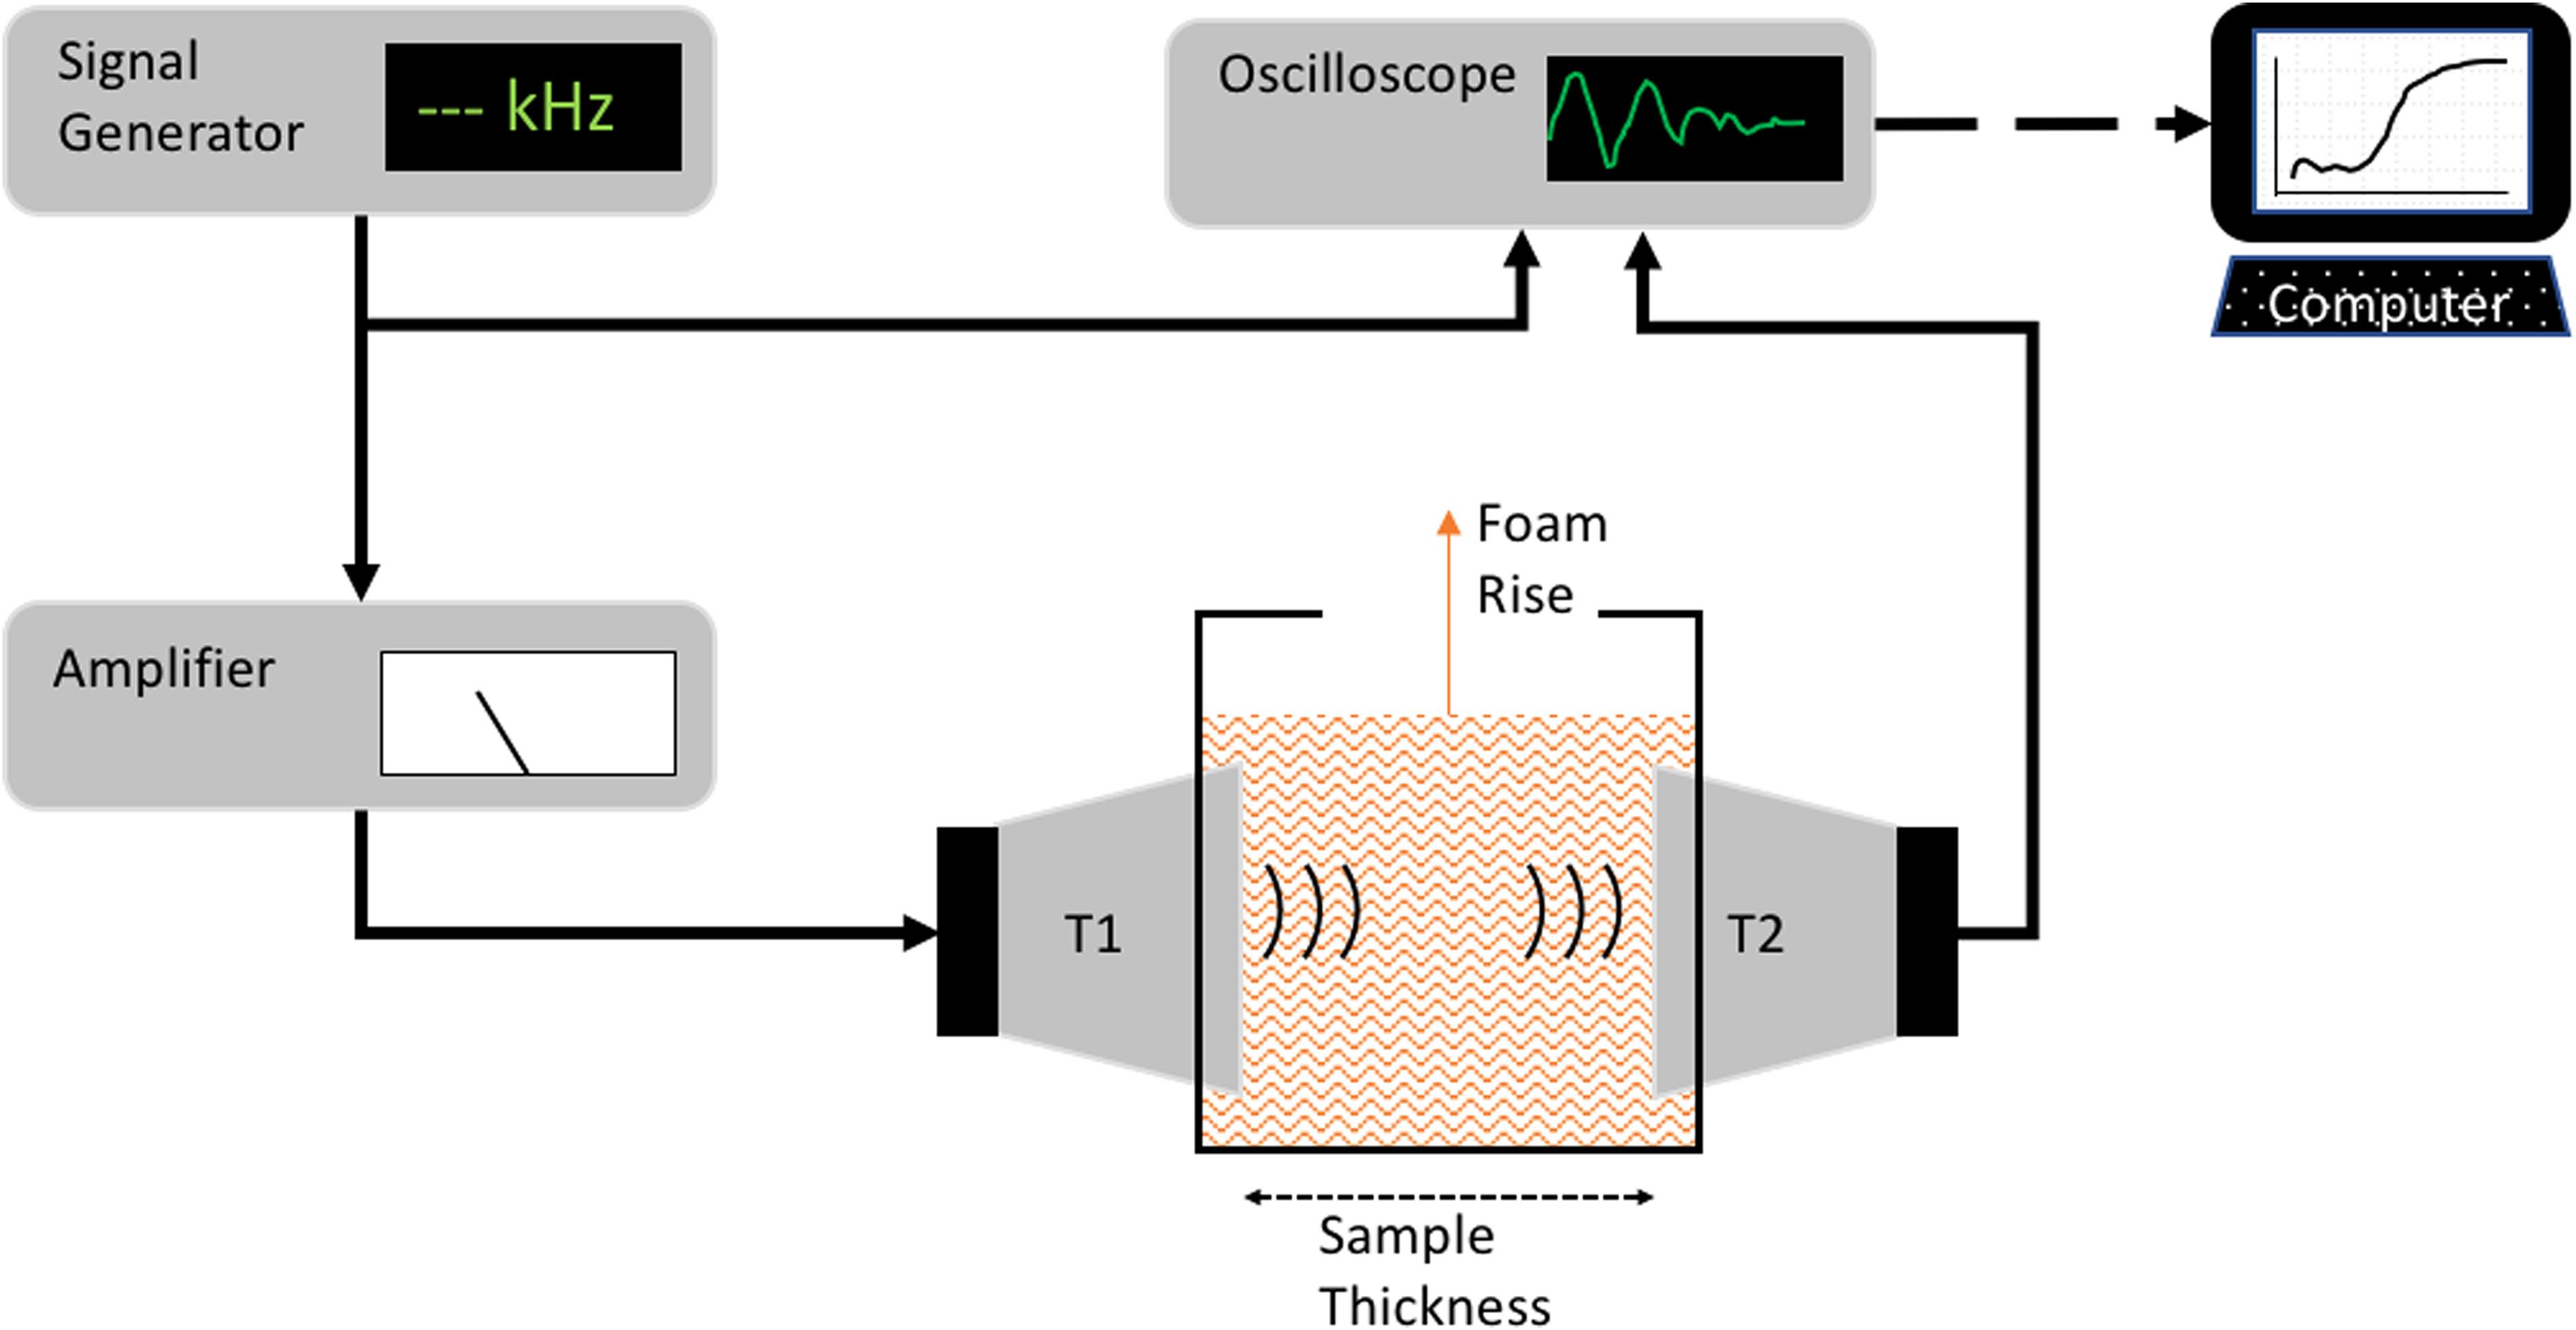
Diagram of the speed of sound measurement experiment.
A signal generator (33220A, 20 MHz, Agilent, USA) produced a square-wave signal at the chosen frequency, to burst every 0.1 s. The signal generator was connected to an oscilloscope (DPO 2014B, Tektronix, USA) and to an amplifier (700A1, Amplifier Research, UK). The amplifier was set to 50 W, 50 Ω electrical impedance and connected to the emitting transducer, T1 (Beijing Ultrasonics, China). A twin transducer, T2, was placed on the opposite side of the vessel and connected to the oscilloscope to record the propagating signal. Different excitation frequencies (25.3, 38.8 and 138.0 kHz) and separations (15.49–20.75 mm) were used to remove bias from a specific acoustic set-up. Data from the received signal were used to determine the transit time of the acoustic pulse from the emitting transducer. Temporal resolutions of 5 s for 0–300 s, 10 s for 300–600 s and 30 s for 600–900 s were used. The first 15–20 s (during mixing) recorded the transit time of air and acted as a baseline for data processing. Data were filtered using a moving average once foam expansion and cure were complete. Tests were run in quadruplicate.
Foam expansion measurements
The expansion of the foam was measured using an ultrasonic distance sensor (The Pi Hut, UK), powered by an Arduino UNO (Arduino LLC). The sensor was fixed to the top and pointed into a cylindrical open-top vessel that was placed on a weighing scale (Adam Equipment, UK) to log mass changes simultaneously with distance, measured at 1 Hz. Distance and mass measurements were taken until the foam ceased rising.
Electrical resistivity measurements
The arrangement for electrical resistivity measurements was based on that reported elsewhere. 7 Probes were inserted transversally to the rising direction to ensure the maximum time submerged in the foam to measure the electrical resistivity from the early stages of the reaction.
Prediction of mechanical properties using acoustic measurements
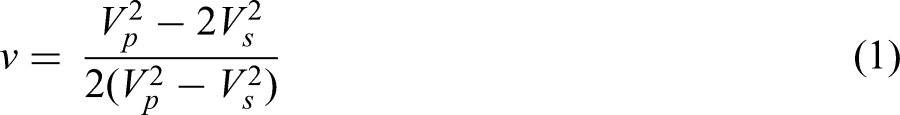
Samples of cured foam were tested with a commercial ultrasonic apparatus (Pundit Lab+, Proceq, Switzerland) which measured the P-wave (longitudinal wave) and S-wave (shear wave) speeds. This was to validate the speed-of-sound measurements through the apparatus developed in this experiment (Figure 1) and to predict (via calculation) the Poisson's ratio of the cured foam. The P- and S-wave speeds were measured for LD40 blocks using the 54 kHz P-wave transducers (because of their higher signal-to-noise ratio and power transmitted into the material, as determined by preliminary tests) and the 250 kHz S-wave transducers (the only frequency available for shear waves), respectively. Five cuboid samples were cut from cured foam blocks at a different axis with respect to the foam-rise direction (z-axis), weighed and sized. The Pundit Lab + pulse voltage was set to 500 V and the probe gain adjusted between 1× and 50×. Readings were taken in quintuplicate and the wave time-of-flight averaged. Poisson's ratio, v was calculated using:


Thermokinetic measurements
A thermal conductivity apparatus (P5687, Cussons, UK) measured heat produced by the polyurethane foam reaction within a vacuum vessel (Figure 2). The water mass flow (Rf) sampling rate was at 30 s.
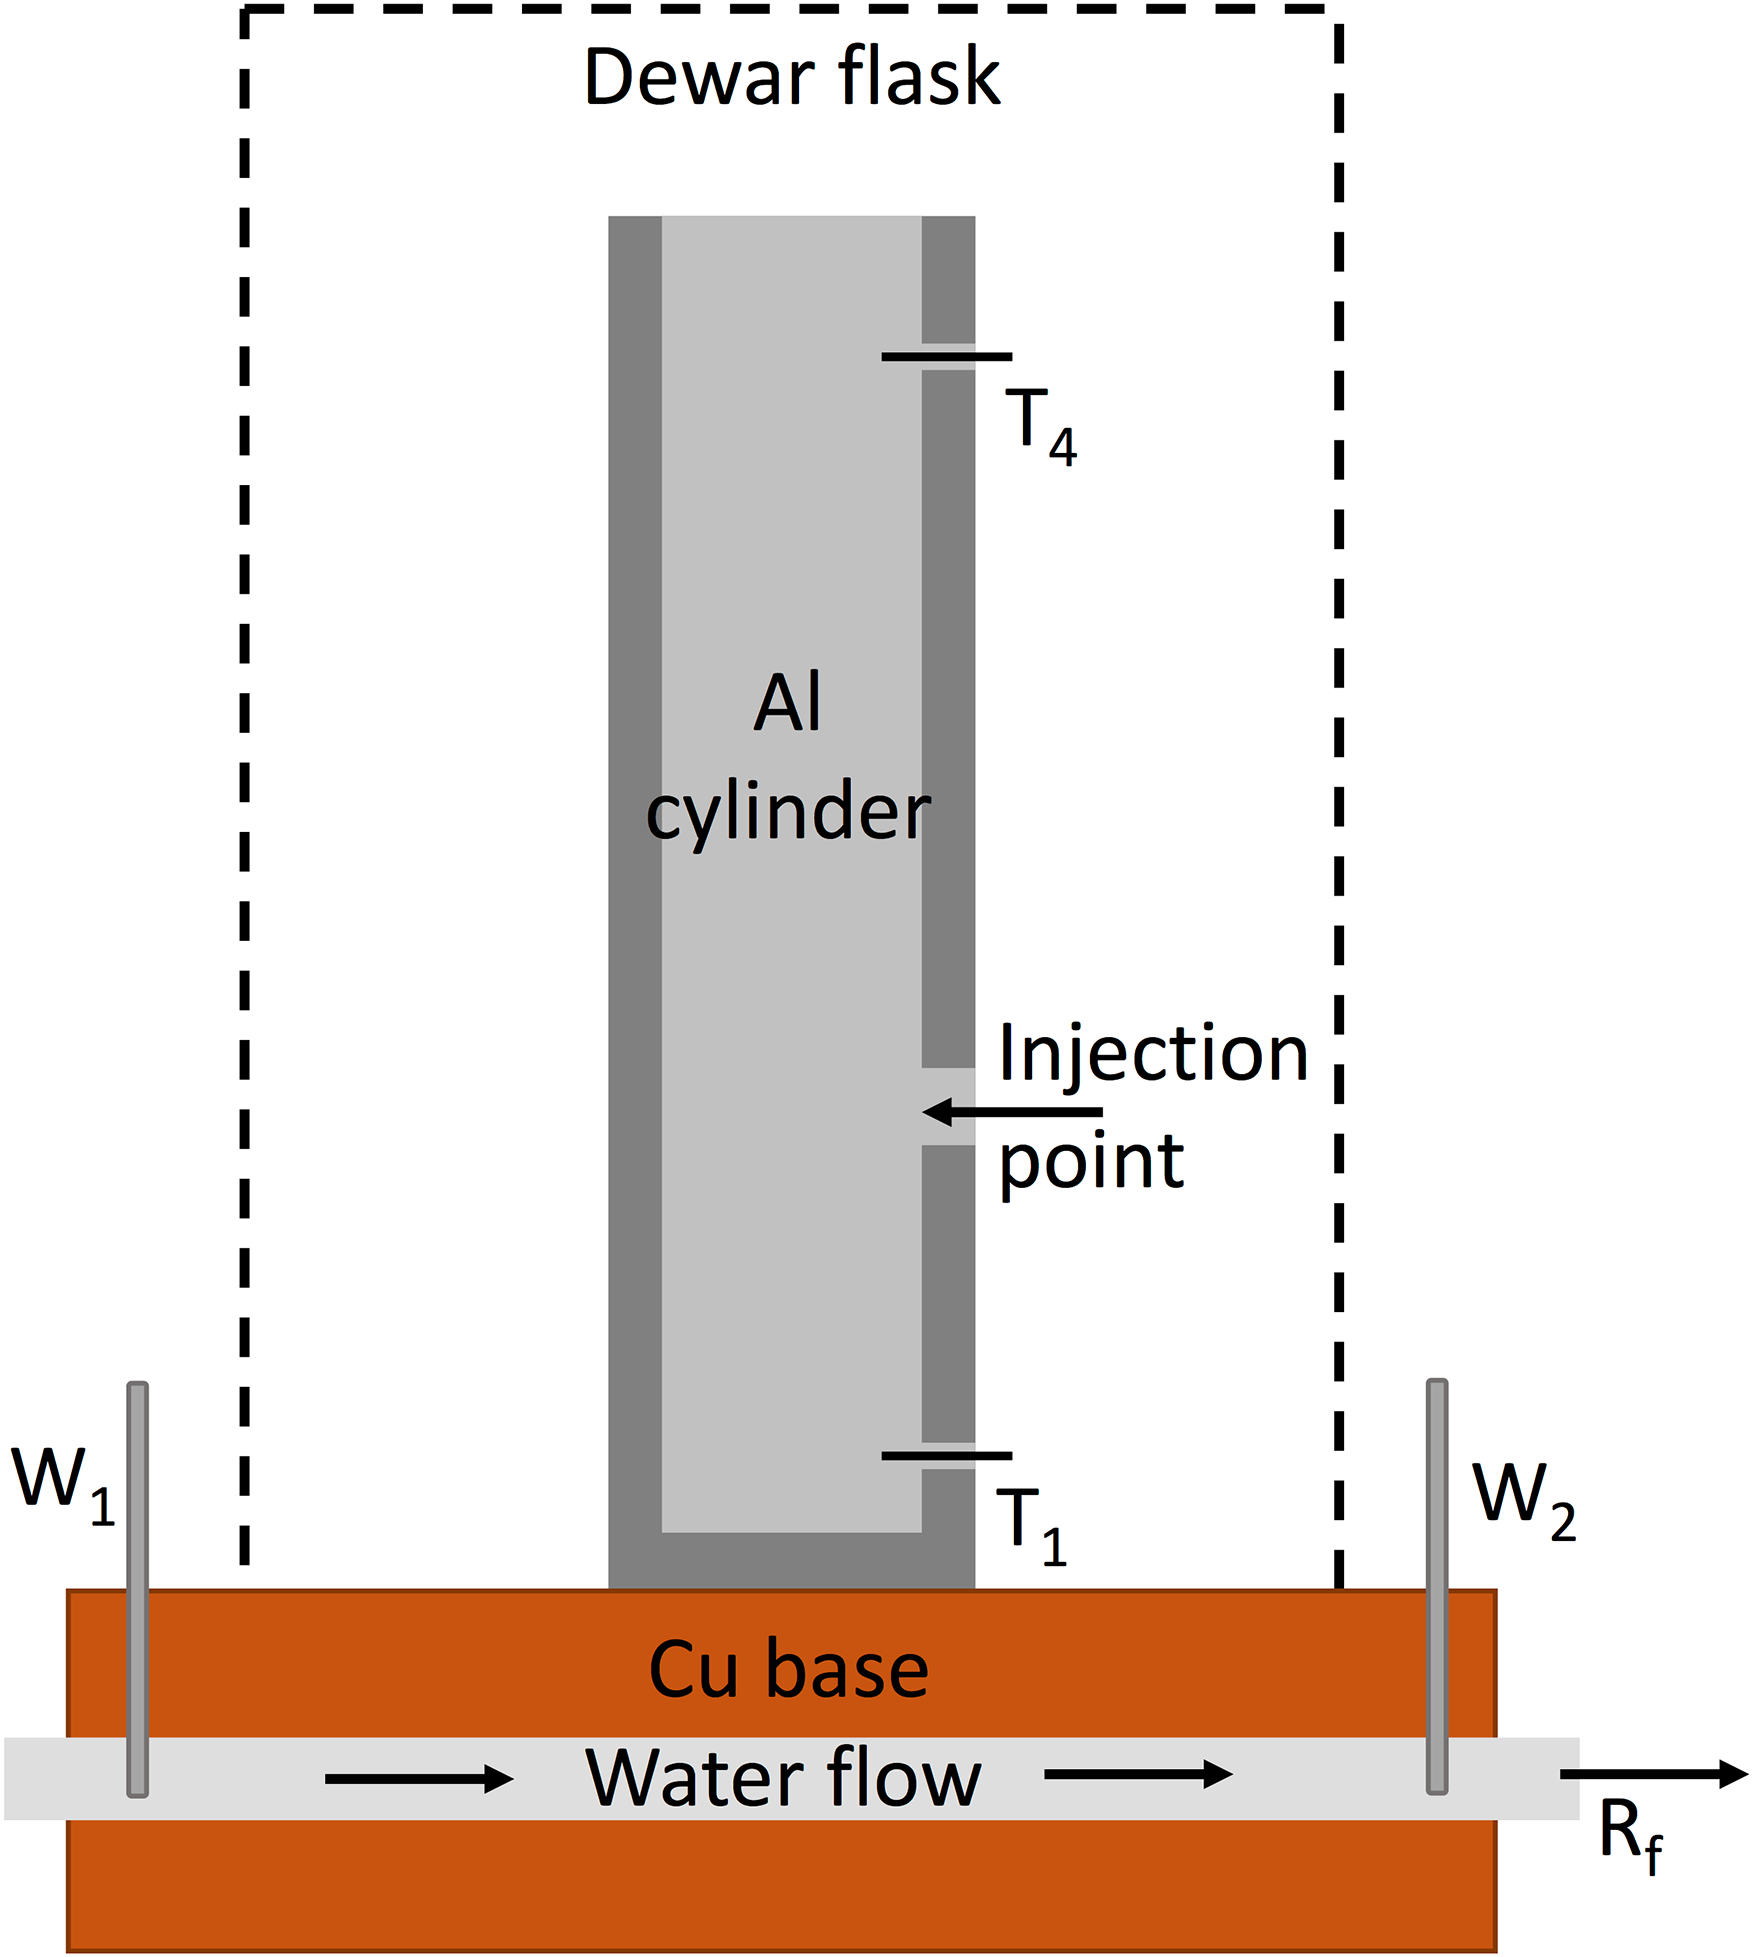
A schematic representation of the thermal conductivity apparatus with a modified aluminium containment vessel.
Thermocouples (W1, W2) measured the difference in temperature of the water flow,

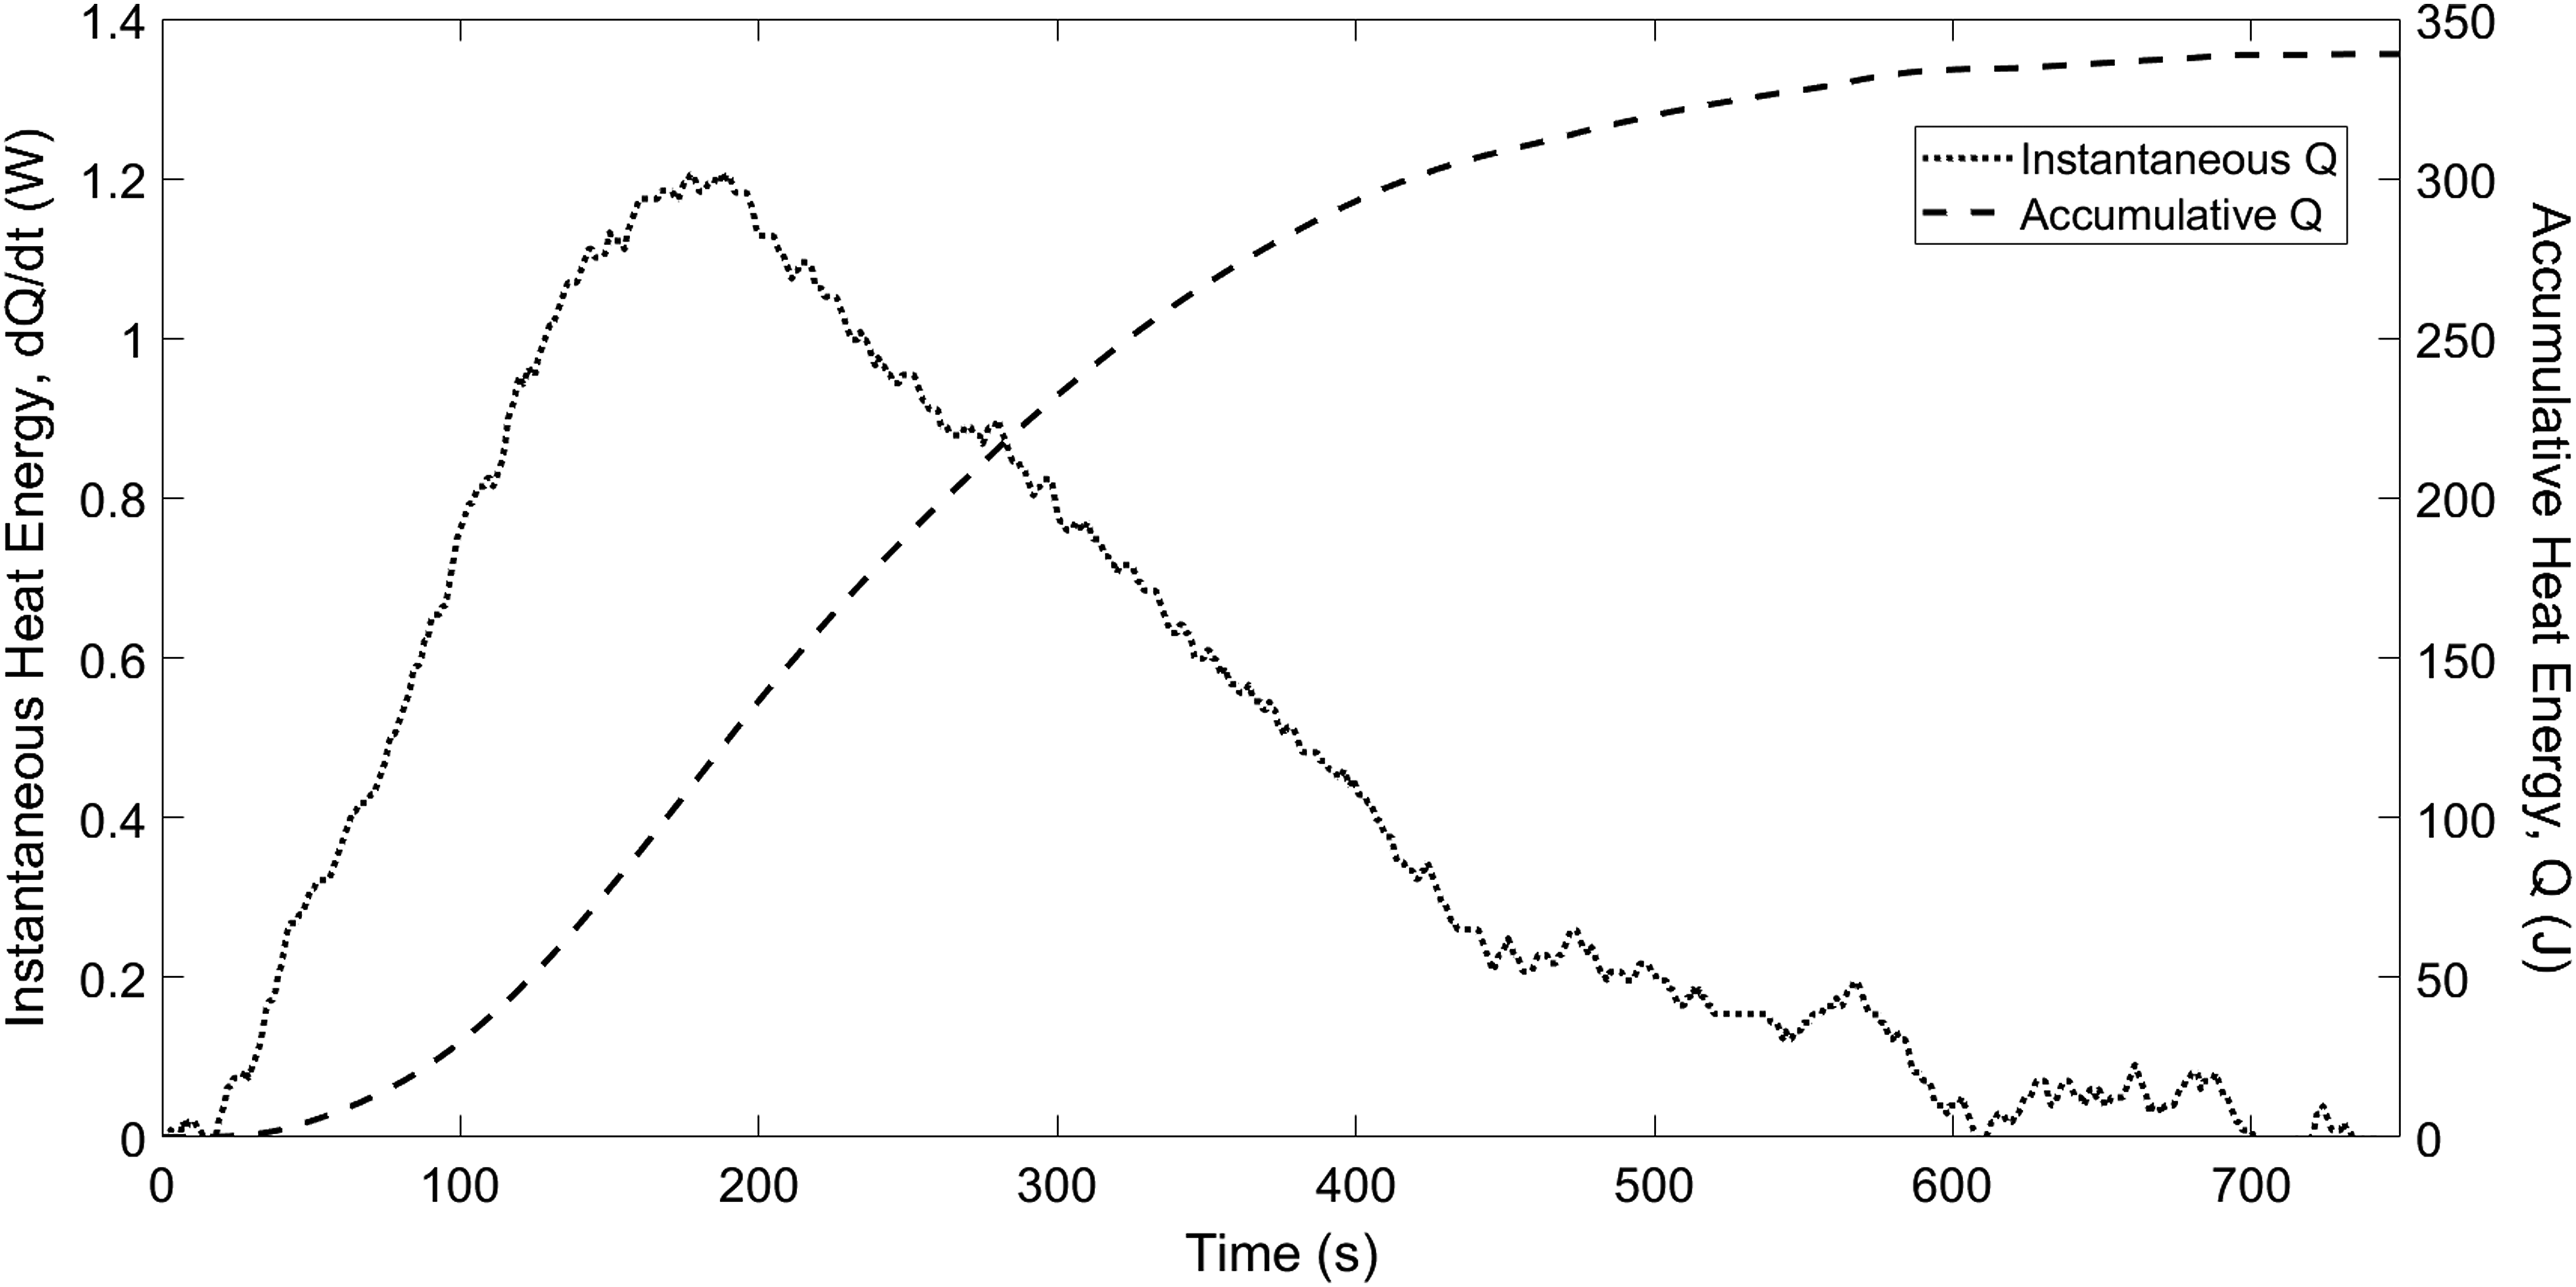
Results obtained for an 18 °C foam: instantaneous heat energy dQ/dt (W) and accumulative heat energy Q (J).
The reactants were injected at a known temperature (reported temperature). Four reactant temperatures were tested: 8, 18, 22 and 34 °C.
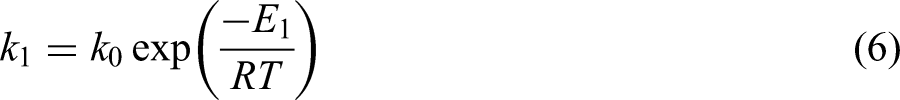
Kinetic model for polymer cure
An autocatalytic cure model, proposed by Kamal,
17
was applied to the curing data from the heat measurements:

Results and discussion
Speed of sound measurements
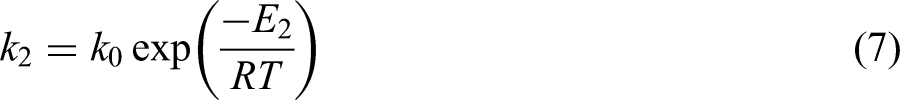
Figure 4(a) shows the speed of sound during the reaction of the polyurethane foam as an average of four tests at 24 °C. To couple the speed of sound measurements to degree of cure, a similar assumption was taken to that of other methods, i.e., the speed remained constant once the reaction was finished. Once the reaction was finished the degree of cure was considered to be 100% for the purpose of this work. This is however not the strict definition of the degree of cure since 100% cure would not be reached truly (i.e., all reactants consumed) unless the optimal isothermal temperature of cure is achieved, which was not measured for this polyurethane system. The degree of cure was calculated as:

(a) Speed of sound data with error bars for a foam reacting at 24 °C. (b) Normalised speed of sound and α-fit for a foam reacting at 24 °C.
Foam expansion measurements
The density of the polyurethane foam is displayed in Figure 5 as the normalised value of the change in density. The results are plotted for initial reactant temperature of 24 °C, representative of all tests, displaying a decrease in density corresponding to the rapid expansion of the foam and a constant value from approximately 120 s after mixing.
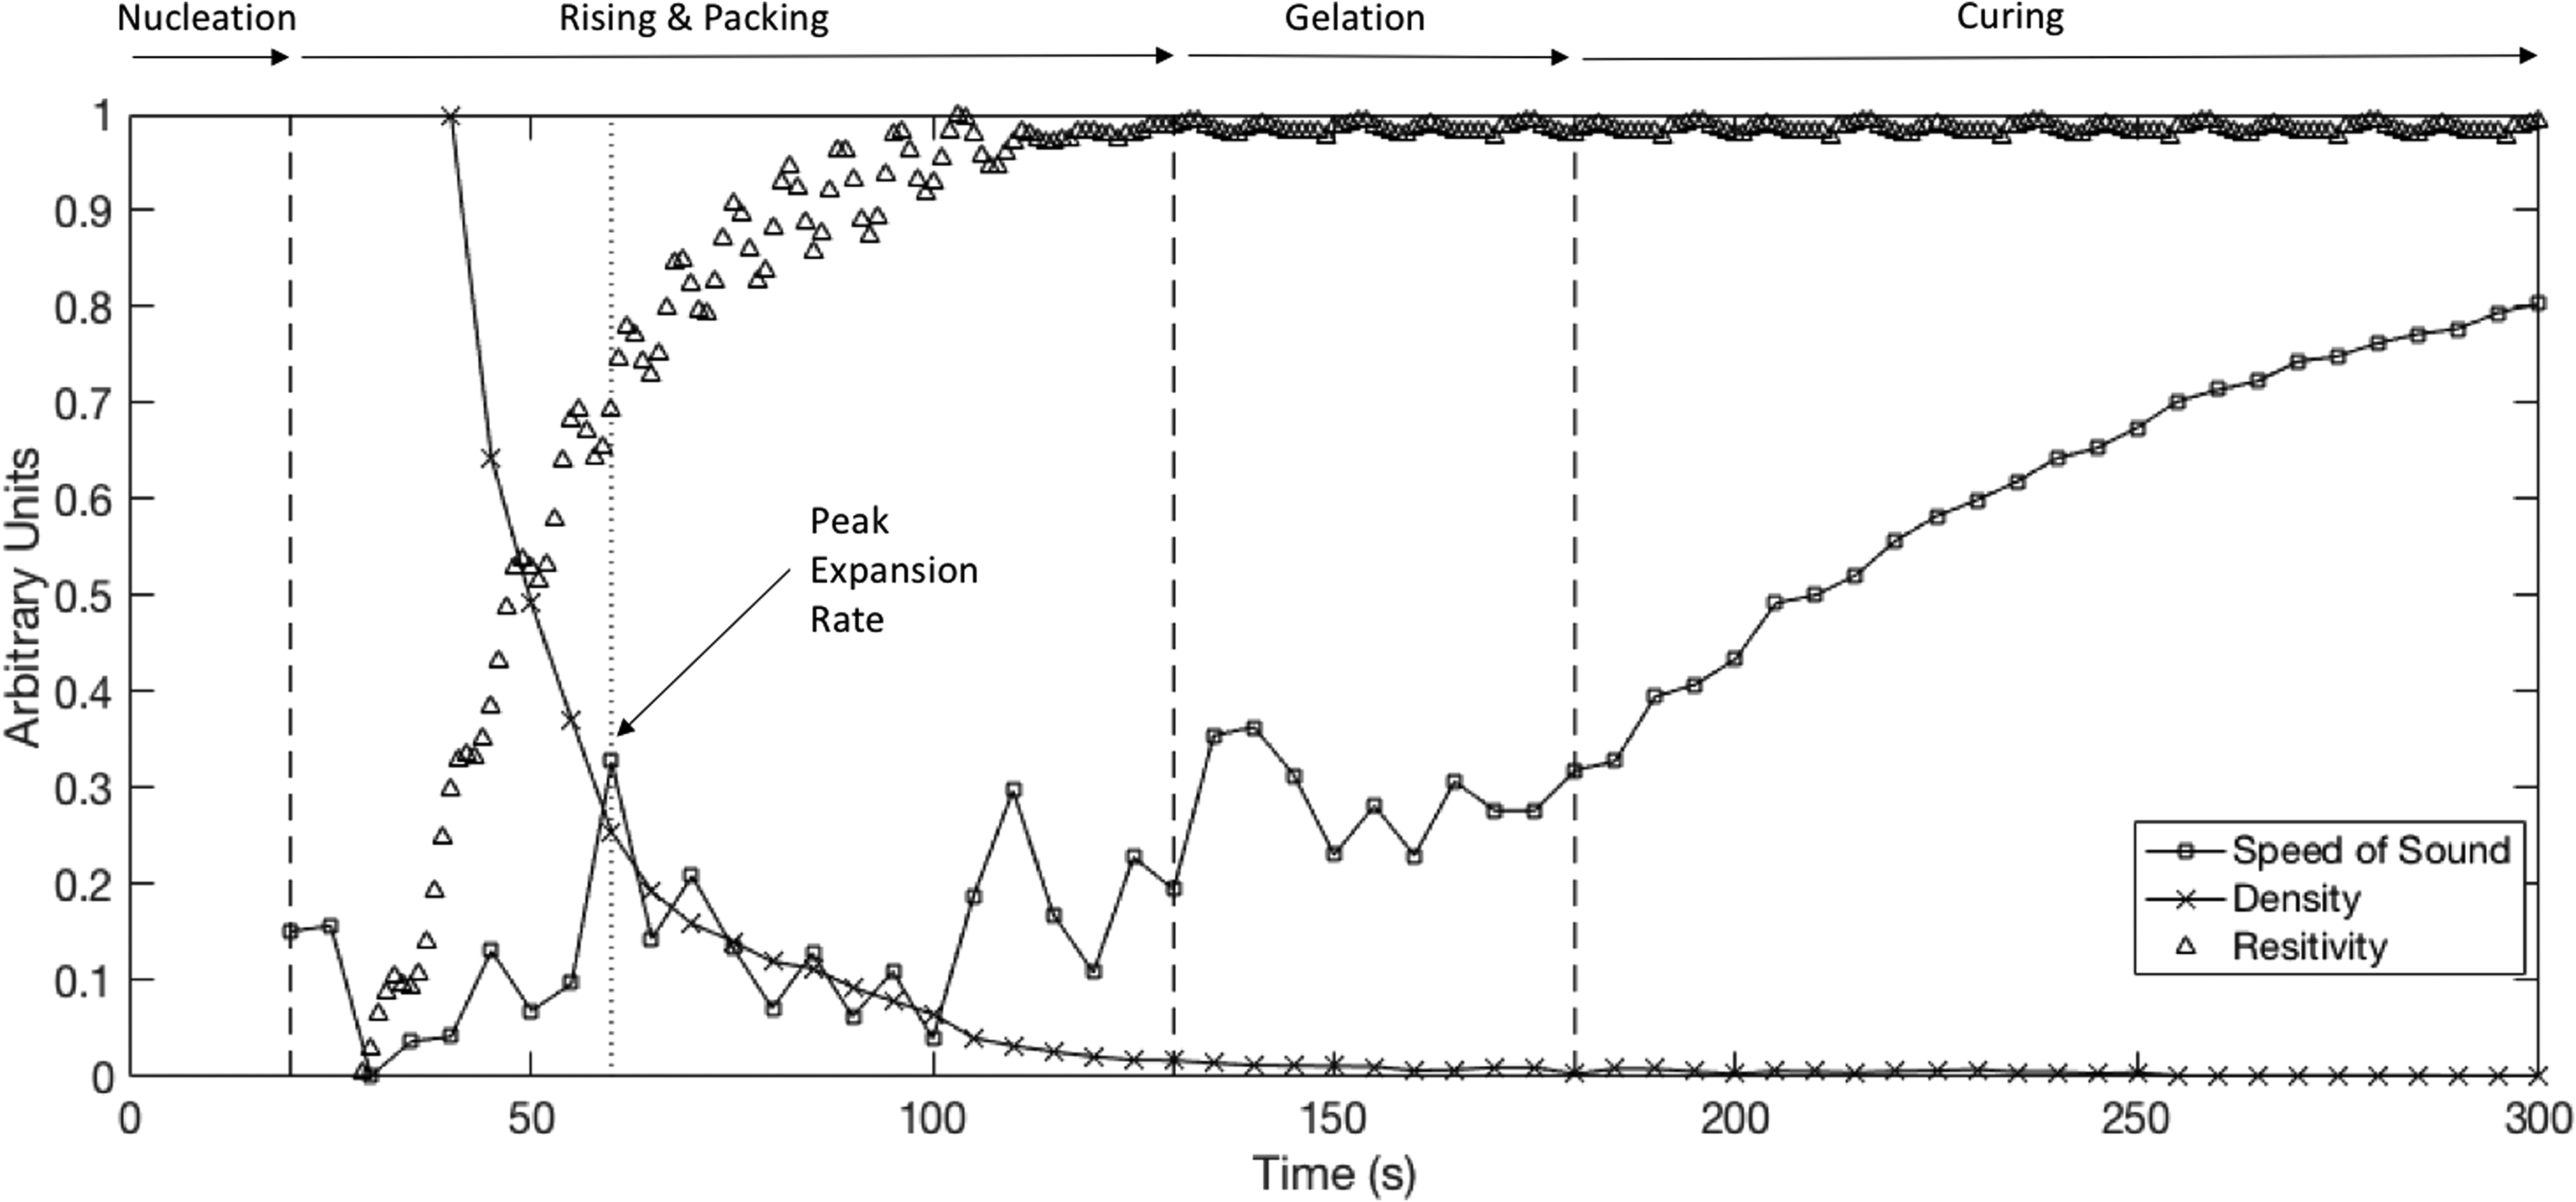
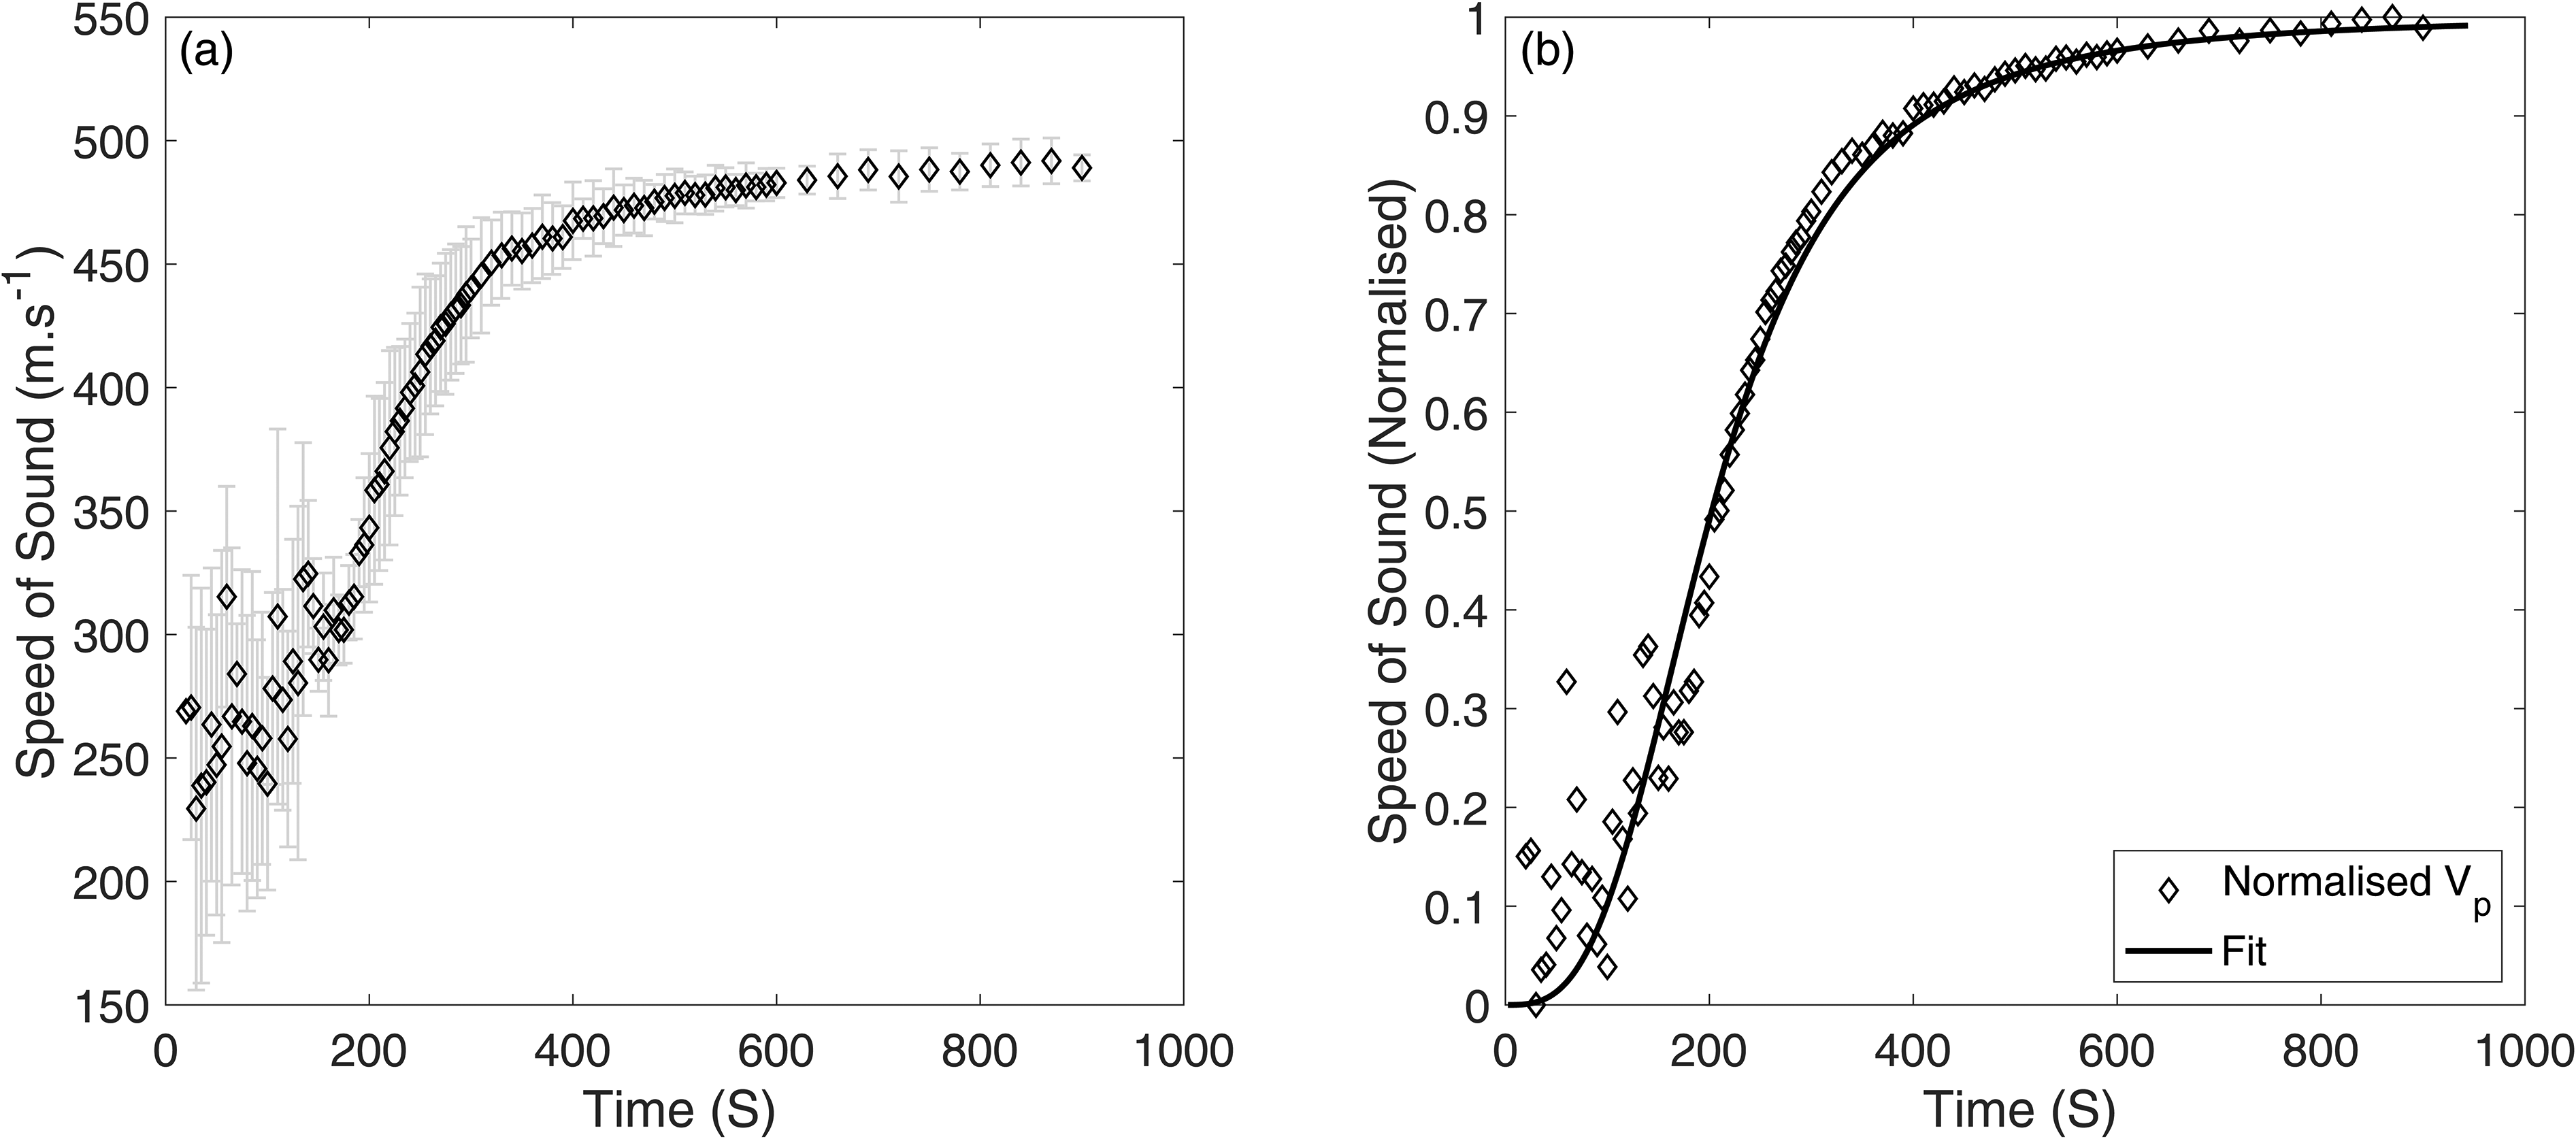
Normalised speed of sound, electrical resistivity and density profiles with characteristic times labelled for a 24 °C foam.
Electrical resistivity measurements
Electrical resistivity measurements are presented as normalised voltage against time at 24 °C in Figure 5. Although there was slight oscillatory noise in the signal at t < 100 s, the general trend can be seen.
Figure 5 shows the normalised speed of sound, density and recorded voltage on the same plot and the foam stages, as identified in, 18 are labelled corresponding to the vertical dashed lines: up until 20 s (nucleation), between 20 and 130 s (rising and packing steps, gelation begins), at 180 s (gelation stops, and curing begins). The dotted line shows a peak expansion rate.
The peak expansion rate sits at 60 s and the foam expansion is ceased at 100 s which corresponds to nucleation and then rising. This confirms that the concurrent reaction producing CO2 occurred from t = 30 s to a peak at 60 s (rising). From this point, the polymerisation reaction dominated, significantly slowing expansion to zero around 130 s where the density remained constant (packing). Any further minute changes in density can be attributed to mass lost through gases (H2O vapour, CO2) escaping to the surroundings. The density plateaued at 55 kg/m3 (gelation). Comparing the density profile with the electrical resistivity profile in Figure 5 similar plateau times around 130 s are detected. This suggests that the electrical resistivity measurement was sensitive to the structural changes in the polymer foam. The electrical resistivity data finally followed an asymptote that characterises the curing stage. The time of the peak expansion can be seen as a significant spike in the early speed-of-sound data (at 60 s, dotted line). The speed of sound progressed quickly in the early stages, increasing to >300 m/s (0.3 on Figure 5) at the beginning of the cure phase (180 s), with a change of character once the gelation terminated. It is concluded that the speed of sound method can characterise the latter foam stages of a reacting polymer, and the simplicity of this technique could permit implementation in a continuous production process.
Degree of cure measurements and validation by autocatalytic model
The degree of cure
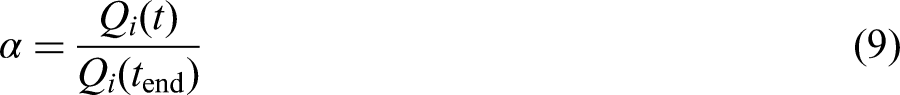
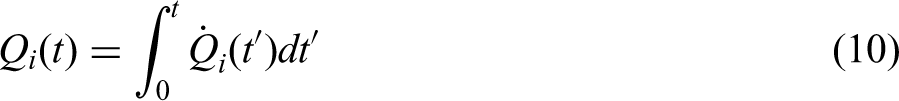
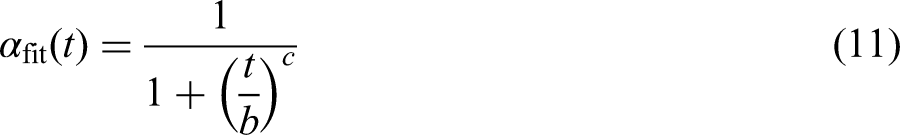
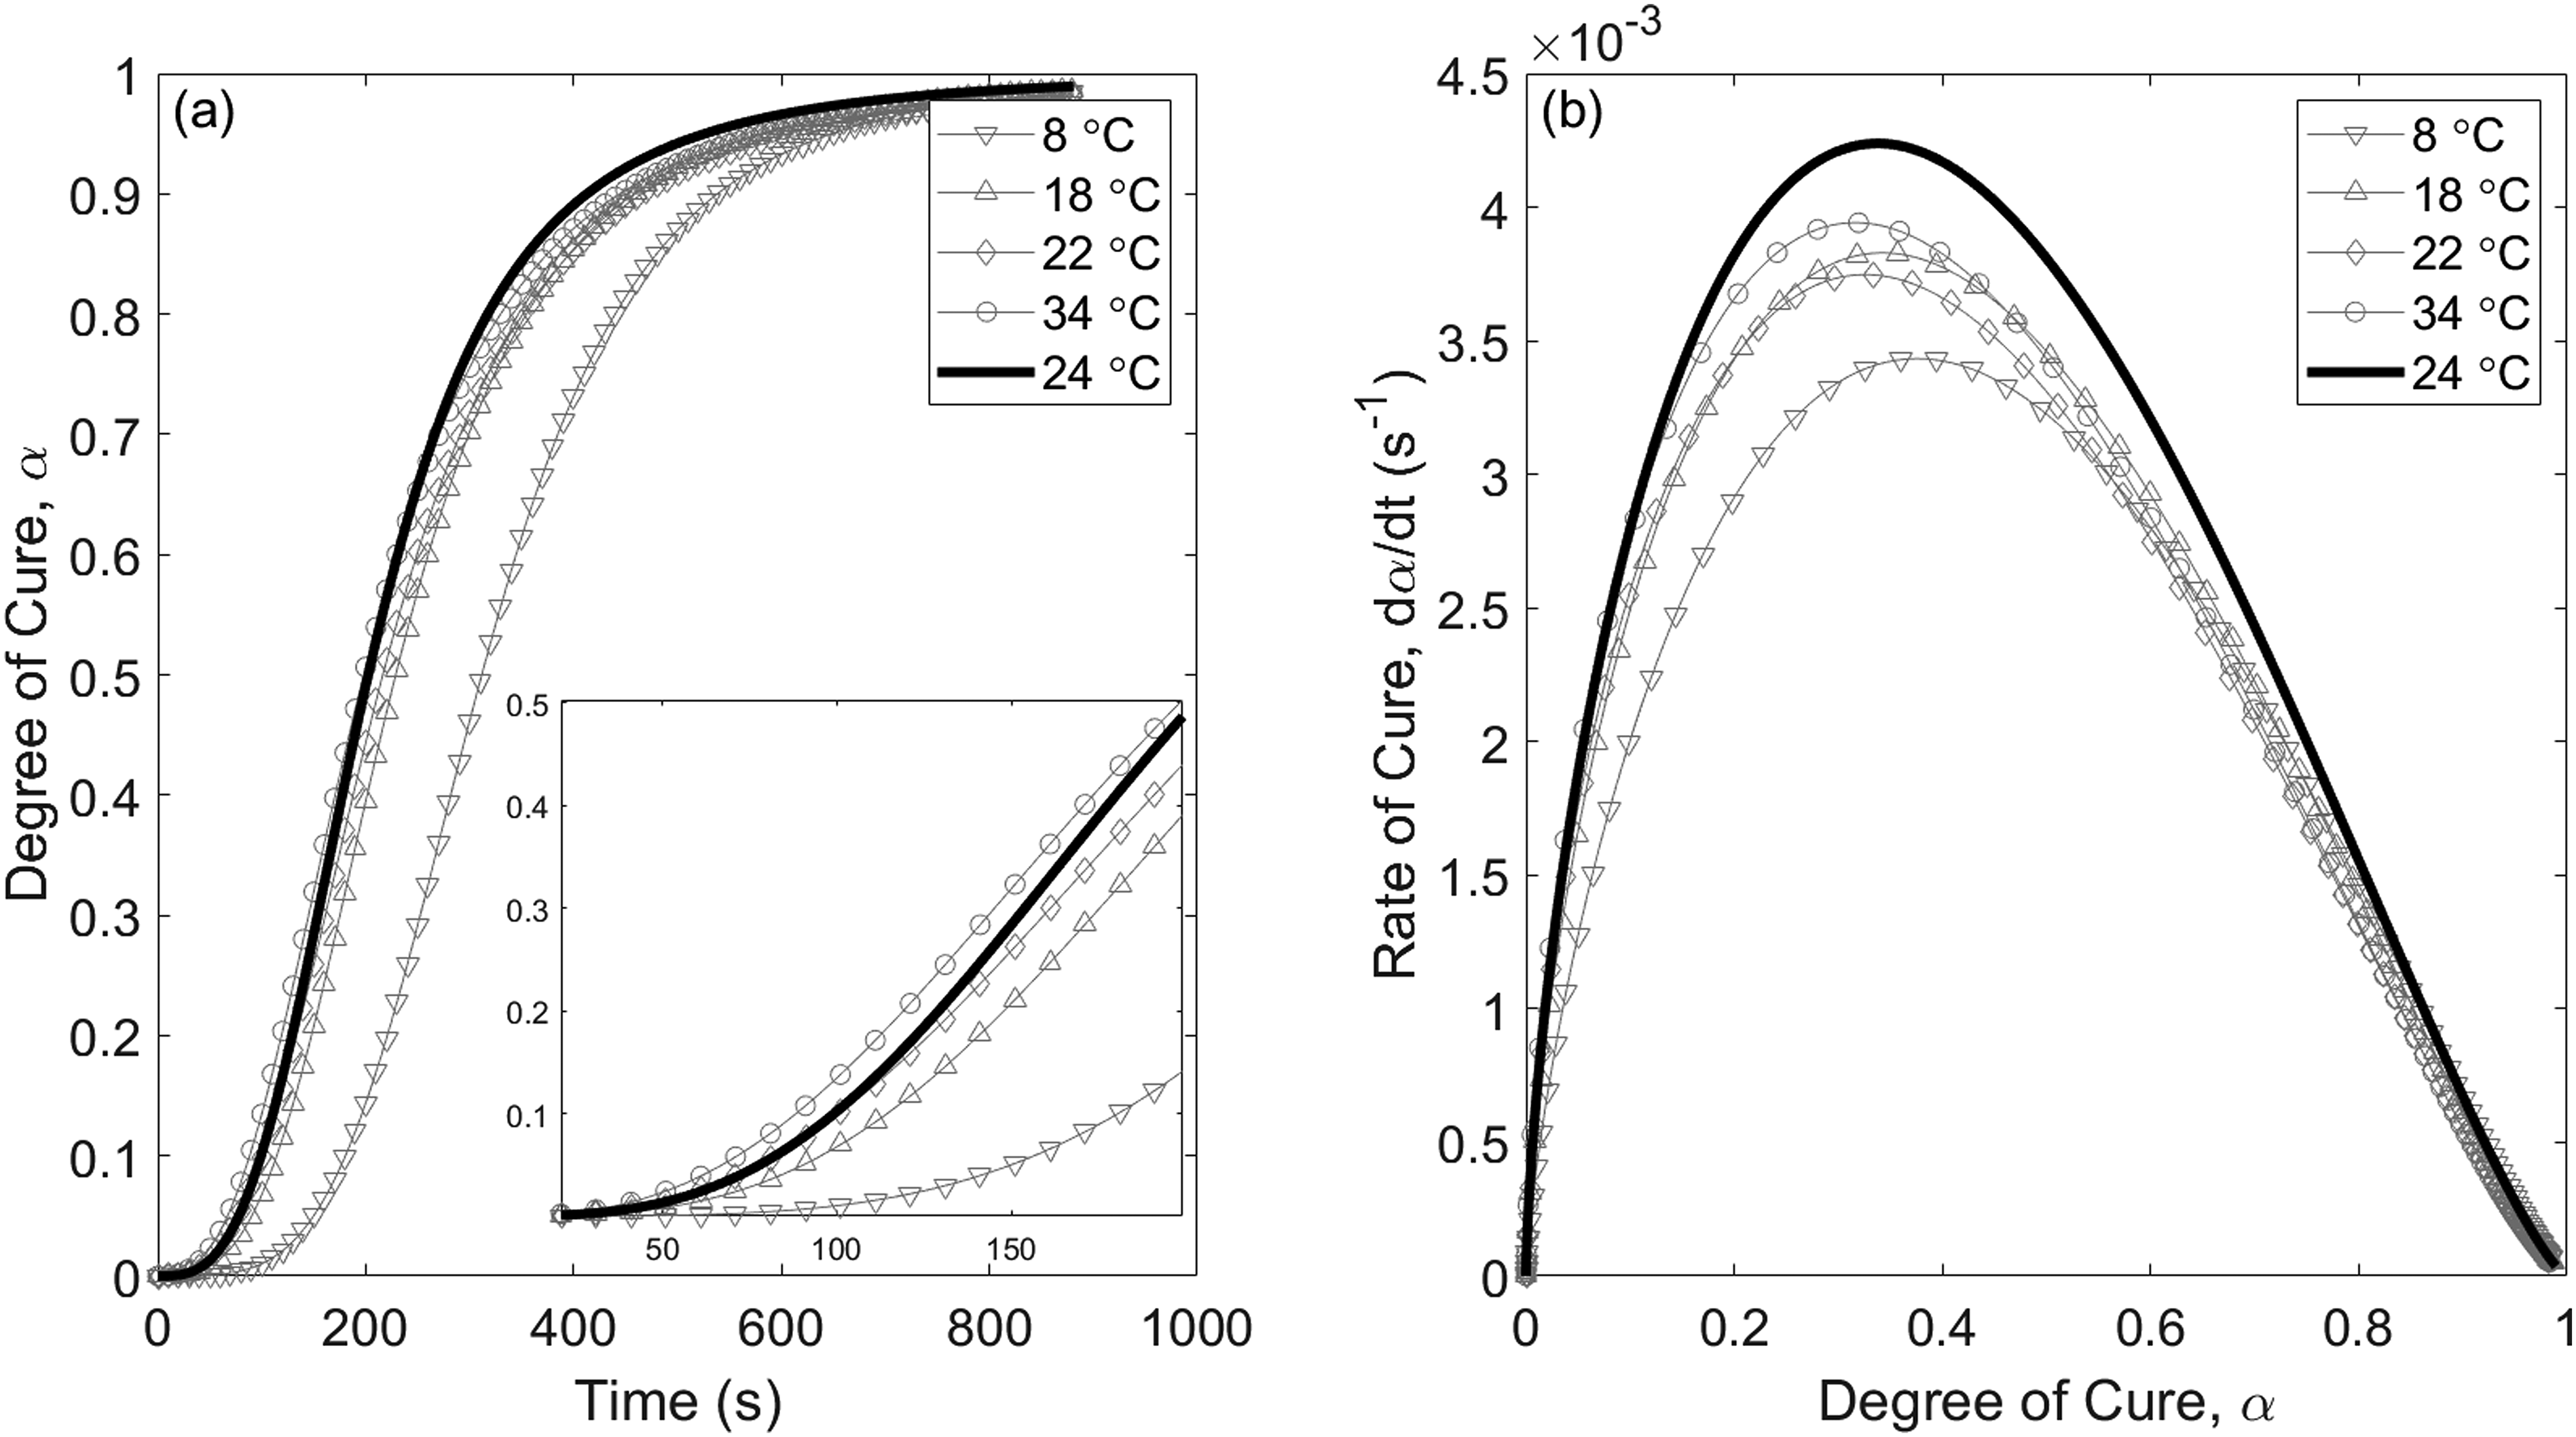
Fitted cure parameters. (a) Degree of cure, α, against time, inset is the first 200 s (b) Rate of cure (dα/dt) against the degree of cure. The speed of sound study is the solid line and the thermokinetic studies are each identified with markers.
The fitted
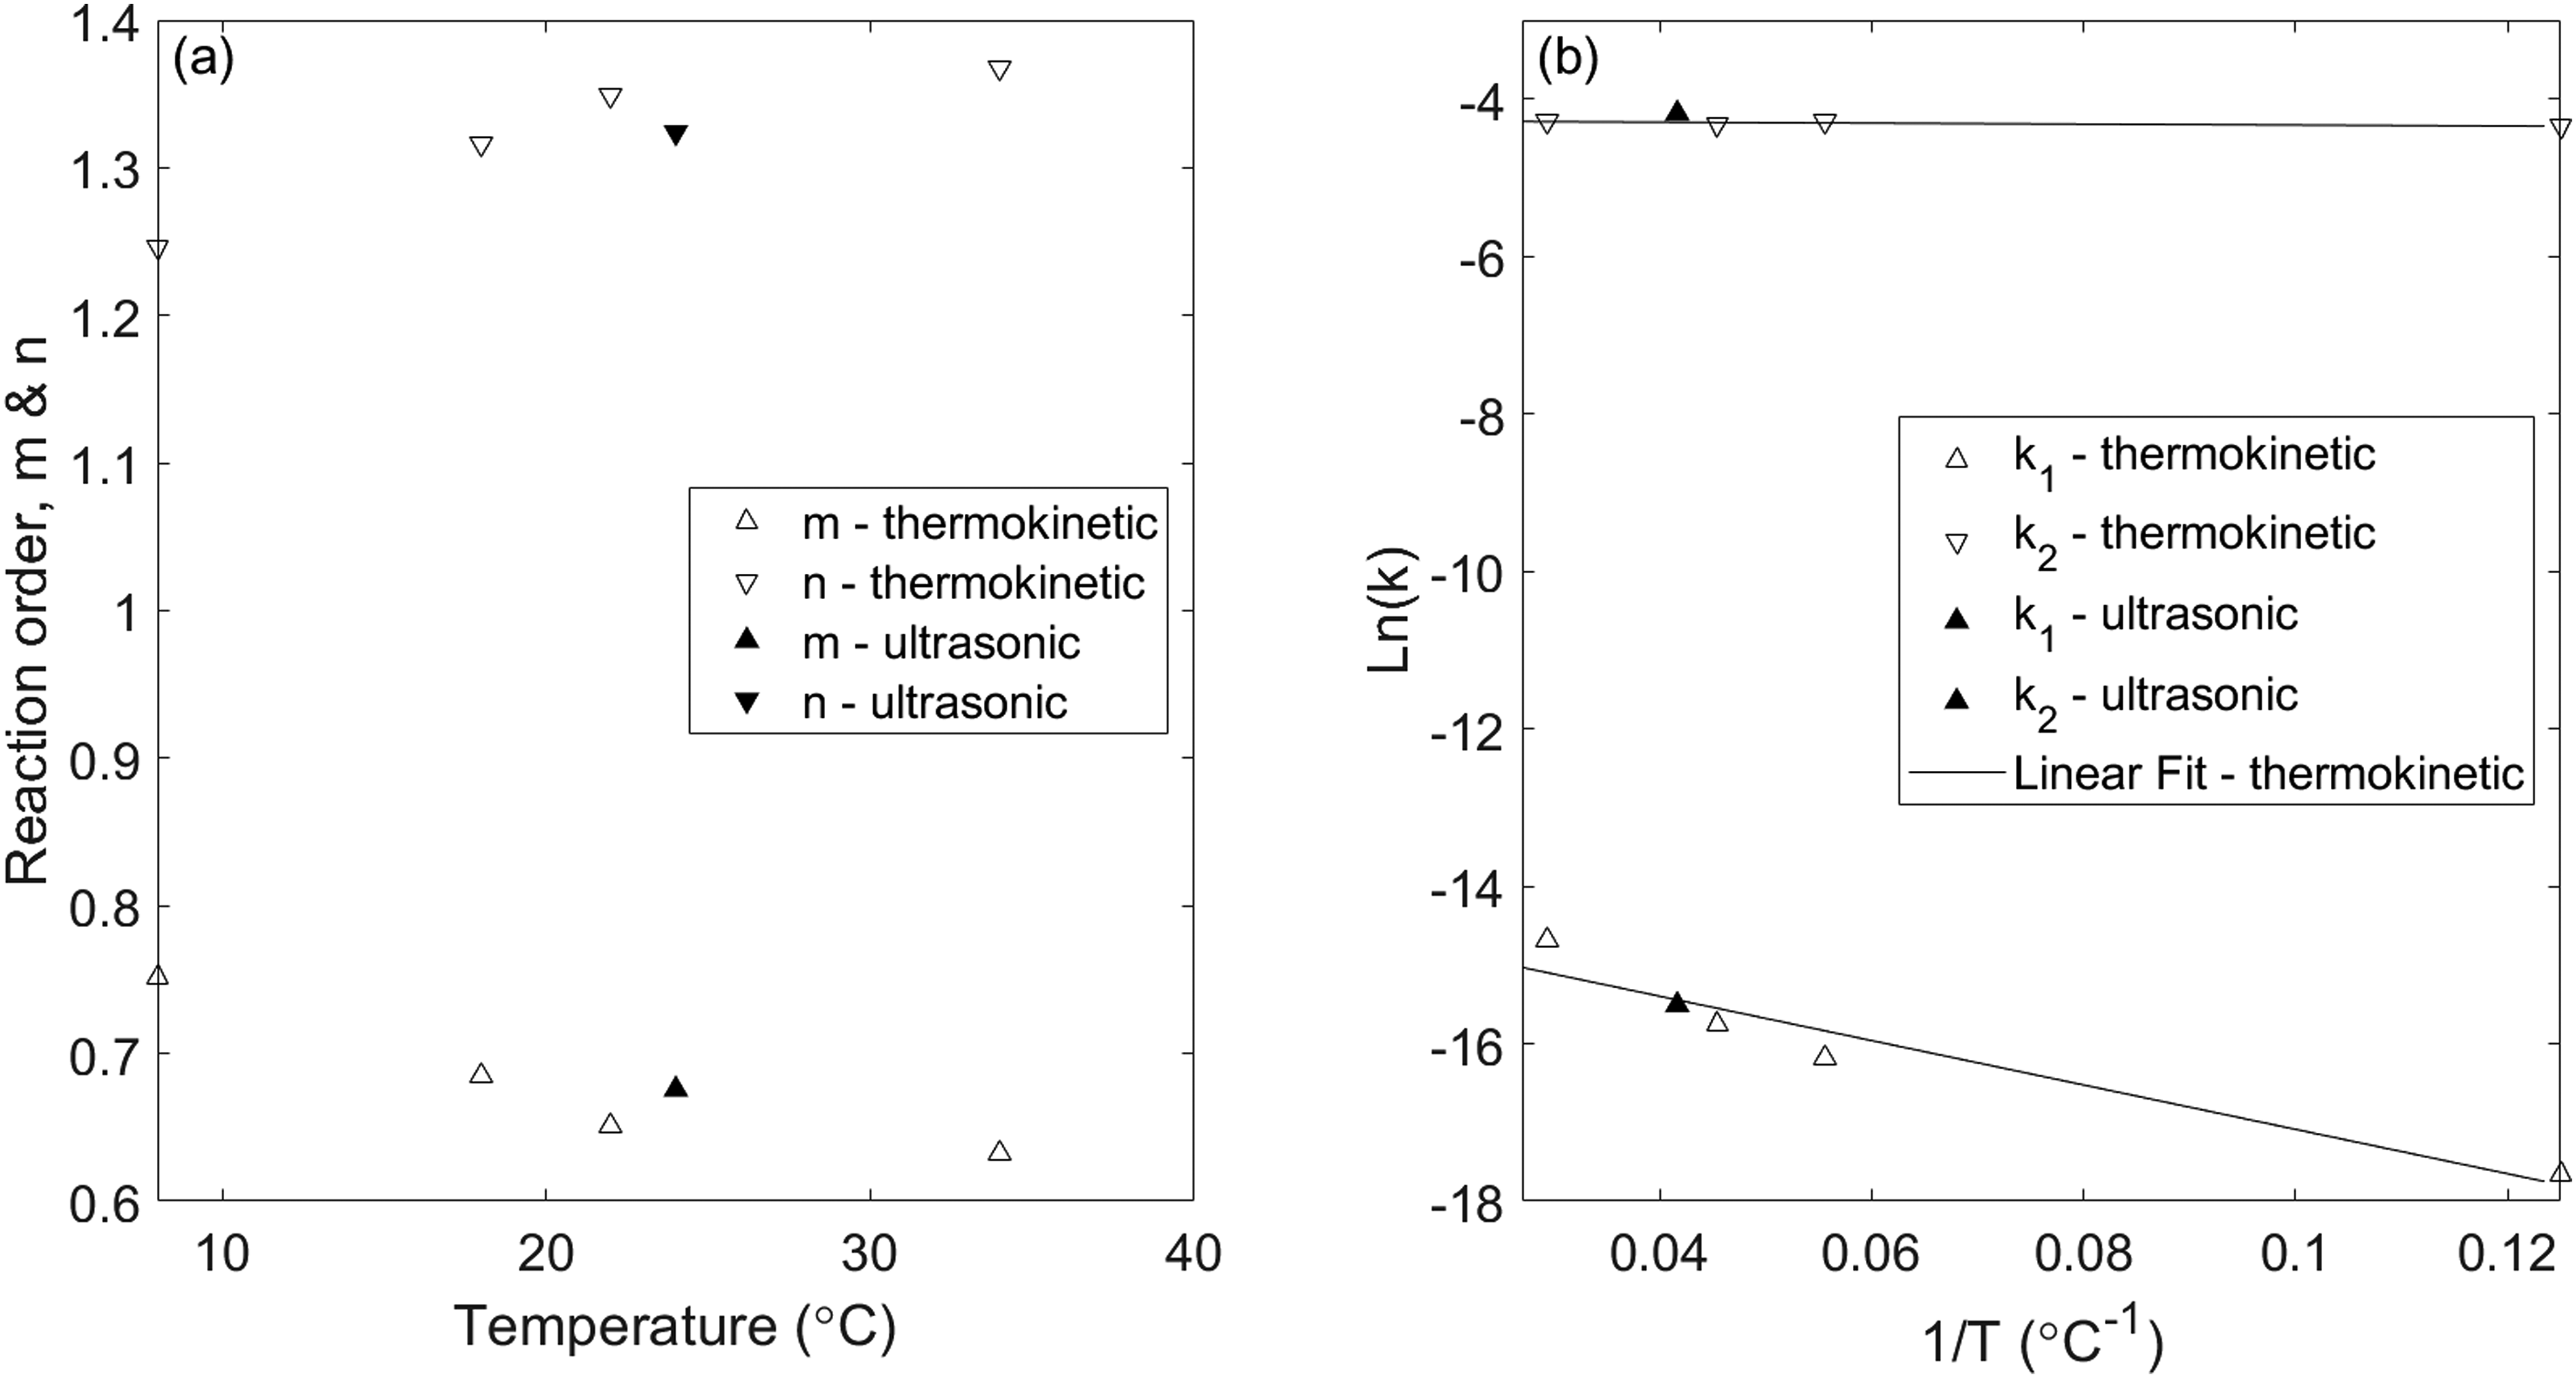
(a) Constants m and n as a function of reactant temperature for the four thermokinetic studies and the speed of sound study. (b) Arrhenius temperature dependency of rate constants k1 and k2 for the four thermokinetic studies and the speed of sound study. The linear fit is taken from the four thermokinetic studies only.
From a thermokinetic viewpoint, the cure profiles measured (Figure 6) were affected by the temperature of the reactants. The reaction rate is seen retarded when the reactants were cooled to 8 °C, and by increasing the temperature to 34 °C the reaction accelerated. Figure 6(a) shows the characteristic s-shape on the
At the outset, it had been hypothesised that the polymeric reaction was autocatalytic, and this was confirmed since
Kinetic model parameters for polyurethane foams at different temperatures.
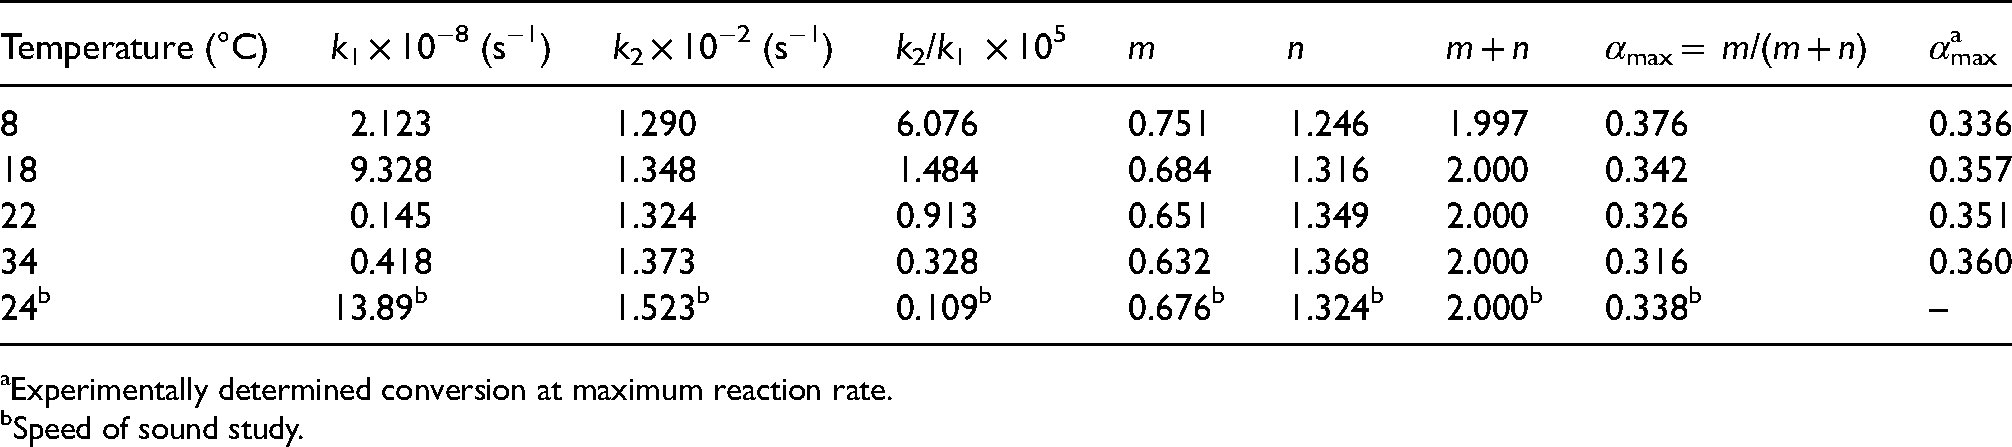
Experimentally determined conversion at maximum reaction rate.
Speed of sound study.
Figure 6 shows the speed-of-sound profile with those from the degree of cure. It can be observed that the gradient of
Predicting Poisson's ratio and foam stiffness via acoustic measurements
Figure 8 compares the values from the speed-of-sound set up (Figure 1) once the foam had completely cured with measurements taken separately on fully cured foam blocks using the Lab+ system. The figure shows good agreement between data collected using our method and those of the commercial system over the density range of the samples.
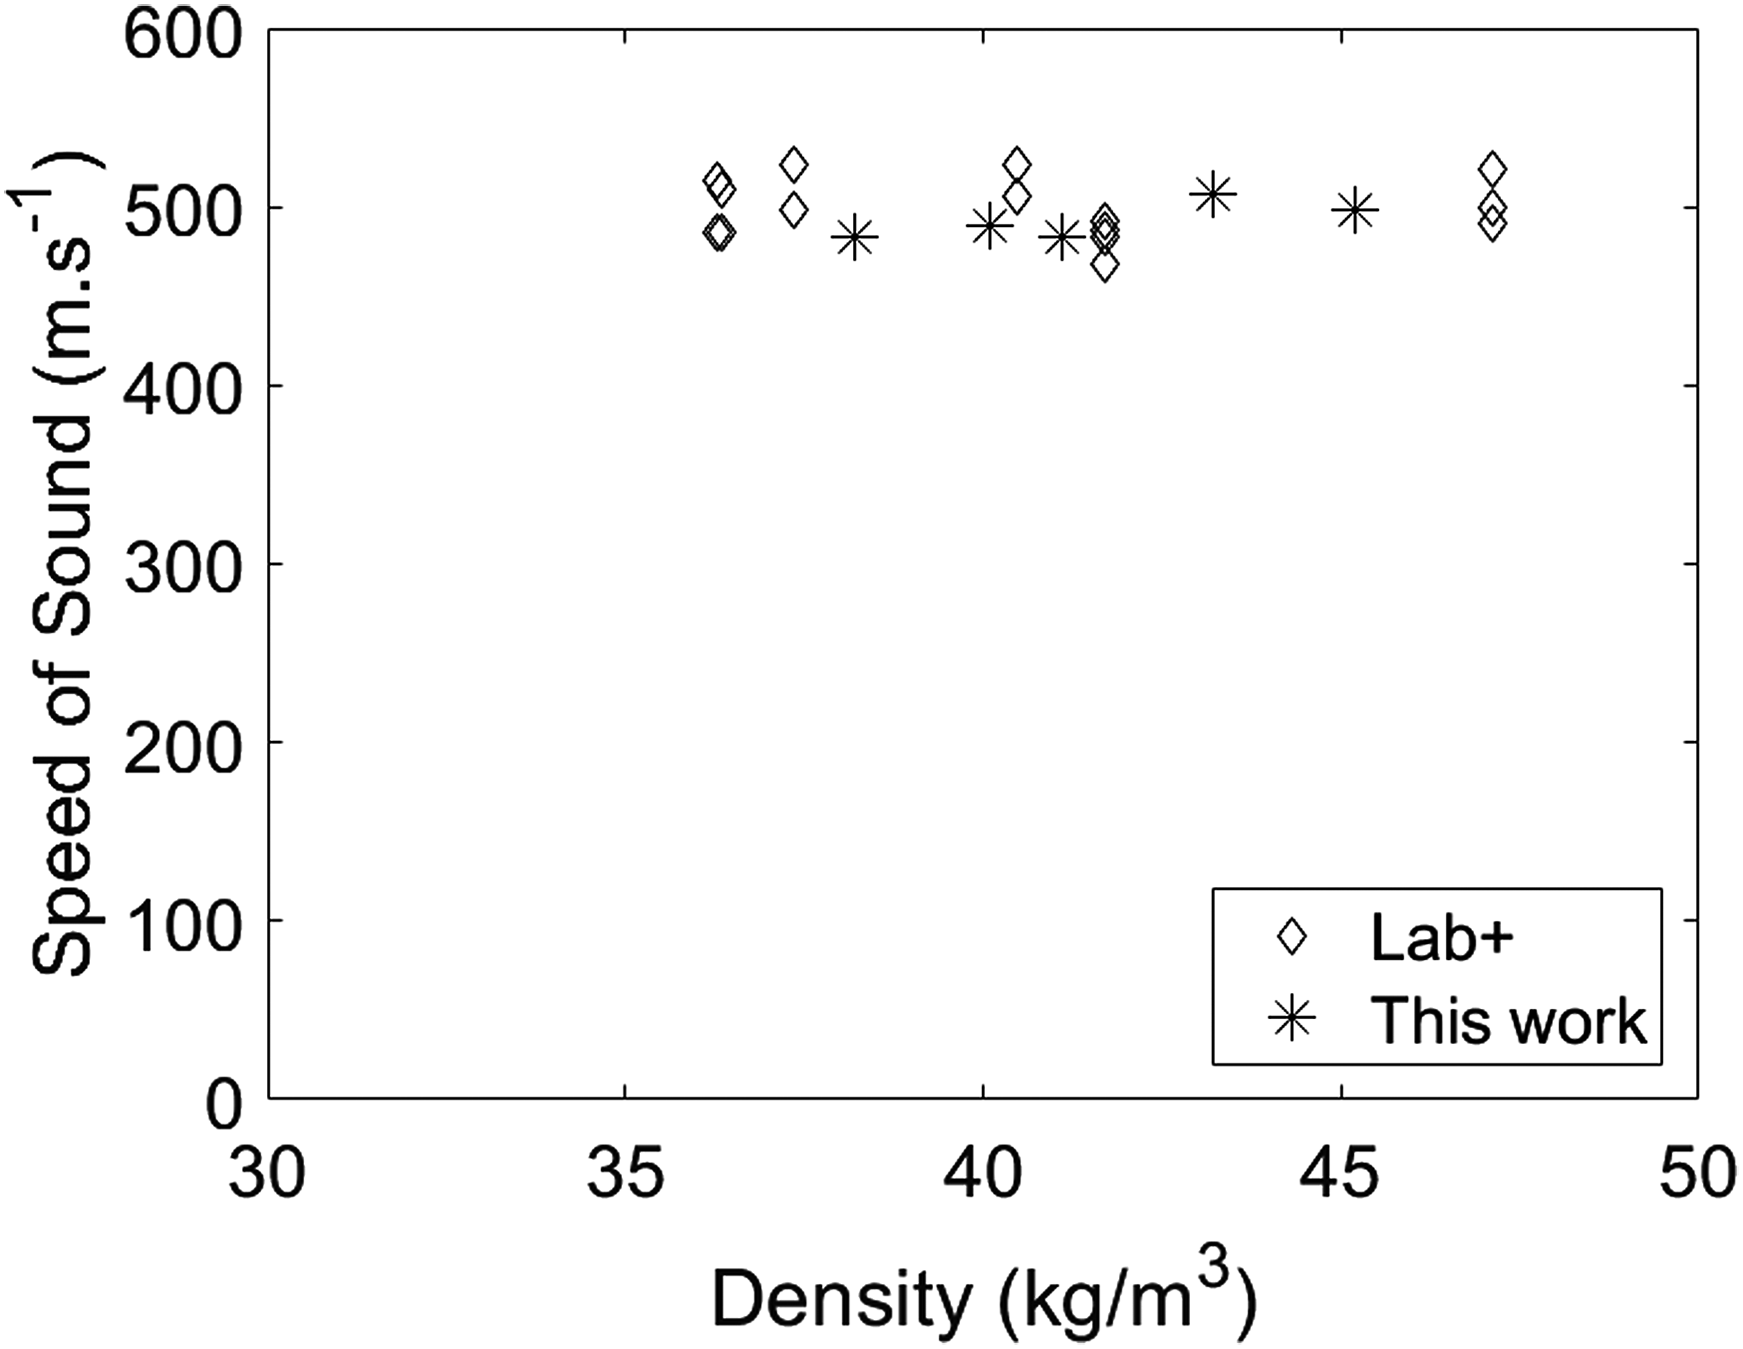
Speed of sound of cured foam blocks measured in this work and using Lab+.
The Poisson's ratio was calculated using equation (1) with a mean value equal to 0.3310 ± 0.0104. Figure 9 shows the stiffnesses obtained in this study (i.e., dark diamonds for the prediction using the measurement from the speed-of-sound method via the calculated Poisson's ratio (equations (1) and (2)); circles for the stiffnesses measured directly by compression-testing in a UTM) along with values reported by other authors on polyurethane foams over a similar range of densities measured by UTM
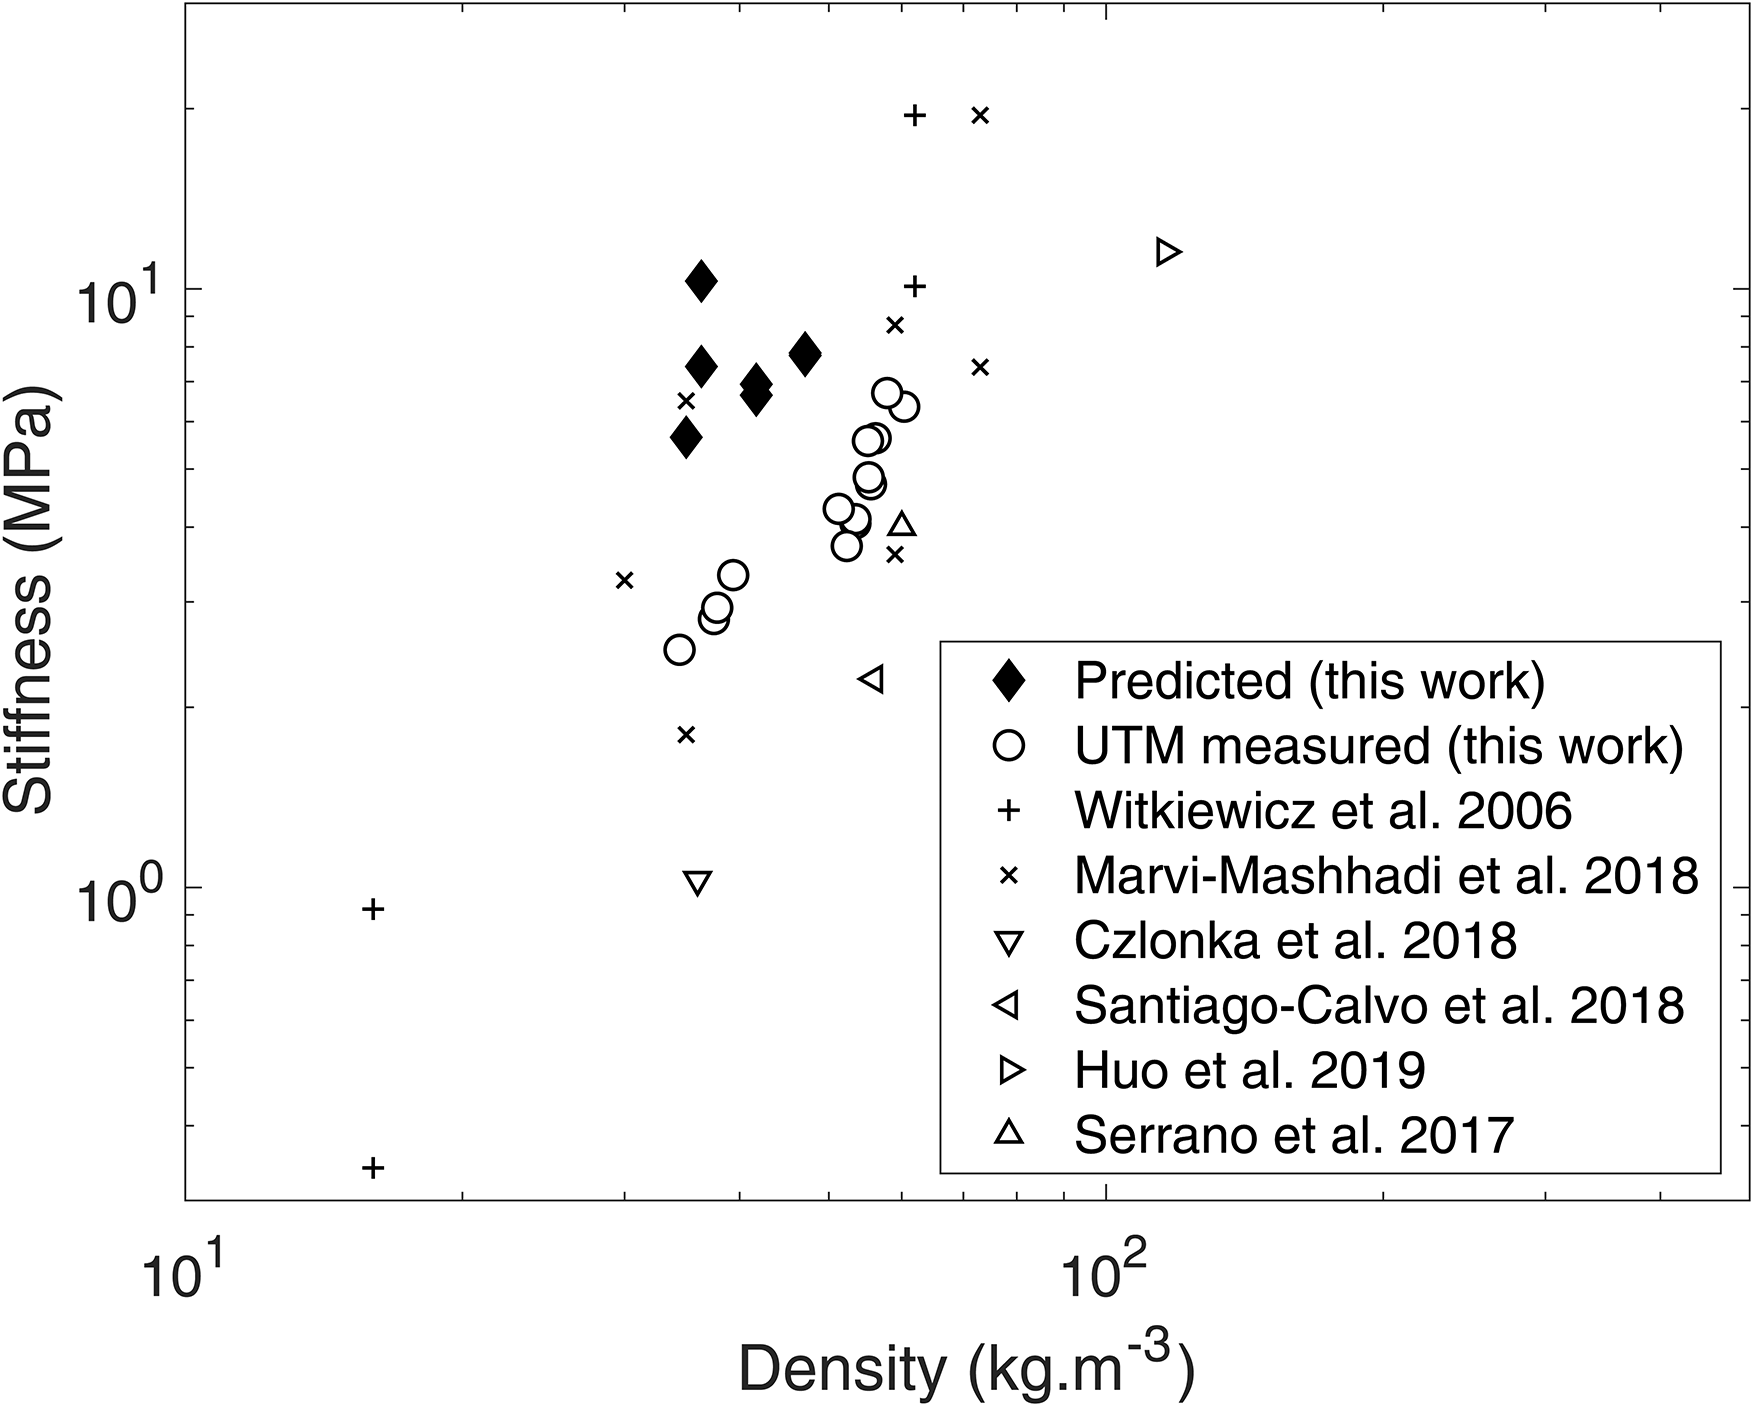
Foam stiffness against density for polyurethane foams measured from different testing methods. The predicted stiffness from ultrasound wave propagation of this work is shown as black diamonds, quasi-static compression measurements in this work using a universal testing machine (UTM) is shown as circles and quasi-static compression tests using UTM reported in the literature are shown as other symbols.22–28
The stiffness values obtained using the speed-of-sound method (‘predicted’) were greater than those obtained from compression tests (‘measured’) for the same polymeric foam (i.e., the dark diamonds vs. circles in this work). It is a reported phenomenon that dynamic approaches (such as the speed-of-sound here and the Lab+ equipment) will consistently overestimate the moduli values obtained from quasi-static methods such as UTM compression testing. In other words, compressive stiffness measured by UTM is static and wave propagation is a dynamic measurement.
29
It has been shown that increasing strain rates increase the modulus of the foam under test,
30
and a comparison of quasi-static moduli with dynamic moduli for polyurethane foams
31
has established that higher values are obtained from dynamic tests with a marked dependency on sample density and direction of testing (vs. foam rising direction). Other findings from typical industrial porous materials also reported that the dynamic moduli were higher than the quasi-static measurements at a rate of 125%
32
and 48.5%
33
for timber, and 105% for concrete.
34
The overestimation in dynamic measurements compared with quasi-static measurements show linear relationships between stiffnesses (or moduli) measured by the two methods. It is anticipated that with appropriate calibration the dynamic measurement of the foam (
Conclusion
A thermokinetic-informed acoustic technique is proposed as an in-line, non-destructive method to characterise and identify reaction stages (nucleation, rising, packing, gelation and curing) as well as a monitoring tool to follow degree of cure during bulk manufacture of a thermosetting foam. Autocatalytic kinetics have been confirmed since experimental results fit well through the degree of cure and an Arrhenius temperature dependence, although the process is not isothermal. The reliability of this tool has been established by comparison and agreement with well-established methods (foam expansion and electrical resistivity) to characterise foam reaction stages and thermokinetic analysis to assess the validity of the degree of cure measured by the proposed speed-of-sound method.
When used to calculate the stiffness of the foam, our method over-predicts the modulus when compared to quasi-static compression tests, which has also been seen in comparisons with other porous media (e.g. concrete and timbers). A linear offset between quasi-static and dynamic measurements remains, manifesting the differences in physics underpinning these two methods. Therefore, with judicious calibration, the measurement of the shear and longitudinal wave speeds could inform about the stiffness of a foamed part before it is demoulded. A desirable feature of this method is its suitability and convenience for both continuous monitoring in manufacturing and quality assessment of the final product.
Footnotes
Acknowledgements
The authors are grateful for the support from the EPSRC Centre for Doctoral Training in Embedded Intelligence and industrial collaborator Far UK Ltd; Mr G. Garcia-Romero and Dr M. Haghighi-Abyaneh for lab assistance; and Dr D. Ridley-Ellis, from Edinburgh Napier University, for access to the Pundit Lab+ equipment.
Declaration of conflicting interests
The authors declared no potential conflicts of interest with respect to the research, authorship and/or publication of this article.
Funding
The authors disclosed receipt of the following financial support for the research, authorship, and/or publication of this article: This work was supported by the Engineering and Physical Sciences Research Council (grant number EP/L014998/1).