
Abstract
This paper builds on earlier work that describes the design, build, and commissioning of a purpose-built tyre test rig that was used to investigate specialised tyres designed for Road-Rail Vehicles (RRVs), which operate on both roads and railway tracks. When on tracks, they can be used for various purposes including shunting heavily loaded wagons. That is the focus in this paper. A new empirical tyre model is proposed for simulating RRVs operating on rails. While many tyre models exist in the automotive sector, none have been adapted to simulate RRV performance on rails. The tyre model presented here is intended to be efficient, producing optimal design information with a minimum set of parameters and hence a manageable test process to generate the data to parameterise it. As the model is intended for shunting operations the focus is on modelling the tractive performance as a function of longitudinal slip. The full formulation of the QUALITYRAIL (QUAdratic to LInear TYre to RAIL) tyre model is presented. The results from a tyre test programme were used to generate a data set that allowed the formulation of a model representing variations in speed, load, and wet or dry conditions. A further set of physical testing was carried out in the wet and dry at different loads and speeds to validate the new tyre model. The data points for these tests were independent of the original test programme to ensure a rigorous approach for the validation. The results of this study demonstrate that the novel tyre model can efficiently and accurately represent the tractive performance of a pneumatic tyre acting on rails at various speeds and loads in both wet and dry conditions, with potential to contribute through simulation to improve the design and performance of future RRVs.
Introduction
The work described in this paper follows on from earlier studies1,2 where a specialised tyre test rig was designed, built, and commissioned. A bespoke tyre intended for use with Road-Rail Vehicles (RRVs) was subject to a series of tests looking to evaluate the tractive performance of the tyre when running on a railway track. The ultimate aim of that work was to generate a data map of the tyre performance over a range of conditions in order to understand the behaviour of the tyre and develop the mathematical representation for an empirical tyre model that could be used in simulation models during the design stages for an RRV.
Road-rail vehicles
Road-Rail Vehicles have become established since the middle of the last century and are able to fulfil tasks within the rail sector that would be impossible with standard road or rail vehicles. An example of this would be the vehicles required for construction work or maintenance operations in areas that due to the local geography are difficult to access. This is particularly relevant in mountainous countries such as Switzerland, where the work described in this paper took place. In these situations, it is desirable to have the use of a vehicle that can drive on both the road and on a railway track. The journey on the road could involve travelling from the company depot to the region where the work is taking place followed by a shorter journey on rail track to the remote work site, which is inaccessible by road. Another advantage of using an RRV for operations like this is that for maintenance work it may only be possible to close the rail network and carry out the work at night. Using an RRV means it is possible to take the vehicle off the track, park up during the day, and rejoin the track to carry on work the next night. This would not be possible using a rail only vehicle fitted out for these activities.
Supporting construction and maintenance is not the only way in which RRVs can be used. As described in Müller et al.1,2 RRVs are also used for shunting operations to move wagons and loads around the rail yard. Traditionally this work has been done by standard rail engines which are also used to pull wagons and carriages on the main rail lines. Using an RRV for shunting operations offers a number of advantages compared with a standard rail engine. A pneumatic tyre can generate more friction at the rail-head than a standard steel rail wheel. This means that an RRV fitted with a smaller power unit can efficiently pull similar loads to those pulled by a much larger standard rail engine.
RRVs are used for shunting operations all over the world. The market is clearly not as large as that for the automotive sector but is of sufficient size to justify the development of design tools to enable more efficient vehicles to be produced, or to investigate new design concepts that can enable efficient and safe travel on either the road or railway track. In Switzerland manufacturers and sellers of RRVs estimate that about 100 vehicles are in use and that about the same number of classic shunting engines await replacement. In Germany the number of RRVs is much larger, closer to 2000, but for both Switzerland and Germany there is no exact data. For the UK, the Rail Accident Investigation Branch (RAIB) lists 1669 RRVs, of all types, in operation at the time of publication. 3 For this report there are no statistics available concerning how many are of these RRVs were used for shunting operations.
Figure 1 shows a range of RRVs that are currently in service and used for shunting operations.
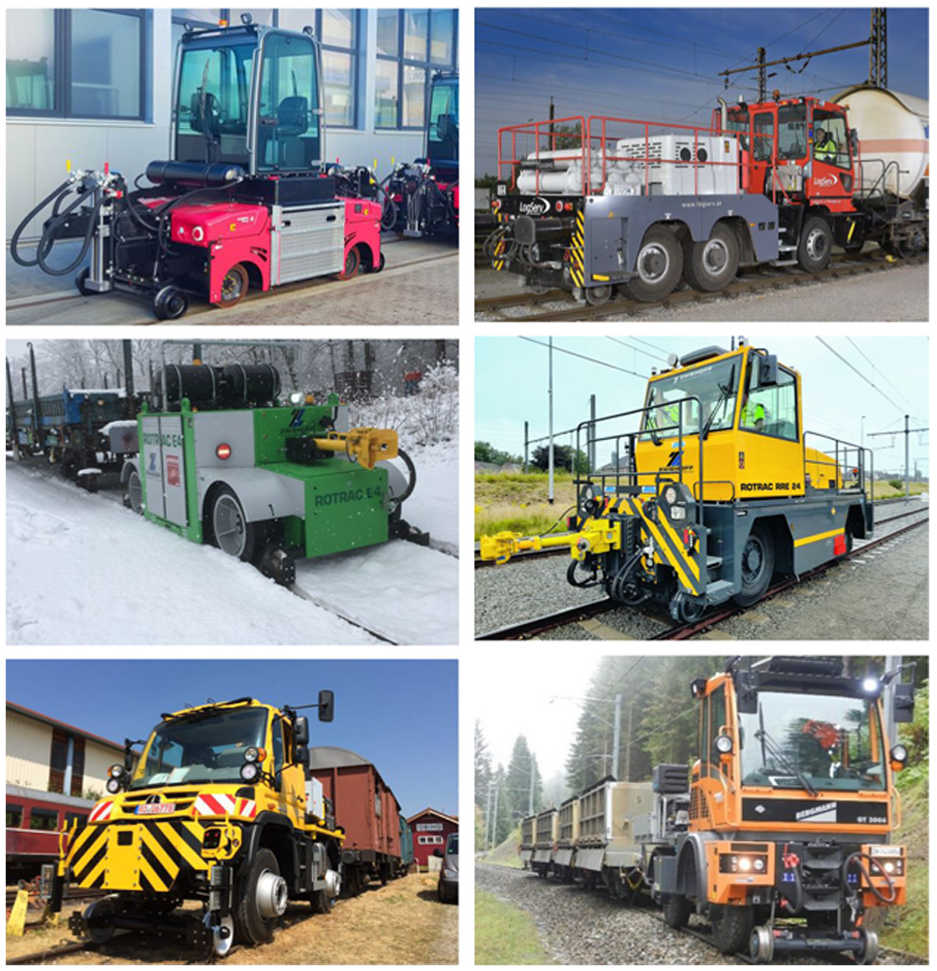
A selection of recent RRVs for shunting purpose. Courtesy of Zagro Gmbh (top), Zwiehoff GmbH (centre and bottom left), Müller (bottom right).
Computer simulation
In the automotive sector it has been common practice for more than half a century to make use of advanced computer simulation to support the design and development of new vehicles. The use of a virtual prototype can eliminate the amount of physical testing of an expensive prototype and lead to highly optimised products. For a vehicle this can ensure improvements in safety, reliability, cost efficiency, and a more enjoyable driving experience. In a competitive market where cost and weight are highly constrained the use of simulation is essential.
In the area of vehicle dynamics and safety the use of simulation can reduce the amount of testing at the proving ground where tests are carried out to evaluate the ride and handling performance of the vehicle and the durability of suspension components. Testing is also carried out in other areas such as crash analysis to evaluate the performance of vehicle crash structures and occupant protection systems. In the past the idea of eliminating physical testing due to the availability of sophisticated computer models has been considered. But, a more realistic expectation appears to be that physical testing should be a performance confirmation exercise, and there should be “no surprises at test.”
The area where tyre modelling is most relevant is vehicle dynamics and there are a number of simulation tools that can be involved during design and development. These can be fundamental tools such as Matlab which are useful for modelling the mathematics involved with associated control systems, particularly with the increased use of automation, torque vectoring and the research and development involved with path following for self-driving autonomous vehicles.4,5
For the work described here the interest is more in developing a tyre model that can be eventually used for the Multibody Systems (MBS) simulation of RRVs. Multibody Systems Analysis is very well established in the automotive industry6–12 and programmes such as ADAMS or Simpack are now widely used within the sector. For cars, trucks, and motorcycles it is necessary to make use of an associated tyre model, but there are other applications such as tracked vehicles used in construction or military applications where MBS models have been used extensively.
It should be noted also that in the area of simulation the ability to exploit Artificial Intelligence (AI) or Machine Learning (ML) is of growing interest. An example of this, in the area of vehicle safety, is the work13,14 carried out to investigate the protection of occupants in rotated seats for future autonomous vehicle applications. The simulation models used here were very computer intensive and the use of ML allowed a study into a wide range of seating scenarios that would not be practical with a conventional simulation approach.
It should be noted that while the discussion so far has related to desktop simulation the use of physical driving simulators 15 is increasing and is now considered an important intermediate step between the desktop and the proving ground. These simulators can be used to not only evaluate changes in vehicle settings, but also for human factors studies. Examples of this include studying how drivers would react to a sudden transition from autonomous driving back to human driver control. Although a driving simulator is a physical laboratory-based facility, it does require a representative mathematical model of the vehicle and its tyres in order to calculate representative vehicle dynamics responses in real-time.
For RRVs the vehicle fits within two sectors, rail and automotive. While MBS models are well-established in the automotive sector it should be noted that the rail industry also makes use of MBS models through products such as ADAMS/Rail. 16 While tyre modelling is well established for automotive applications, and the modelling of the contact forces between a rail wheel and railway track 17 is known for railway simulations there is still a knowledge gap for RRVs when considering the behaviour of a rolling pneumatic tyre on a steel rail-head. To date, the development of a tyre model to support the simulation of an RRV driving on a railway track has not been achieved.
Tyre modelling
In the automotive sector, it is standard practice to accumulate extensive test data to create tyre models for predictive engineering. The method used to model a tyre is dictated by the intended simulation and how it will support the vehicle design process. The two main areas associated with vehicle dynamics are ride and handling. The durability of suspension components is another area that fits into chassis engineering that also requires the use of simulation and representative tyre models. In addition to these mainstream activities there are also other areas such as the simulation of off-road vehicles where the representation of the tyre can involve areas such as soil mechanics and require quite a different approach.18,19
The aircraft sector also gets involved in tyre modelling to support the computer simulation of an aircraft when on the ground for take-off, landing, and runway taxiing manoeuvres. An example includes the empirical aircraft tyre model that Wood et al. 20 developed using the test data obtained from the Airbus Terratyre tyre test machine. The very high loads involved with testing an aircraft tyre made it difficult to test the full range of conditions needed to obtain the parameters required for existing automotive tyre models and led to the development of the dedicated aircraft tyre model developed in that study.
A physical representation of a tyre involves, as the names suggests, a model that represents the geometric and material form of the tyre carcass and its boundary conditions with the wheel. This approach typically involves building a finite element model. This, however, requires detailed and often confidential information describing the tyre’s material properties and construction and as such is more commonly used in research or in design and development process by tyre manufacturers. 21 Apart from this, the structure of a tyre carcass is complex, meaning that it requires considerable effort and time to build a detailed finite element model. It also means that the computing requirements will be too intensive to use a model like this for the ride and handling simulations performed that represent the tests carried out at the proving ground.
Nevertheless, for durability analysis there is a need for a model that can accurately represent the proving ground tests carried out on a durability circuit. For these applications the model needs to represent the deformation of a tyre, and the forces generated as it encounters obstacles such as potholes or kerbs. This requirement has led to another class of tyre model that can represent a deformable tyre carcass and use parameters obtained by rig testing. The model must also run quickly enough to be used in the vehicle design process. These types of models use an assembly of masses, spring and beam elements, and contact forces, and are often referred to as semi-physical models. The components of the model are not intended to exactly represent discrete elements of the tyre carcass, as with a finite element model, but rather to represent the physical behaviour, deformation and force generation, of the tyre. The model parameters can be obtained by testing the tyre on a drum type tyre test machine fitted with cleats in order to obtain the modal responses of the tyre, and then “tuning” the model parameters to fit the test data and ensure a good representation of the tyre’s physical behaviour. Semi-empirical tyre models such as FTire 22 and CDTire 23 are often used for ride or durability analysis but it is the empirical tyre modelling approach that has been mostly used for the simulation of vehicle handling manoeuvres.
An empirical tyre model represents the force and moment generating characteristics of a tyre found by measuring these on a tyre test machine. These models are well suited to vehicle handling simulations and the most established of these is the Magic Formula tyre model24–31 based on the seminal work of Pacejka. This model has been used extensively within the automotive industry for decades and is now more commonly referred to as the MF-Tyre model. The model is proven to be accurate but does require a large number of parameters which are derived from the results of a tyre test. The different ways in which a tyre can be tested was summarised in Müller et al.1,2 and can involve the use of flat-bed test rigs 32 or drum machines for laboratory testing. The use of a truck, trailer, or vehicle-based test rig, such as the VBOTT vehicle 33 used by Jaguar Land Rover to test outdoors was also described.
The flatbed type of tyre test machine, such as the one at Calspan in the USA, 32 is often used to test tyres to gather data and generate the parameters for an empirical tyre model used in a vehicle handling simulation. In order to do this the tests should cover the range of conditions that the tyre will experience when in use on a vehicle. This will involve running tests for a range of loads, slip angles, camber angles, and slip ratio. Since none of these change in isolation the testing must represent and capture this.
The MF-Tyre model has grown in capability to such an extent that in its full version it requires many, in excess of 80, model parameters to be defined. This in turn means that the amount of testing carried out can be an extensive and expensive task. This was addressed by Smith and Blundell 34 in their work to develop a more efficient testing process, referred to as GS2MF, while still generating sufficient data to fully populate the model. That work was carried out using the Calspan tyre test machine and the MF-Tyre 6.1 version of the Magic Formula tyre model developed by Besselink and his associates. 31
Other empirical tyre models exist that are simpler in form with a much smaller set of tyre parameters. These include the Fiala tyre model 35 and the Harty model. 36 The Fiala model makes use of only 10 parameters but has a number of limitations such as the inability to model combined slip. Despite this it was shown in Blundell 11 that reasonable agreement could be obtained for a Double Lane Change manoeuvre when using the model and comparing outputs from an ADAMS simulation with proving ground data. Harty developed a more sophisticated model, 36 but still with only 13 parameters to deal with the more challenging requirements of motorsport vehicle dynamics. In that study the model was run on a virtual tyre test machine. Comparing the results with those from a physical tyre test showed that the Harty model was capable of accurate predictions. Despite the availability of these low-parameter tyre models it is recognised that due to its proven accuracy, wide capability, and supported development the MF-Tyre model is the main model used by the automotive sector for vehicle handling simulations.
Although these well-established tyre models are used within the automotive sector, there is no example in the literature where a tyre model has been used for an RRV to simulate the interaction between road tyres and rails.
The QUALITYRAIL Tyre Model has been specifically developed to address the unique traction characteristics observed in RRVs operating on steel rails under high normal loads (15–35 kN) and low-speed conditions (typically below 20 km/h). Unlike conventional road or aircraft tyres, the tyre–rail interface exhibits a distinct behaviour: a rapid increase in traction force up to a moderate slip ratio (approximately 0.1–0.2), followed by a continued and often linear increase (dry) or decrease (wet) in force at higher slip ratios. This behaviour cannot be reproduced using standard tyre models such as the MF-Tyre, Fiala, or Harty. The MF-Tyre model, even in simplified form, requires 12–24 parameters and inherently assumes a peak followed by saturation or decline, while Fiala and Harty are structurally constrained to saturating force characteristics and lack the flexibility to model rising post-peak behaviour. This is not a criticism of these models, but rather an expected behaviour for a model representing pneumatic tyres operating on road surfaces.
In contrast, the QUALITYRAIL model employs a minimal empirical structure, using only three physically interpretable parameters: the slip ratio at peak force (x1), the peak force value (y1), and the force at full slip (y2). These parameters are directly observable in test data and can be expressed as simple functions of vertical load and speed, making the model both easy to calibrate and transparent in its behaviour. High-fidelity physical models such as FTire, CDTire, or finite element approaches, while powerful, are not suited to this context due to their high computational cost, complex parameterisation, and limited applicability to the specific operating conditions of RRVs.
Given that the RRV market is a niche sector, the use of highly generalised or reduced versions of existing road-tyre models is neither efficient nor sufficiently accurate. Instead, the QUALITYRAIL model provides a dedicated, fit-for-purpose solution: compact, empirically grounded, and capable of capturing the essential tyre–rail interaction characteristics with minimal complexity.
Most established tyre models incorporate parameters that allow for the prediction of the tyre forces and moments generated in the tyre to road contact patch, and how these depend on tyre states such as slip ratio, slip angle, camber angle, and vertical load. These calculations can be performed for combined (cornering and braking) or pure (cornering or braking) slip.
By contrast, the interaction between road tyres and rails, important for shunting use-cases, is significantly less complex. The primary focus is on longitudinal traction and braking forces, which are influenced by tyre properties, rail conditions, load, and speed.
The work in this paper does not yet address an RRV running on a curved track and introducing some degree of lateral slip that has a potential impact on traction. The railway industry has historically modelled the forces between rail wheels and rails to predict rail wheel behaviour under different traction or braking conditions, referred to as “creep.” No attempt has been made to adapt these models to road tyres operating on rails, so a decision was taken to develop a dedicated tyre model that can effectively and efficiently address the distinct needs of the operations within the RRV industry and is specifically tailored to the unique requirements of road tyres operating on rails. The only examples found where a computer model has been developed to represent an RRV tyre when in contact with a rail-head were in Gupta et al. 37 and Pradhan et al. 38 In both studies the authors developed detailed finite element models using the ANSYS programme to represent the tyre and the rail. However, in these studies the work was limited to a static analysis of the tyre in contact with a rail and not the more complex scenario of a rolling tyre and the prediction of tractive forces. The work in Gupta et al. 37 and Pradhan et al. 38 is however useful for understanding the variation in contact stresses and deformation of the tyre contact area for variations in tyre pressure.
The emphasis in the work reported here has therefore been to develop a tyre model that is efficient and fit for the purpose of simulating the behaviour of an RRV when driving on rail track. When considering the motivation for this it is still relevant to consider the important comments of Sharp in 1991 39 : “Models do not possess intrinsic value. They are for solving problems. They should be thought of in relation to the problem or range of problems which they are intended to solve. The ideal model is that with minimum complexity which is capable of solving the problems of concern with an acceptable risk of the solution being ‘wrong’. This acceptable risk is not quantifiable and it must remain a matter of judgement. However, it is clear that diminishing returns are obtained for model elaboration.”
Following those principles a dedicated model has been developed that is intended to provide the optimum information to support an RRV design using a tyre model with a minimum set of parameters that have physical significance, are easily understood, and can be obtained readily from testing.
In the next section the range of tests performed to generate a data map of the RRV tyre behaviour, and the mathematical model developed following the principles described above is described.
Development of the tyre model
Tyre test programme
In order to understand the behaviour of an RRV tyre when operating on rails it was necessary to design and build a bespoke tyre test rig for this project. The design, construction, and commissioning work for the test rig was described in the original papers for this study.1,2 All that work, and the subsequent testing, was carried out using the rail track within the Müller Technologie company site in Frauenfeld, Switzerland.
The studies carried out1,2 showed that although extensive work had been carried out to develop tyre test facilities and procedures for automotive and aircraft tyres, there had to date been no use of a test facility that could predict the tractive performance of an RRV tyre when operating on rails. That led to the design build and commissioning of the test rig used to measure the behaviour of a tyre and generate data that could be used to develop the tyre model described here.
The only other example found of where a test rig has been developed to study the behaviour of an RRV pneumatic tyre when in contact with a rail-head was in Pradhan et al. 38 but in this work the authors were only carrying out static tests in a laboratory environment and were not carrying out the type of testing described here to investigate a rolling tyre and to determine the tractive driving and braking forces needed to parameterise a predictive model for RRV shunting operations.
The design of the test rig was informed by a number of operational requirements listed below:
(i) Initial testing would focus on a braked wheel rather than a driven wheel. This greatly helped with the build of the test rig as it meant the rig could be pushed or towed by one of the readily available shunting engines rather than being self-propelled and requiring its own drive train. This did involve the assumption that the relationship between braking force and slip was symmetrical to that between driving force and slip. The future work described at the end of this paper will discuss the ongoing development of the rig to include a drive train.
(ii) The facilities at the test site would allow the testing of standard solid or pneumatic RRV tyres on normal steel rails with tyre loads up to 100 kN. The length of track available meant that during a single test run it was possible to have several repeatable events where the test wheel experienced a longitudinal slip ratio ranging from 0.0 (free rolling) to 1.0 (fully braked with a locked wheel).
(iii) The rig should be robust, weatherproof, and portable so that it could be relocated to another test site if needed. The rig should also be able to accommodate adjustments in slip angle between −3° and +3° and allow for lateral adjustments in the position of the test tyre relative to the rail-head.
(iv) The rig should be able to test for a range of environmental conditions. The initial testing focused on wet and dry conditions, but the rig design was intended to accommodate future testing for other contaminants such as snow, ice, mud, and leaves. For the initial work the wet rail testing was accomplished using a dedicated water tank installed on the rig allowing water to be piped on to the rail-head in front of the test tyre. Future work will investigate the effectiveness of friction enhancing devices that can maintain good traction by eliminating rail contaminants and the rig was designed to accept these future modifications.
The test rig and test tyre are shown in Figure 2. The tyre used for the testing and modelling work was a Continental HGV 10R22.5 radial tyre. These tyres are modified for RRV usage by fitting a Pneu Egger tread-less bandage as shown on the right in Figure 2. The smooth area of the bandage provides more contact area between the tyre and the rail. Although this improves grip in dry conditions it was important to also test in the wet and understand any compromise in the available friction resulting from the absence of tread in the tyre-rail contact patch.
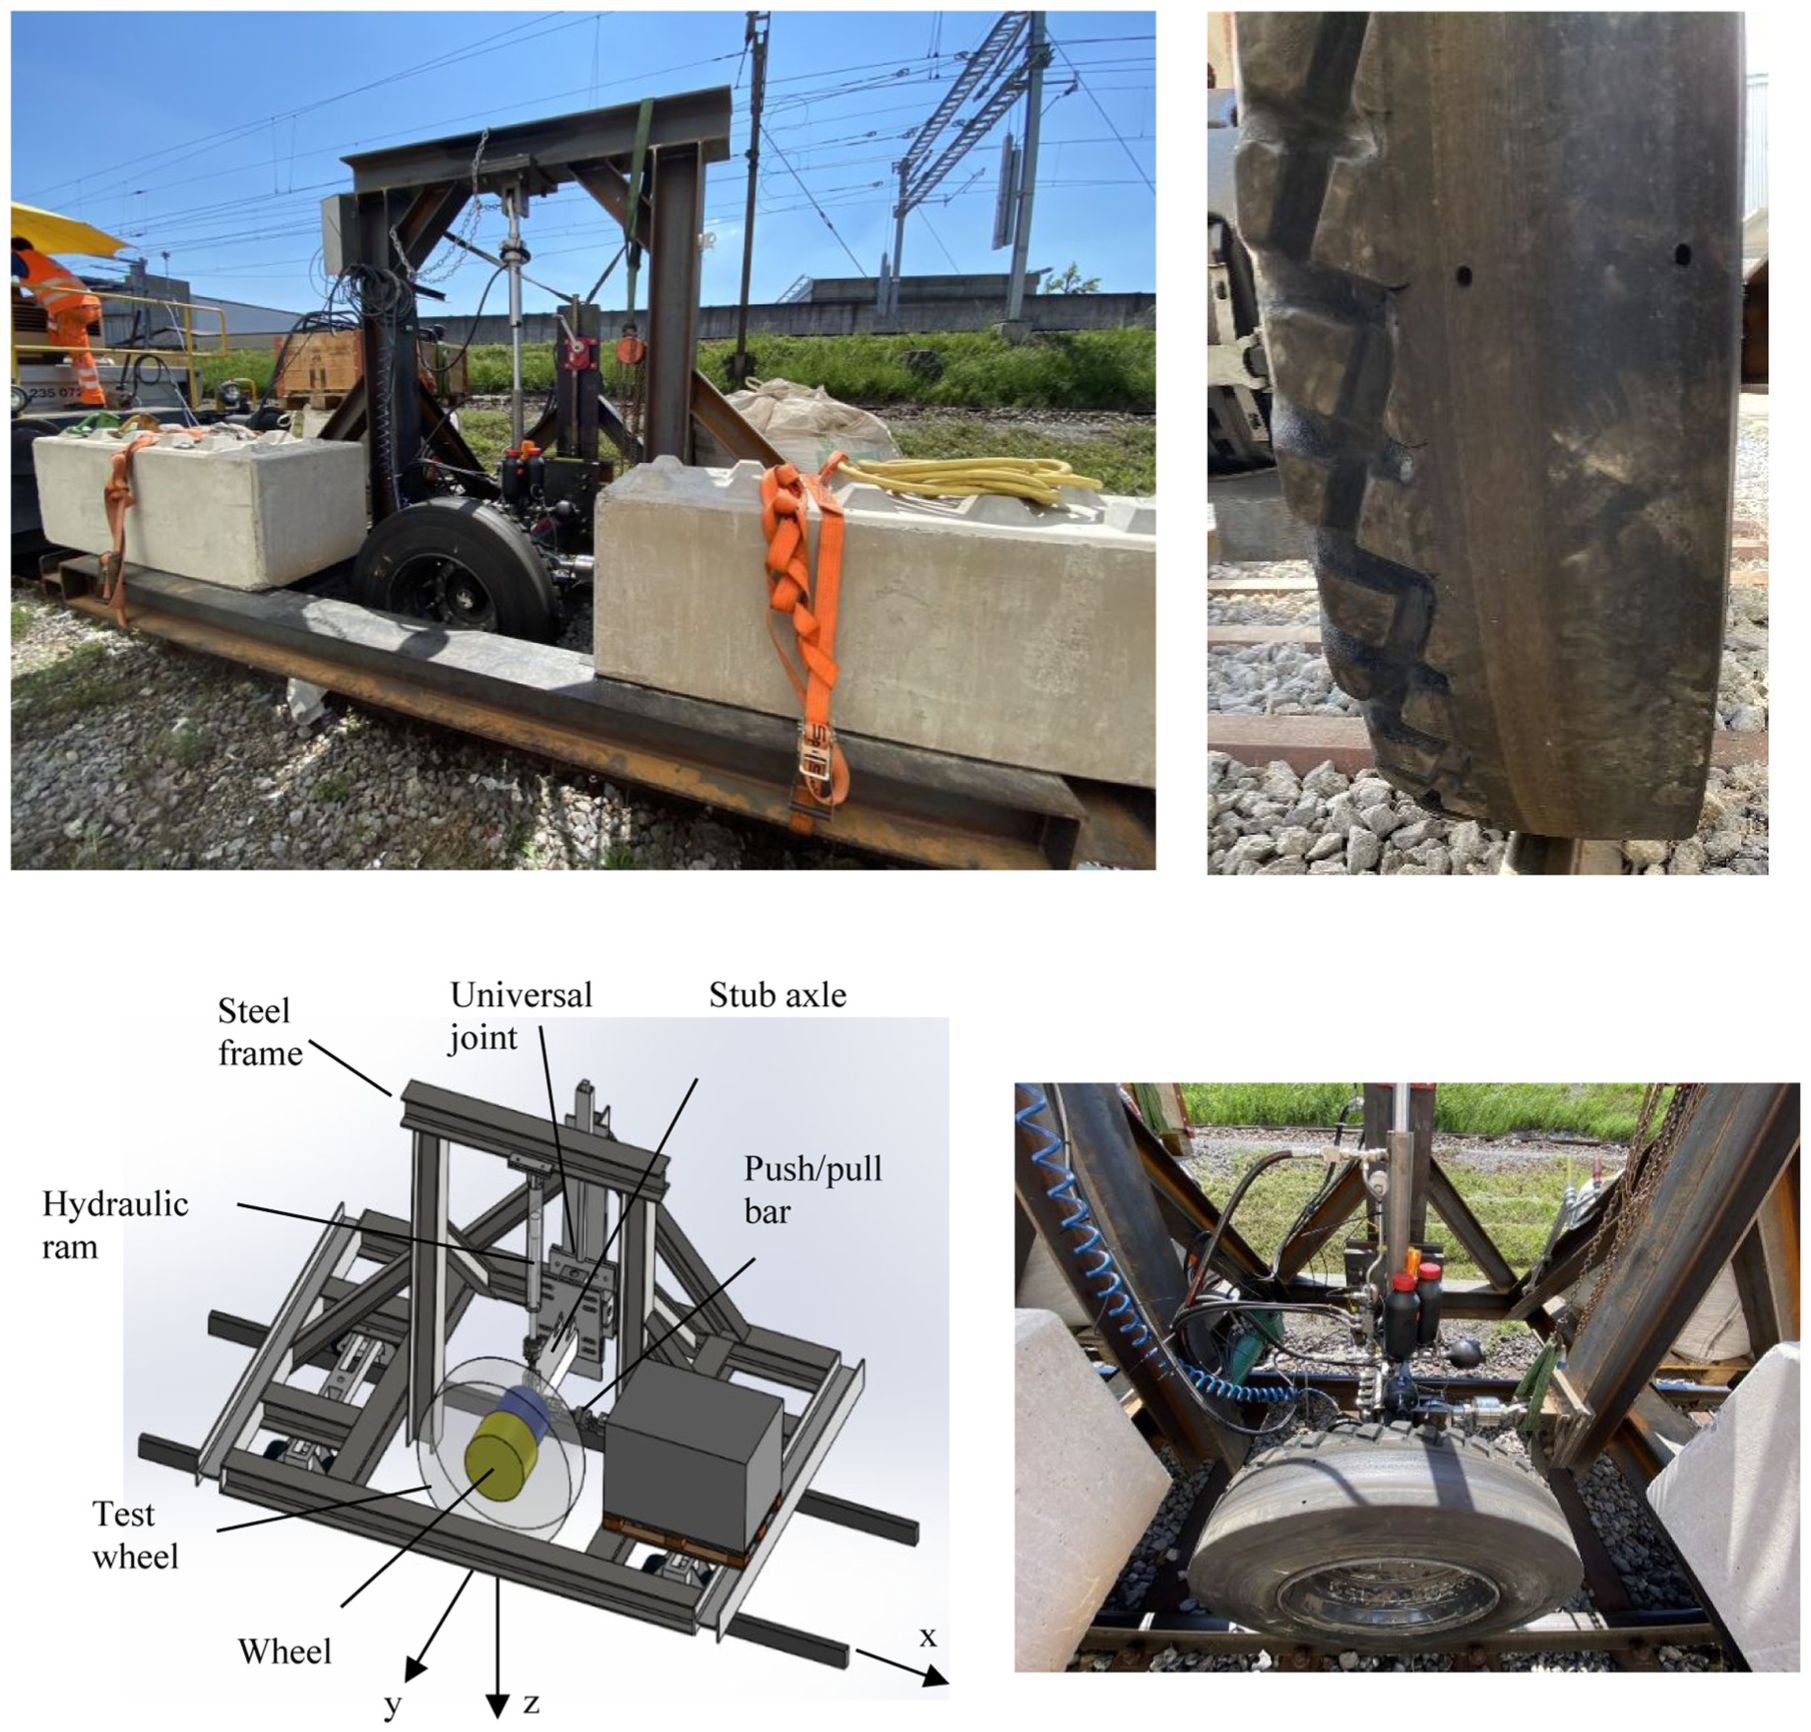
The RRV tyre-rail test rig and test tyre.
During the testing a shunting engine was used to pull the rig along the track. A hydraulic ram acting between the rig and the wheel was used to vary the vertical load on the tyre and the rig required substantial ballast, as shown in Figure 2, to react the high loads and avoid lifting the rig. A schematic is also provided at the bottom left in Figure 2 showing the main components for the rig. The bottom left and right images were previously published in Müller and Blundell 1 but are included again here to support the description of the test rig.
The mathematical basis of the tyre model described in the following sections was developed using the output of a comprehensive programme of tests performed using the test rig. During that exercise each test involved varying the slip ratio between 0 for a free rolling tyre, and 1.0 for a fully locked and sliding tyre for a tyre inflated to its rated pressure. The tests were repeated for a range of loads and speeds on clean rails in dry and wet conditions in order to understand the friction available in these circumstances.
The load capacity of the test rig was specified to accommodate the in-service loads of an RRV tyre when operating on rails. The tyre used for this test programme was restricted to 34 kN normal load during road use. In railroad mode, the steel guiding wheels take 25% of this load following the guidelines provided in the relevant European Standard. 40 Based on this the standard loading condition for the test was 25.5 kN. While the RRV is pulling or pushing railway wagons using a push and pull bar, the pushing and pulling action will exert a moment around the lateral of the vehicle. The resulting weight transfer leads to an increasing load on one road axle and a decreasing load on the other. To account for this, tests were also performed at loads that were higher or lower than the standard loading condition. Therefore, tests in both dry and wet conditions were performed at all three loads: 18.5, 25.5, and 30.5 kN.
For both dry and wet conditions, the tests were repeated for three test loads (18.5, 25.5, 30.5 kN) and three speeds (4, 8.4, 16.3 kph). This led to a matrix of 18 test scenarios to allow for all combinations. For each test scenario the specific test at a given load, speed, and condition (wet or dry) was repeated three times to ensure repeatability. In addition, for each of these tests the length of track used allowed the rig to be pulled and braked up to four times before running out of track. This meant that although the test matrix covered 18 scenarios the number of physical test measurements taken was much greater to ensure good quality data to inform the development of the model and generate the required parameters.
The selected speeds may appear random but were chosen to match the gearing on the shunting engine to facilitate driving at a constant speed during each test. This has no effect on the use of the data generated to interpret the tyre behaviour and inform the development of the tyre model described later.
Tyre model formulation
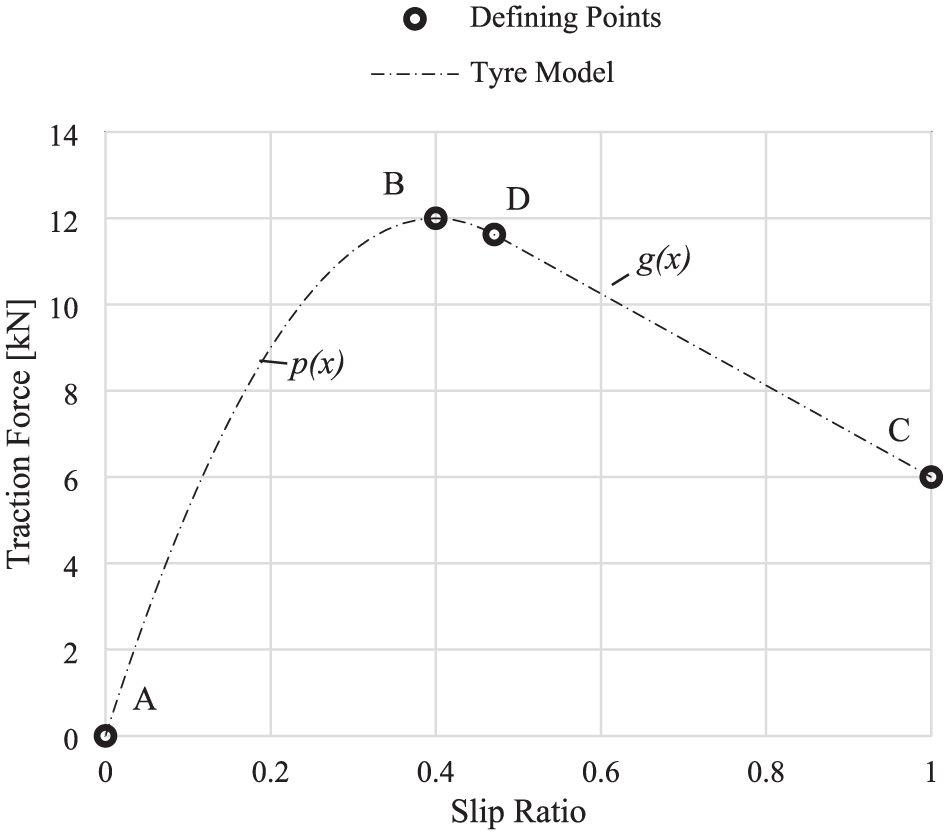
From the testing work carried out in Müller and Blundell 1 it was evident that the traction force versus slip curves analysed are largely similar in form. This was demonstrated from the diagram that was shown in Müller and Blundell 1 and recreated here in Figure 3. Each curve commences with an approximately linear increase in traction force with slip, followed by a curved section at the point of peak force, before transitioning back to a linear section until the point for a fully locked wheel with a slip ratio of 1.
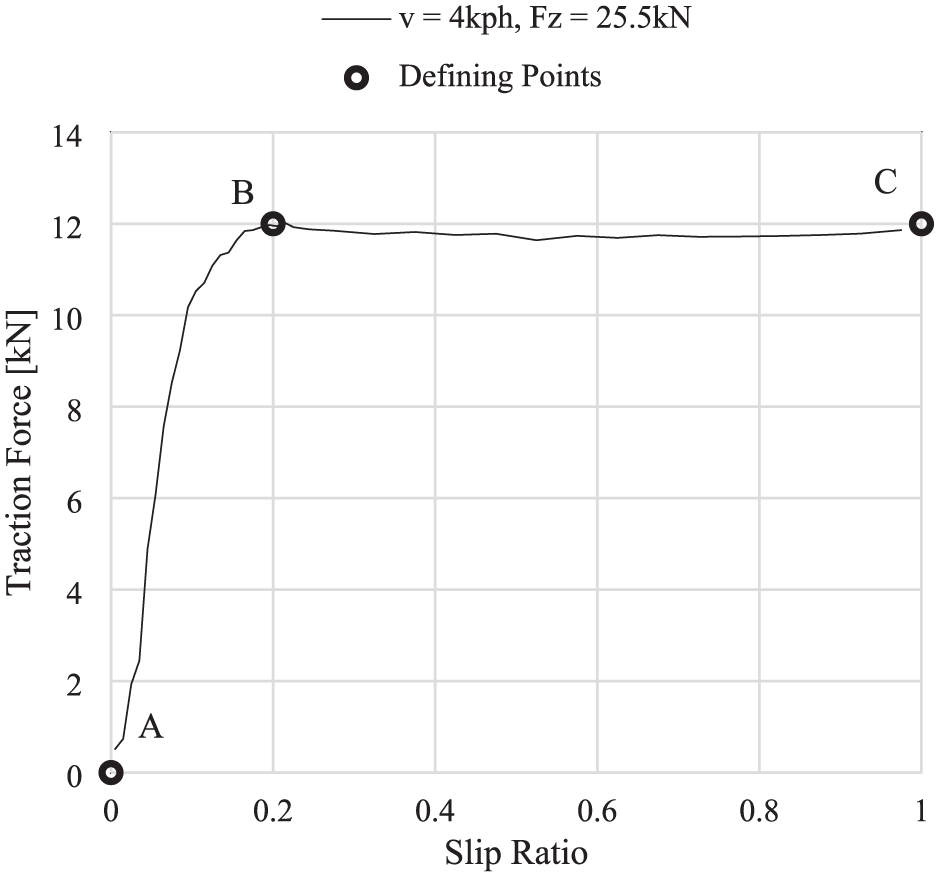
Main data points used to define the QUAdratic to LInear TYre to RAIL (QUALITYRAIL) tyre model.
Three distinct points have been picked to define an empirical model. Point A (x0/y0) is at zero slip and zero traction or braking force. It is obvious that this as such is already a simplification. As the tyre rolls freely, there is still a certain amount of longitudinal force at zero slip due to rolling resistance, which would show as a positive contribution at zero slip in a braking force versus slip graph or as a negative contribution in a traction force versus slip graph, respectively. As the rolling resistance is of small magnitude, the simplified model assumes this friction to be non-existent. The second, similarly obvious point is at C (x2/y2), where the test wheel is fully locked in the testing procedure and the slip ratio is 1. The third defining point is the point where the braking force initially peaks at roughly 20% slip and is called point B (x1/y1).
The empirical tyre-rail tyre model can be formulated as a set of two functions: a quadratic function to capture the shape of the curve between points A and B and a linear function to capture the shape of the curve between points B and C.
The quadratic function is given by:

The linear function is as follows:

Equations (3)–(7) explain how the quadratic function
The quadratic function is defined to go through the origin and through point B (

Substituting the origin (0, 0) into equation (3) gives:

Simplifying equation (4) gives:

Solving equation (5) for a gives:
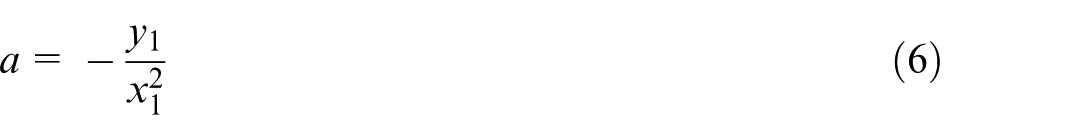
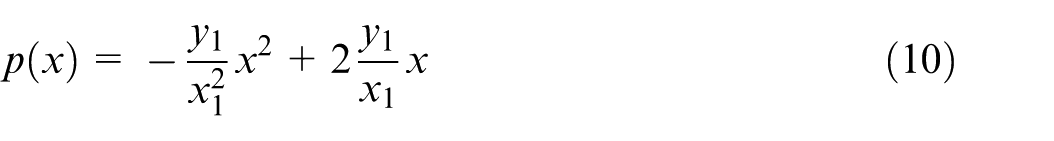
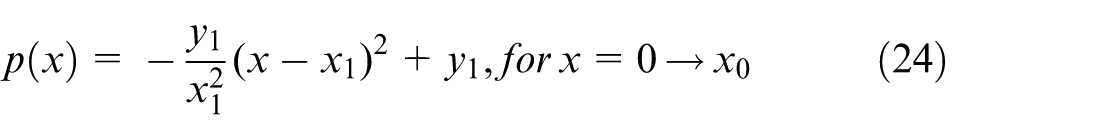
Substituting equation (6) into equation (3) leads to the following equation for the quadratic part of the tyre model for x = 0 -> x1:
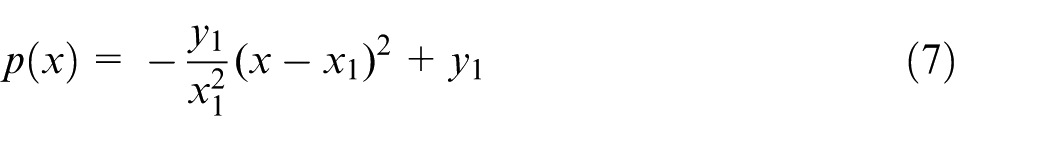
Fitting the linear function as a tangential fit to the quadratic function found in equation (7) leads to the introduction of point D (
Tangential fit at point D.
Equations (8)–(22) show the process of fitting the straight line going through point C tangentially to the quadratic function
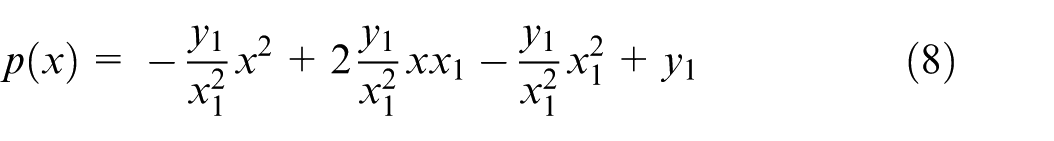
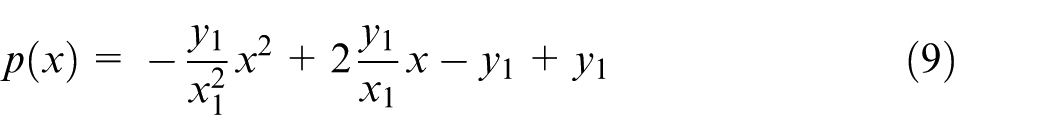
Rearranging and simplifying equation (7) leads to the following equations (8)–(10):
In order to fit g(x) tangentially to p(x) the inclination of both has to be equal at point D. Therefore, the first derivative of equation (7) is calculated as follows:
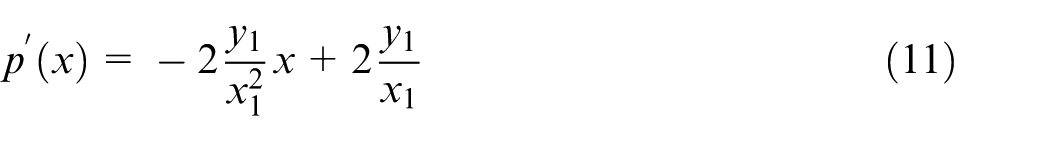
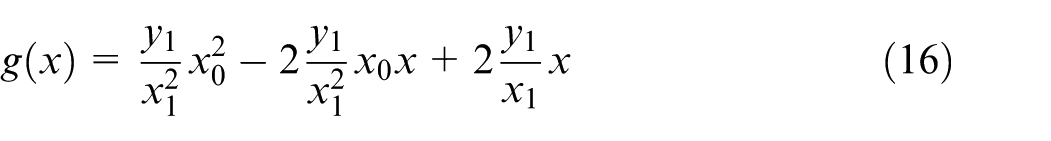
g(x) in standard point-slope form and with D (x0, y0) substituted is expressed as:

where m is the inclination of the linear straight line.
Substituting m for

Substituting equations (9) and (10) into equation (13) gives:
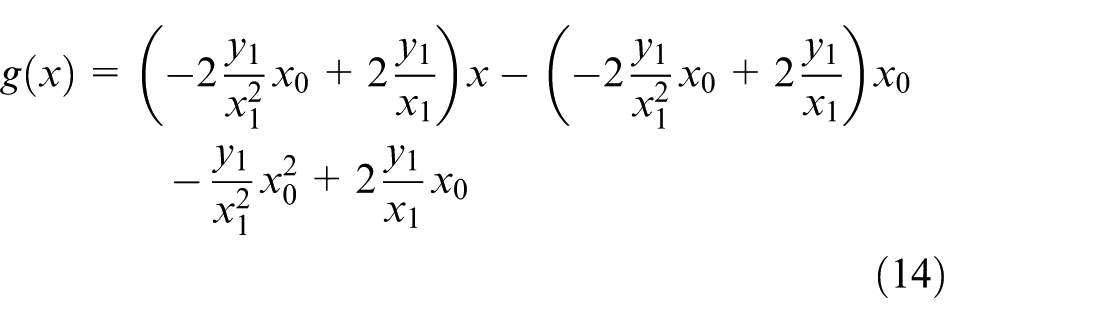
Simplifying equation (14) leads to equations (15) and (16).
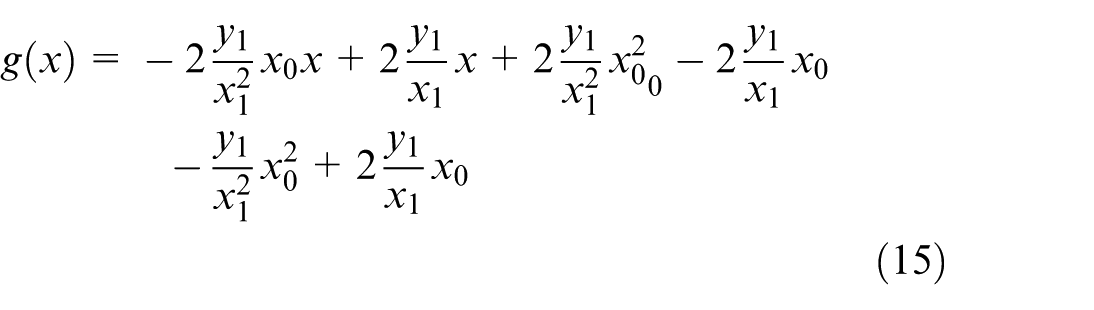
Fitting the straight line through point C (x2, y2) by substituting x2 and y2 in equation (16) gives:
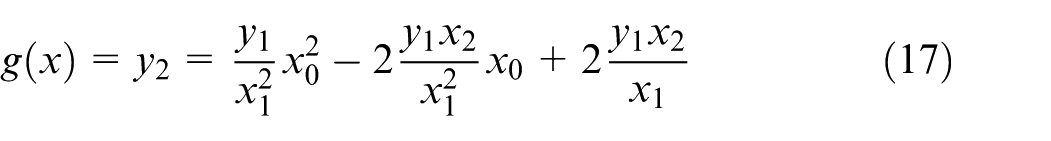
Transferring equation (17) into the following form gives:

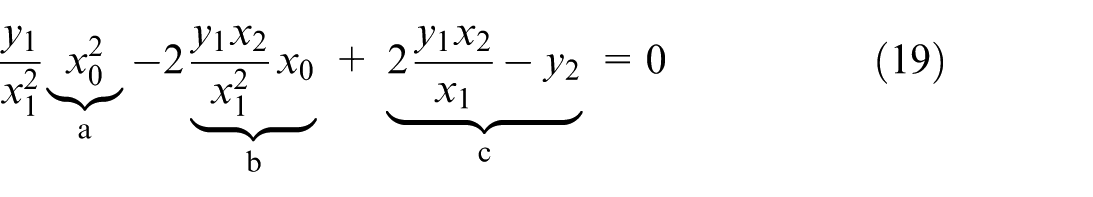
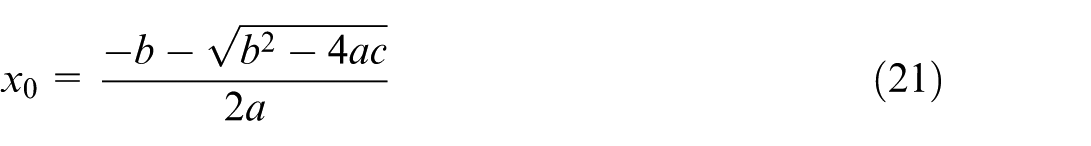
Deriving
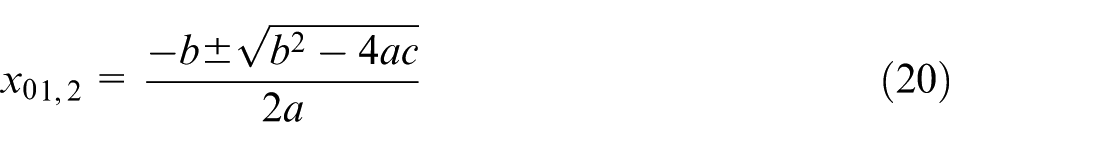
The quadratic equation (19) provides two solutions for x0 in equation (20). The term using
Deriving

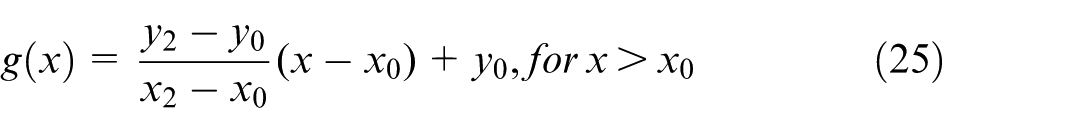
Deriving the straight line between point D and point C by utilising the point-slope form of the linear Equation gives:
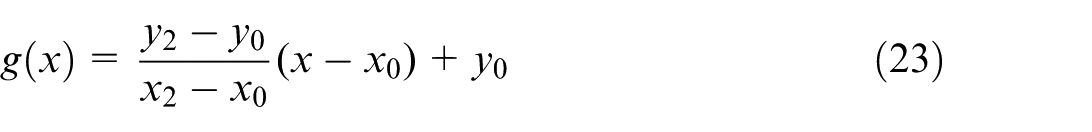
This leads to the formulation of the QUALITYRAIL tyre model using equations (7) and (23):
As previously seen, the points A (0, 0), B (
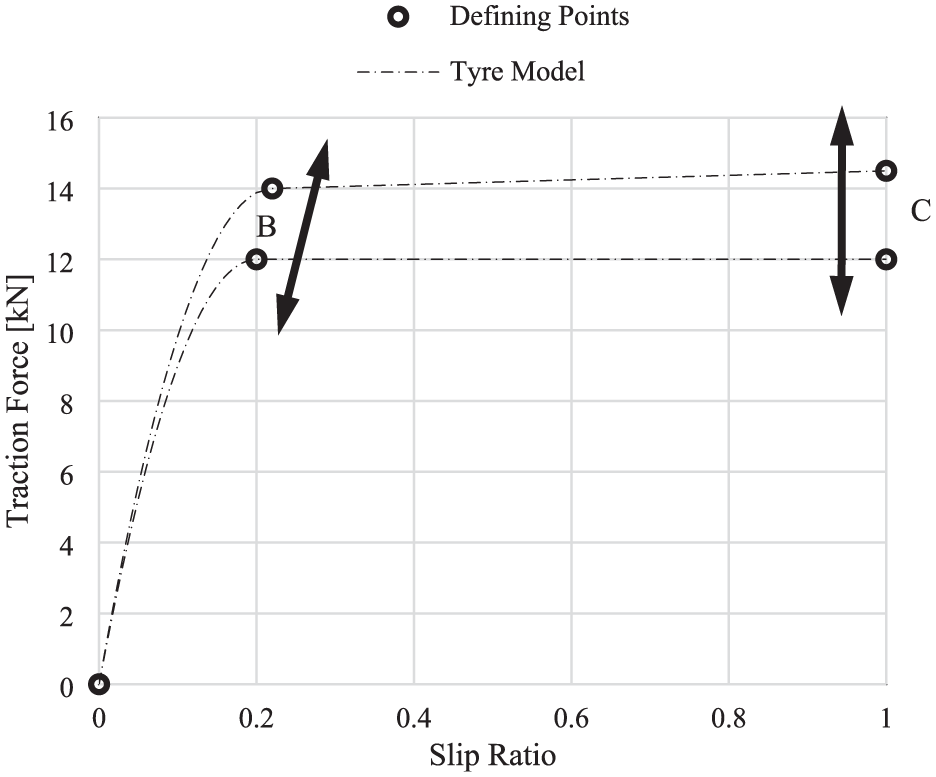
Assessing the influence of speed and load on defining points B and C.
The influence of speed and load on tractive force for both dry and wet conditions was assessed using the results from the programme of 18 test scenarios described earlier.
The average speed and load dependency of all three coordinates can be expressed as follows:

To calculate

where
In summary, the QUALITYRAIL tyre model is parameterised by evaluating the influence of load and speed on the positions of its defining points B and C, more specifically their coordinates
Validation
To support an initial validation of the QUALITYRAIL tyre model, traction curves have been calculated for a combination of three different speeds and three different loads. These model-generated curves, in red, are directly compared to the experimental test data in black. The data is visualised together in a graph for each speed in Figures 6 to 11 to evaluate the model’s accuracy and reliability. The test data is plotted in black and the data calculated by the QUALITYRAIL tyre model is plotted in red.
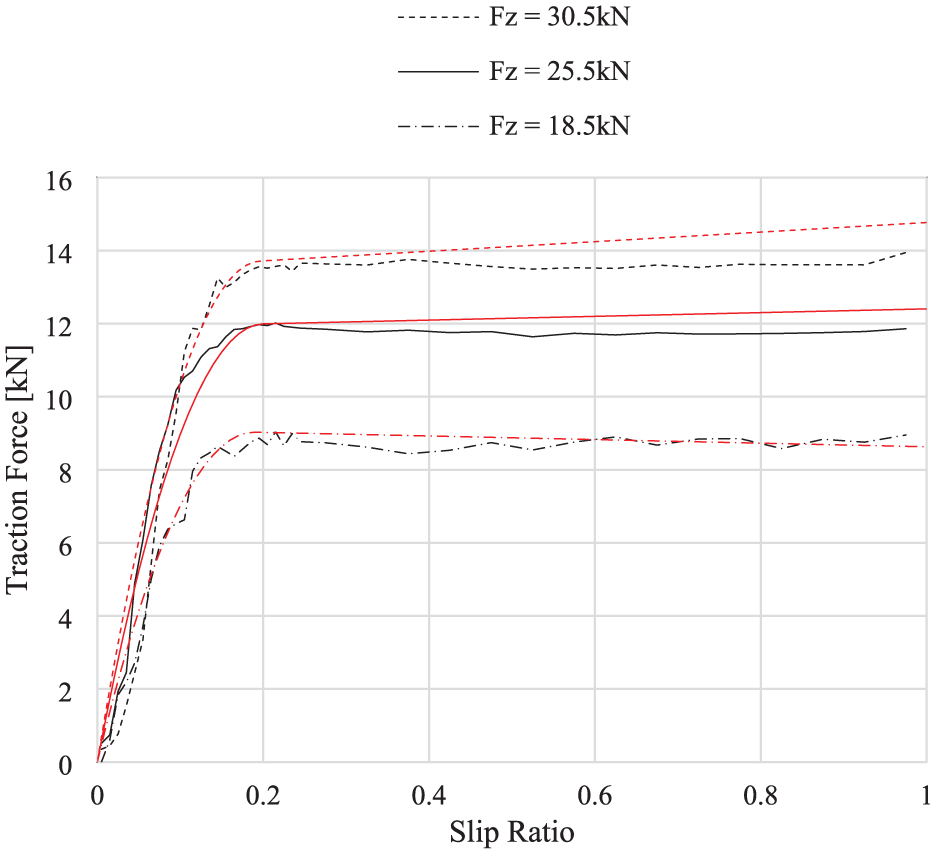
Comparing traction curves calculated by the QUALITYRAIL tyre model with test data at a speed of 4 kph under dry conditions.
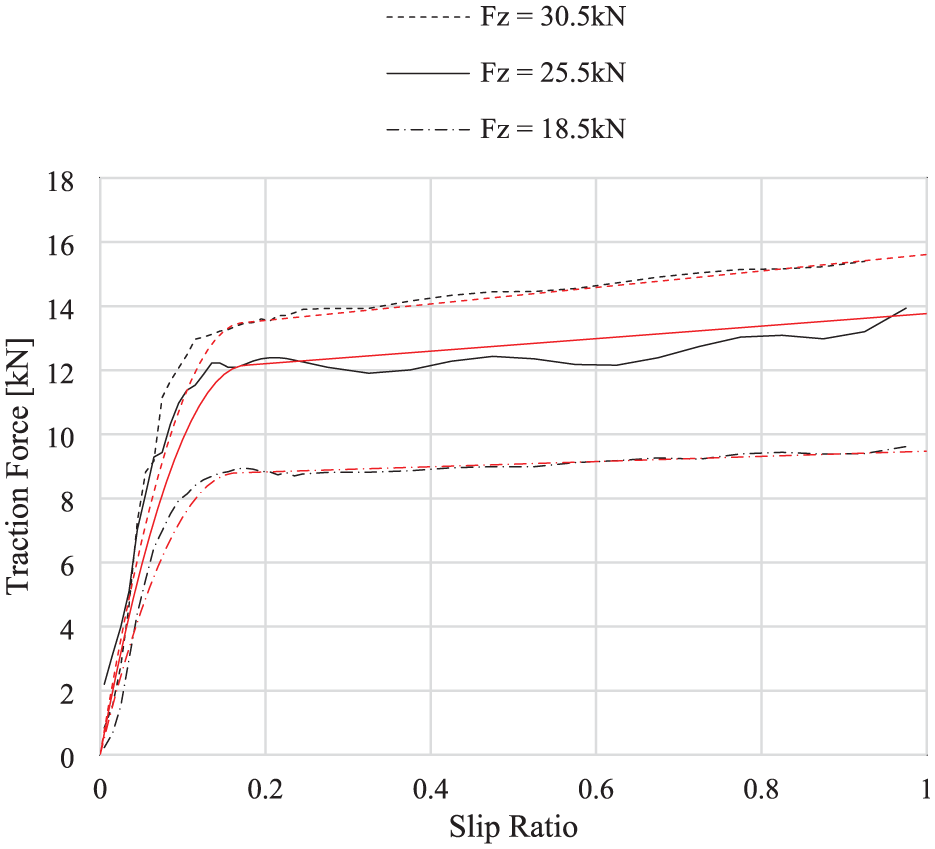
Comparing traction curves calculated by the QUALITYRAIL tyre model with test data at a speed of 8.4 kph under dry conditions.
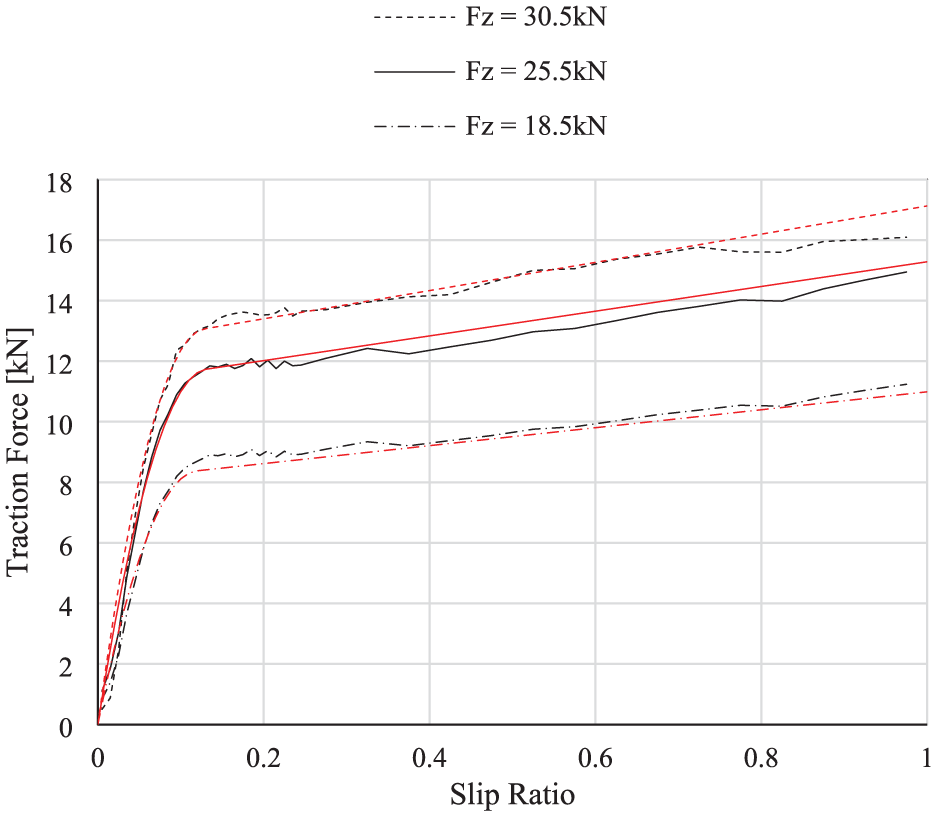
Comparing traction curves calculated by the QUALITYRAIL tyre model with test data at a speed of 16.3 kph under dry conditions.
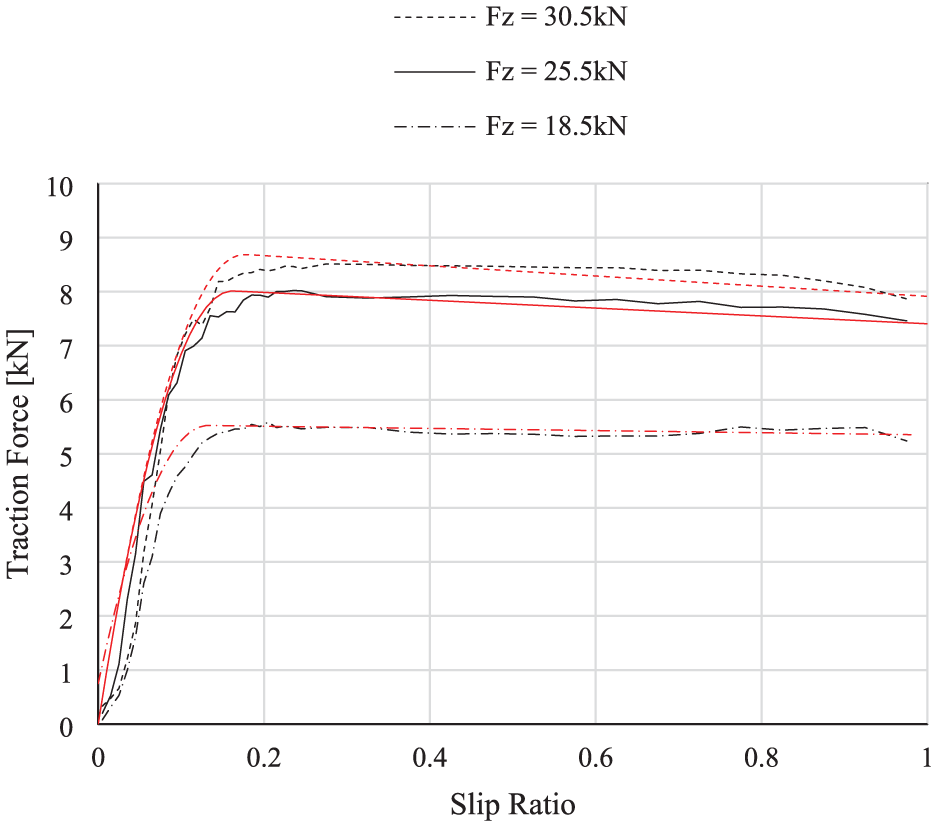
Comparing traction curves calculated by the QUALITYRAIL tyre model with test data at a speed of 4 kph under wet conditions.
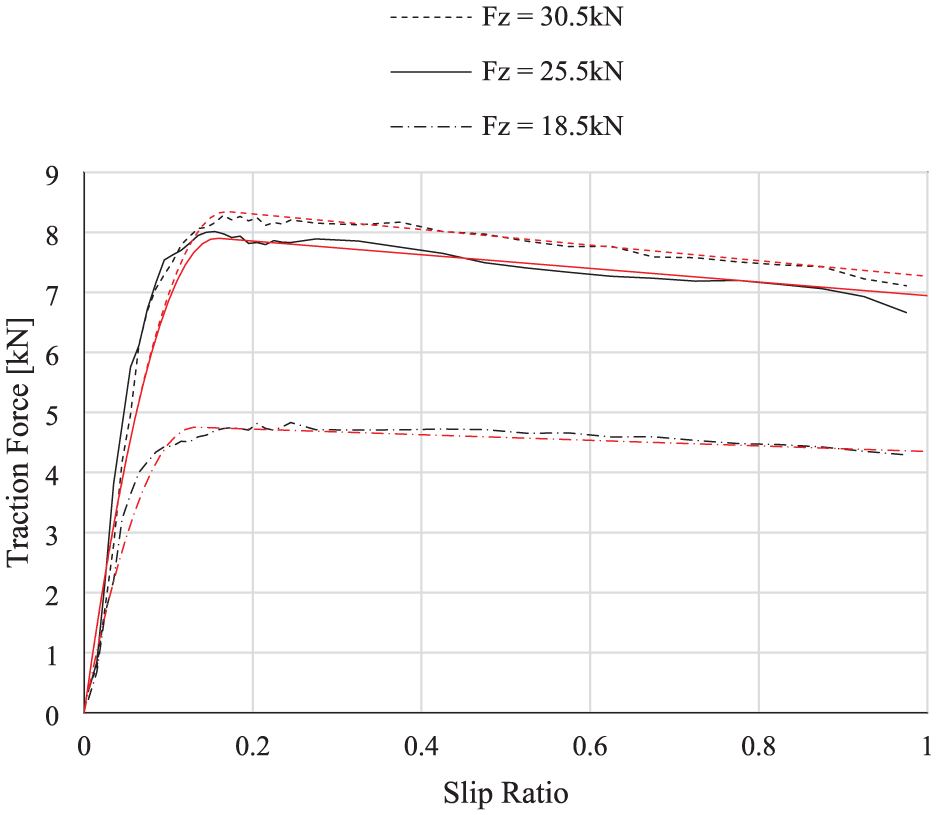
Comparing traction curves calculated by the QUALITYRAIL tyre model with test data at a speed of 8.4 kph under wet conditions.
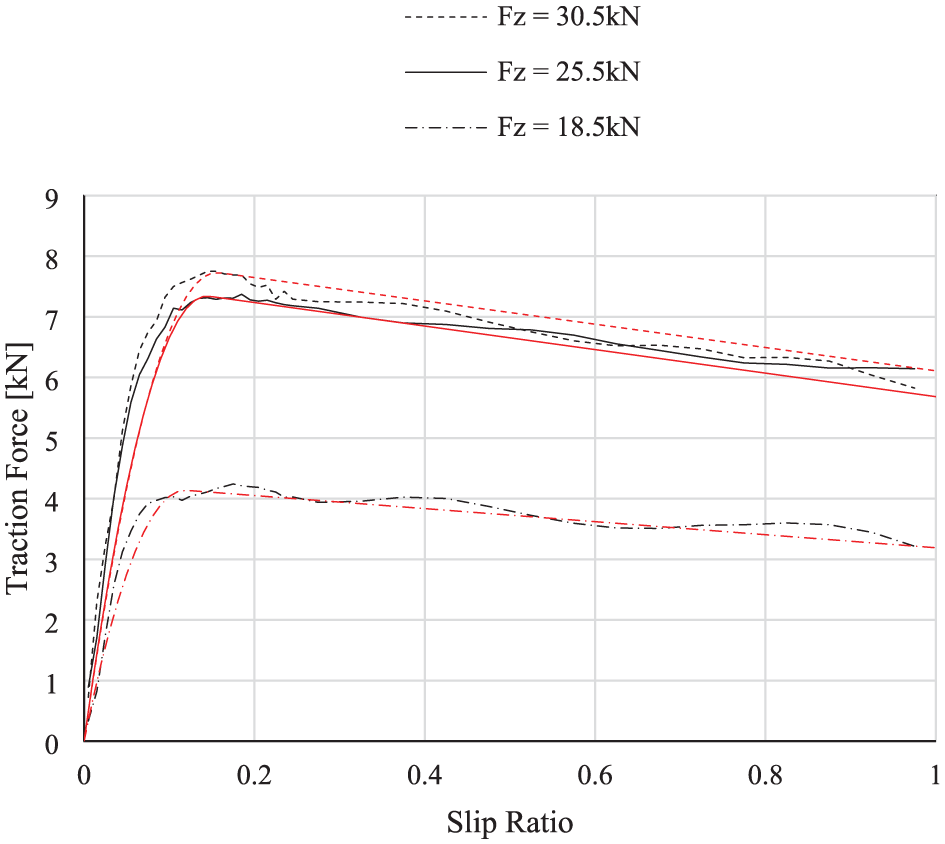
Comparing traction curves calculated by the QUALITYRAIL tyre model with test data at a speed of 16.3 kph under wet conditions.
The QUALITYRAIL tyre model shows good agreement with the test data. So far, the tyre model has been assessed against data that has initially been used to parameterise the tyre model. As a further step in the validation process the tyre model was compared to two specific tests especially conducted for this validation process under speed and load conditions that have not been utilised to parameterise the tyre model.
The additional tests were carried out in dry conditions at a load of 28 kN and at a speed of 15 kph and in wet conditions at a load of 23 kN and at a speed of 5 kph. These combinations provided a minimum number of tests for a further validation of the QUALITYRAIL tyre model at different speeds, loads, and conditions. For the validation tests the speeds and loads selected were not the same as those used to parameterise the tyre model.
In order to perform these tests, the shunting engine had to maintain a constant speed that did not match the gearing of the shunting engine used to perform the original programme of 18 tests. For these two additional tests a much more powerful and heavier shunting engine of the type Am 841, with a gross vehicle weight of 80 tonnes and 1000hp engine power, was used. The shunting engine pulling the test rig for the two additional validation tests can be seen in Figure 12.

Am 841 shunting engine and test rig.
The agreement of the curve that the QUALITYRAIL tyre model predicts (red) in Figures 13 and 14 to the tests in black was good and the QUALITYRAIL tyre model was considered to have passed the first two validation steps.
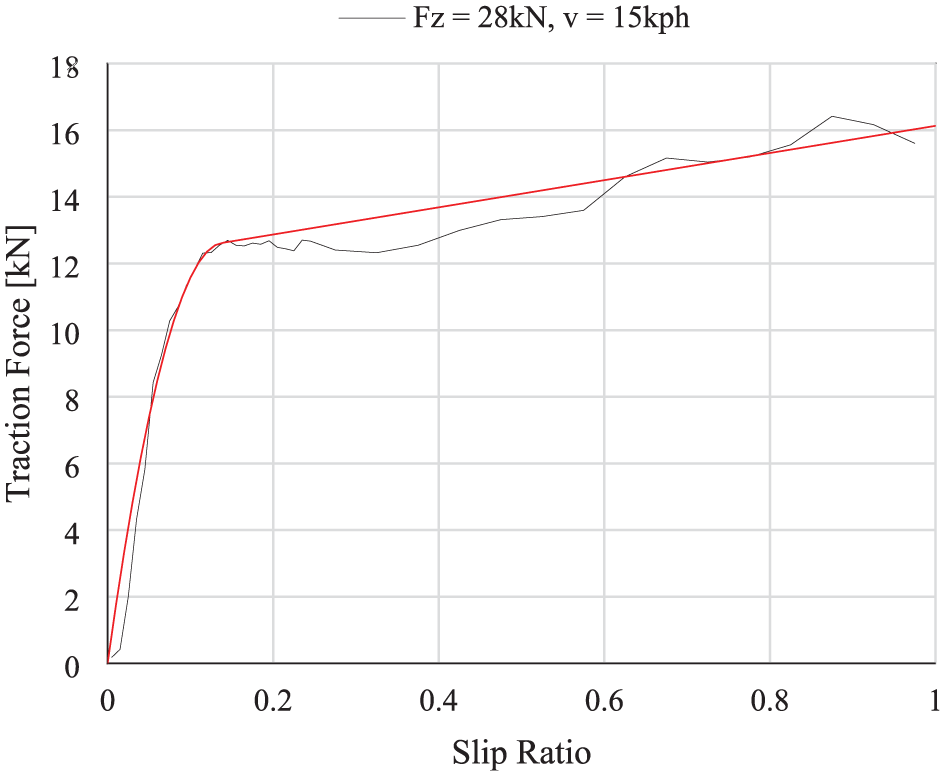
Validation test under dry conditions.
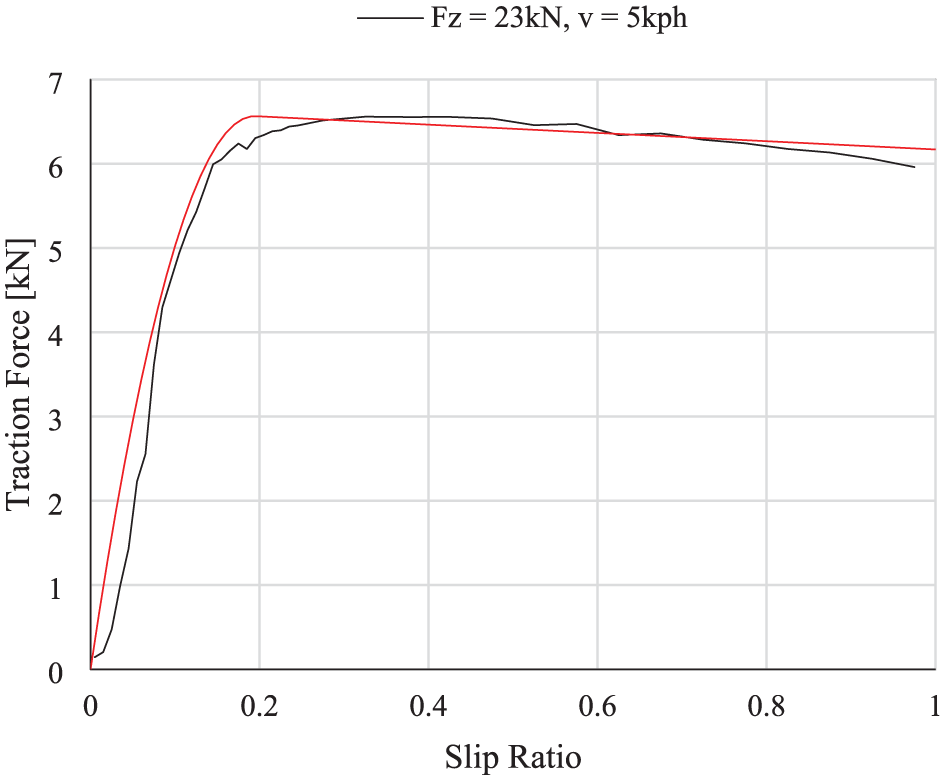
Validation run under wet conditions.
As can be seen in Figure 13 when testing in the dry conditions the braking force in the tyre continues to rise after the transition in gradient right up to the point of wheel lock and a slip ratio of 1.0. This behaviour is not normally observed in road tyres where the braking force tends to level out or decrease after the transition point. For the RRV tyre this type of expected behaviour is observed for the wet conditions shown In Figure 14 but not in the dry for any of the tests that were performed in this study.
At slip ratios beyond 0.2, the tractive force is governed predominantly by sliding behaviour. In dry conditions, this leads to a sustained friction level, as the increasing slip generates heat in the rubber, which in turn enhances the adhesive component of friction through intensified molecular bonding at the tyre–rail interface. In contrast, wet conditions introduce a dual limiting effect: the water film acts both as a thermal sink, counteracting the temperature rise, and as a contaminant layer that disrupts adhesion. These effects become more pronounced at higher speeds, where the tyre encounters more water per time unit and the inertia of the fluid contributes to the persistence of a thicker film between the two surfaces.
The behaviour of the RRV tyre in dry conditions is not readily captured by the existing empirical tyre models used to model the behaviour of tyres when in contact with a road surface but can be represented by the QUALITYRAIL tyre model presented here.
When looking at the test results for dry conditions plotted in Figure 13 it can be seen that there are some oscillations that occur after the transition point that are not so apparent when testing in the wet conditions shown in Figure 14. This was caused by some judder as the tyre progresses towards being fully locked and is dragged along the rail-head. In the next stage of developing the rig a motor will be fitted so that it becomes self-propelled, and it is expected that this behaviour will disappear.
The main thing that should be noted from Figures 13 and 14 is the good agreement for both wet and dry conditions between the tyre model predictions and the test results. Given that the these two tests were performed with a different shunting engine and were independent of the combinations of load and speed used in the initial programme of 18 tests used to develop and parameterise the model, it is considered that this is a further validation step to confirm the predictive performance of the model.
It is intended that the tyre model developed here could be used in any simulation environment that represents the dynamic equations of motion for an RRV shunting engine pulling its load. For the work in this project a Multibody Systems (MBS) approach was used with ANSYS Motion, together with the new QUALITYRAIL tyre model, to simulate the scenario shown in Figure 15 below. The MBS model was created to represent an existing Müller Bergmann GT RRV, used for shunting operation. Its gross vehicle weight of 10,946 kg is distributed 30% to the guiding rail wheels and 70% to the road traction wheels. This weight distribution is according to Swiss regulations that differ, as mentioned earlier, from European regulations. The road wheels alone account for the generation of the tractive forces needed to haul the wagons or carriages.
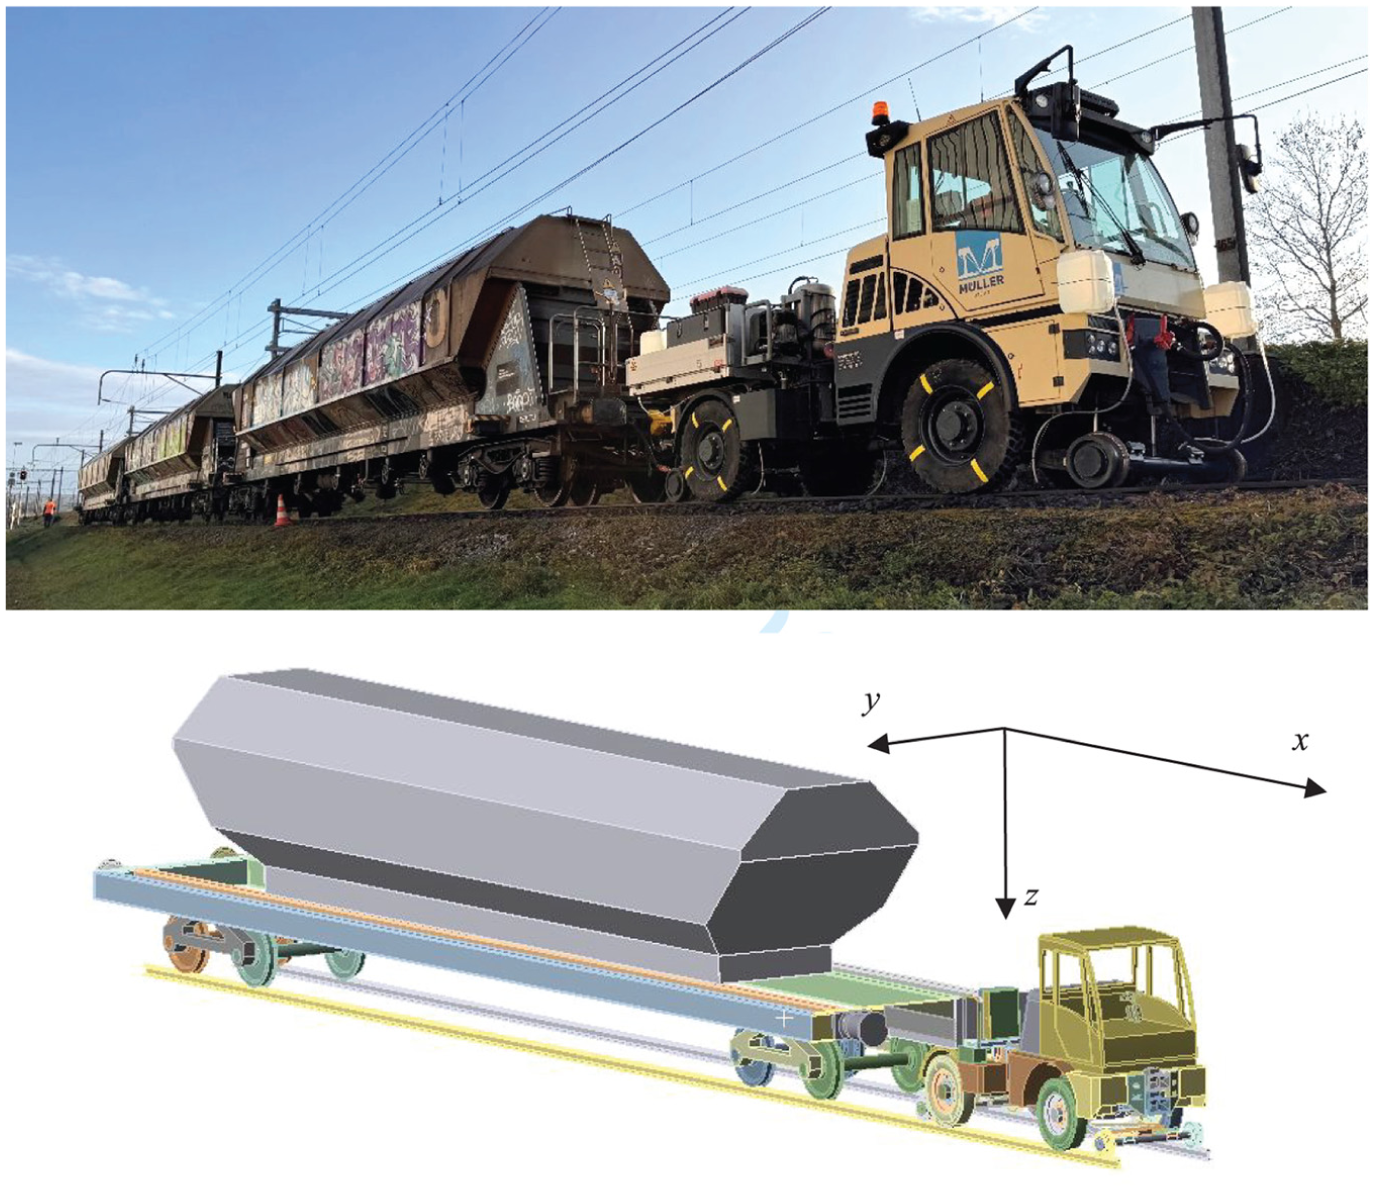
Test setup for full shunting manoeuvre in reality (above) and ANSYS motion (below).
The total mass of the Bergmann RRV is 10,946 kg with a distribution of mass for the main body of the RRV that has 4447 kg acting at the front axle and 5453 kg acting at the rear axle. In order to simulate a full shunting event, one or more railway wagons had to be added to the model. For the physical testing Tagnpps wagons were used. These wagons are used to carry bulk food for humans and animals such as grain, sugar, salt, or cacao. They consist of two boogies incorporating two axles each. The total mass of each unladen wagon is 23,500 kg.
An initial programme of full-scale physical test has been carried out to allow comparison, and validation, of the MBS model and QUALITYRAIL tyre model. This testing has also been carried out using the rail track within the Müller Technologie company site in Frauenfeld, Switzerland. An extensive description of that work is planned for another publication.
Moving forward, some of the planned applications at Müller Technologie for RRV design and development environment using this new model include:
(i) Developing a future traction control system for RRVs.
(ii) Using the model in a predictive engineering environment to design RRVs to meet a specified towing capacity target.
(iii) Carrying out design optimisations studies, for example on the geometry of attachment points to ensure optimum and safe towing operation.
(iv) Support the need for a new tyre design and investigations into the optimum design of the tyre to rail contact area of a tyre.
(v) Support the design of new RRV feature such as devices that can eliminate contamination of the rail head during adverse weather conditions.
Conclusions
The development of the QUALITYRAIL tyre model addresses the unique requirements of road tyres operating on rails. Unlike existing tyre models developed for road applications, the QUALITYRAIL model effectively captures the specific traction force characteristics observed in this use case, such as the continuous increase in traction force with slip under dry conditions and higher speeds. Using an empirical approach, considering simplicity and precision, the model makes use of only three primary parameters when considering the braking force. The secondary set of parameters that define the speed or load dependence using either a quadratic or linear fit ensures that the model is both practical and fit for purpose. This was demonstrated by its accurate parameterisation and initial validation.
The work described in this study made use of a unique tyre test rig to understand and support the development of a model to predict the behaviour of a braked tyre when rolling on a steel rail-head. Although the research has shown that other work has been carried out to test and model an RRV tyre in contact with a rail-head, this work only looked at the static normal loads of the tyre on the rail and did not consider the tractive forces needed to model and support the design of an RRV.
The model reliably represents the interaction between tyre speed, load, and slip ratio for both dry and wet rail conditions. This was confirmed by the initial validation, including comparisons between the model-generated traction curves and the experimental data. Further tests conducted under conditions, that where not responsible to parameterise the model, confirm the model’s robustness and adaptability, showing its ability to predict traction behaviour across a range of operational scenarios. These results provide a strong foundation for the QUALITYRAIL tyre model to be used in predictive engineering and practical applications within the rail industry.
The results presented here show that the tyre model has very good potential to support new RRV designs and to explore the operational limits of shunting engines when considering loads, gradients, and environmental conditions. This will offer the opportunity to design and operate future RRVs designed specifically for shunting with more efficient power train systems. Future work will also look at testing and further developing the model to allow for curved and banked sections of track. This will open and extend the application of the model to support design simulations of RRVs used for other operations such as construction or rail maintenance in remote areas.
While the QUALITYRAIL tyre model has demonstrated its ability to accurately reproduce the traction characteristics of RRV tyres under various speeds, loads, and rail surface conditions, it currently focuses exclusively on pure longitudinal slip while running on straight-track conditions. As such, the model does not yet incorporate lateral slip or other effects associated with curved track segments, such as off-centre contact or combined slip states. These limitations are acknowledged and represent a natural extension of the model in the future development stages. Initial efforts have deliberately focused on simplifying the modelling challenge to build a robust and application-specific foundation, with the empirical structure and low parameter count of the model offering a clear path towards further extension.
As a final validation step, in a follow-on study from the work described in this paper the QUALITYRAIL tyre model is implemented into a multi-body simulation (MBS), introduced earlier, of a shunting event and a comparison made of the MBS simulation results with those obtained from a real-world shunting event conducted under identical conditions.
Footnotes
Appendix
Funding
The authors received no financial support for the research, authorship, and/or publication of this article.
Declaration of conflicting interests
The authors declared no potential conflicts of interest with respect to the research, authorship, and/or publication of this article.