
Abstract
This paper describes a programme of tyre tests using a purpose built tyre test rig designed specifically to investigate the behaviour of tyres that are used with Road-Rail Vehicles (RRVs). These vehicles are used extensively by the rail industry to support the maintenance of existing rail lines and new construction works. In many cases, using a vehicle that can only operate on the road, or a rail engine that can only operate on tracks will not provide a suitable or effective solution for the task in hand. RRVs are able to operate on both roads and rail, and as such provide a very flexible solution to the rail industry. When operating on the road, RRVs use pneumatic tyres to control their motion and act to all intent and purpose as a normal road vehicle. When operating on rail lines RRVs use a combination of the pneumatic tyres and standard steel rail wheels to control their motion. The rail wheels maintain the directional stability on the track and the pneumatic tyres provide the tractive force to drive and brake the vehicle. Unlike standard road or rail vehicles, there is to date no predictive engineering practice that allows the use of computer simulation to design and optimise the performance of RRVs when they are operating on rails. Computer tools, such as multi-body systems (MBS) analysis are used extensively to design both road and rail vehicles. For road vehicles a tyre model is needed to represent the behaviour in the contact patch between the tyre and the road. For rail vehicles a model is needed to represent the contact force between the train wheel and the track. In both these applications the behaviour is well understood and over the last half century mathematical models have been developed that allow accurate and useful simulation to support the design of new vehicles and trains. In contrast, RRVs have evolved essentially as modifications to standard road vehicles. While the base vehicle may be very well designed to perform on the road, the performance on rail is based on experience and some testing. There is no up-front science involved in designing a RRV to perform effectively during this very important phase of its operation. In order to develop an accurate model to predict RRV performance on rails it is clear that a model of the behaviour of the tyre when in contact with the rail is needed. To date, no such model exists and additionally the testing needed to generate data that could be used to develop a model has never been carried out. The work described here addresses this with the design and build of a unique test rig that can be used to test tyres on rails for a range of operating conditions, and produce a set of initial results that provide a framework for a future tyre/rail model. The paper concludes with a review of the behaviour measured and provides new insights into how well tyres perform on rails and also where the behaviour differs from the well understood behaviour of tyres operating on roads. The important behaviours that would provide the main parameters for a new empirical tyre model are also identified and discussed.
Introduction
Background
Rail engines and wagons are expensive and substantial assets that are designed and built to travel only on rails. As such, they are limited by the established rail infrastructure as to where they can travel and the roles they can perform. Road vehicles, however, run on a road network, their motion is controlled by the performance of pneumatic tyres, and they offer great versatility as to where they can go, how they get there and what they can do. Between these two modes of transport lies a lesser-known class of vehicle, identified as a Road-Rail Vehicle (RRV). These vehicles have the capability to drive on both normal roads and rail tracks.
It is not commonly known where and when the first example of a RRV existed, but certainly by the middle of the last century rail operators began to realise that a pneumatic tyre offered the potential to generate greater traction when in contact with a rail track than a normal rail wheel. This offered an opportunity to improve shunting operations and as a result, they began to experiment, both in the USA and in Europe, with converting road vehicles to run on rail tracks. These early conversions were not very sophisticated, but they did prove to be effective, hence leading to the modern RRVs we see today.
There are a number of reasons why modern RRVs are useful to rail operators and their supporting industries. The first is to consider the flexibility in where they can go. RRVs can be used to support construction and maintenance activities for the rail network. Since they use pneumatic tyres they can travel on normal roads to get to the site where they are needed. This means they will not disrupt the normal transport operations on a rail network to get to the location. This may also be an advantage if the site is difficult to access or is not yet reachable using the existing rail network. Once they reach the required location, they then offer the versatility to operate around the site, whether they are traversing made up roads or rough terrain. In addition, some of the site may only be accessible by the local rail track in that region. The RRV then offers the capability to drive on the rails as well.
RRVs are also useful for shunting operations within a railyard. Operating in this role, they offer a significant advantage in terms of the tractive force that can be generated between a tyre and the rail’s head compared with that generated by standard train wheels. The use of RRVs for shunting purpose has largely increased over the last decade. The transport logistics sector is under pressure to produce cheaper and more eco-friendly vehicles for shunting operations. Figure 1 shows an RRV and a normal shunting engine doing the same work where the RRV operates at 450 hp (horsepower) and the shunting engine operates at 1800 hp. When sitting at idle the RRV uses 7 l of diesel per hour compared with the shunting engine using 40 l of diesel per hour.
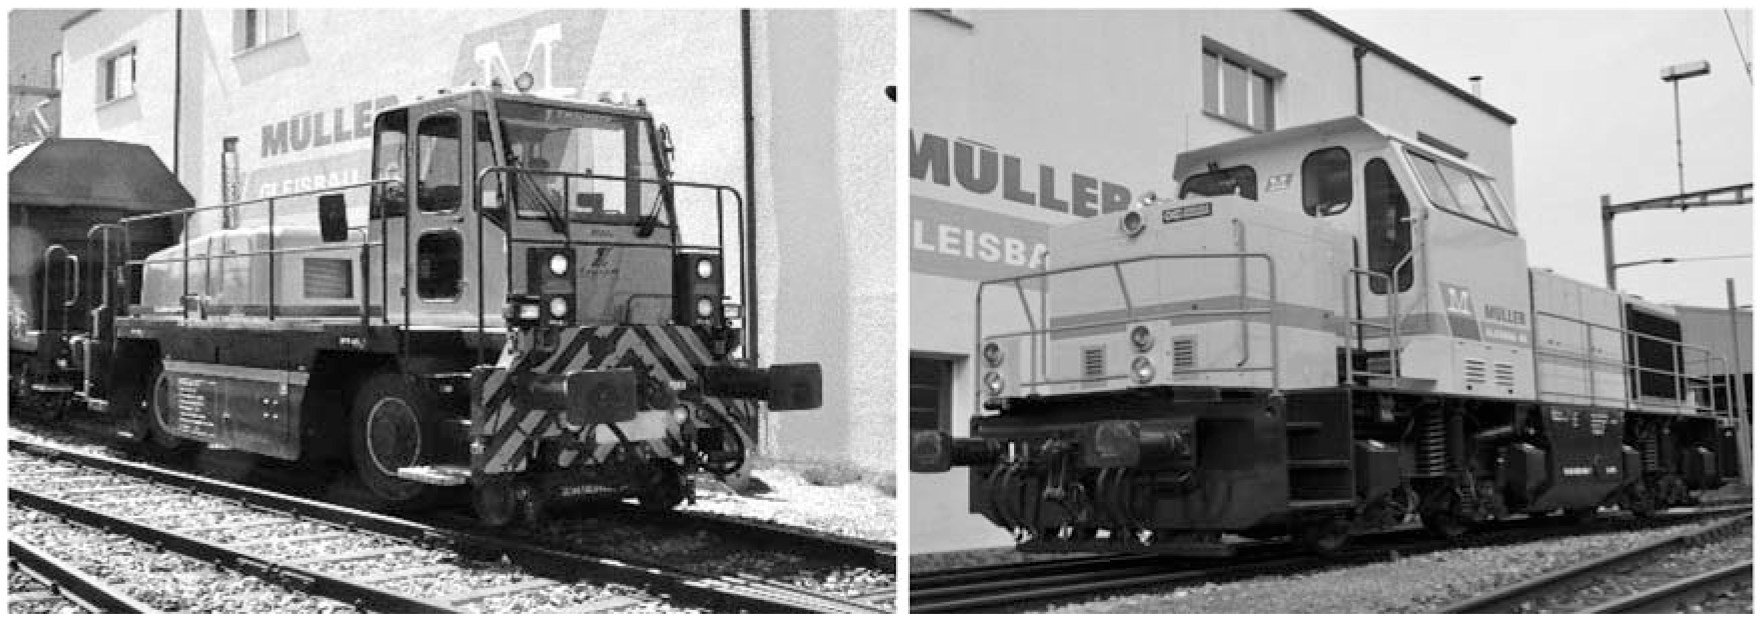
Examples of RRV (left) and traditional shunting engine (right).
RRVs are guided on the rails via guiding rail wheels and the guiding rail wheels usually support about 25% of the total weight of the vehicle to safely guide the RRV. As the rubber tyre to steel rail traction coefficient is about four times higher than the steel wheel to steel rail traction coefficient, an RRV can be about three times lighter than a classic shunting engine and carry out the same work. Moreover, shunting RRVs are designed with the sole purpose of doing shunting work and operate in a speed range of usually up until 25 kph. Classic shunting engines however, are designed to do main line service as well at a top speed usually ranging from 80 to 100 kph. The lower speed range allows for the RRV’s diesel engine to be downsized by a factor typically between four and five, leading to significant benefits for the environment. In addition, most countries have legislations allowing RRVs to be driven with an ordinary driving licence, whereas a specialised licence is needed to drive a shunting engine. Another typical advantage of RRVs over shunting engines is that maintenance can be carried out at a local workshop accessible via roads only and refuelling can be done at any local HGV-ready petrol station. Shunting engines, however, need to be brought to a special train workshop and the fuel station needs to be at a trackside location.
Altogether this makes RRVs cheaper to buy and run, easier to use and much more productive and eco-friendly than traditional shunting engines. When conditions are dry, this advantage is significant with an RRV able to pull up to four times the load compared with an equivalent shunting engine. In the wet however, the friction between the tyre and the rail is greatly reduced, and shunting performance is highly compromised. Other contaminants such as wet leaves or snow are also problematic. The influence of the weather on the tyre performance of an RRV when it is operating on rails is greater than when it is operating on roads, similarly to other road vehicles. All of this means that to effectively design and predict the performance of an RRV an in depth knowledge of the friction mechanisms and tractive behaviour between the tyre and the rail is required.
Design methods
It is standard design practice within the automotive sector to make use of industry standard multibody systems software such as ADAMS or Simpack to model and simulate the vehicle dynamics ride and handling performance of a vehicle. The programs are used to represent the various subsystems comprising the suspension linkages, springs and dampers, anti-roll bars, powertrain and vehicle body. The programs are used not only for ride and handling, but also for durability studies to model the loads transmitted through the tyre and wheel into the vehicle chassis.
In most cases the simulations represent the tests that will be performed at a later stage with a prototype vehicle at the proving ground. As vehicles become more sophisticated, with electrification of the powertrain and automation of driving functions, the modelling of sensors and sophisticated control systems may require a more fundamental approach with a mathematical modelling package such as MATLAB, or programs that can model not only vehicle but the driving environment such as IPG Carmaker.
When modelling a car, one of the most complex areas is the representation of the tyre behaviour. The method selected to model a tyre depends on the scenario that will be simulated. As such, tyre models may range from large physical finite element models, that represent the tyre structure and materials, to empirical models that represent the tyre behaviour, in this case the forces and moments measured in the tyre contact patch using a tyre test rig. The finite element approach requires extensive modelling effort and computational resources. This method is therefore mostly used by tyre manufacturers or for focussed research projects.1,2 Semi-empirical tyre models such as FTire 3 and CDTire 4 are often used for durability or ride analysis, while fully empirical models have proven to be the most suitable for simulating handling manoeuvres. The modelling of off-road vehicles, military vehicles or construction vehicles travelling over severe terrain is very specialised and has led to research and new tyre models that include a detailed consideration of terramechanics. 5 In this area tyre models have also been developed to simulate exploration vehicles taken to Mars and operating over the rugged surface of that planet.6,7 Specialist tyre models have also been developed for aircraft. When it is on the runway, an aircraft is effectively a ground vehicle. The tyres are larger and subjected to much greater loads than automotive tyres, and the need to simulate an aircraft during take-off, landing or for taxiing manoeuvres has led to specialised aircraft tyre models. 8
A number of tyre models have been developed for the simulation of vehicle handling over recent decades. Of these, the most widely used model is that developed by Pacejka and Bakker. 9 It was originally named the Magic Formula tyre model, but is now commonly known as the MF-Tyre model. The capability of the model has been extended through many iterations to include more advanced applications such as the simulation of anti-lock braking systems and traction control. Although very accurate, this model does require a lot of parameters. This has led in some cases to the use of low parameter tyre models such as the Fiala tyre model. 10 However, this can introduce limitations on capability or accuracy. An attempt to improve on this, while still maintaining a reasonably low number of tyre model parameters was provided with the Harty tyre model. 11
The need to generate empirical tyre model parameters has led to extensive studies and developments in tyre testing technologies which has led to a wide range of test methods being developed. These include testing with a trailer-based rig, 12 using a vehicle based testing approach such as the Jaguar Land Rover VBOTT test vehicle, 13 the T.R.I.C.K.-tool 14 or more traditional laboratory based testing using either a drum or a belt-based flat-bed test rig such as the one at Calspan in the USA, 15 which is shown in Figure 2. The amount of testing, and tyres, needed to generate a full set of parameters for MF-Tyre is extensive. This has led to additional research to find more efficient ways to carry out a tyre test programme, without compromising the quality of the generated tyre model parameters. One such study 16 led to a new tyre testing methodology known as GS2MF.
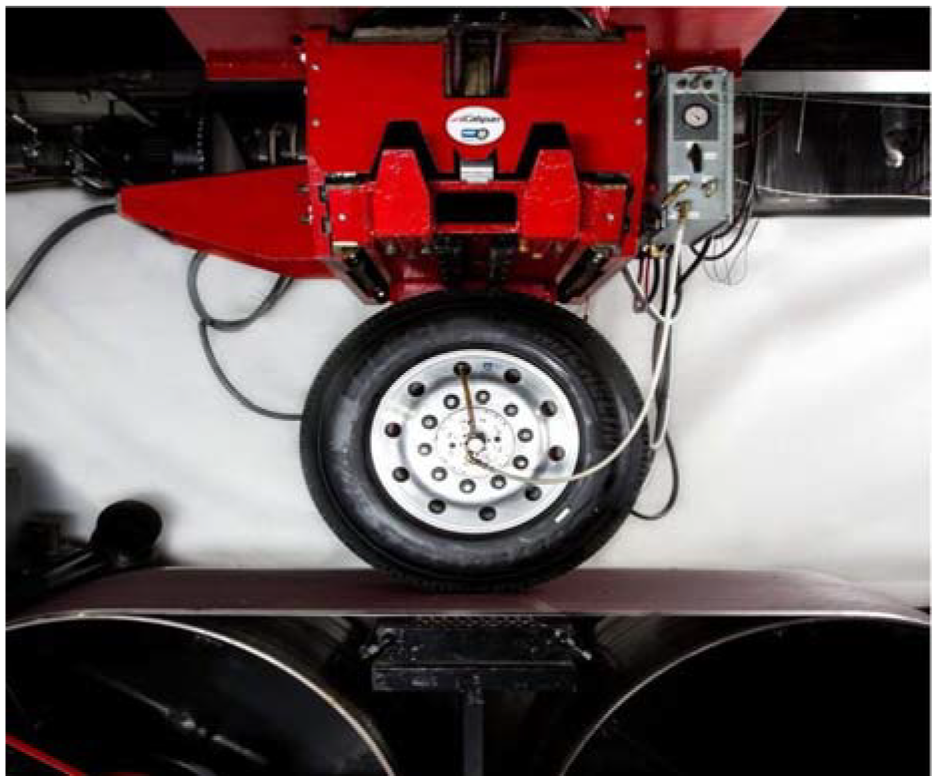
Flat Bed Tyre Test machine. 15
Whichever testing approach is taken, the idea is to carry out a range of tests that map out and capture the expected scenarios the tyre will experience while driving. As a base, this would involve testing a tyre to establish the critical relationships between, for example, measured tyre behaviours such as longitudinal force, lateral force and aligning moment for tyre input states such as load, slip ratio, camber angle and slip angle. It should be noted that if it is possible to test and model tyres for normal road cars, then it is also possible to do this for other road vehicles such as trucks or motorcycles.
In conclusion, it can be stated that methods exist to test and model a tyre to support the simulation and design of normal road cars, trucks, motorcycles, off-road vehicles, military vehicles, construction vehicles, aircraft and even the Mars explorer. But, for RRVs no such models exist and modern methods to design these vehicles cannot be applied. In fact, there exists no scientific knowledge or mathematical representation of just how a pneumatic tyre behaves when generating tractive forces between the tyre and a rail track. In order to solve this is it is necessary to map out and interpret these behaviours. The next section describes the initial steps on this path with the design, construction and initial operation of the first ever test rig that can measure tyres forces for a range of appropriate tyre states when operating on rail tracks.
Tyre to rail test rig – design and build
Existing tyre test methods
The behaviour of tyres is complex and the automotive industry has a long history of testing tyres, not only to better understand how they work, but also to generate data that can be used to generate tyre model parameters. Tyre testing usually takes place in a laboratory but can also be performed outdoors using test equipment that is based on a trailer, truck or vehicle. Images of these different types of test facilities are shown in Figure 3.
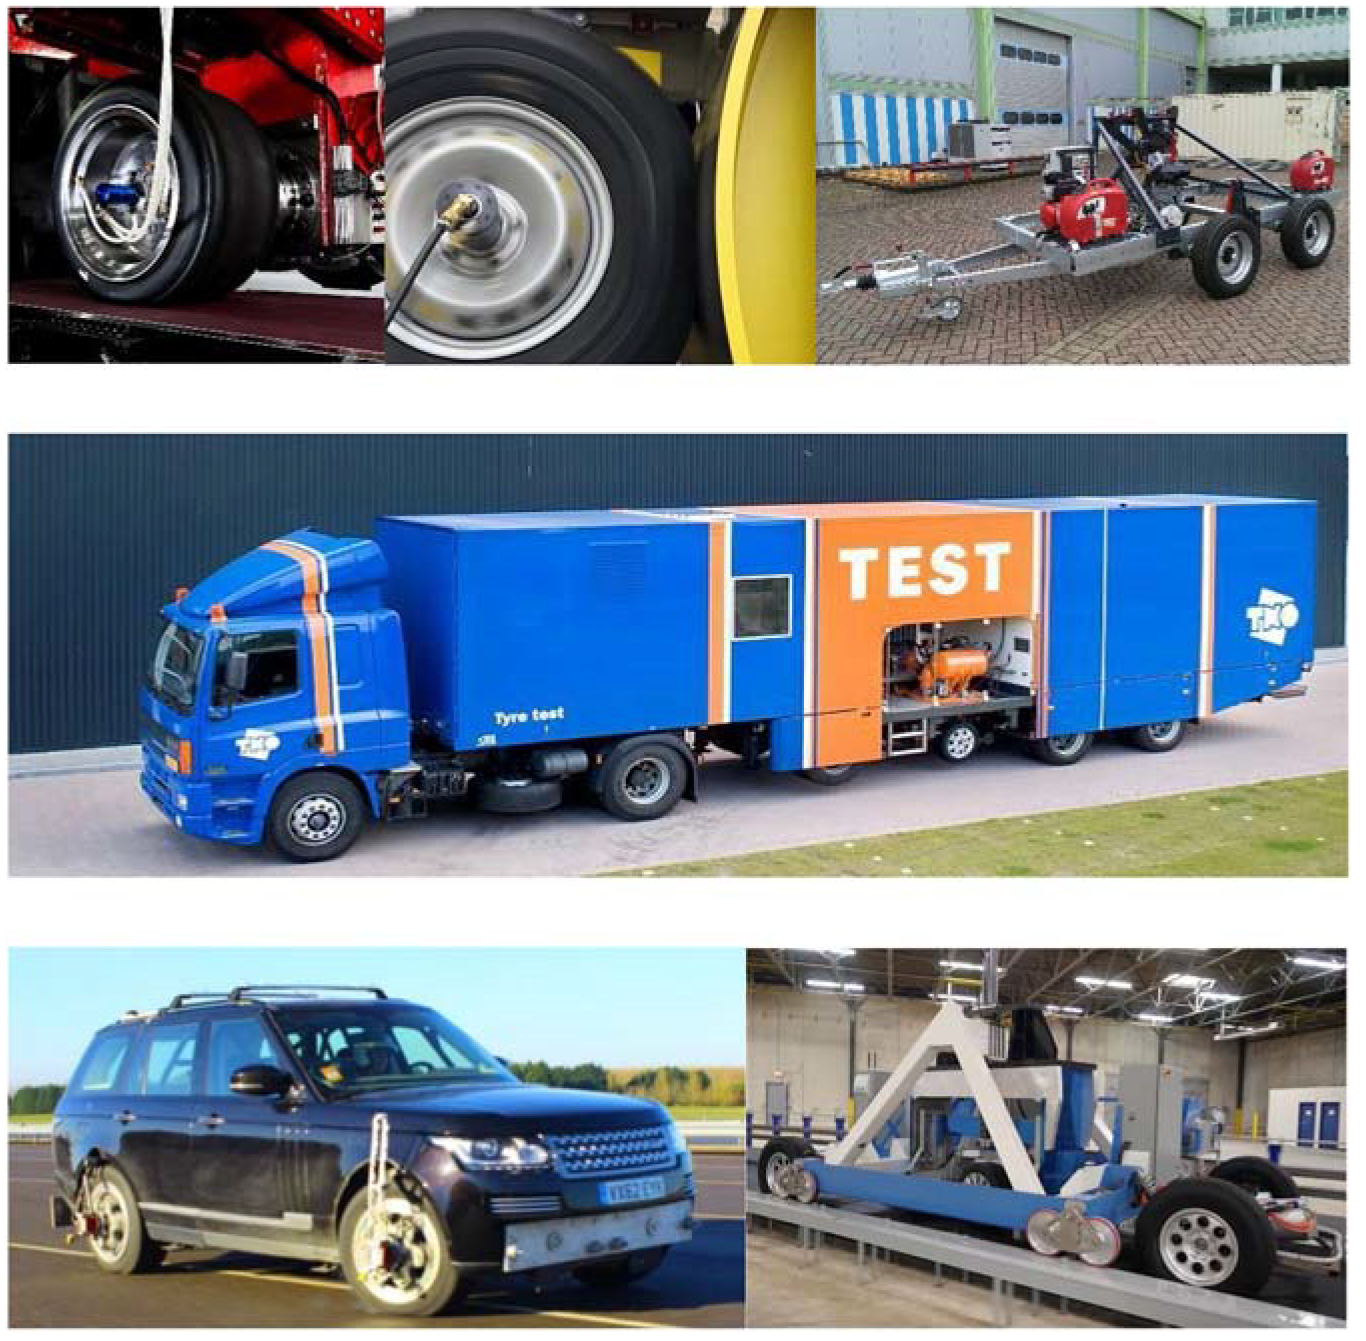
Images of different tyre test facilities – flat bed test rig (top left 15 ), drum test rig (top centre, courtesy of MTS Systems), trailer based test rig (top right, courtesy or Loughborough University), truck based test rig (centre 12 ), vehicle based test rig (bottom left 13 ), indoor track based test rig (bottom right 17 ).
Testing indoors with rigs such as the flat bed and drum machines shown in Figure 3 offers the advantages of being able to test tyres in a highly controlled environment. Flat bed test rigs are excellent for generating empirical tyre model parameters for vehicle handling simulations. As such, they are often used to generate parameters for the Magic Formula Tyre model. Drum machines have a disadvantage in this area due to the curvature effect at the contact point between the tyre and the drum. This is counteracted to some extent by using as large a drum as possible. Drum machines are more useful when used with cleats that can excite a modal response in the tyre during testing. In this mode they can be used to generate the parameters for a semi-physical tyre model such as FTire.
Testing outdoors, with a trailer, truck or vehicle, allows the investigation of tyre behaviour in the real world measuring tyre behaviour for tyres as they interact with real road surfaces. The obvious disadvantage is the variability in environmental conditions that can disrupt a testing programme and affect repeatability. This can be overcome to some extent by working at a test facility with consistent weather. This is one reason why most of the work that Jaguar Land Rover have carried out with their vehicle based objective tyre testing (VBOTT) vehicle, Figure 3 (bottom left), has been at the Idiada test facility in southern Spain. 13 The unique aspect of this form of testing is that the four tyres that actually drive the vehicle are also the test tyres.
A compromise between indoor and outdoor testing was offered with the development of the Camber Ridge test facility, Figure 3 (bottom right), in North Carolina. 17 This facility involved the use of a rig that followed a track circuit within a large building with the tyre running on a tarmac road surface. This rig allowed any dynamic combination of slip angle, load, camber and braking, and the environmentally controlled facility and asphalt surface provided the most repeatable and realistic testing conditions to date. Despite offering a solution that was potentially the best of both worlds, the system unfortunately did not become commercially operational.
Before moving on to describe the development of a tyre test facility for road-rail vehicles, it should be noted that another industry that test tyres is the aerospace sector. When an aircraft is landing, taking off or taxiing on the runway it is a ground vehicle where the aircraft is supported by the tyre contact with the runway. Compared with automotive tyres, the loads that aircraft tyres are subjected can be up to 300 kN for a large aircraft. These loads are huge in comparison to automotive tyres. As a result, the required test facilities are large, expensive and rare. Examples include the NASA facility in Langley, Virginia 18 and the Airbus TerraTyre test facility in Toulouse. 8
It should be noted that with a truck or trailer based test rig the vehicle must be large enough that the test tyre does not affect the trajectory of the driven vehicle, as it is this trajectory that dictates the test conditions for the tyre.
Similarly to the automotive industry but on a much smaller scale, the railway industry has assessed the tractional behaviour of rail wheels running on rails utilising different materials and under different ambient conditions. This to predict maximum traction of locomotives and to optimise traction control systems. One of the more recent experimental devices to investigate creep (slip in the automotive industry) for use under laboratory conditions and in the field has been designed by Doi et al. 19
Design, build and commissioning of the tyre to rail test
The tyre test rig used in this project was designed, built and commissioned at the Muller Technologies site in Frauenfeld, Switzerland. The company has its own section of rail track within the company premises which allowed for safe development and testing in a highly controlled environment. This section of track also connects with the main Swiss rail network.
Initial studies were clear in showing that no existing tyre rig or facility could be used and that for this investigation it would be necessary to design and build a bespoke test rig, intended specifically to test a tyre operating in contact with a rail-head, under conditions that represent the full range of conditions that a road-rail vehicle can experience in operation.
The ready availability of shunting engines meant that the test rig did not need to be self-propelling and that it could be either pushed or towed by the shunting engine. In the automotive sector, the most comparable test rig would be the trailer based tyre test rig designed and built at Loughborough University (Figure 3).
Before designing the rig a list of requirements were set up. In summary, these include:
(i) The rig would be guided and held on the track using normal steel rail wheels.
(ii) A sufficient length of test track should be available to allow the shunting engine and test rig to reach the required test speed, record the test results and then stop.
(iii) It should be possible to test standard pneumatic or solid rubber tyres used on road-rail vehicles.
(iv) It should be possible to test the tyre at a maximum load of 100 kN.
(v) The test wheel should be braked to allow testing for a longitudinal slip ratio ranging from 0.0 (free rolling) to 1.0 (fully braked with a locked wheel).
(vi) The rig should allow for adjustments in slip angle from −3° to +3°.
(vii) It should be possible to centre or laterally offset the tyre relative to the rail-head.
(viii) The rig should be durable, weather-proof and portable, allowing it to be transported to another test site if required.
(ix) The rig should make use of readily available instrumentation for all measurements and standard software for data processing.
(x) The rig should be able to test a tyre for a range of conditions and track contaminants, rain, snow, ice and mud, leaves or other friction reducing types of debris.
(xi) For future work, the rig should also be able to operate and evaluate the effectiveness of friction enhancing systems that add grit to the rail or other devices fitted to a road-rail vehicle that can remove contaminants from the rail-head.
A system schematic for the test rig that was designed to meet the above requirements is shown in Figure 4. The tyre/rail test rig uses features from most of the automotive test rigs discussed earlier, and draws in particular on the trailer based test rigs that have been used to test automotive tyres (Figure 3).
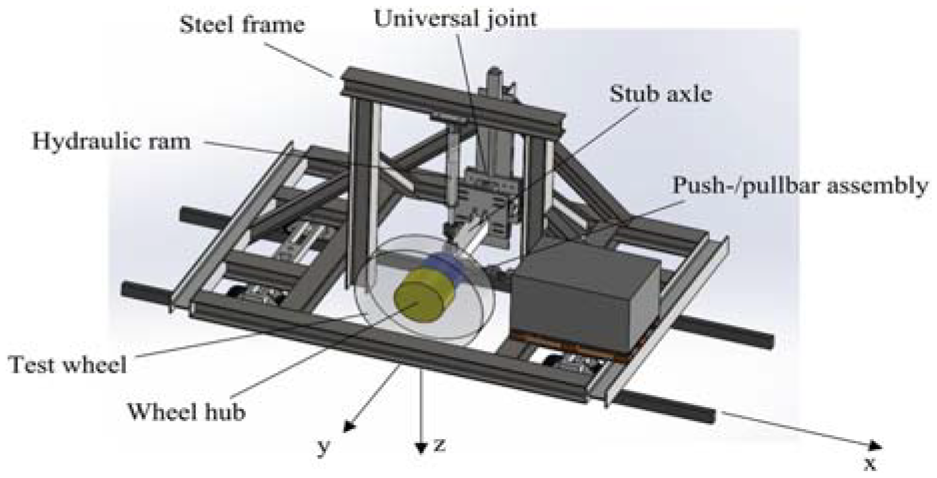
System schematic of tyre/rail test rig.
A stiff steel frame with a set of rail axles was designed to provide a strong base for the test rig, and the rig travels along the rails on four standard rail wheels. The test rig is propelled along the rails using a readily available shunting engine connected via a pull-bar link. The wheel hub for the test wheel is attached to a stub axle and the stub axle is attached to the base frame via a universal joint. The test wheel is hence free to move along the rails (±x-direction) as well as up and down (±z-direction). In the x-direction a push-/pull-bar assembly holds the stub axle and the test wheel in place. The push-/pull-bar also incorporates a load cell. In the z-direction a hydraulic ram applies a constant load to the test wheel. Hydraulic accumulators are used to ensure a constant load is maintained during the test and angular sensors are used to measure test wheel speed as well a reference wheel speed at one of the rail wheels.
A heavy-duty lorry type disc brake is fitted to the wheel hub. This allows a braking force to be applied that will cause a variation in slip ratio between zero, for a free rolling wheel, and 1.0, for a fully locked and sliding wheel.
The universal joint arrangement allows angular rotations to be set to the stub axle so that the camber or toe angle can be varied by ±3°. The tyres used on road-rail vehicles can experience changes in slip angle relative to the direction of travel when the vehicle is travelling on a section of curved track so the variation in toe angle was investigated during the programme of tests described in this paper. In real use the tyres on road-rail vehicles experience little or no camber change relative to the rail-head. Although a section of rail track may be built with camber, the rigid steel wheels that maintain the vehicle on the track ensure that any change in camber angle for the tyre is minimal. As such, camber angle was not considered during this test programme.
By measuring vertical load, longitudinal load, test wheel speed and reference wheel speed, the speed of the real forward motion, wheel slip, effective rolling radius and pulling power can be calculated.
A photograph of the tyre rail test rig that was built to specification described above is provided in Figure 5.
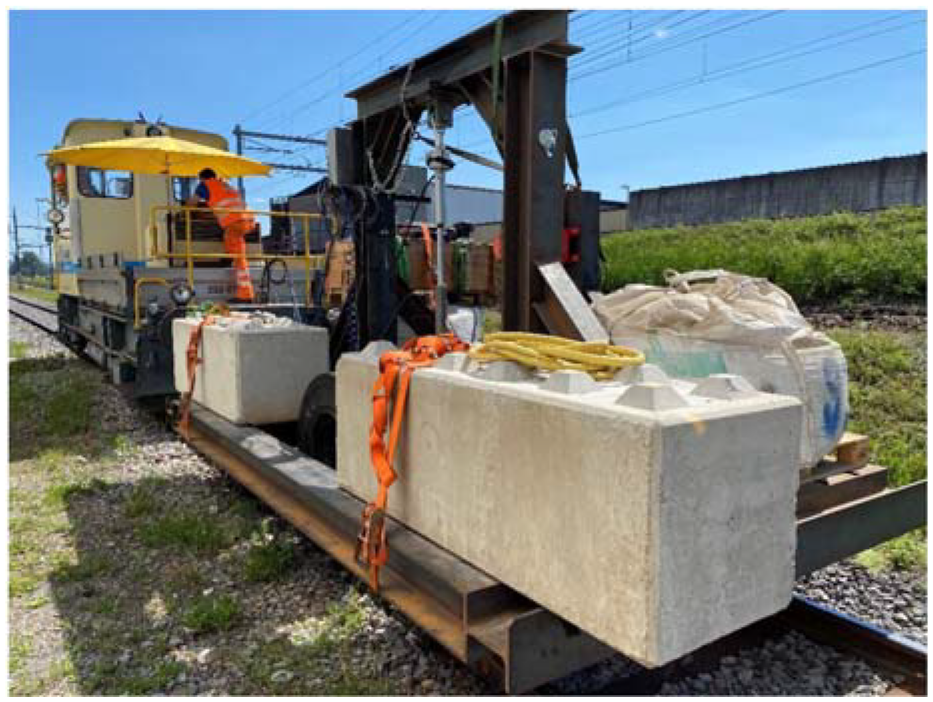
The Tyre Rail Test Rig in operation.
As can be seen in the photograph, the test rig needs to be ballasted with enough load to ensure that the hydraulic ram does not lift the test rig structure from the rails. This is essential does ensure that the maximum normal load can be applied, and then maintained at a constant value during any test run.
In the next section the full programme of tests is described and an evaluation of the test results is provided.
Results of tyre to rail testing
Test programme
Mapping out the full operational range of tyre states in different combinations can lead to an extensive range of individual tests, excessive testing time and the use of many test tyres. The automotive industry has had many decades of tyre testing experience, particularly on flat bed test machines. As such, research has been carried out that has led to more efficient tyre test procedures such as the GS2MF method that reduces the amount of testing. 16 To test the RRV tyres acting on the rail-head it was also necessary to plan an efficient test programme that would provide sufficient information to inform the development of a new tyre model and provide numerical data for the model parameters.
Before describing the test programme it is necessary to consider the way that the tyre sits on the rails. Traction tyres on RRVs rarely sit symmetrically on the tracks. Due to installations along the track and the specific guiding equipment on switches and crossings there exists a minimum track width between the tyres that must be maintained. Depending on the width of the tyre the centre line of the tyre and the centre line of the rail are offset by a certain amount. This is illustrated in Figure 6.
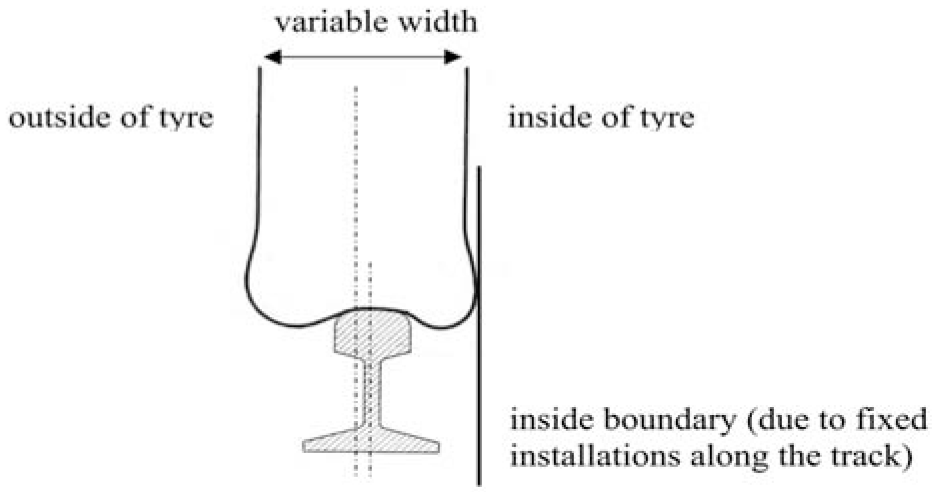
RRV tyre to rail offset.
Due to the geometry of the rail, the tyre will overhang on both sides of the rail that results in a narrow contact patch compared to the contact patch that would be generated when the tyre is on the road. The tyre offset can also experience slight lateral movement during cornering as a result of the relatively rigid guide wheels that are running slightly ahead of the tyres.
In all of the tests described here, the rig was driven in a straight line and the tyre was braked to vary the slip ratio between 0 for a free rolling tyre, and 1.0 for a fully locked and sliding tyre. The tyre was also inflated to its rated pressure, and the tests were performed on clean rails, at zero slip angle. The following parameters and conditions were varied according to the tests needs: Rail condition: dry or wet (two conditions) Tyre load: 17.5, 22.5, 27.5 kN (3 tyre loads) Speed: 4, 8.4, 16.3 kph (3 speeds)
The intervals chosen for the speed range may appear random but are generated by the need to drive the shunting engine in a selected gear throughout the test. This is required in order to maintain a constant speed. In terms of understanding the dependency of the tyre behaviour on speed this has no detrimental effect. The combination of the condition, load and speed parameters resulted in a programme of 18 tests.
Results
In this section a selection of graphs are provided to show the main results obtained during the test programme. In all of the graphs the curves plot braking force against slip ratio for combinations of the various tests. It should be noted that in order to generate a model that can predict the performance of the RRV on the rails the emphasis is on the amount of traction that can be generated and hence the overall pulling power of the vehicle. This can be understood from inspection of Figure 7 below and consideration of points A, B and C. Point A is at zero, point B is where the braking force initially peaks and point C defines the force generated for a slip ratio of 1.0. The behaviour is similar to a tyre on the road. Between point A and B the tyre response is dominated by elastic behaviour. Between point B and C the tyre response is dominated by sliding behaviour.
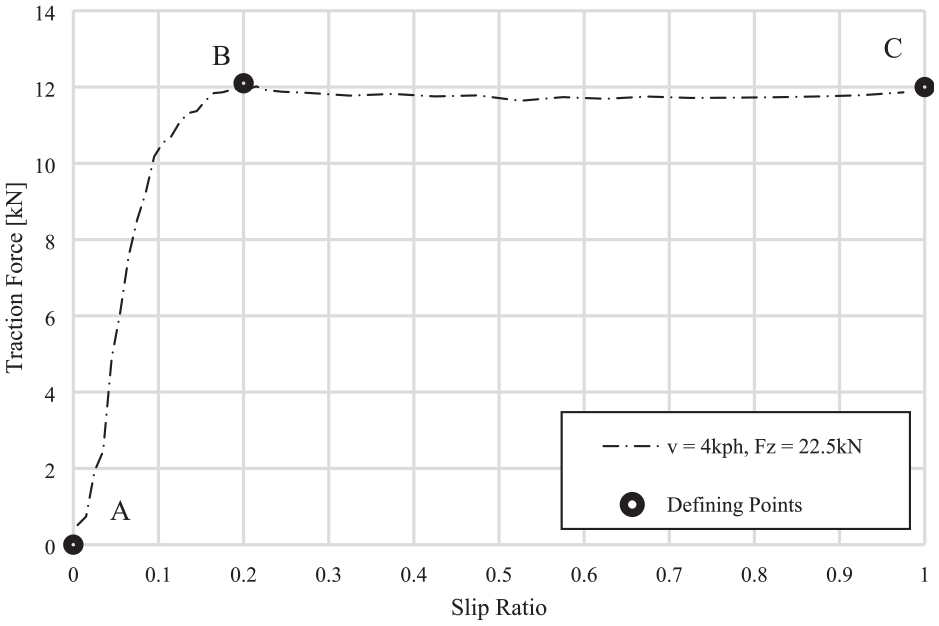
Main data points needed to define the tyre-rail model.
The points A and B are needed to generate the model. The gradient measured at point A defines the longitudinal stiffness of the tyre. This is critical for a road vehicle tyre model but is not so significant for a model that predicts the overall pulling power of slower moving RRVs. It should also be noted that in these tests braking force was measured. For this work it is assumed that there is a symmetric relationship between traction force and braking force. As such, the graphs are labelled on the x-axis as Traction Force.
Figure 8 shows the results for braking force versus slip ratio for a tyre load of 22.5 kN and a speed of 4 kph. For comparison, the results obtained on dry and wet tracks are plotted on the same graph.
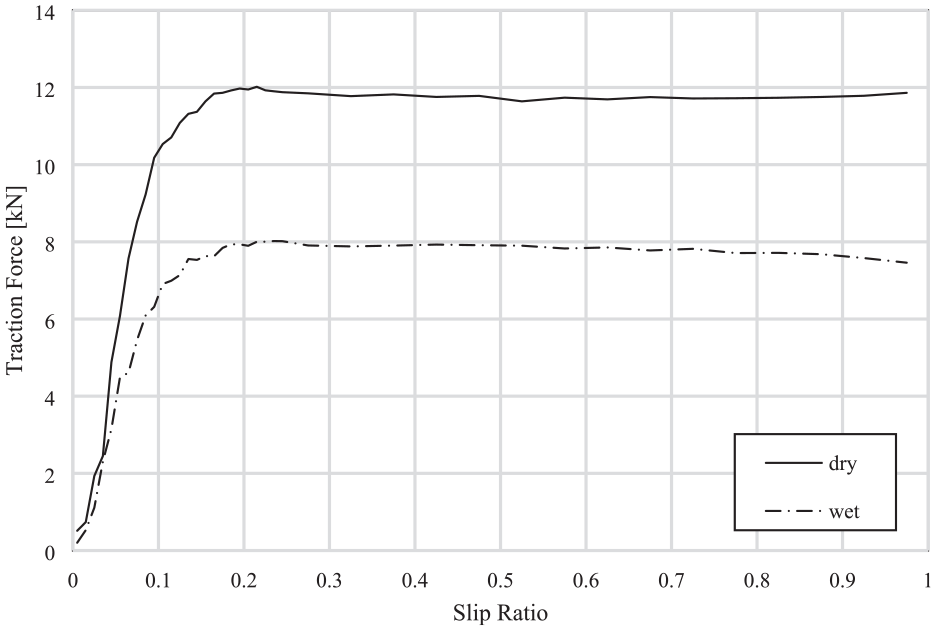
Braking force versus slip ratio (test load 22.5 kN, test speed 4 kph).
The results show, as expected, that the traction force is greater in the dry than in the wet. The peak values for traction force in the dry is 12 kN and in the wet is 8 kN. Both values peak at a slip ratio of 0.2. This is similar to the behaviour of tyres on the road and would be the target operating point for an anti-lock braking system (ABS). The results also indicate that the longitudinal slip stiffness of the tyre is greater in dry than wet conditions. This is also behaviour that would be expected for tyres on the road, but as stated earlier is not of immediate importance for a future RRV tyre/rail model.
Dividing the peak tractive force by the tyre load gives maximum coefficients of friction for the dry and the wet of 0.53 and 0.36 respectively. These initial results are already of use in RRV design. Simple calculations for an RRV of known mass, and when driven steadily at a constant speed, would provide a prediction of both the pulling power of the RRV on the flat and the ability to drive on an incline. Extending this to a tyre model would allow more complex multi-body system simulations for RRVs in real world operating scenarios such as when RRVs are traversing a bend.
These initial values indicate that the friction for the tyres on a rail are about 50% of the values that would be obtained for tyres on the road. The friction generated between a tyre and a test surface has two major components, adhesion and hysteresis. The hysteresis component relies on both the macro-texture and the micro-texture of the road surface. The adhesion component of friction relies on molecular bonding between the two surfaces. In wet conditions, the film of water contaminant between the two surfaces severely compromises the generation of adhesive friction, and the tyre is very reliant on the hysteretic component.
The head of the rail is relatively smooth when compared with a granular road surface, and so it can be assumed that there is no macro-texture contribution the hysteretic component. This will be a contributing factor to the indication from this test that tyres on rails appear from the initial test to generate approximately 50% of the friction as tyres on roads in both wet and dry conditions. The real situation will be more complex than that. The tyre also has a more narrow contact patch compared with a tyre on the road. This will lead to the generation of shear forces over a smaller area for an equivalent load and slip ratio. A full understanding would require an analysis of the shear stress distribution throughout the contact patch and the transition between elastic and sliding behaviour in the contact patch.
Another interesting aspect of this initial test is the friction generated in the wet. It might be imagined that the rail-head is very smooth and polished surface. If that was the case then the tractive force would be close to zero in the wet. The fact that a friction coefficient of 0.36 was achieved indicates hysteresis is in play and that the rail has a micro texture that is contributing to its generation. 20
A final feature of this initial test is the tractive force generated in both the wet and the dry when the slip ratio exceeds 0.2. In this region the friction is dominated by sliding behaviour. In the dry the value of tractive force is maintained at a constant. Similar behaviour has been noted experimentally 21 (albeit just at very low velocities), 22 when studying rubber on glass in dry conditions. As sliding increases, the rubber heats up and the temperature increase benefits the adhesion. For the initial test here, it can be seen that in the wet there is a slight drop in tractive force at higher slip ratios. This could be due to the cooling effect of the water and the fact the hysteretic friction does not benefit as much from temperature rise as adhesive friction.
In Figures 9 to 11 the traction force is plotted against slip ratio, for dry conditions at the three different speeds. In each figure the graph is plotted for the three test loads.
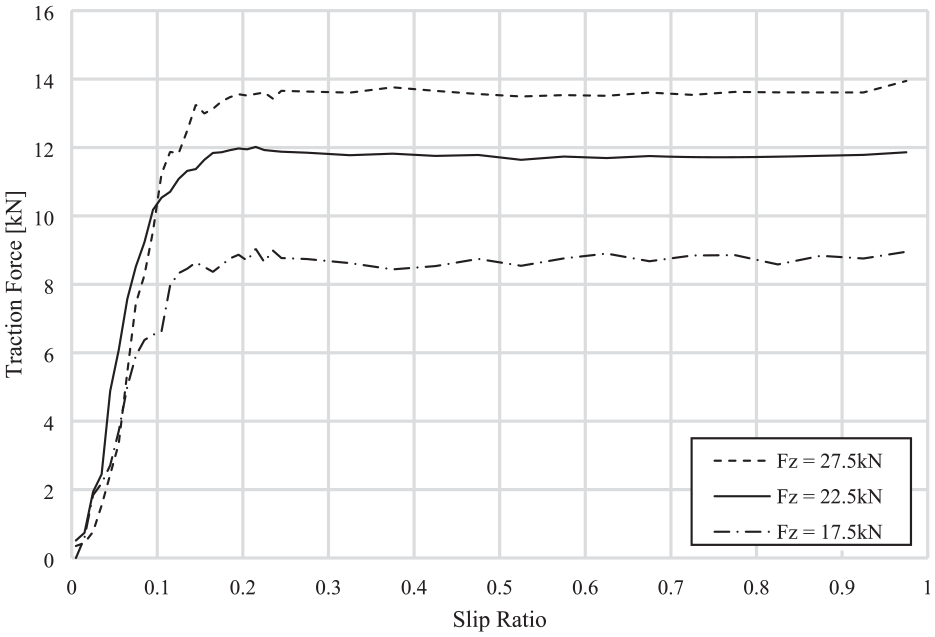
Test-speed 4 kph, dry (varying test-load).
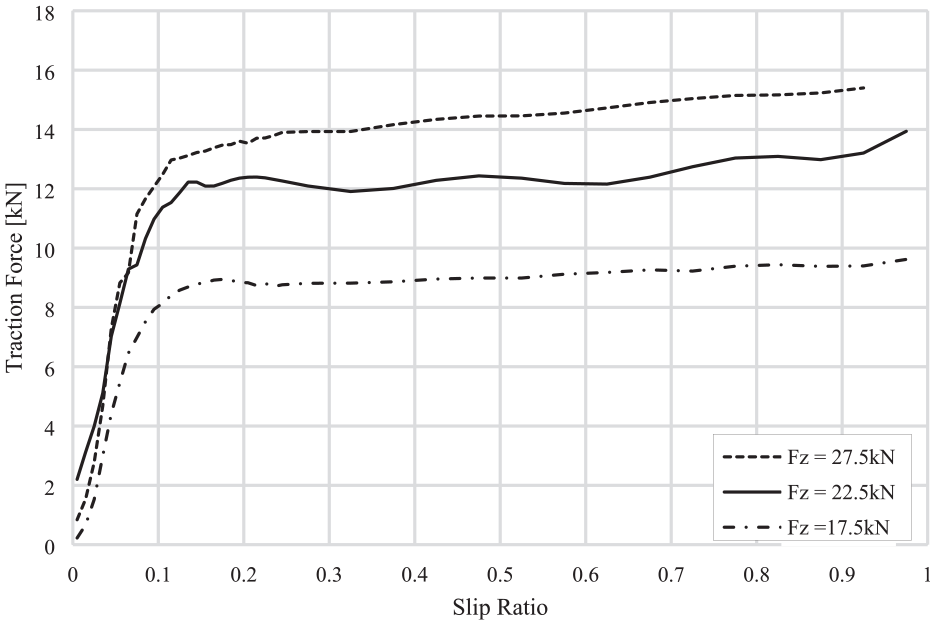
Test-speed 8.4 kph, dry (varying test-load).
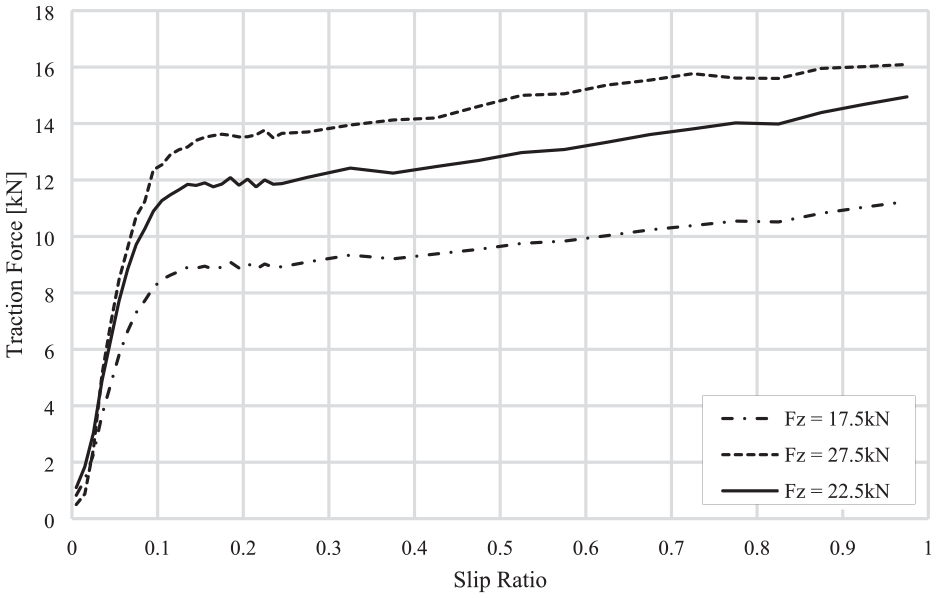
Test-speed 16.3 kph, dry (varying test-load).
The graphs show that as with tyres on the road the traction force increases with load and that the increase is not linear. At the lowest speed the traction force remains approximately constant after reaching the initial peak at a slip ratio of about 0.2. For the higher speeds this behaviour changes and the traction force, and hence the coefficient of friction, continues to increase steadily until the wheel is fully locked at a slip ratio of 1.0. This can be due to increase of kinetic and viscous friction with temperature21,22 or local wear.
In Figures 12 to 14 the traction force is plotted against slip ratio, for dry conditions at the three test loads. In each figure, the graph is plotted this time for the three test speeds.
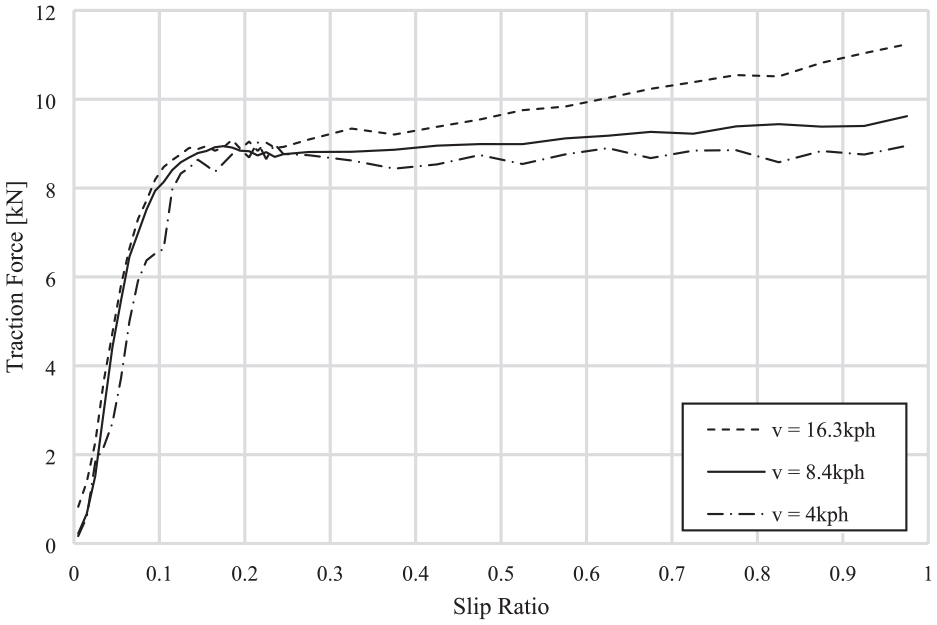
Test load 17.5 kN, dry (varying test speed).
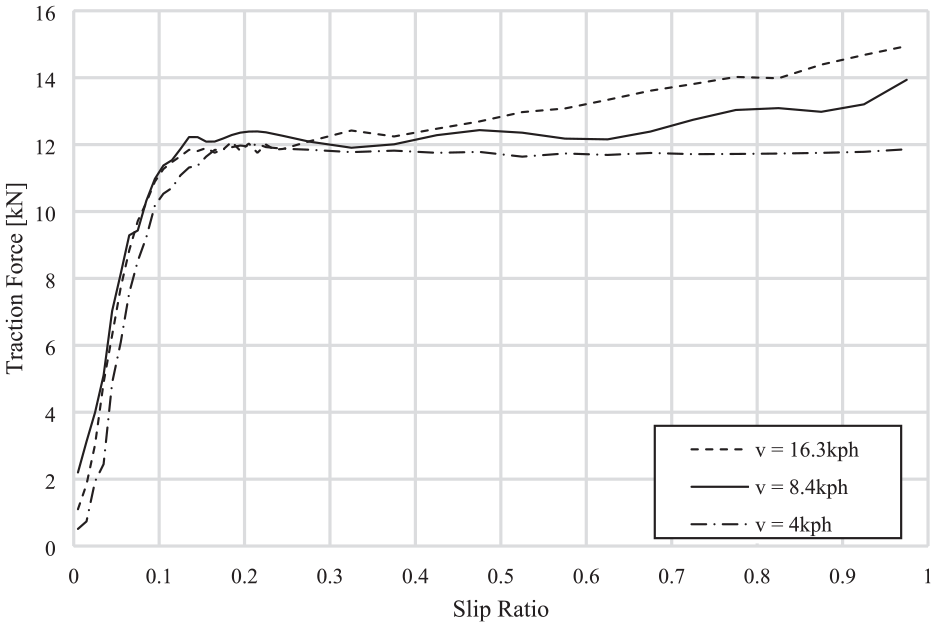
Test load 22.5 kN, dry (varying test speed).
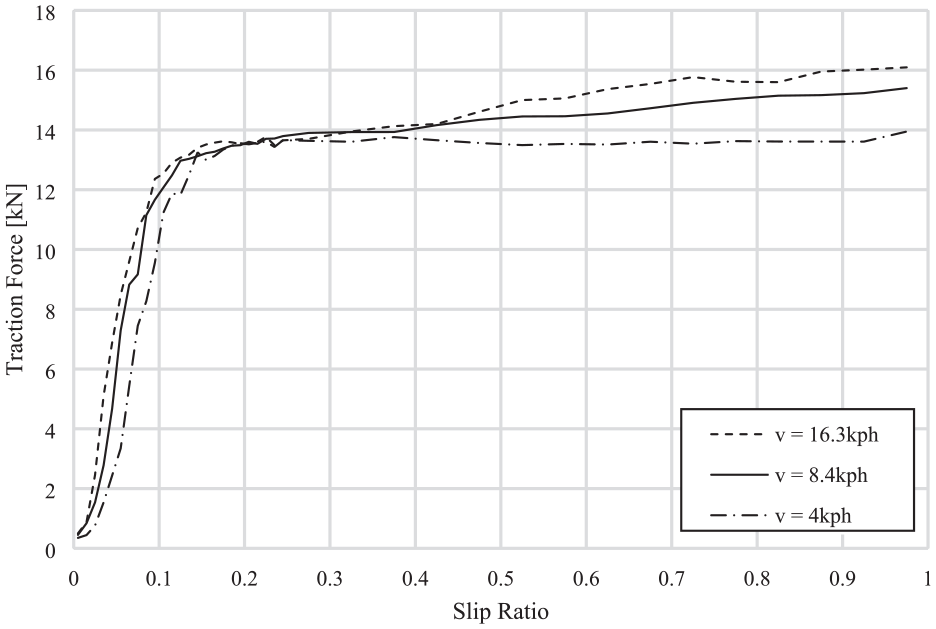
Test load 27.5 kN, dry (varying test speed).
For these three graphs it can be seen the speed has little influence on the tyre behaviour at low slip ratios up to and just beyond the initial peak at a slip ratio of 0.2. After this point it can be seen, as before, that the traction force continues to increase with speed up to a slip ratio of 1.0.
Summary
In order to get a good understanding of the traction pattern of a rolling tyre on a rail, load and speed sensitivity have been analysed for three different loads and three different speeds that are applicable for typical operation of RRVs. All nine combinations of load and speed have been tested using the purpose-built test rig in dry and wet condition. This lead to a total of 18 combinations of tests and has provided a good initial understanding of the influence of load and speed in wet and dry on the achievable traction force.
There are more conditions and parameters of interest, however, such as the contamination of the rail with rust, the small slip angle that can occur on a bend, the transverse positioning of the tyre on the rail-head, the tyre pressure and the ambient/rail temperature. The ongoing test programme will consider each of these in order to develop a comprehensive tyre model to simulate RRV operations.
Conclusions
A unique tyre test rig has been designed and built in order to perform a series of tests to measure the forces generated between a pneumatic tyre and a rail track. The results provide data that could be parameterised to populate a mathematical tyre/rail model to support the computer simulation and design of RRVs.
Tests were successfully performed to measure braking force as function of tyre slip ratio for a range of conditions relevant to the performance of RRVs during typical operations when on a rail track. It is assumed that the generation of the tractive used to drive a RRV has the same relationship as braking force with slip ratio, taking due consideration of any tyre coordinate system used in a future tyre model.
The operating parameters varied during the tests included tyre load and vehicle speed. The tests were repeated for both wet and dry conditions at the rail-head. The results indicate a behaviour that includes an elastic and a sliding region as usually observed when testing tyres on surfaces representative of roads. The friction coefficients estimated from the tests are approximately 50% of those obtained on the road in both wet and dry conditions.
It was expected that the friction estimated on wet rails would be lower than on dry rails when compared as a ratio to tyres on the road. This may be due to the micro texture on the rail surface contributing to hysteresis. Further tests will be carried out to investigate this.
Future work will also include taking thermal measurements to understand the relationship between traction and temperature as other parameters including slip ratio, load and speed, are varied. Future tests will also be performed to measure forces for extra conditions that can occur when operating RRVs. These include introducing small slip angles representative of those that occur when RRVs traverse a bend, introducing rust contamination at the rail head, and investigating the influence of lateral offset of the tyre contact patch relative to the rail-head.
The results obtained from this initial test programme have provided data that can support the development of a new empirical tyre/rail model to permit design simulation and optimisation of future RRVs.
Footnotes
Appendix
Declaration of conflicting interests
The author(s) declared no potential conflicts of interest with respect to the research, authorship, and/or publication of this article.
Funding
The author(s) received no financial support for the research, authorship, and/or publication of this article.