
Abstract
This paper presents the modeling and validation of a Hoosier R25B 18X6.0-10 racing slick tire using a Finite Element Analysis (FEA) environment. In parallel, the work shows a method of efficiently developing an FEA tire model for tire-road interaction estimation. To overcome limitations and the absence of material data from rubber and tire manufacturers, constitutive modeling of various tire parts is performed. Experimental validation for the tire’s constitutive modeling was performed through uniaxial tension tests with the ASTMD412 standard specimens and stress relaxation tests using the DMA TAQ800. This was repeated for various parts of the tire where the specimens were cut in perpendicular directions. The modeling of the tire uses solid elements in layers that interchange the tire materials in perpendicular directions. A comprehensive validation process was executed through static deflection at different camber angles, drum cleat, and rolling resistance tests. The FEA Hoosier R25B tire model simulation results demonstrated excellent agreement with the experimental tests within errors below 6%. This study outlines an efficient method to provide a robust FEA tire model that captures race tires’ complex mechanical tire-road interactions and contributes to advanced tire design and simulation tools for automotive applications.
Keywords
Introduction
Tire modeling has been an area of significant focus in the field of Finite Element Analysis (FEA), driven by the increasing demand for accurate simulations of tire performance under diverse operating conditions. In 2004, a study presented a method to simulate temperature distribution in a bias tire, linking strain energy dissipation from hysteresis to heat generation through dynamic and material testing, with a focus on computational efficiency for steady-state thermal analysis. 1 Later in 2013, a finite element investigation analyzed the effects of pavement, ambient, and contained air temperatures on tire–pavement friction, showing that higher temperatures reduced hysteretic friction while lower slip ratios and rougher pavements increased it. 2 While the findings offer insights into temperature-dependent frictional behavior, the reliance on finite element simulations without experimental validation limits the practical applicability of its conclusions. A recent study 3 has also developed a comprehensive formula for predicting tire rolling resistance force as a function of speed, inflation pressure, and load, validated through full 3D finite element modeling and vehicle coast-down test data.
The existing literature on tire modeling predominantly focuses on passenger and industrial tires,4–7 with limited attention given to the unique characteristics of race tires. Race tires experience extreme operating conditions, including higher speeds, loads, and temperature variations, yet most studies employ simplified models that fail to capture these complexities.8–10 Previous research has primarily validated tire behavior under static conditions or through low-fidelity simulations, leaving critical aspects like dynamic response, rolling resistance, and high-speed performance underexplored. 11 Notably, while some studies have attempted to estimate rolling resistance using finite element methods, these efforts lack the comprehensive validation required for race tires and do not account for the dynamic interplay of multiple stressors. This gap highlights the need for high-fidelity computational models that can accurately simulate race tire behavior under diverse operational scenarios.
This study aims to advance the state-of-the-art by developing and validating a high-fidelity computational model of a race tire, leveraging advanced material testing and computational techniques. The model incorporates the tire’s response in the static domain, its vibrational characteristics through a drum cleat test, and Rolling Resistance Coefficient (RRC) simulations at operational speeds up to 75 km/h, with a max RRC target of approximately 0.045, consistent with experimental findings. Unlike previous approaches, this study employs Lagrangian formulations and computationally expensive 3D FEA methods to capture the tire’s intricate behavior with higher precision. By utilizing comprehensive material testing methods and finite element modeling, this research validates the Hoosier R25B tire against experimental benchmarks, including static deflection, drum cleat testing for dynamic response, and rolling resistance performance. The insights gained from this work will contribute to the understanding of race tire mechanics and support the development of more robust and accurate simulation frameworks.
Materials and methods
This section outlines the Ogden material definition that is used to constitutively model the majority of the FEA tire model. Following this, standard specimens were prepared for experiments that are required for obtaining the Ogden material model parameters.
Material definitions
The materials that constitute the Hoosier R25B slick tire were investigated in this study. The rubber compounds and plies that make up the tire tread and sidewall were obtained using the American Society for Testing and Materials (ASTM) D412 standard. This standard is for vulcanized rubber and thermoplastic elastomers under tension. To be more specific, the test method outlined in this study is Test Method A, for dumbbell and straight section specimens according to D412, not the ring cut specimens. The tire was separated into four parts: the central tread portion, two sidewalls, and the bead. The cutting die was used to create specimens from the central tread portion and the sidewall. On the central tread portion, the die was used to create specimens in the longitudinal and lateral directions. A similar method was used to develop material properties in another study for another radial tire. 12 Due to the absence of manufacturer data for the tire compounds, ply layers, and ply angles, the cuts of the tire in different directions are used in a layered manner in the simulated model. It was important to capture the mechanical response of each material in varying directions to allow for the customization of the materials within the tire model. Figure 1 shows the tire’s sidewall, the longitudinal and lateral directions denoted for the central tread portion to which the specimens were cut. To determine the hyperelastic properties of the rubber and rubber ply compounds, uniaxial tension tests were used to determine the hyperelasticity of the tread and tire compounds. For this, the Ogden hyperelastic model was used to fit the experimental dataset. The Ogden model is the hyperelastic model of choice within ESI Virtual Performance Solutions (VPS) FEA environment. VPS FEA was used to simulate the tire and its Ogden hyperelastic materials as it is an accurate solver for tire-terrain interactions. The rubber modeling and rolling resistance tests in a simulation environment was found to perform effectively and replicate real-world applications in past studies. 6 The Ogden hyperelastic model is commonly used within FEA due to its accurate representation of rubber behavior and flexibility in curve fitting due to its use of stretch ratio exponents. 13 This Ogden hyperelastic model is a linear combination of strain invariants where the principal stretches are independent variables that are also subject to an incompressibility constraint. As mentioned, the Ogden hyperelastic model fits rubber and soft material effectively and is versatile as it can degenerate and represent Neo-Hookean and Mooney-Rivlin material models. The Ogden strain energy function as used in the VPS FEA environment can be seen in equation (1). 14
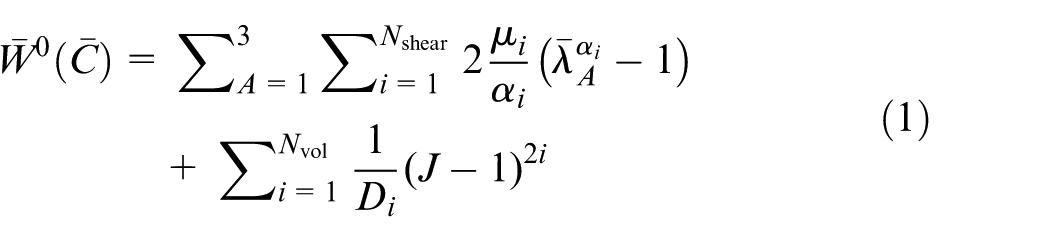
Where
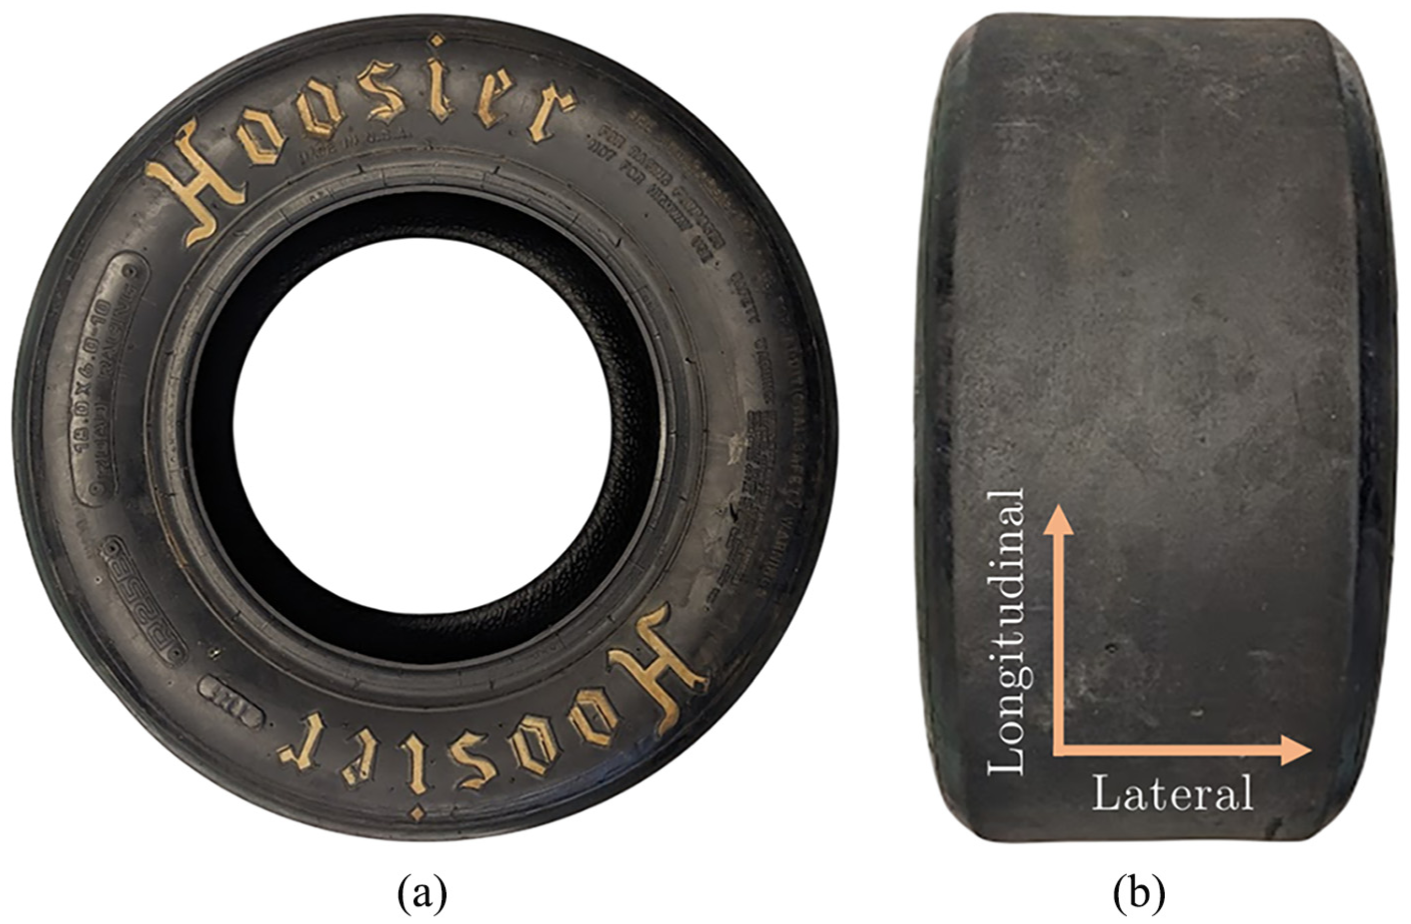
The R25B tire in parts of (a) sidewall and (b) central tread portion.
In order to determine the tire rubber’s viscoelastic properties, a stress relaxation test was done at varying strain rates. The viscoelasticity of the rubber was determined by the Prony series within VPS FEA. Unlike the process of obtaining the hyperelastic coefficients for the Ogden material definition, the FEA environment only requires the experimental results of the stress relaxation test to be supplied.
Material testing and methods
This section specifically outlines the specimen types and specimen preparation for experimental testing. The apparatus’ used to determine the stress-strain relationship in uniaxial tests and viscoelasticity tests and their test settings were described.
Hyperelastic material testing
The ASTM D412 specimens were cut using standard die cutters as seen in Figure 2. A variety of configurations of specimens were tested to obtain the Ogden material parameters required: a composite of the tread including rubber and plies, the rubber itself, the ply layers itself, and the sidewall. In more detail, the central tread portion specimens were separated into a rubber specimen and ply specimen using a precision cutter. Samples of the ply specimens that were separated from the rubber of the central tread portion can be seen in Figure 3.
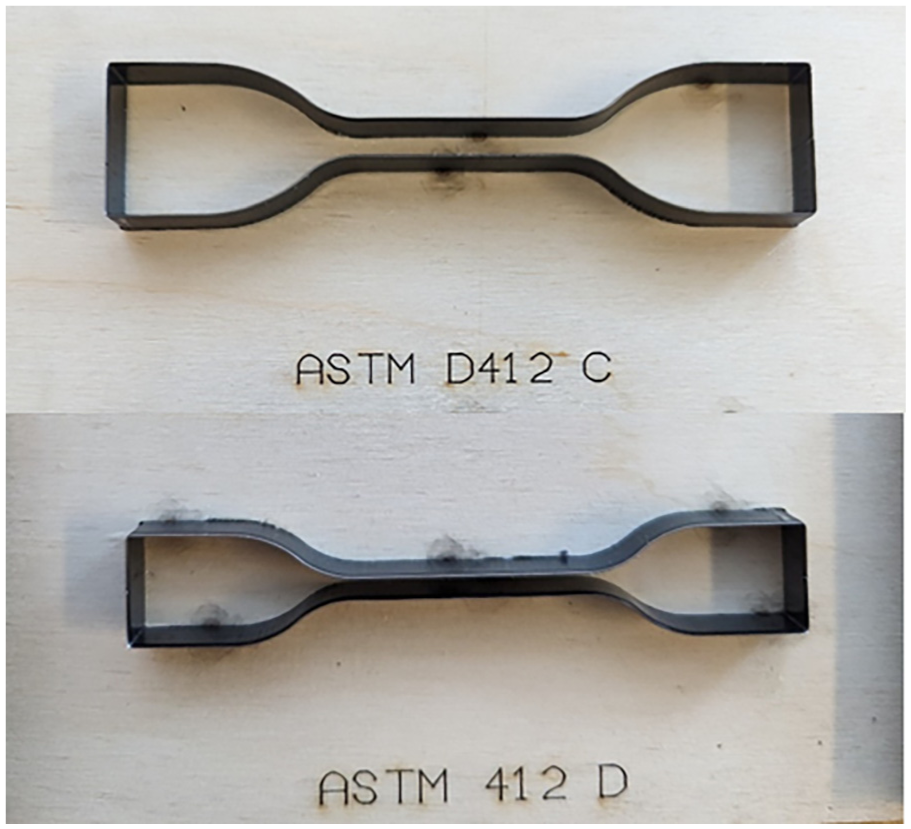
ASTM D412 C and ASTM D412 D die cutters.
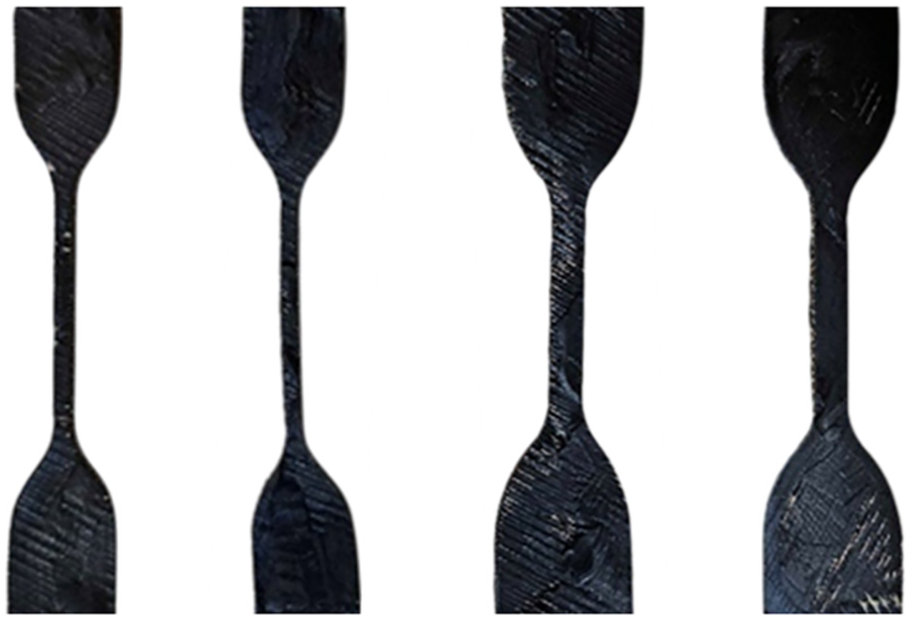
From left to right – ASTMD412-D lateral ply specimens ×2, ASTMD412-C lateral ply specimen, ASTMD412-C longitudinal ply specimen.
The LLOYD LS100 tensile test machine was used to determine the hyperelastic material testing of the ASTMD412 rubber, ply, and rubber-ply specimens. The LLOYD LS100 equipped with a twin maximum crosshead travel of approximately 800 mm was enough to capture the material properties required for the tire model in this study. A mechanical strain gauge was attached onto the specimens and its resulting stress-strain relationship was outputted. The strain rate was set to 20 mm/min and the force, stress, and strain were recorded from the experimental procedure. The average of the test data for both specimens were taken as experimental data sets for curve fitting. A sample of the setup can be seen in Figure 4 for an ASTM D412 D longitudinally cut rubber from the central tread portion clamped in the LS100.
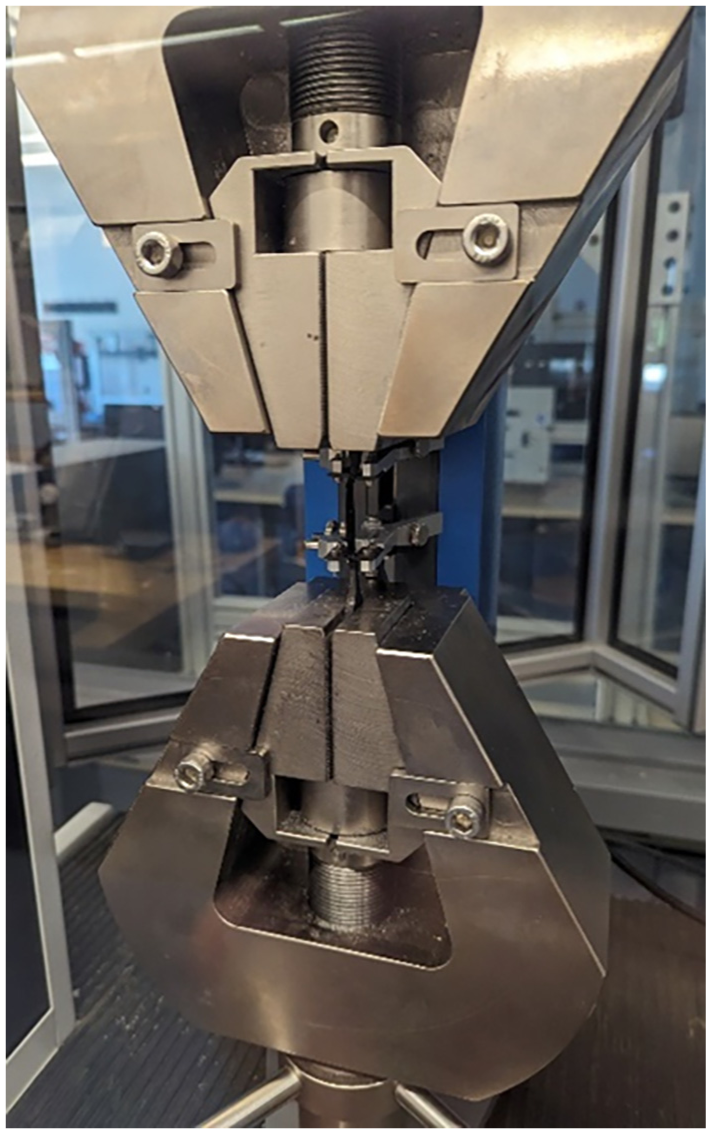
ASTM D412 D longitudinal central tread rubber specimen setup in the LLOYD LS100 tensile test.
Viscoelastic material testing
The Dynamic Mechanical Analyzer (DMA), TA Q800 was used to precisely analyze the mechanical performance of the rubber samples for stress relaxation performance. The DMA works by applying a controlled static or dynamic force or strain to a material sample and measuring its response. The output response can be displacement (when force is applied), variation in force (when displaced), storage modulus, loss modulus, and phase lag between the applied force and the resulting deformation. From this and much other information obtained from DMA, it is possible to obtain insight into how the material’s viscoelastic properties change under different conditions. DMA instruments usually have different types of clamps for different types of testing of materials. For this study, a thin film tension clamp was used for the tensile testing and stress relaxation performance of rubber material. This testing was done at room temperature condition which was set at 30°C.
Stress relaxation testing in DMA involves subjecting a material sample to a sudden constant strain and then observing how the stress in the material decreases over time. The sample used for this testing was standard rectangular shaped with a width of ∼2 mm and thickness of ∼2 mm. For more accurate measurements each sample was measured accurately at three different points in the gauge length and the average value of width and thickness was put in the machine sample dimensions. These samples were cut using a waterjet cutter in order to maintain consistent specimen sizing. This was crucial as the specimens were required to be much smaller to fit in the TA Q800 compared to the LLOYD LS100, and thus the results were highly sensitive to geometry. In this test, the sample was first deformed to a specific strain level (20%, 60%, and 80%) using the DMA instrument. Once the desired strain was achieved, the strain was held constant while the stress required to maintain that strain was monitored. This decrease in stress was recorded, and the data was used to analyze the material’s viscoelastic behavior, particularly its ability to relieve stress over time. Each of the stress relaxation tests were performed for 2400 s. It should be noted that the TA Q800 was also used to perform a low strain tensile test of the rubber specimen which performed extremely similarly to the hyperelastic tests at low strains. The preload force applied was 0.01 N, the initial strain of 0.1%, and the strain rate applied for tensile testing was 5%/min. A setup of the rubber specimen in the TA Q800 tension clamp can be seen in Figure 5.
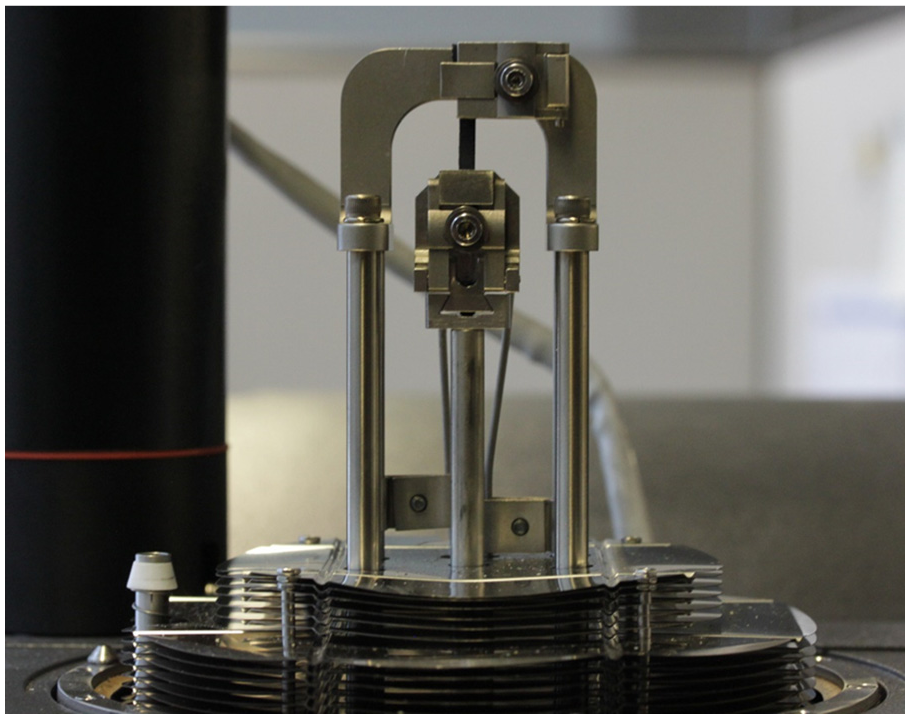
Rubber specimen setup in the TA Q800.
Finite element modeling
This section discusses the modeling procedures within the FEA environment for the study. The ASTM D412 FEA model is described in detail alongside its simplified gauges specimen model. Additionally, the method of constructing the FEA tire model and its various parts are outlined.
ASTMD412 specimens
To additionally validate the curve fitting procedure from VPS, identical ASTM D412 of a few specimens were modeled in VPS and subjected to the same loads in the experimental procedure. To simulate the physical testing performed on the ASTM standard samples, finite element models of the samples were created using the Ogden hyperelastic model provided in VPS. The ASTM D412 sample geometries were used to generate the specimens in the FEA environment. A mesh density using element sizes of 1 mm was used to improve simulation accuracy and adequately reduce the hour-glassing effect on the elements. The tensile strength data from physical testing utilizing both the ASTM D412 sample geometries were used as inputs for VPS’s Ogden curve fit tool. The Ogden terms from the curve fitting were then used to describe the material properties of the rubber and ply materials of each sample.
Two designed FEA models were produced to successfully analyze the Ogden parameters, a high-density rectangular mesh using the ASTM D412 geometries, and a high-density rectangular mesh using only the gauge of the ASTM D412 samples. The gauge simulations were produced because of computational expense, due to the significant reduction in the number of elements and nodes. Based on the outputs of each simulation, it was observed that the gauge simulation did not alter the outputs of the simulation.
The ASTM D412 geometry simulations using the rectangular mesh consisted of 160,900 elements and 18,088 nodes. The gauge geometry simulations consisted of 7680 elements and 9802 nodes, resulting in the fastest simulations, allowing for significantly faster iteration cycles. A sample of the ASTM D412 rubber-ply composite specimen in its full geometry and its simplified counterpart can be seen in Figure 6.
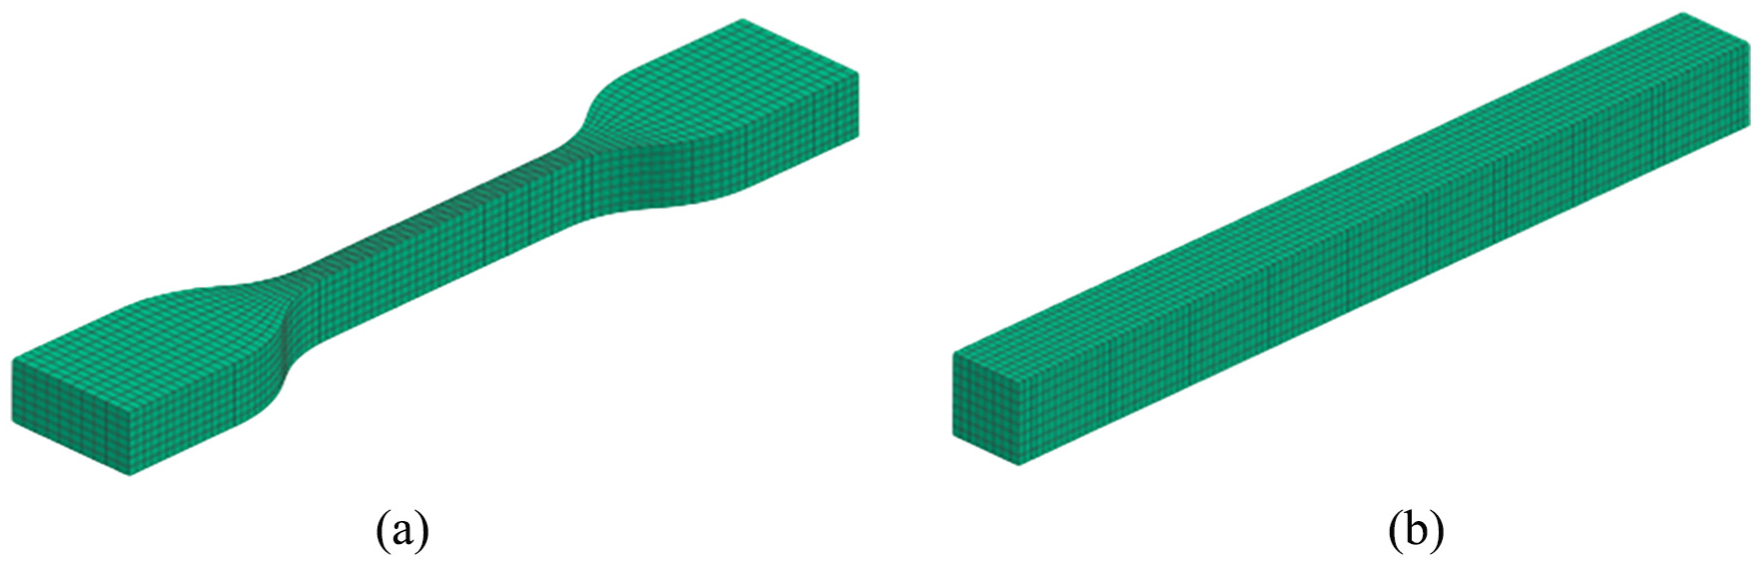
(a) ASTM D412 D rubber-ply composite specimen FEA model and (b) gauge specimen FEA model.
The boundary conditions were applied to mimic the physical material testing performed on the LLOYD LS100 tensile test machine. The clamping surface nodes were made into rigid bodies simulating the clamping of the tensile test machine. For the gauge geometry simulations, the ends of the gauge were made into rigid bodies to simulate the fixed ends of the clamping surface.
A fixed displacement boundary condition was applied to one end of the sample while a concentrated load force was applied to the opposing end to simulate the force applied to the sample. The loads applied to the samples were determined from the tensile strength tests and utilized a linear ramp from 0 N to its peak force. To measure the outputs of the simulation, nodal time history was applied to the gauge nodes at the center of each face to measure the displacement of each node and elemental time history was applied to the elements at the center of each face to measure the stress of the gauge elements.
Hoosier R25B tire
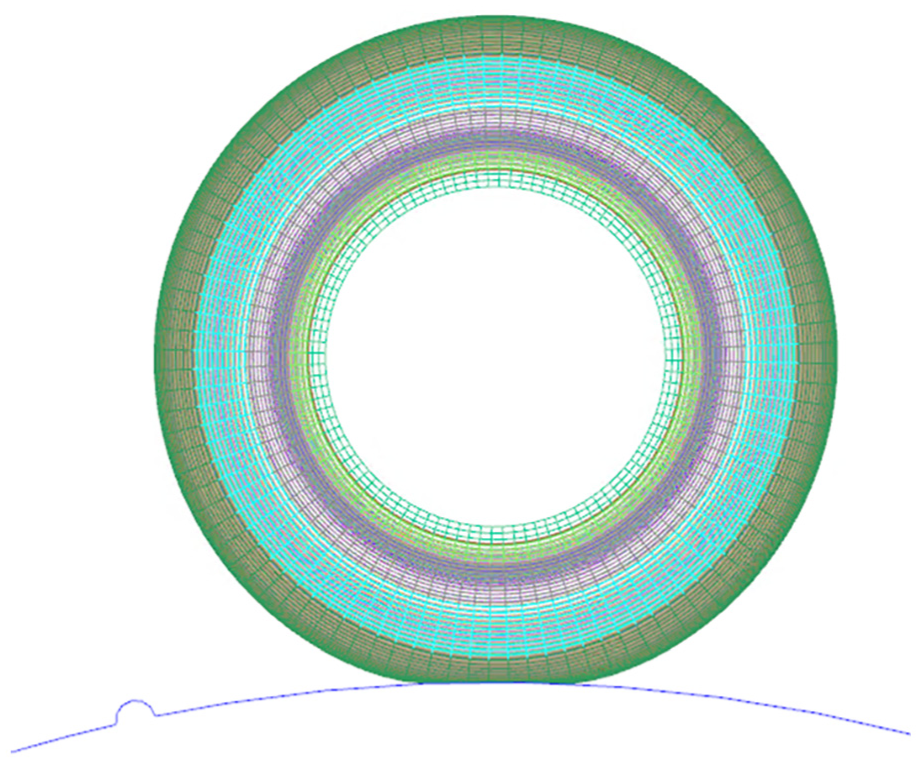
To model the Hoosier R25B 18X6.0-10 Tire, the tire was measured in both its external and internal dimensions along with its cross-section to determine its internal construction. The inflated R25B tire FEA model can be seen in Figure 7. The deflated tire dimensions were taken when the tire was recreated in the FEA environment. The sidewall nearest to the bead included an additional layer of nylon ply, increasing the stiffness of the region, and extended toward the mid-section of the tire’s sidewall. The nylon ply and the rubber of the tire were found to be around 3–3.5 mm thick in the tread of the tire. To adequately simulate the tire, the material properties of the nylon ply in the longitudinal direction, lateral direction, and the rubber were implemented into the tire. When modeling the tire, the tire was split into five primary parts: the Bead, Lower Bead, Upper Sidewall, Lower Sidewall, and Tread. These distinctions allowed for different configurations of materials to achieve a more accurate model of the R25B 18X6.0-10 tire. The tire model also consists of 10 layers of material; different combinations of materials were trialed to achieve results that closely resembled tire testing data acquired from the Tire Test Consortium (TTC). Figure 8 depicts the various parts of the FEA tire model including its 10 layers. Aside from the bead, there were approximately 3–5 layers of rubber toward the outer wall of the tire. Toward the lower sidewall and lower bead, there was denser concentrations of ply layers, and thus more of the composite and ply material was allocated in those regions. The bead nodes were constrained to a Center of Gravity (COG) node that was located at the symmetric center of the tire in all axes. This tire center COG included the properties of the rim including materials and density.
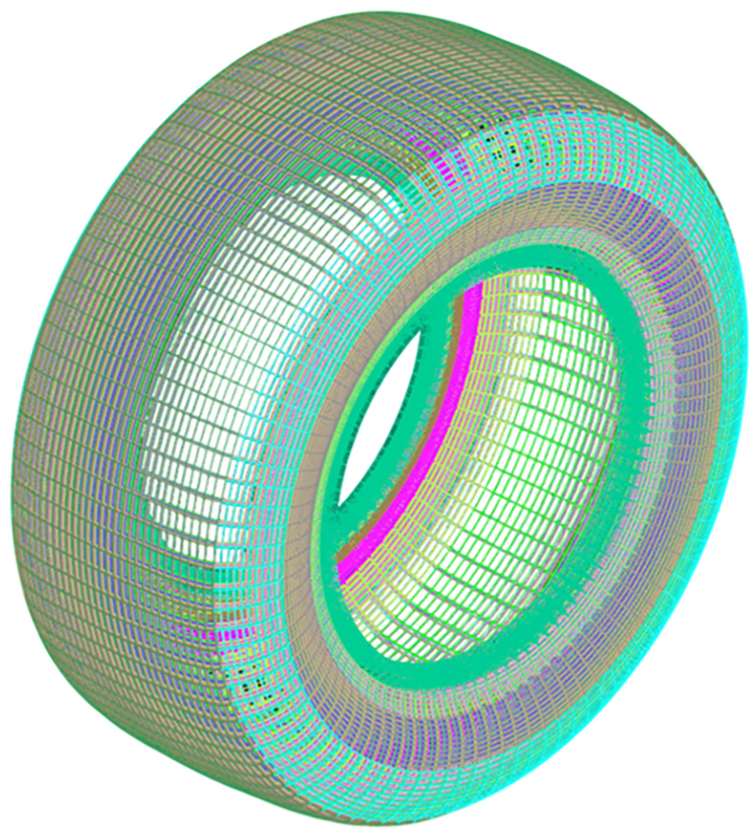
FEA Hoosier R25B inflated tire model.
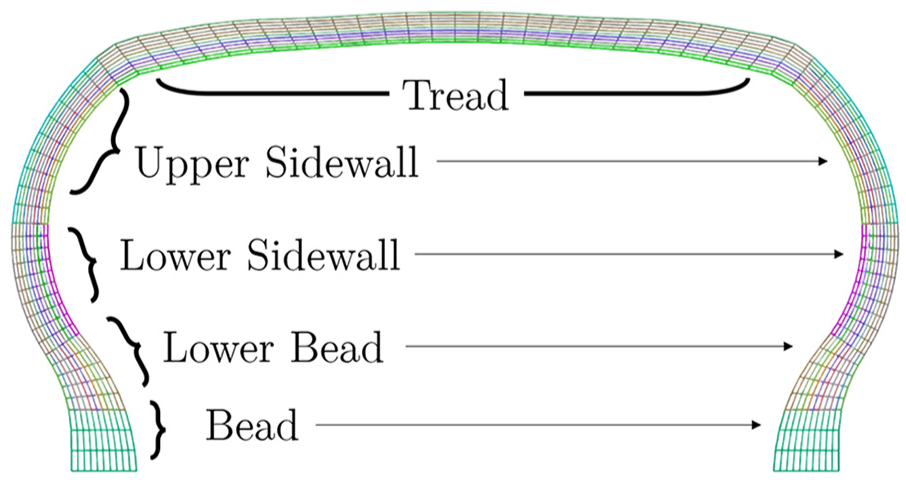
Hoosier R25B 18X6.0-10 tire parts in FEA model.
From the TTC, test data from Calspan of the Hoosier R25B 18X6.0-10 tire is available; the tire was tested on an MTS flat track machine and underwent tests varying loads, inflation pressures camber angles, rolling velocities, and slip angles. From these tests, the required experimental results were filtered for the validation and rolling resistance tests in this study to validate the FEA tire model.
Four primary simulations were performed to evaluate the accuracy of the tire model: static deflection to measure the stiffness with varying camber angles, drum cleat tests to determine the tire’s natural frequency, damping and rolling resistance simulations utilizing a drum to determine the tire’s rolling resistance. The tire model consists of 86,000 solid elements and was used for each of the tests to validate the model’s accuracy. The composition and modeling of the tire in the FEA environment accurately resembles the construction of the real tire and have been observed to be very agreeable to the experimental data. Each of the following simulation setups uses a non-symmetric master-slave node-to-segment-oriented contact for the tire-surface interaction. This contact was used due to its flexibility in dynamic simulations allowing for zero and non-zero contact thicknesses. 14 The contact definition also allows for thermo-mechanical simulations for future work. For more extreme tire maneuvers and large material deformations a sensitivity analysis or a parameter perturbation study is required to evaluate the effect of variations on model outputs such as model stiffness, contact patch, and rolling resistance. This can be done in future work by a sensitivity analysis through varying layering configurations, thickness distributions, and mesh sizing.
Static deflection simulation setup
The static deflection test is used to determine a tire’s stiffness when a vertical load is applied. The stiffness of the tire will vary for different inflation pressures, camber angles, and loading scenarios. The static deflection completed in this study looks at varying camber angles for a tire inflated to 83 kPa (12 psi) and loaded at 1112 N (250 lbs.). The simulated results were validated against the results gathered from the TTC datasets at the same testing conditions. In setting up each of the simulations, VPS standard “S2” units were selected (MM/TON/SEC/KELVIN) for all simulations. The boundary conditions of the tire were set up to fix the tire in the longitudinal and lateral translation and all rotational axes about the COG node. The tire is placed 50 mm above the road surface to allow for the tire to inflate and drop onto the surface. The load applied to the tire was ramped and is allowed to stabilize to minimize any oscillation the tire may experience during loading. A global damping value of 100/s is applied to all bodies within the simulation for 0.02 s to prevent any material penetration or abnormalities in the simulation as the tire stabilizes. To inflate the tire, a pressure face load of 83 kPa is applied to the entire inner surface of the tire, simulating the air pressure. A gravitational acceleration of 9810 mm/s2 is applied to all bodies within the simulation to simulate the effect of gravity. To simulate the camber of the tire, a frame was added to the tire to maintain the tire center COG node and was rotated 0°, 2°, and 4° along the longitudinal as seen in Figure 9. Nodal and elemental outputs were obtained from the simulations and configured to validate the results against experimental data.
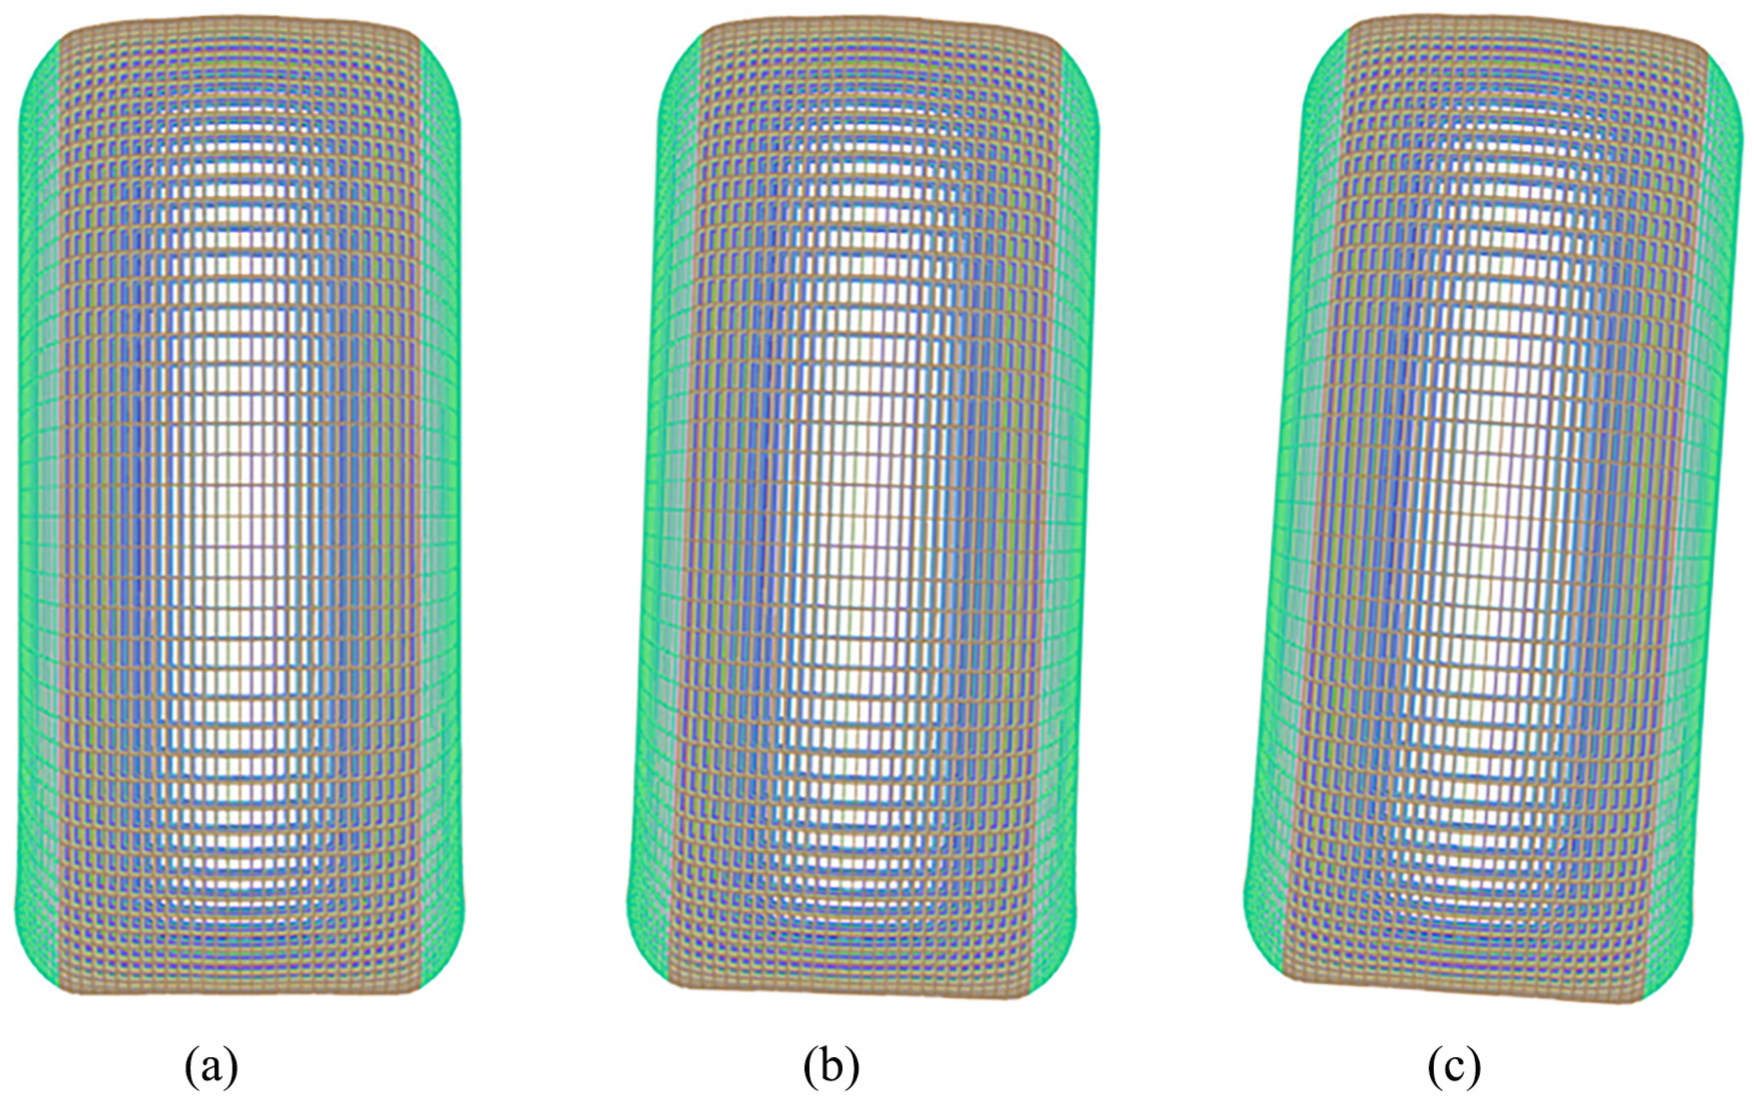
Tire setup at: (a) 0°, (b) 2°, and (c) 4° of camber for static deflection tests in FEA.
Drum cleat simulation setup
The drum cleat simulation was used to determine the tire’s response to an excitation as seen in Figure 10. The vibrational characteristics of the tire can be understood, allowing for the appropriate damping value to be applied to the tire’s sidewall for the subsequent rolling resistance simulations. In the simulation, the drum is designed with a cleat and rotates with a freely rotating tire fixed in a position. The tire rolls and eventually encounters the cleat on the drum which excites the tire. The contact forces are processed in VPS through a Fast Fourier Transform (FFT) to obtain the excitation frequency. In order to maintain contact with the drum and cleat, a sensor is applied which creates two unique states. The initial state allows the tire to land on the drum and settle, then the dynamic state maintains a fixed vertical height from the drum, preventing the tire from leaving the surface of the drum. When the sensor is activated, the vertically loaded axis is fixed and the tire’s rotational axis is free to allow the tire to rotate in its position. The tire is loaded at 890 N (200 lbs.), and a rim weight of 13.68 N was applied to the COG node. A rotational velocity is applied to the drum about its COG node for the tire to travel at 75 km/h, this speed sufficiently loads the tire to observe the vibrational characteristics of the tire.
Drum cleat tire simulation in FEA.
Rolling resistance simulation setup
The rolling resistance simulations serve to analyze the tire’s rolling resistance and verify the tire’s characteristics in accordance with the tire data provided by the TTC. This simulation is set up with the tire loaded and inflated over a rigid hard surface where it is free to roll over. Based on the FFT results from the drum cleat simulation, a damping value of 2 is applied to the upper and lower sidewall structures of the tire. To measure the tire’s outputs, a nodal time history and section force are applied to the tire’s center node to acquire the stresses and contact forces of the tire during the simulation. The tire free-rolls across the surface at 24, 40, and 73 km/h while the vertical load varies from 222 to 1113 N as per the TTC experimental datasets.
Results and discussion
The following section discusses the resulting simulated datasets from the FEA environment with the experimental datasets from material testing and tire testing. The material validation section discusses the results of the stress-strain relationship of the materials and its agreeability to the fitted model in FEA. Then, the comparison of simulated and measured values of the vertical stiffness, contact patch, and rolling resistance datasets are discussed.
Material validation
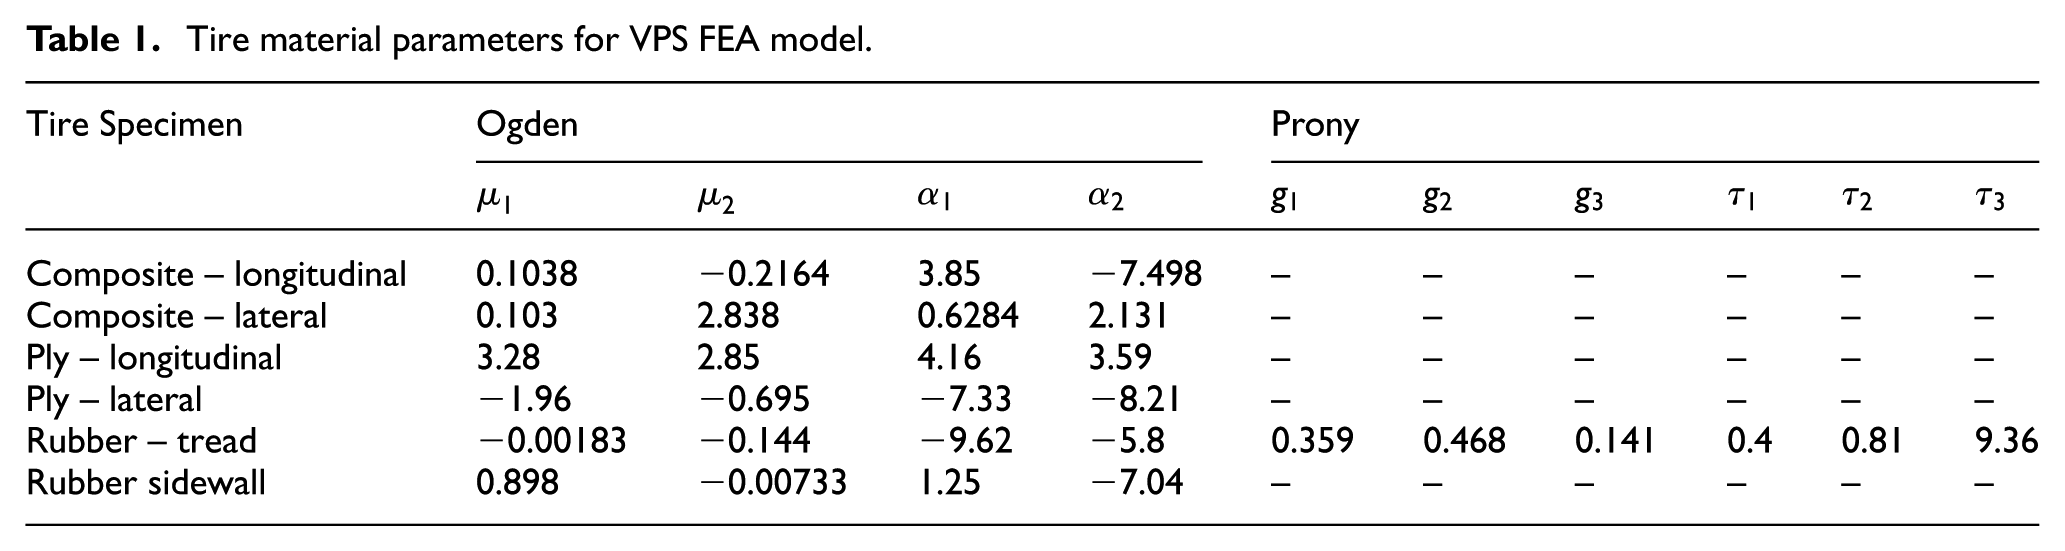
The material validation was completed using the VPS internal parametrization tool that determines the hyperelastic Ogden coefficients. The VPS parametrization tool fitted models for a rubber tread compound, a ply compound, and a composite compound that can be seen in Figure 11(a) to (c), respectively. The tool uses varying methods to solve the non-linear least square: The Levenberg-Marquardt method, the hybrid Levenberg-Marquardt/Quasi-Newton method, and the separable non-linear least square using Marquardt-Levenberg method. The Ogden material properties used in the multi-layered tire model can be seen in Table 1. The Ogden hyperelastic properties presented in Table 1 is used in alternating layers throughout the FEA model of the tire for simulations. The stress relaxation results were directly inputted into the material card within the FEA model. The FEA dog bone simulations performed with the material characteristics were agreeable with the experimental testing. The results shown in the following sections suggest that the obtained material properties are accurate and agreeable to experimental values. The non-linear viscoelastic behavior of the tread rubber compound was determined through a series of stress relaxation tests. The stress relaxation results of the tire tread compound can be seen in Figure 12. The stress relaxation test results were directly inputted into the material card of the rubber and did not require additional user processes like the hyperelastic model.
14
For the rubber compound at the tread, the Prony series coefficients (
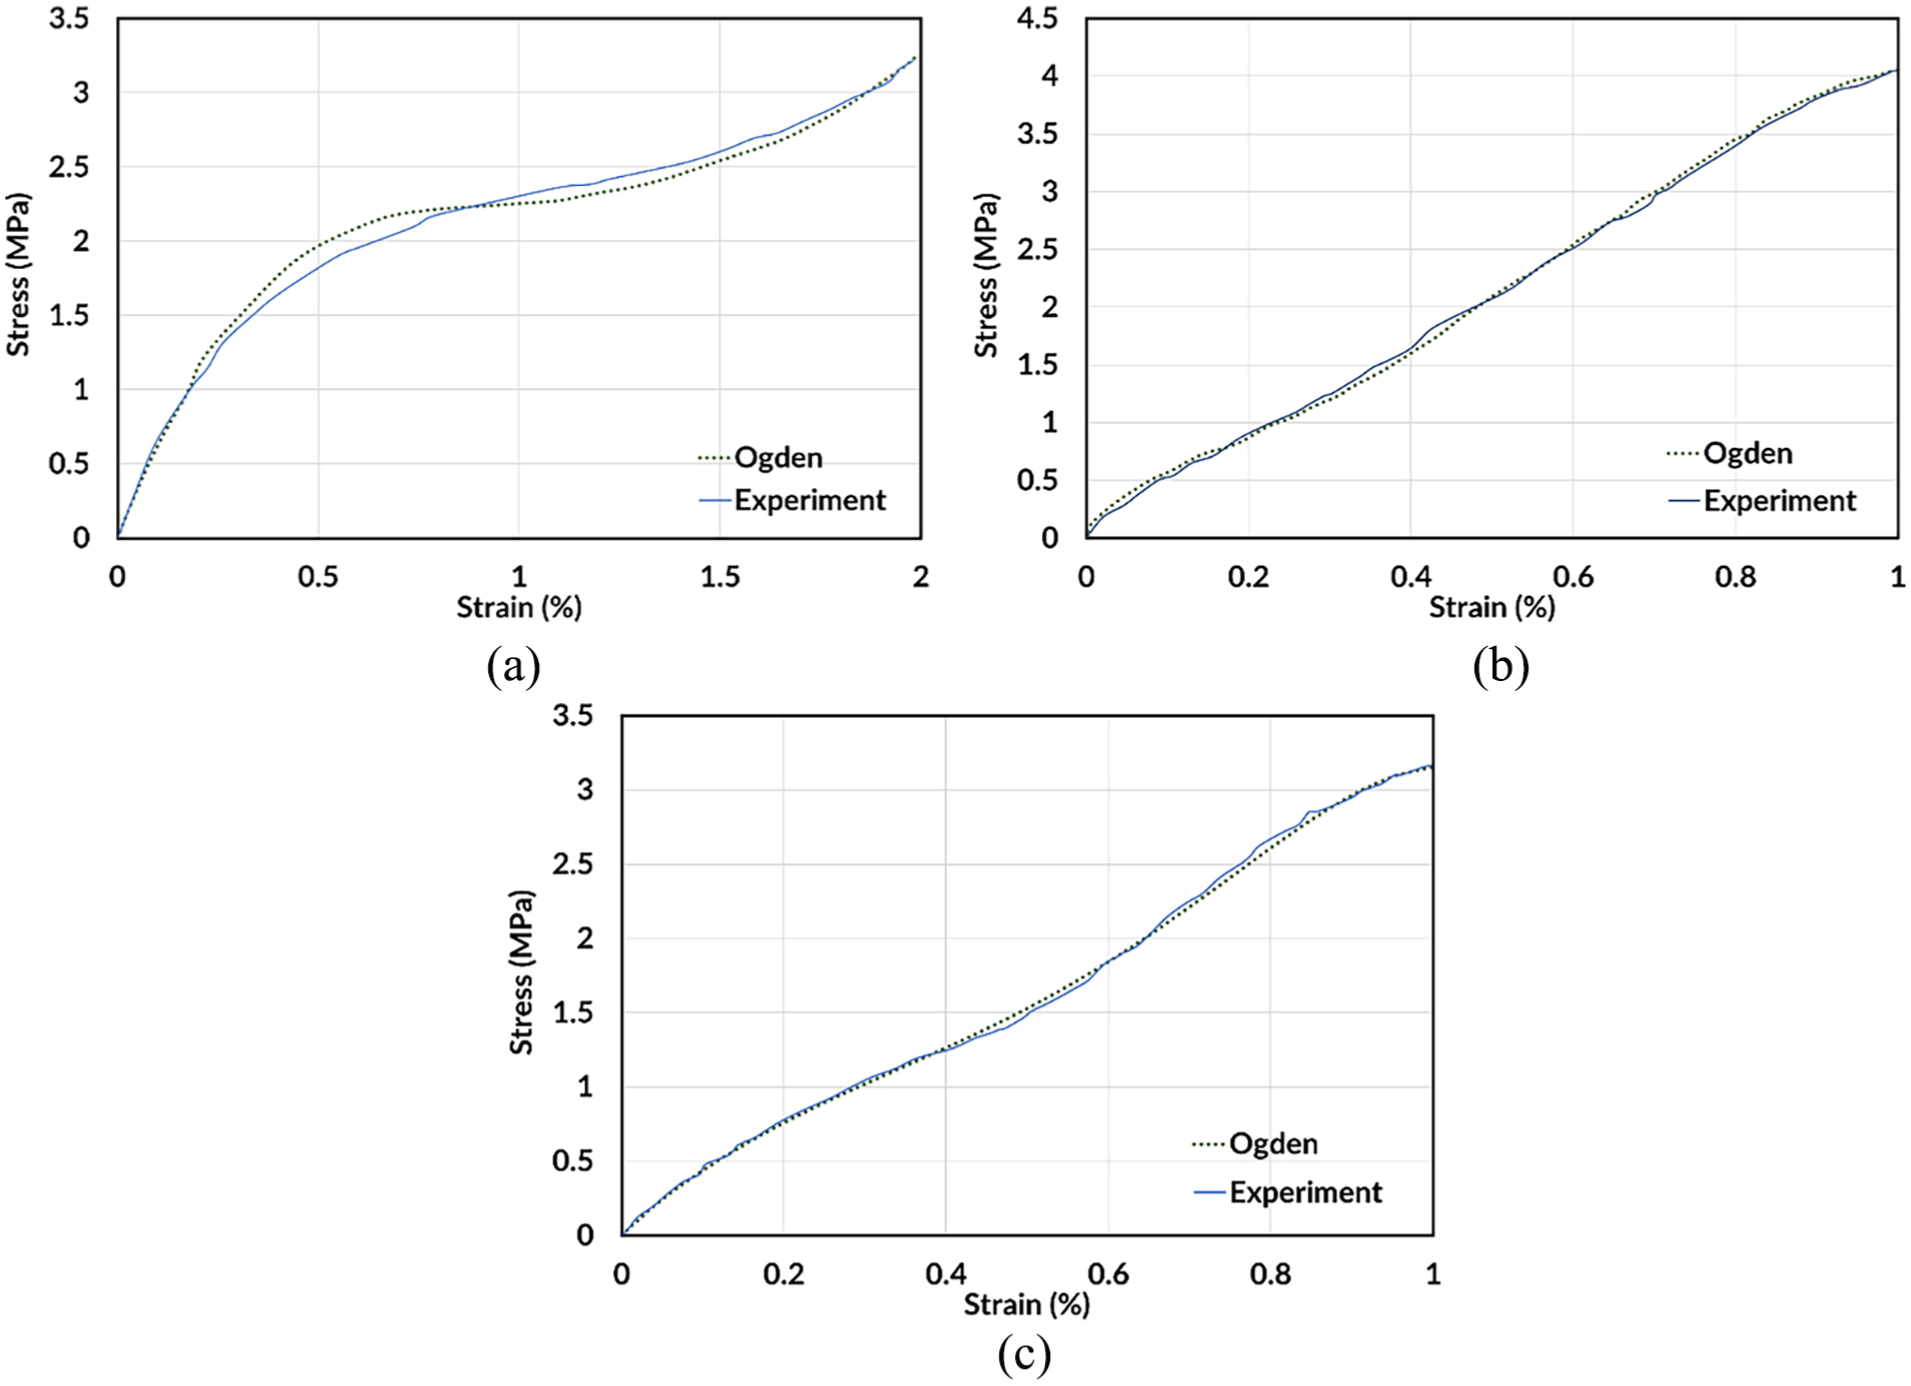
Curve fitting of: (a) rubber tread compound, (b) lateral cut ply, and (c) lateral cut composite, uniaxial experimental data for Ogden parameters.
Tire material parameters for VPS FEA model.
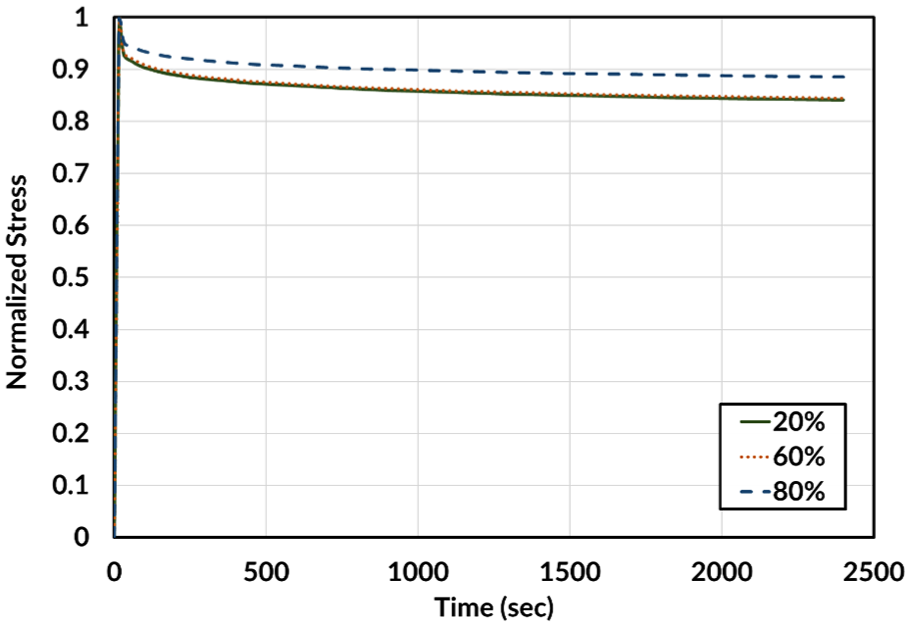
Normalized stress relaxation tests of the rubber tread compound.
Tire model validation
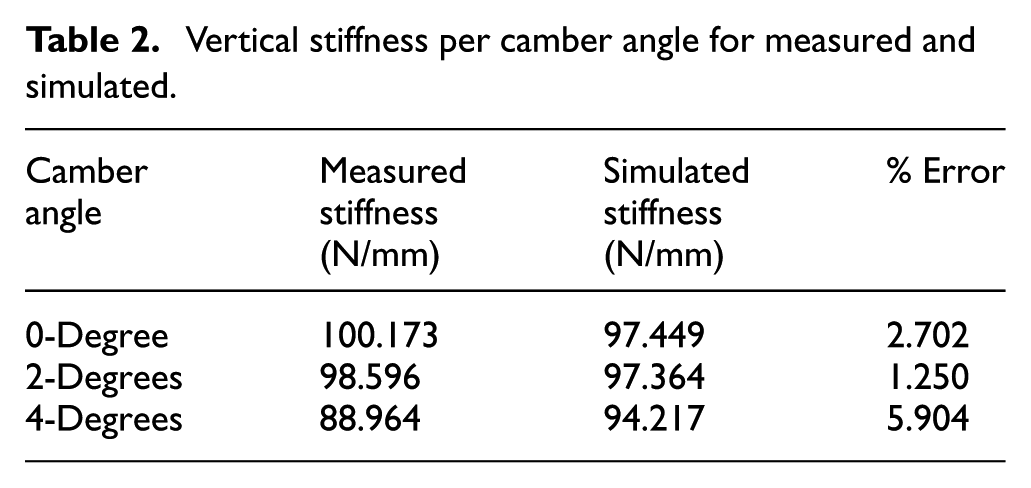
The experimental tests from TTC and material tests to validate the various tire rubbers, components, and ply compounds were all used to properly validate the FEA tire model in VPS. The vertical stiffness test was performed at 83 kPa inflation pressure and 1112 N vertical load. This test was repeated for 0°, 2°, and 4° camber angle. The target stiffness from the TTC tests were 100.173, 98.596, and 88.964 N/mm for 0°, 2°, and 4° camber angle, respectively. Table 2 outlines the results of the FEA simulation against the experimental target values. The largest error obtained was at 4-degree camber angle with a 5.904% error between the simulation and experimental results. The smaller camber angle (0-degree, 2-degree) stiffness values yielded much smaller error comparatively. Overall, the error compared to experimental results remains very small, and the stiffness results at all tested camber angles show extremely agreeable results in simulation. The error that accumulated at 4-degree camber angle may be due to the difference in construction within the FEA environment. In the actual tire creation process, the sidewall seamlessly integrates with the tread within a mold, however, this was not completely the case with the FEA model. The depth of sidewall rubber, tread rubber, and plies at the sidewall-tread region was determined by observing the cross-section. This observation that conclusively led to the final design of the FEA model may have caused a slight error in stiffness as more of the tire-surface contact is being made with the sidewall with additional camber.
Vertical stiffness per camber angle for measured and simulated.
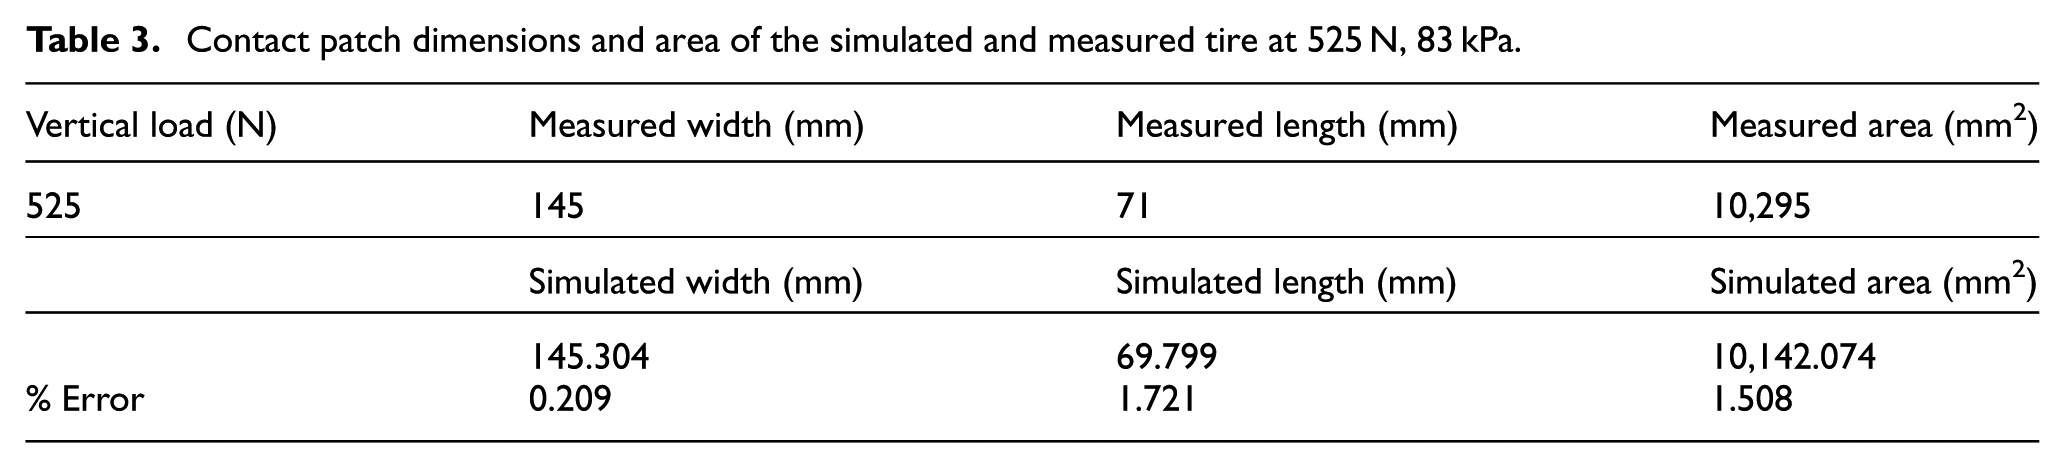
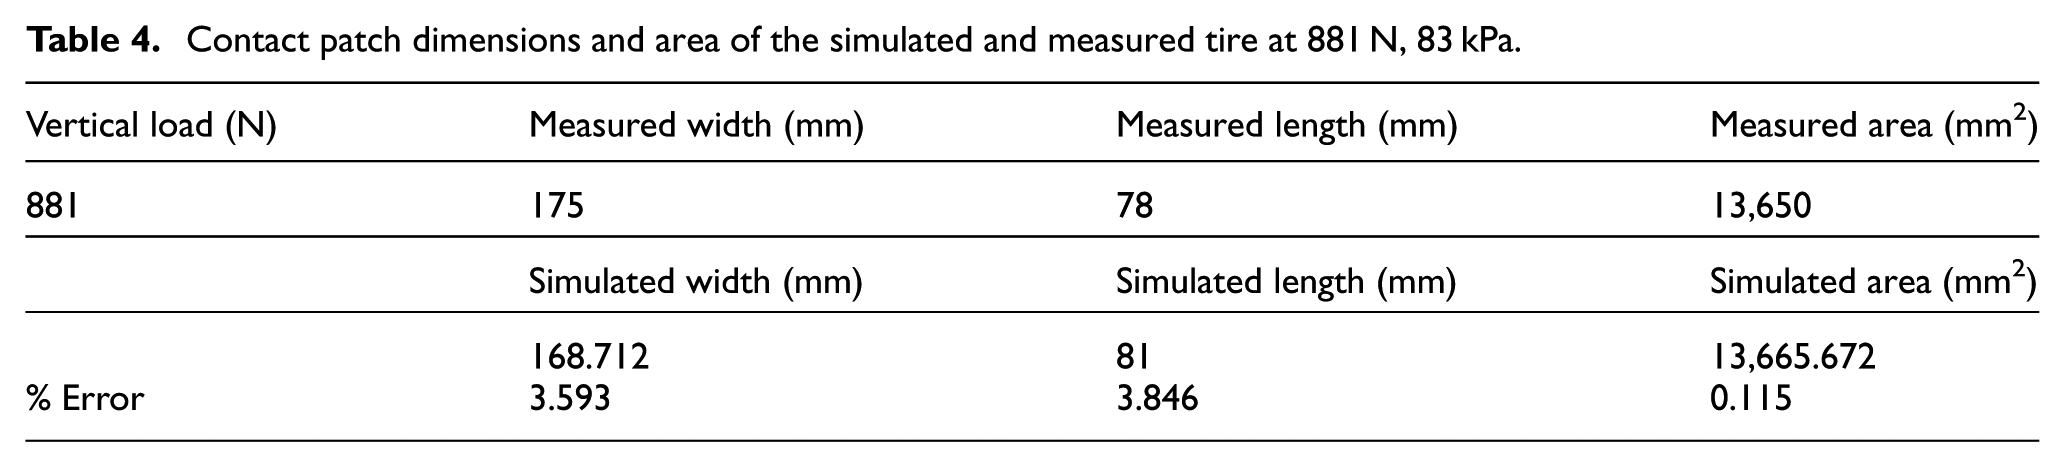
The contact patch test was completed at 83 kPa for 525 and 881 N loads. Where 881 N is the static corner load of the R25B wheel equipped on the university’s Formula SAE vehicle. The experimental contact watch was obtained by letting the tire loaded at a corner weight to sit statically onto a large block of clay. The tire’s static contact patch is then indented into the clay and the dimensions are measured. The simulated and measured contact patch obtained from the vertical stiffness test at 881 N and 0-degree camber can be seen in Figure 13(a) and (b), respectfully. The dimensions of the experimental and simulated contact watch can be seen in Tables 3 and 4. The error presented for the simulation for both width and length can be seen to be under 4% which suggests agreeable accuracy for the FEA simulated contact. Very slight error may be due to the ply composition differences in the FEA model. As mentioned, the FEA model sandwiched the lateral and longitudinal plies to imitate the complex overlapping plies in the actual tire construction.
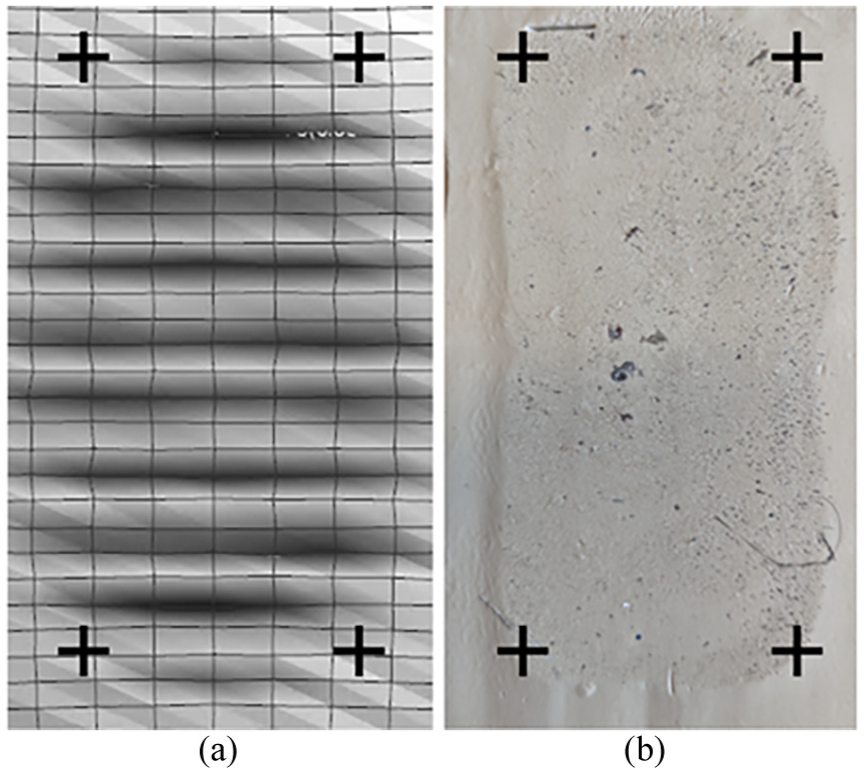
Contact patch comparison of: (a) simulated tire and (b) measured tire.
Contact patch dimensions and area of the simulated and measured tire at 525 N, 83 kPa.
Contact patch dimensions and area of the simulated and measured tire at 881 N, 83 kPa.
The rolling resistance coefficient for the tire at 881 N and 83 kPa for increasing longitudinal velocity can be seen in Figure 14. The FFT results from the drum cleat test presented a critical damping value of 2 for the sidewall. It can be seen for the entire range of velocity, the simulated RRC closely follows the experimental values gathered from TTC datasets. The error at lower speeds (∼25 km/h) can be seen to be very small at around 2.46%. The largest error is found at higher velocities at 3.45% when the tire is rolling at 72 km/h. The experimental rolling resistance coefficients were derived from the CALSPAN tire data provided. However, the provided rolling resistance data was determined through the slip test that CALSPAN performed, therefore results were filtered to obtain the required RRC values. The data was filtered at 0-degree slip angle, but it is apparent that extremely small angles close to zero were also included in this data set that the sensors did not filter out experimentally. This being said, the simulated results do show consistent agreement with all other experimental tests performed in this study which suggests the RRC simulated values are closely validated. The accuracy of the RRC test compared to experimental values confirms a successful validation of the R25B FEA simulated model. Within the RRC test, numerous factors affect the RRC outcome such as stiffness, contact, deformation, momentum, etc. The RRC tests, alongside the prior tests show the simulated race tire’s accuracy to the physical tire in multiple domains.
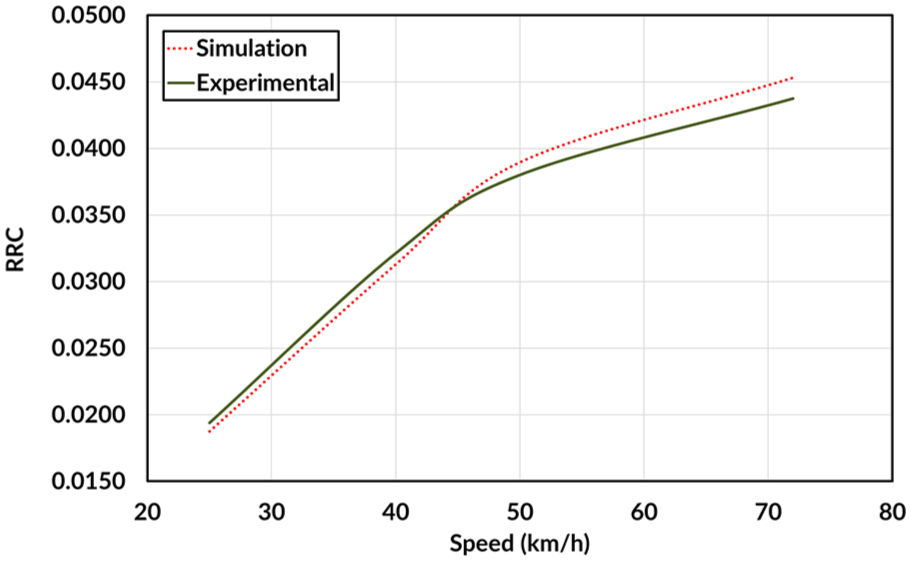
Simulated and measured RRC results at different speeds.
Conclusions
This paper presented a unique method for successfully modeling a racing car tire in the FEA environment. The approach shared similarities in tire material compounds validation from prior studies, however, the difference in the application of the materials within FEA presented a higher fidelity tire model. To overcome limitations and lack of information for mechanical properties of tire rubber compounds at various tire sections, standard specimens are obtained, tested, and validated using FEA environment. The study discusses the effectiveness of a tire model using multiple material layers of various materials from constitutive modeling. The methodology is a time and cost-effective manner to developing a high-fidelity tire model. The validation study shows very agreeable results throughout the static deflection, contact patch, drum cleat, and rolling resistance tests, with the highest error of about 5.9% at 4-degrees camber angle. The difference in ply layering and integration of materials from the sidewall through to the tread may have resulted in the errors found in the study. That being said, the error remained low and is recompensed with an efficient methodology to create a highly accurate tire model in the FEA environment for tire-road interaction estimation. Further research using this tire model can done to further validate the tire under different maneuvers. This may include a validation study of the tire under cornering loads using the FEA model. The current model is validated under no variation for camber, inclination nor slip angle. Further validation of the tire under cornering maneuvers to observe the increase of friction dissipation energy at the contact patch under higher slip angles will be required for more advanced simulation. Moreover, for more extreme tire maneuvers and large material deformations a sensitivity analysis or a parameter perturbation study is required to evaluate the effect of variations on model outputs. Additionally, a wear and thermal simulations within the FEA environment using this tire model by validating it against experimental data from dynamometer testing is being developed. Modeling other tires, such as truck tires, may be effective using this methodology depending on their tread complexity.
Footnotes
Acknowledgements
The authors of this study acknowledge the Formula SAE Tire Test Consortium and Calspan Tire Research Facility for providing some of the experimental data presented in this article.
Funding
The authors disclosed receipt of the following financial support for the research, authorship, and/or publication of this article: The authors express their gratitude to Volvo Group Trucks Technology for their continuous support during the course of this study and NSERC Discovery Grant for partially funding this study.
Declaration of conflicting interests
The authors declared no potential conflicts of interest with respect to the research, authorship, and/or publication of this article.