
Abstract
Electric (e-) powertrain Noise, Vibration and Harshness (NVH) shows tonal behaviour due to the electromagnetic (EM) forces in the e-motor (leading to whistling noise) and the gear meshing (leading to whining noise). Tonal excitations activate different system modes as the motor speed changes, amplifying whistling and whining. Accurate prediction of resonance speeds and aggressive NVH is essential. Due to EM interactions, the e-motor exhibits EM torsional stiffness, affecting the system dynamics. Past studies considered EM stiffness in torsional vibration lumped parameter models, mostly neglecting flexible components (i.e. powertrain housing). In this work, the EM stiffness is calculated using the Frequency Response Function method and is included for the first time in the modal analysis of a three-dimensional e-powertrain model. This enables e-powertrain electromechanical coupling analysis during the design phase, considering the housing three-dimensional flexibility, a key NVH contributor. Conducting modal analysis with the EM stiffness shows effects on the system natural frequencies, along with the mode shapes at different frequency ranges and operating speeds, establishing an accurate design method to describe the e-powertrain dynamics and provide clearer insight on the NVH physics.
Keywords
Introduction
Electric vehicles (EVs) have gained increased popularity not only due to their improved energy efficiency, but also due to strong interest from environmentally conscious customers and legislations aiming at lower or zero emissions from vehicles. 1 The UK, for instance, has its Road to Zero 2 strategy that aims to end the sales of new internal combustion engines (ICE) by 2040. Whilst this transition is strongly desirable, it poses new challenges for the automotive industry. Regarding Noise, Vibration and Harshness (NVH) of drivetrains, the Internal Combustion Engines (ICEs) contribute with broadband vibration and noise usually in frequencies up to 1 kHz that can mask the radiation of tonal noises from the gearbox. EVs do not have this masking effect.3–5 Even though EVs are usually quieter than ICEs, their NVH features divert from those of ICEs, due to high tonal content and frequencies that can be even higher than 10 kHz. 6 Moreover, it is common to have the electric (e-) motor directly connected to the transmission system, 7 where they both are encapsulated by the same housing.
The main internal sources for NVH in an e-powertrain are the electromagnetic (EM) forces generated in the motor and the transmission error in the gearbox. 8 Both lead to excitation in specific frequencies that depend on the geometry of the system and the speed of rotation.9–13 The contribution from thee-motor is known as whistling and it is usually more relevant at lower speeds of the powertrain, while the gear contribution, known as gear whining, is more prominent to the overall NVH at higher speeds. 14 Past studies have investigated motor whistling and gear whining. For instance, microgeometry changes were investigated in Zhang, 13 showing that reduction in the pressure angle and increase in the helix angle can reduce gearbox whine, by reducing the transmission error. In Fang and Zhang, 15 the importance of the tangential component of the electromagnetic (EM) forces are highlighted for accurate whining simulations. Experimental vibration data show gear meshing orders and EM orders at the motor side, whilst the response at the reducer side is mostly dominated by the gear meshing orders. An analytical approach for the contact stiffness and transmission error calculation, which leads to gear whine was developed in Mughal et al., 16 whereas in Kumar et al. 17 it has been shown that gear whine reduces the symmetry in the directivity of the radiated noise when compared to motor whistle alone. A probabilistic approach was used in Prakash et al. 18 to estimate interior whistle and whine from an e-powertrain. The importance of the EM orders that would lead to whistling is highlighted in Ha et al., 19 showing differences that can reach up to 50 dB in the acceleration of the relevant orders. Studies have also considered psychoacoustics quantities in the analysis of the radiated whistling and whining. Again, in Fang and Zhang, 15 it is shown how the Sharpness (high frequency content) of the radiated gear whine increases with increasing the speed of the motor. Radiated noise with highly tonal components spectrum is classified as more annoying than broadband noise, 20 which can be the result of whistling and whining. Prominence Ratio, a metric to assess how tonal a band in radiated noise is, has been shown to correlate with how annoying the radiated noise of an EV will be perceived. 21 Given that the motor operates at variable speed (and torque) according to the demands of the driver, the frequencies of these tonal excitations sweep a large spectrum range through various natural frequencies of the powertrain. A precise determination of the modal content is therefore imperative for robust NVH predictions.
During steady-state operation, the EM interactions between the e-motor’s rotor and stator exhibit torsional stiffness and damping behaviour.22,23 Studies on the effects of the EM stiffness have so far focused on the torsional dynamics of the drivetrain, using lumped parameters models. A practical method to consider EM effects in the powertrain was proposed in Holopainen et al. 24 using frequency response functions (FRF) that combine EM torque and rotor angle. The inclusion of the EM effects on the first torsional mode led to a 4% increase in the natural frequency. Low-frequency flutter vibration of an e-powertrain considering EM stiffness was also studied. 7 It shows how the consideration of the EM stiffness in the modal analysis, reveals the modes observed in the experimental data below 2 Hz that were not seen in the modal analysis without the inclusion of the EM stiffness. Active vibration reduction of an e-powertrain is studied in Chen et al. 25 considering the damping effect from the EM interaction in the airgap of the e-motor. The power and the q-axis current of the e-motor are controlled with two PI controllers, thus controlling the speed and torque of the e-motor. Instead of relying on the torque and speed (or angular displacement), a similar FRF method is used to estimate the EM stiffness but from the proportional and integral gains that define the torque and speed. A variable power control strategy can affect the EM damping and lead to reduction in the torsional vibration of the system. The motor frame is considered to be rigid. A similar approach considering the EM damping is used for controlling vibrations of a traction drive. 26
An alternative method for the calculation of the EM stiffness and damping of asynchronous motors is given in Szolc et al., 27 which also highlights an increase of the natural frequencies due to the EM stiffness consideration. The EM stiffness is also considered in an equivalent single-stage drivetrain with dual-mass model of a wind turbine generator, where the system is modelled as two lumped masses connected via a shaft. 28 One mass represents the rotor generator, whilst the other represents the blades. The torsional natural frequencies considering the EM stiffness are calculated, exhibiting good agreement against experimental data. The effects of the EM stiffness on the mode shapes and natural frequencies at low frequency spectra of powertrains have been studied,29,30 considering lumped parameter models and rotational degrees of freedom only. A small perturbation in the mode shape is also observed for the torsional natural frequency, when compared to the case without EM stiffness effects. Translational degrees-of-freedom of gears and bearings are included in Liu et al. 23 with new modes emerging from the controller and the EM stiffness. Some natural frequencies at the existing rotational and translational modes are also affected. Flexibility of shafts are included in Tan et al., 31 using a Timoshenko beam approach. The mass-normalised modal vectors are once again affected by the EM stiffness. However, in all cases, the flexibility of the powertrain housing has not been considered. The housing is excited by the powertrain via the supporting bearings,32,33 and its structural vibration leads to structure borne radiated noise.
This study contributes to the body of knowledge by expanding the analysis of how the EM stiffness may affect the modal content and consequently the system dynamics when a flexible powertrain housing is considered. The work previously presented in the literature has focused only on the rotational modal content of powertrains, considering lumped parameter models. The novel results presented here show that the EM stiffness not only affects the driveline modal content, but also the housing that encapsulates it. Changes in natural frequencies are observed accompanied by changes in the mode shapes at higher frequencies. The methodology presented helps the designer to predict where aggressive NVH will occur due to changes in the vibration modes in the presence of electromechanical coupling via the EM stiffness. Even though this paper does not provide a psychoacoustic analysis, it brings results that have implications for the prediction of whistling and whining NVH and where resonances may occur. These high frequency and possibly tonal behaviours are known to affect psychoacoustic measures. The observed vibration modes, when the EM stiffness is considered, offer a clearer insight in the e-powertrain physics for both the predicted and experimental NVH data.
E-powertrain multibody dynamics model methodology
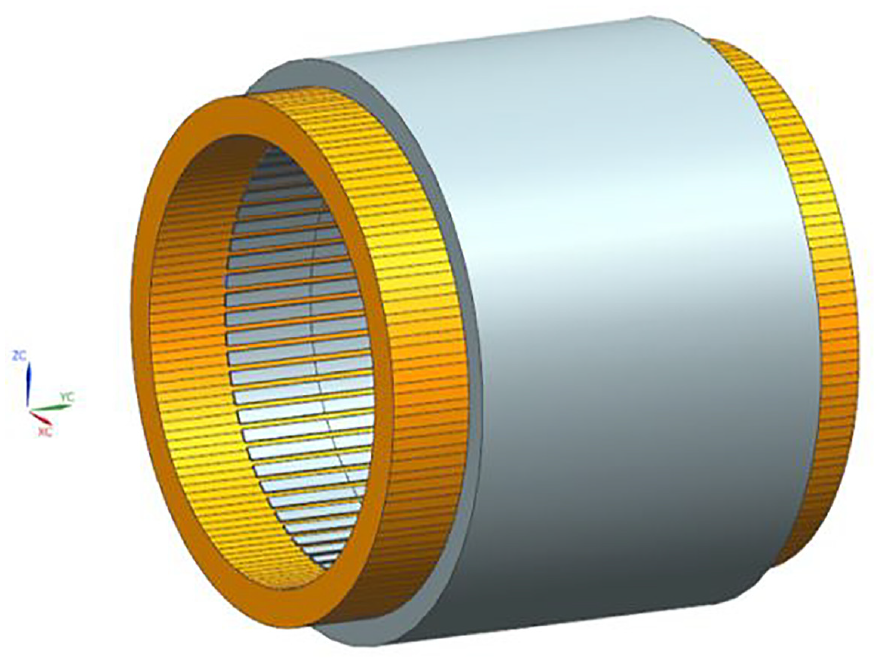
The e-powertrain studied consists of a Permanent Magnet Synchronous Motor (PMSM) connected to a two-stage, two-speed transmission. 34 The latter utilises helical gears and is supported by a total of eight bearings, comprising six tapered roller bearings and two deep groove ball bearings. The e-motor topology consists of a 72-slot stator surrounding a 12-pole rotor with interior magnets. The housing encloses the inverter, the rotor and the transmission, with the stator press fitted to it. A visual representation of the system, highlighting the motor and bearing positions, is shown in Figure 1.
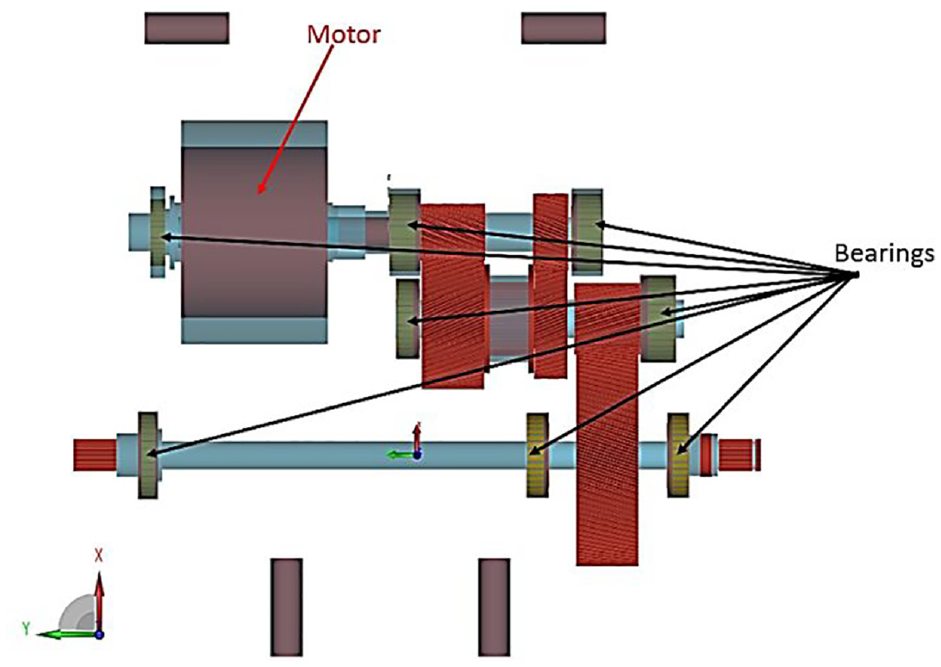
Schematic of the e-powertrain modelled.
Flexible housing model
A Finite Element (FE) model of the flexible housing was built in ABAQUS so that it is included in the Multibody Dynamics (MBD) simulations. The process comprises two steps. Firstly, a modal analysis was conducted up to 15 kHz, followed by a condensation step so that the flexible housing is represented in the MBD model by a few hundred selected nodes (instead of the full FE model). The selected nodes are those where excitation will be applied (such as the stator tooth tip), nodes where the output (acceleration) are of interest and nodes where the bearings connect to the housing. The condensation is a static reduction process combined with dynamic correction that considers the modal content of the housing for adequate representation.35,36
The FE model includes a homogeneous alloy with Young’s modulus of 65 GPa, density of 2740 kg/m3 and Poisson’s ratio of 0.33 for the housing. A mixture rule37,38 is used to represent the orthotropic mechanical properties of the stator and the windings that can be seen in Figure 2. It is possible to calculate the properties for the stator using equations (1)–(7)37,38:


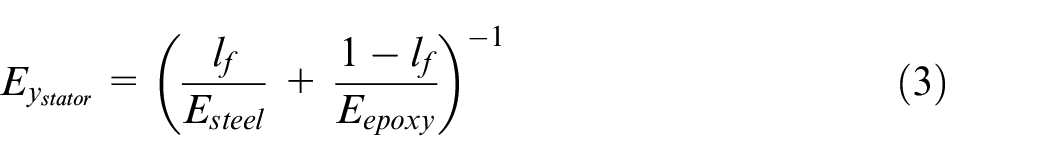

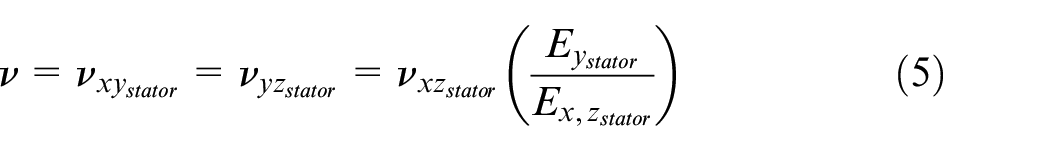
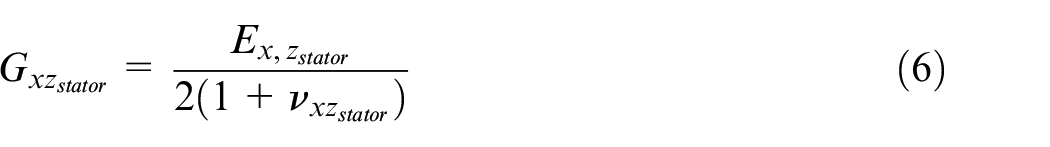
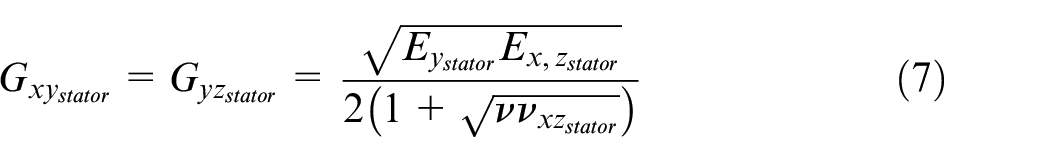
where
Stator and windings.
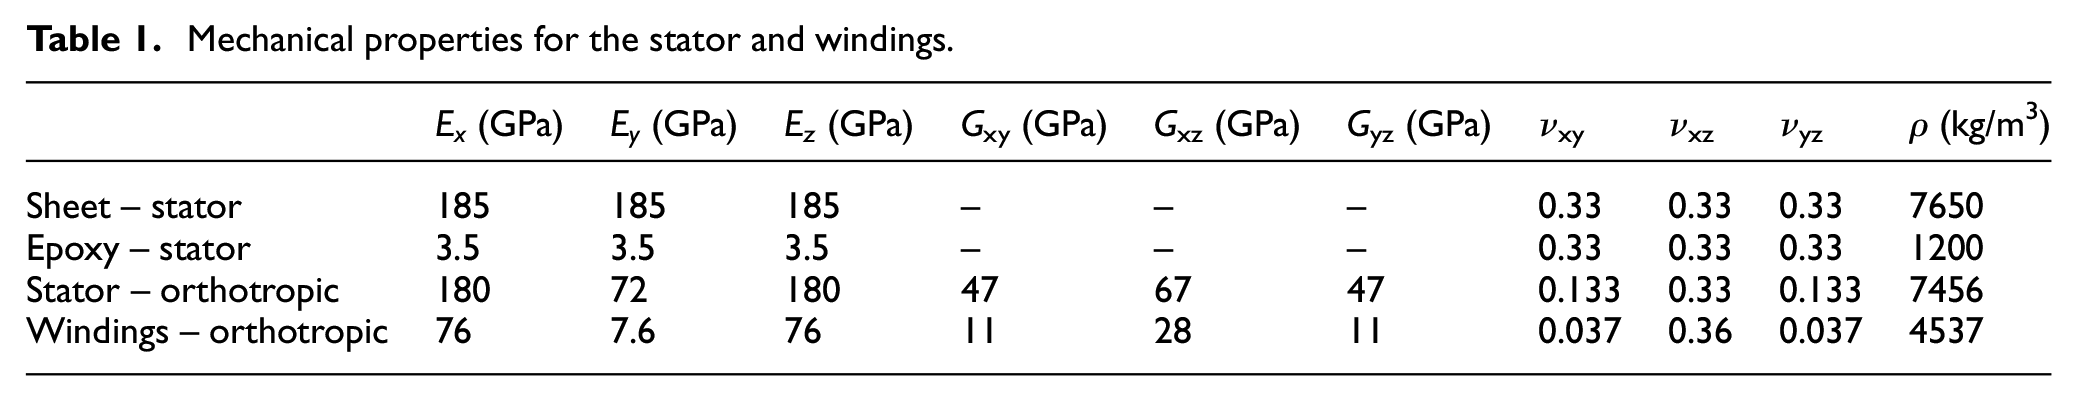
The set of above equations are used to approximate the properties of the copper windings but considering a different resin and stack factor. The properties are summarised in Table 1. The first mode of the housing (bending of the inverter cover) occurs at 537 Hz and is shown in Figure 3. Once the condensation step is completed, the housing can be added in the MBD model.
Mechanical properties for the stator and windings.
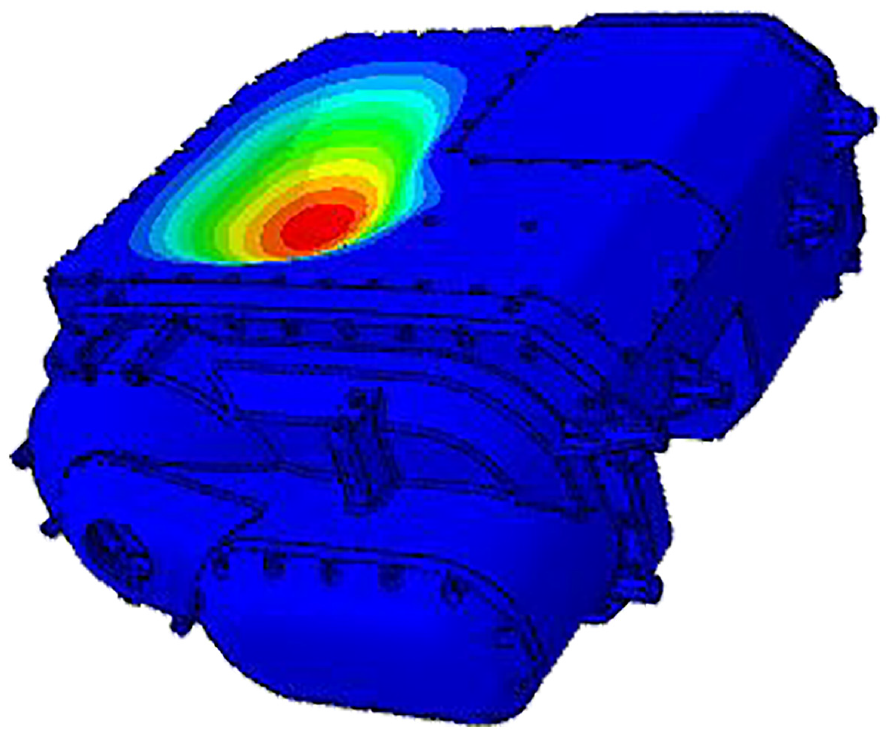
First mode of the housing – 537 Hz.
Multibody dynamics model
The MBD model is developed in AVL EXCITE™, where both the e-motor electromagnetics and e-powertrain multibody dynamics are simulated. The MBD model can also predict the velocity of vibration of the flexible housing by reverting the condensation process. Once the vibration of the housing under operation is calculated, it is used in AVL EXCITE™ Acoustics to calculate sound pressure using a Wave Based Technique 39 for exterior Helmholtz problems.
An internal modeller creates the flexible shafts of the e-powertrain. Rayleigh damping is applied on all flexible bodies. The Rayleigh damping ratio used is 0.01 at 100 and 1000 Hz for the shafts. The damping ratio plot versus frequency for the housing is shown in Figure 4. The above damping content is the output of tuning against dynamics experimental measurements taken from the actual e-powertrain.
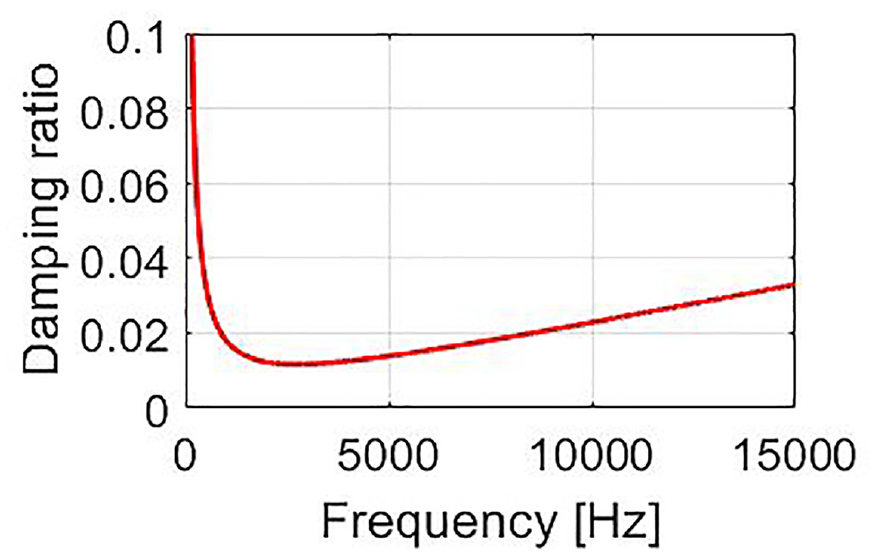
Rayleigh damping ratio for the housing.
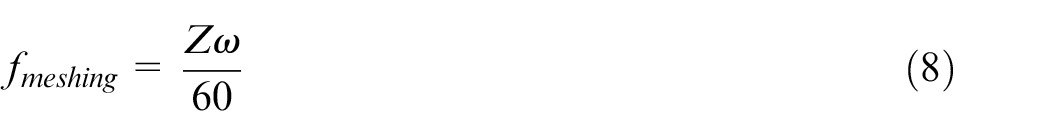
The model for the meshing of the helical gears follows the approach that is described in detail in Walker et al. 40 It slices each helical gear along the lead direction, treating them as spur gear slices. The compliance of each slice is independent of the neighbouring slices. Tooth bending and tooth tilt, which have a linear relationship between load and deformation are considered in this approach. For the nonlinear behaviour of the local contact stiffness a Hertz-Petersen method is used that implicitly solves the equations of motion through time integration at each time step using an iterative approach.35,40 Whereas for the time-varying meshing stiffness, the summation of the individual slices is used. 40 The time-varying meshing stiffness is well known of being an internal excitation of the gearbox41,42 that may lead to aggressive Dynamic Transmission Error (DTE), which is the main contributor to gear whine.43,44 For the case of helical gears, the gear meshing frequency can be calculated by 45 :
Hertzian contact is considered for the two ball bearings in the system, while a Kunert empirical35,46 approach is used for the six cylindrical roller bearings. The masses of the individual components of the bearings are neglected. It is assumed that the raceways of the bearings are not distorted by deformations in the housing or shafts. The force/penetration relation for the bearings is given by 35 :
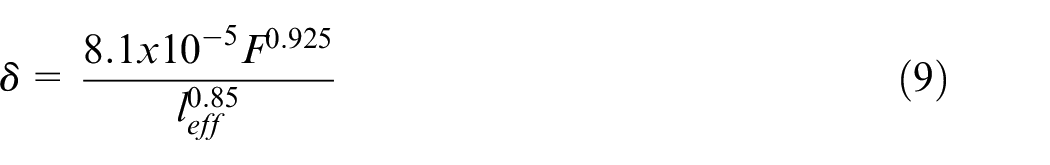
where
For the calculation of the bearing forces, one can use equation (10) for the elastic forces and equation (11) for the damping forces. The total force is given by the summation of the elastic and damping forces for all the rolling elements:
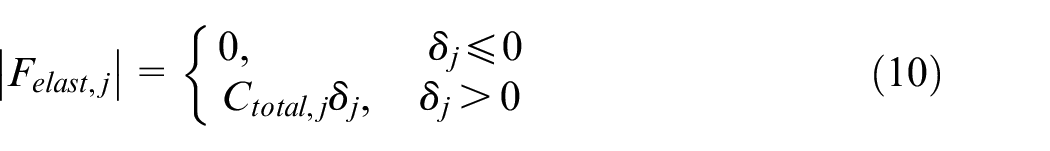
where

where
E-motor model features
The EM forces acting on the stator teeth, generating the rotor torque are calculated via Maxwell stress tensors using equations (12) and (13).35,47 The stator is divided in four equal sections along the axial direction. For each section, at each central point of each stator tooth, the radial and tangential components of the EM forces are applied:
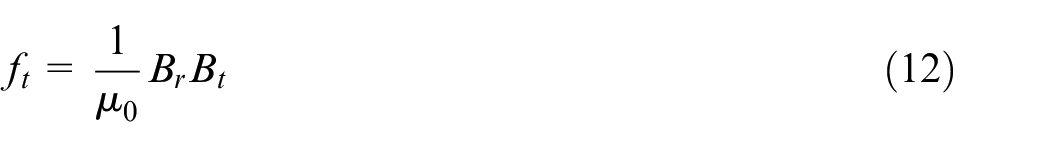
where
A virtual electric machine controller that consists of a power supply, inverter and controller 35 is used. The controller acts on the direct and quadrature currents of the motor aiming to keep the requested torque using proportional and integral gains.
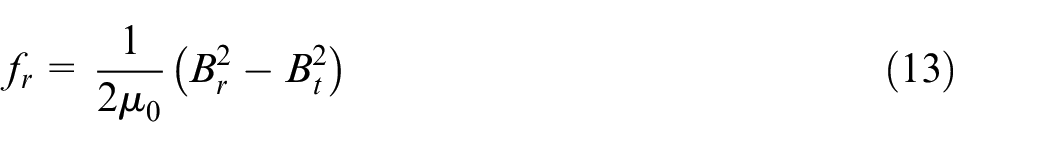
To summarise the methodology for the simulation of the powertrain during operation, a flow chart is shown in Figure 5. For each operating condition the required currents are used in the simulation along with the e-motor design parameters. The electromagnetic forces are then calculated while the torque is provided to the transmission, coupling the system.
Simulation of the powertrain operation.
Multibody dynamics model validation
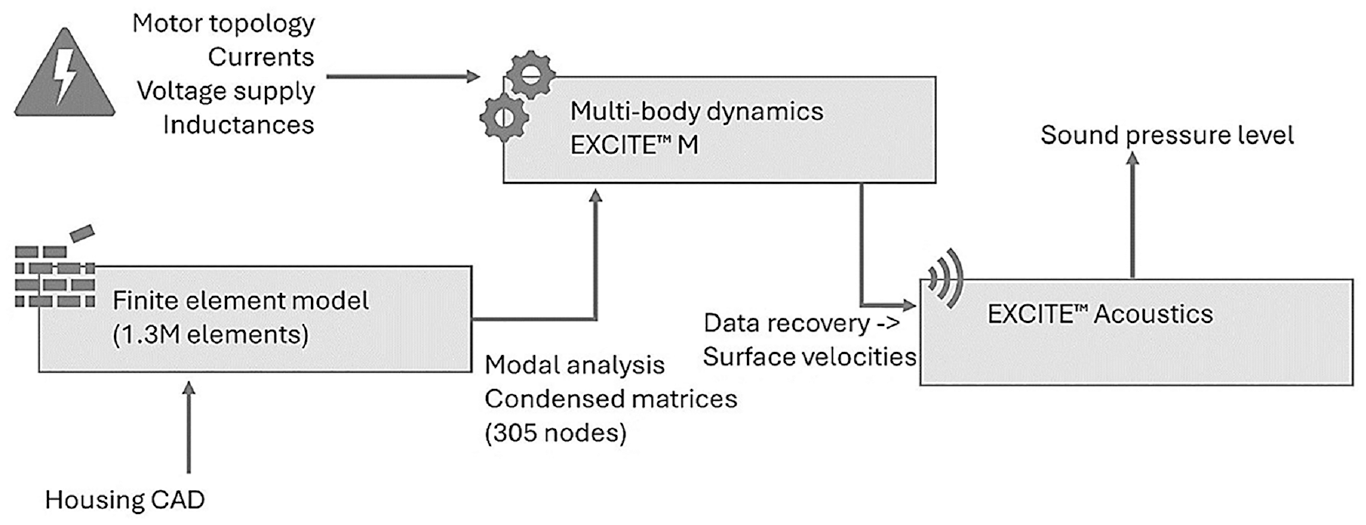
The developed model is validated against experimental data from an actual e-powertrain setup. The experiment was carried out in hemi-anechoic chamber environment and its setup is shown in Figure 6. The red arrow indicates the accelerometer position on the inverter cover.
Experimental setup of the EV powertrain.
The comparison between experimental data and model predictions are presented for the acceleration at the inverter cover and average Sound Pressure Levels (SPL) around the e-powertrain in Figure 7, corresponding to operating condition of 5000 rpm and 150 Nm torque. Satisfactory agreement is observed overall for the frequency range of interest, apart from the lower orders for the SPL. This could be due to lower frequency excitation originating from order 6, which is of EM origin and/or the lack of any other background noise for example, inverter in the model. Therefore, in the region of interest, the model is considered to be validated for the forced response of the e-powertrain. It is worth noting that at this speed range, an order step of 6 represents a frequency step of 500 Hz.
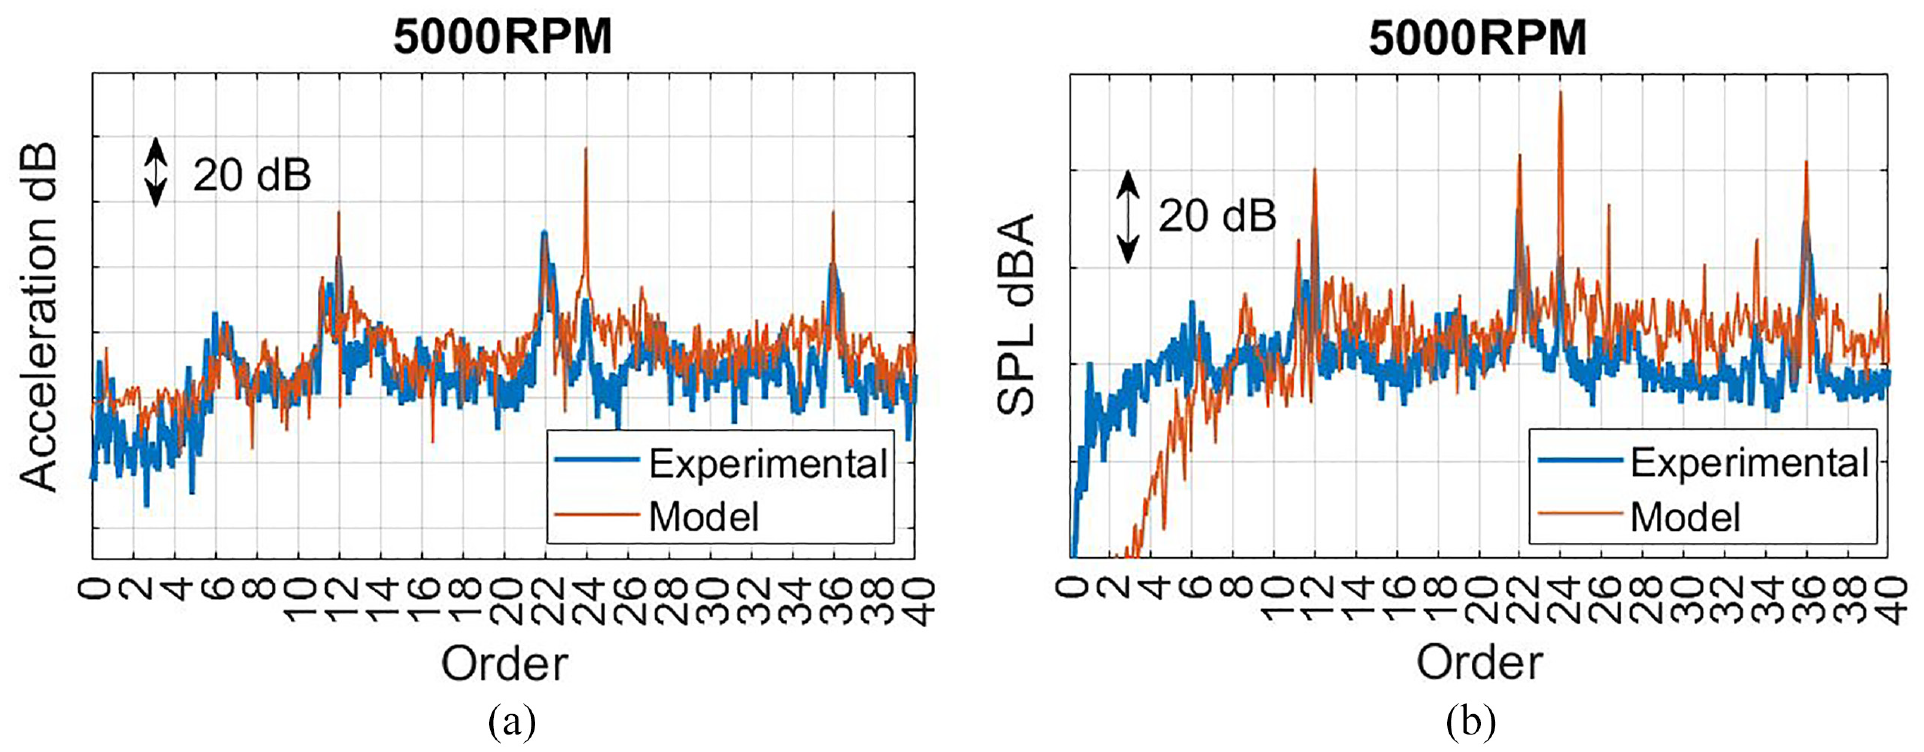
Comparison of experimental data versus model prediction (ordinate values omitted due to confidentiality).
Electromagnetic stiffness methodology
The methodology used to predict the equivalent EM torsional stiffness follows the steps described in Holopainen et al. 24 Two different simulations must be conducted. One, where the system is at steady state, simulating its usual operation. From this, both the torque provided by the motor and the rotor angular position versus time are obtained. In the second simulation, the system is perturbed with an impulse in the rotor velocity. Once again, both the torque and rotor angular position time histories are obtained (now with the perturbed velocity). The differences between the perturbed and steady state torque and angular position values are calculated. The Fourier transform of the torque and angular position differences are then obtained and the EM stiffness is given by the Frequency Response Function (FRF) between the Fourier Transforms of the difference in EM torque and the difference in rotor position. The steps are listed below:
i.Simulate constant speed, steady-state operation.
ii. Simulate perturbed operation by applying an impulse in the speed of the rotor. Figure 8 illustrates the above for 2000 rpm operating condition.
iii.Calculate the difference in the EM torque between the perturbed and unperturbed scenarios, along with the difference in the angular position of the rotor.
iv.Conduct Fourier transforms on each of the differences calculated in step iii.
v.Calculate the FRF using the two Fourier transforms of step iv.
The two simulated scenarios are shown in Figure 9. It is possible to note a significant oscillation in the EM torque acting on the rotor when the impulse perturbs its speed. The torque control strategy used in the model reacts and adjusts the gains to bring the torque back to the desired value. A small step function occurs in the difference between the angular positions due to the jump in the speed.
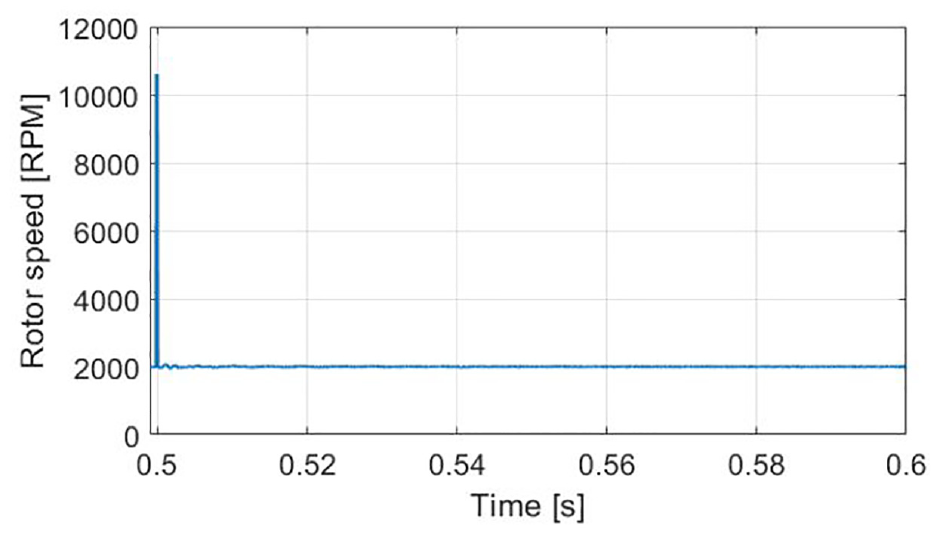
Impulse applied on the constant e-powertrain speed of 2000 rpm (model).
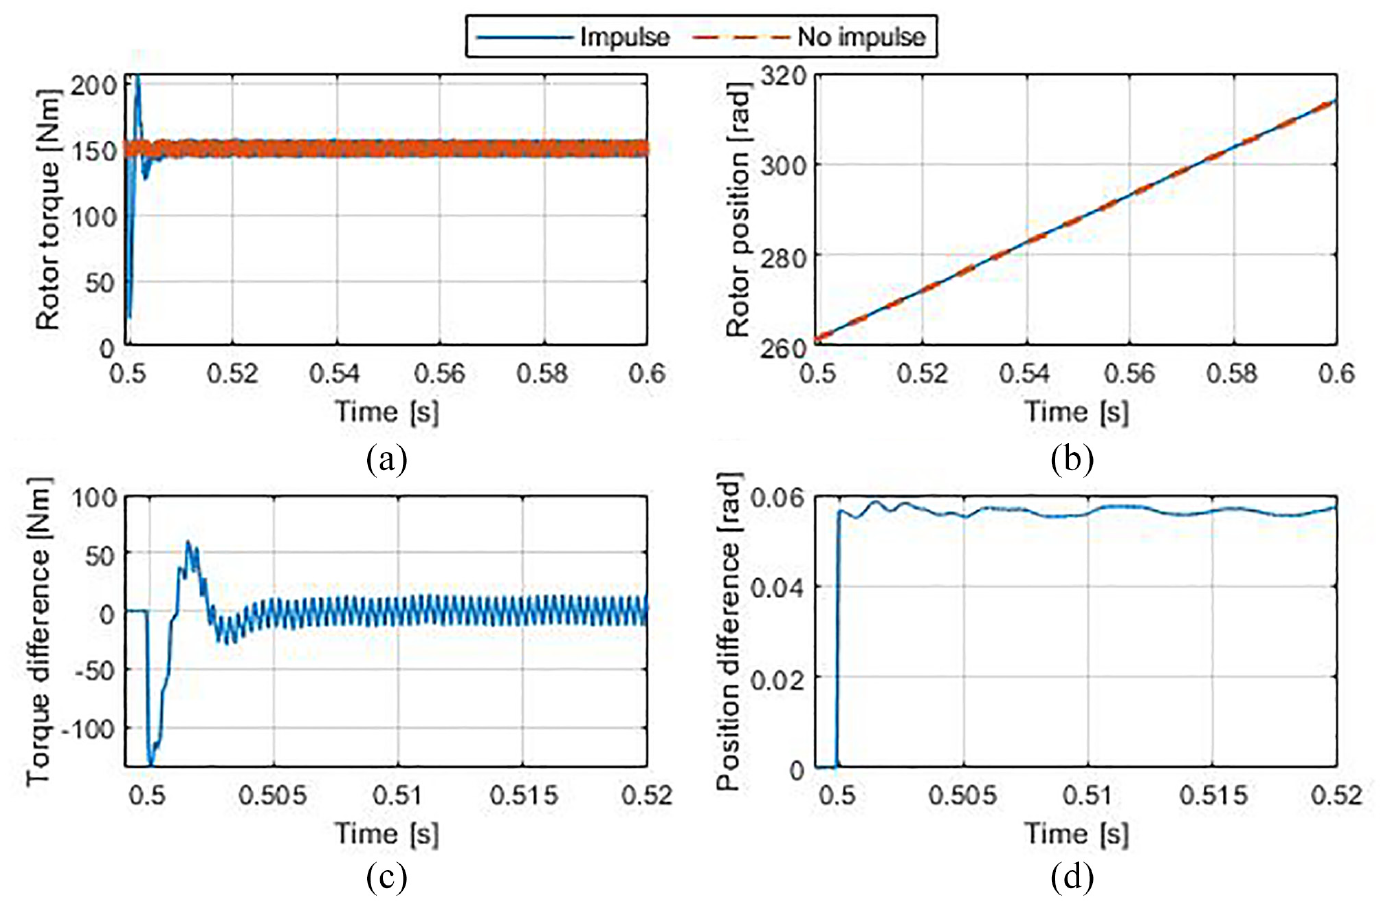
Torque (a) and angular position (b) for the perturbed and unperturbed cases of powertrain operation along with their differences (c) and (d).
The EM stiffness is given by the real part of the FRF 24 :
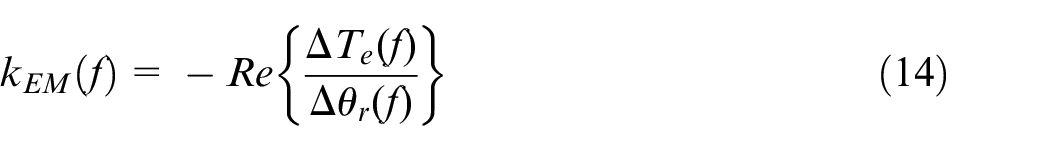
where
This methodology was applied to different rotor speeds and torque levels. The results are presented in Figure 10. The prominent drops in the spectra of the stiffness are due to the time window considered for the pulse and they do not constitute features of the stiffness. Also, peaks can be related to the oscillating signals in
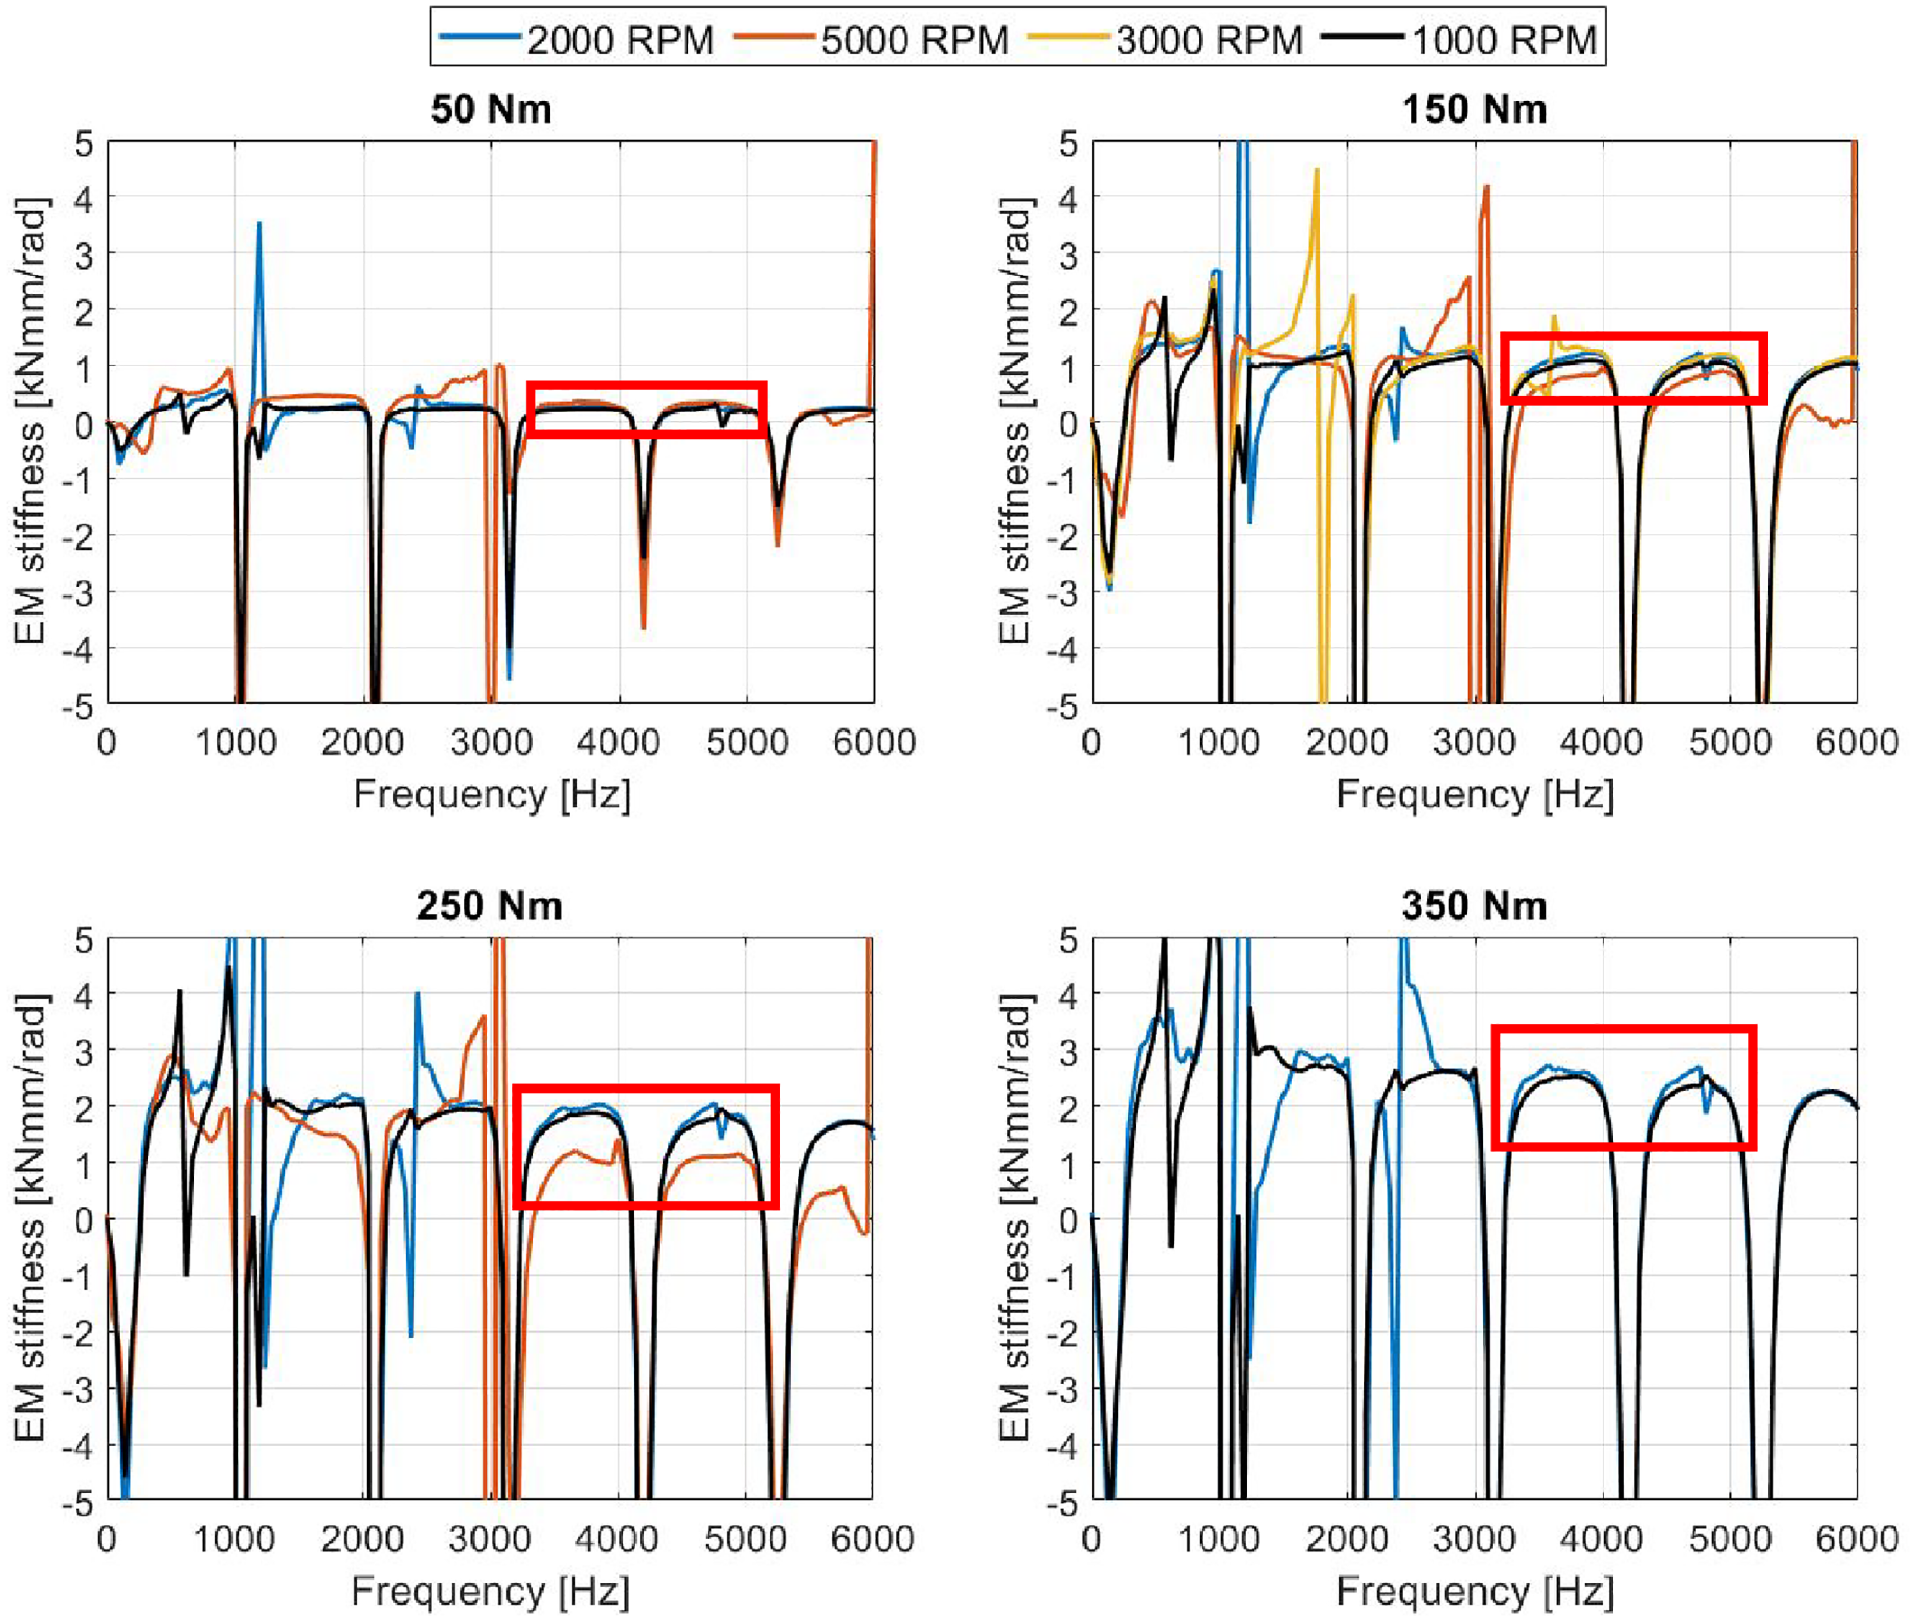
EM stiffness results for different powertrain operating conditions. The red rectangles highlight the regions of approximately constant values neglecting the valleys due to the time window processing.
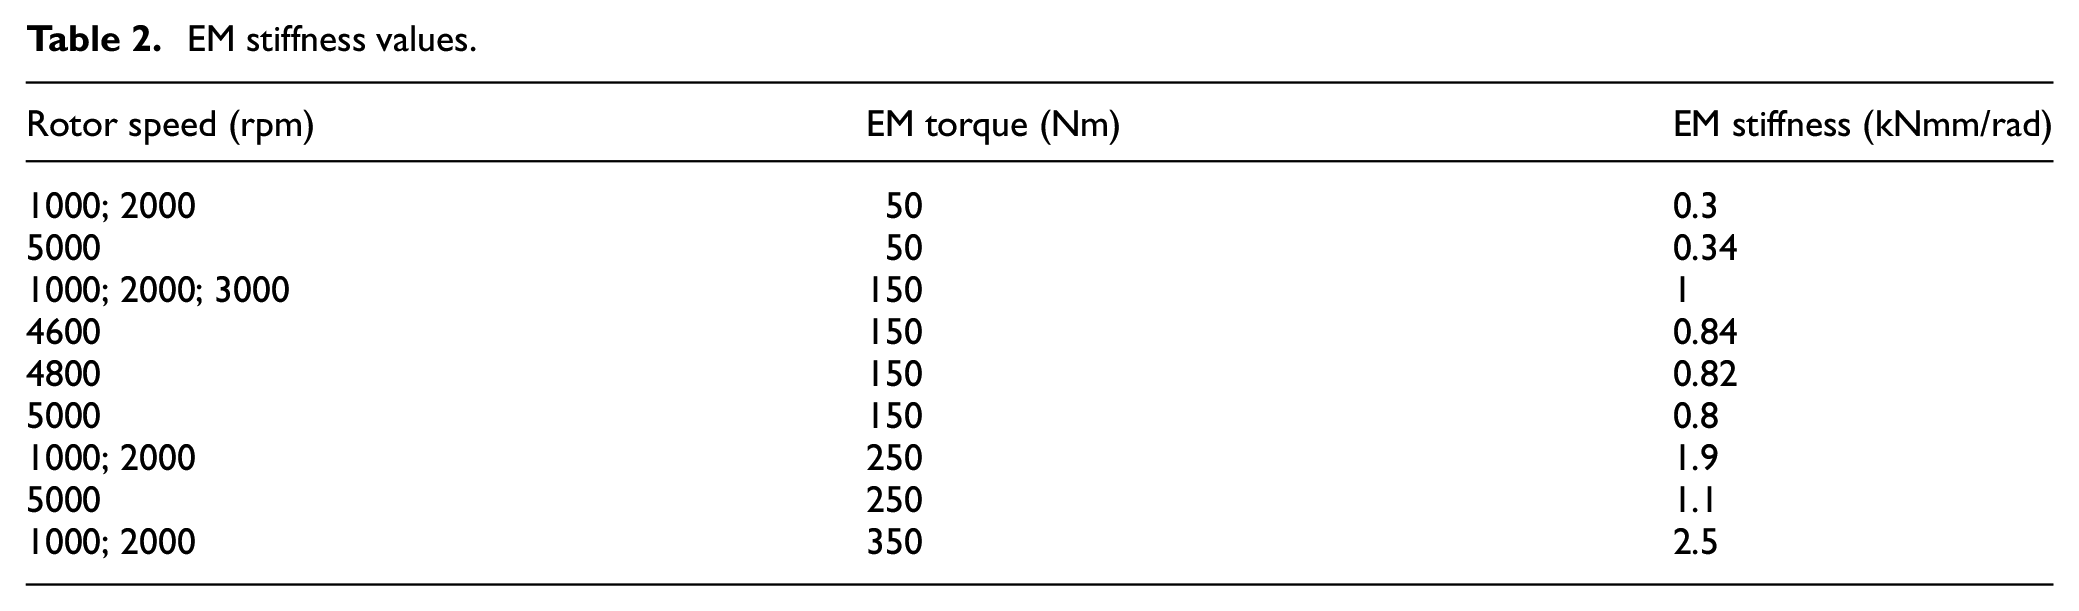
EM stiffness values.
Assuming constant magnetic flux, one can use a known EM stiffness from a given operating condition and estimate the EM stiffness at a different speed. The approximation can be calculated using equation (15) (corresponding to equation (4) in Holopainen et al. 24 ):
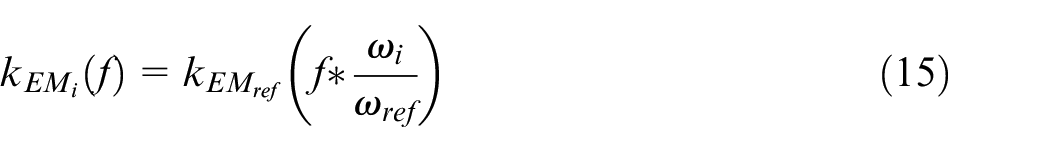
where
The approximation works by stretching or compressing the FRF result in the frequency axis by a factor of
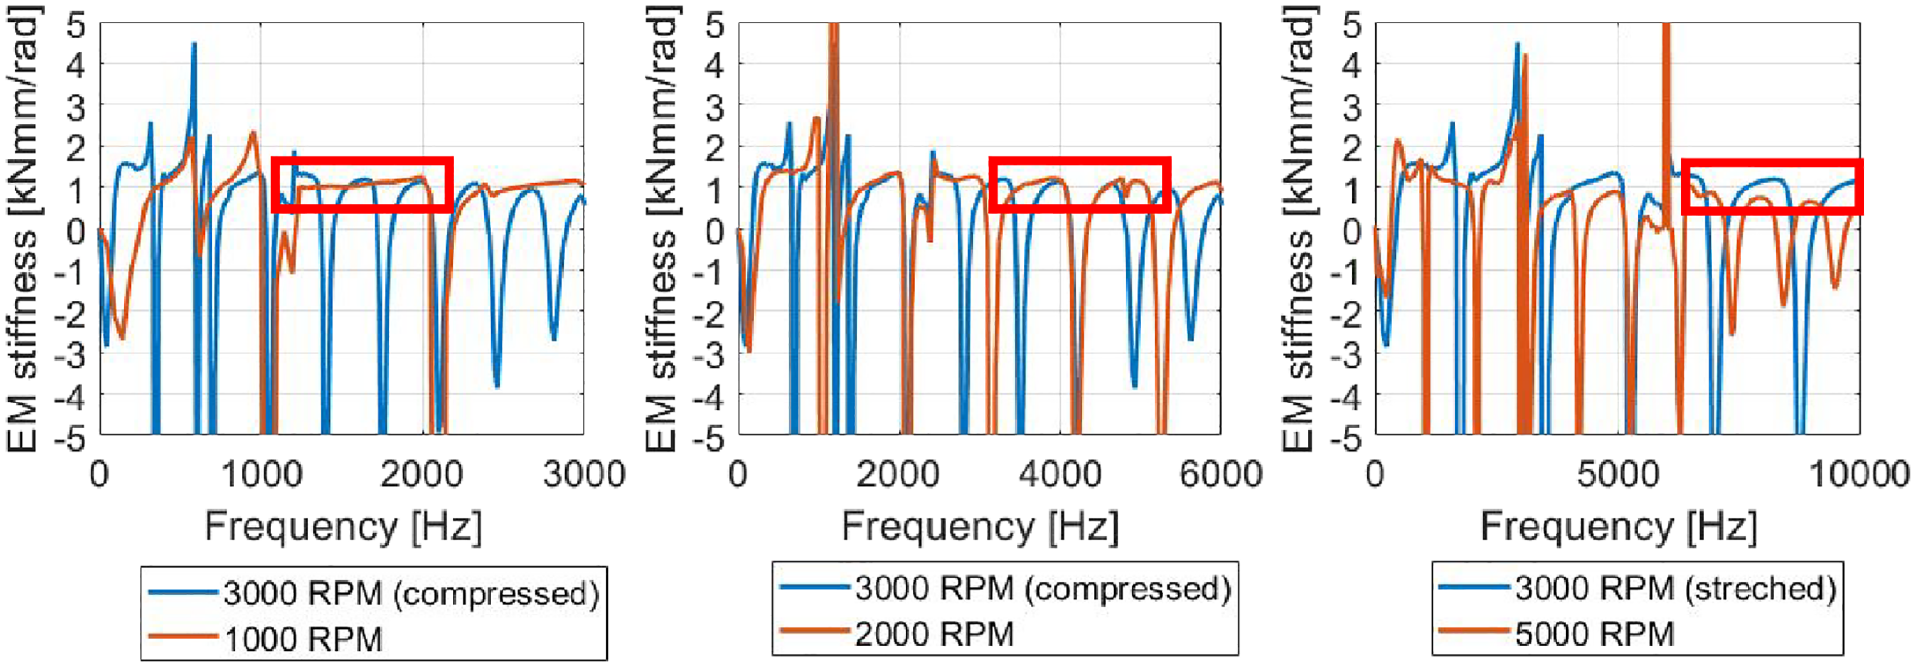
Approximation for the EM stiffness at 150 Nm torque demand based on a reference operating condition (3000 rpm 150 Nm). Again, the red rectangles highlight the regions of approximately constant EM stiffness not affected by the time window processing and in agreement with the estimation.
Figure 12 shows the torque-speed curve of the motor, along with the quadrature current versus speed.
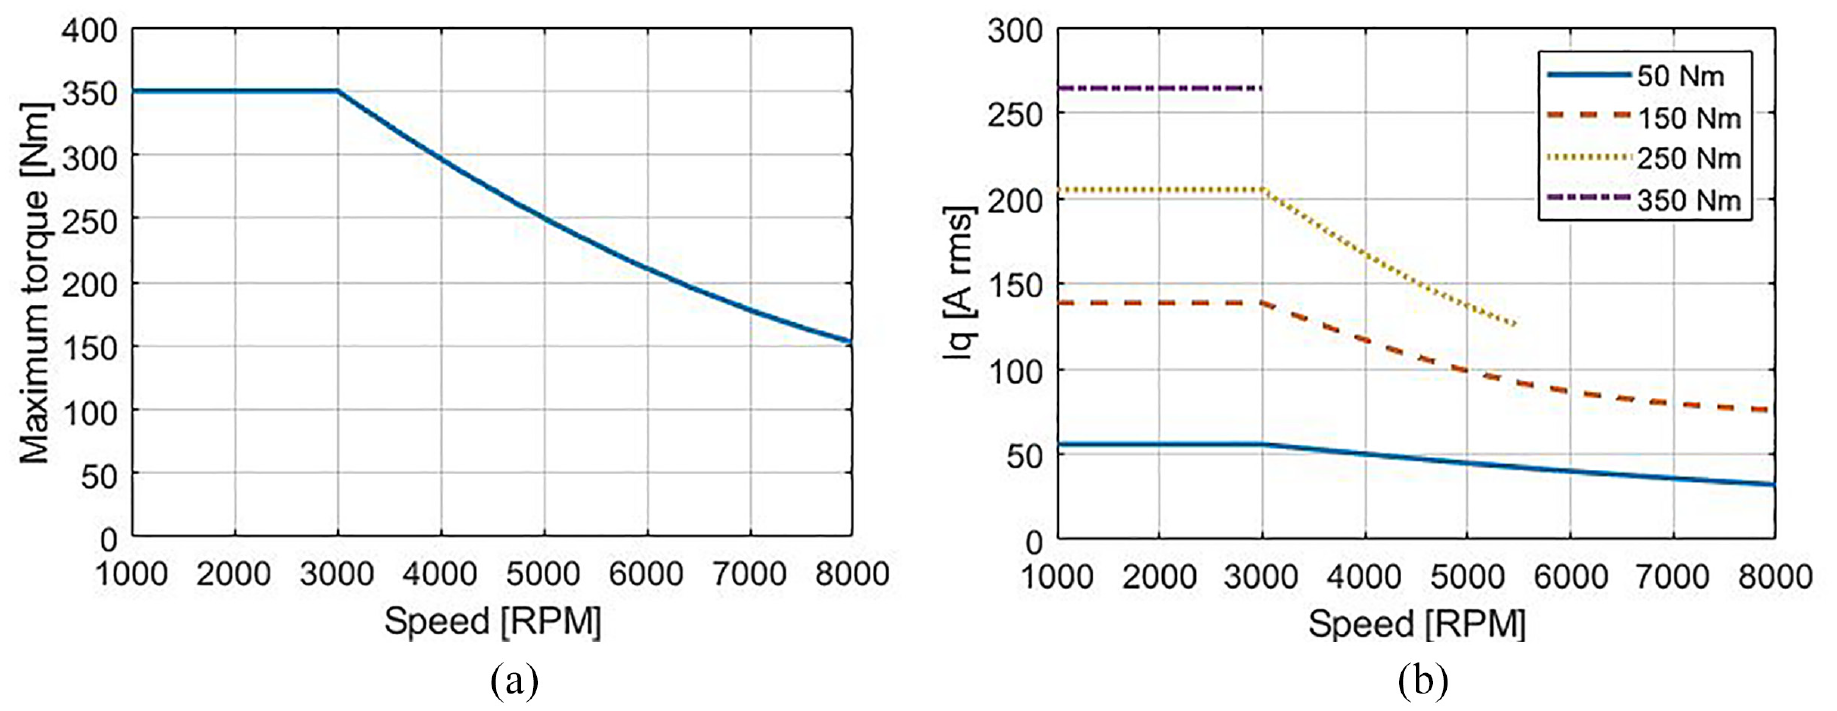
Torque-speed and torque-quadrature current curves.
Results and discussion
E-powertrain modal analysis approach including the EM stiffness
Having calculated the EM stiffness values for a variety of operating conditions, it is possible to include them in the modal analysis of the e-powertrain by introducing a virtual torsional spring connecting the rotor to the stator/housing. This is achieved by setting up a torsional spring between a node at the rotor shaft and one at the housing, as shown schematically in Figure 13.
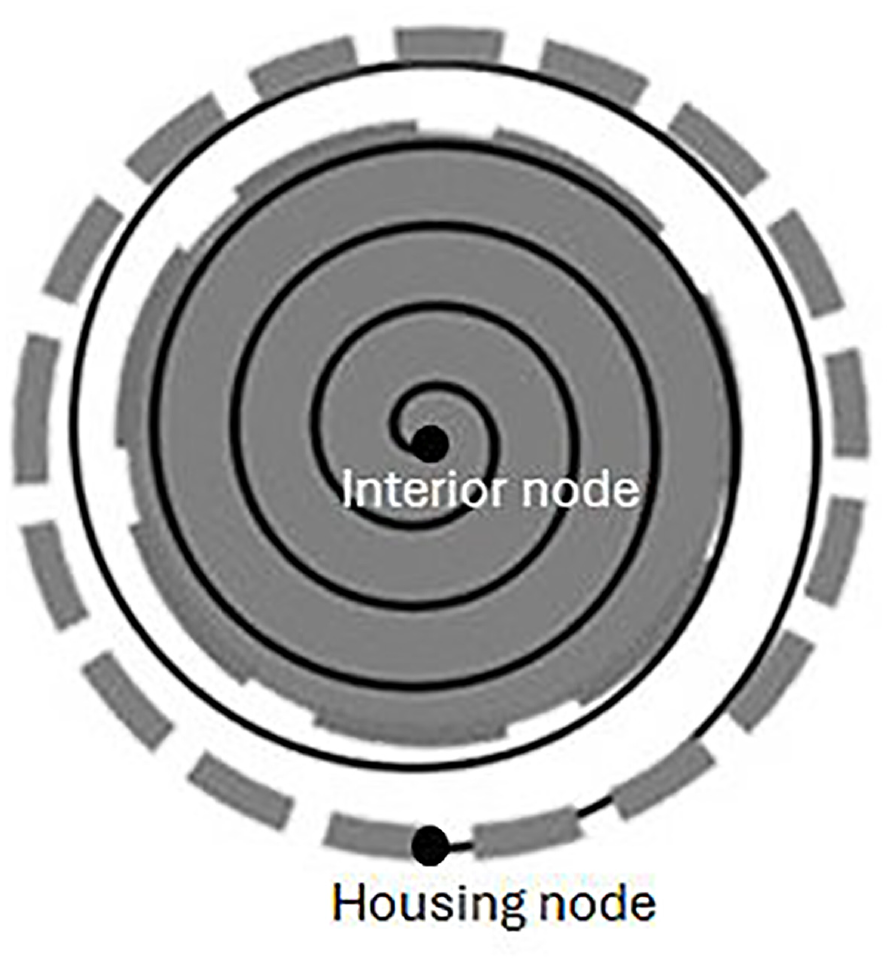
Virtual torsional spring representing the EM stiffness in the modal analysis calculation. Stator slots are represented by the exterior dashed circle and rotor magnets by the interior dashed circle.
In order to obtain the stiffness matrix of the system, the software combines two processes: the first one directly uses the stiffness matrix of the flexible bodies modelled, such as shafts and housing; the second one computes the stiffness of the interacting components that might depend on the operating condition of the system, such as gears and bearings used to connect the shafts with the housing. This is done by using the direct stiffness of the elements (or force-displacement relationships) when they are known, such as the EM stiffness. When this relationship is not known a priori, stiffness linearisation is conducted based on a forward finite-difference approach by a small perturbation of the six degrees-of-freedom of a given node that represents a connection in the model. The stiffness is then calculated by the difference between the perturbed and unperturbed node. This is the approach followed to include the stiffnesses of the bearings and the meshing gears in the system.35,48
Once the mass and stiffness matrices are obtained, two sets of modal analysis are carried out. One where the EM stiffness is not considered and another where it is considered, with its different values for each operation point, as presented in Table 2. The effects of the EM stiffness are assessed by comparing the two modal analysis results (with and without considering the additional EM virtual torsional spring). It is important to note that in all the comparisons below, the modal analysis also considers other drivetrain time-varying effects (such as changes in the meshing stiffness due to change in rotation or load). Therefore, the only difference between the modal analysis results is the inclusion of the EM stiffness or not. The process is presented in Figure 14.
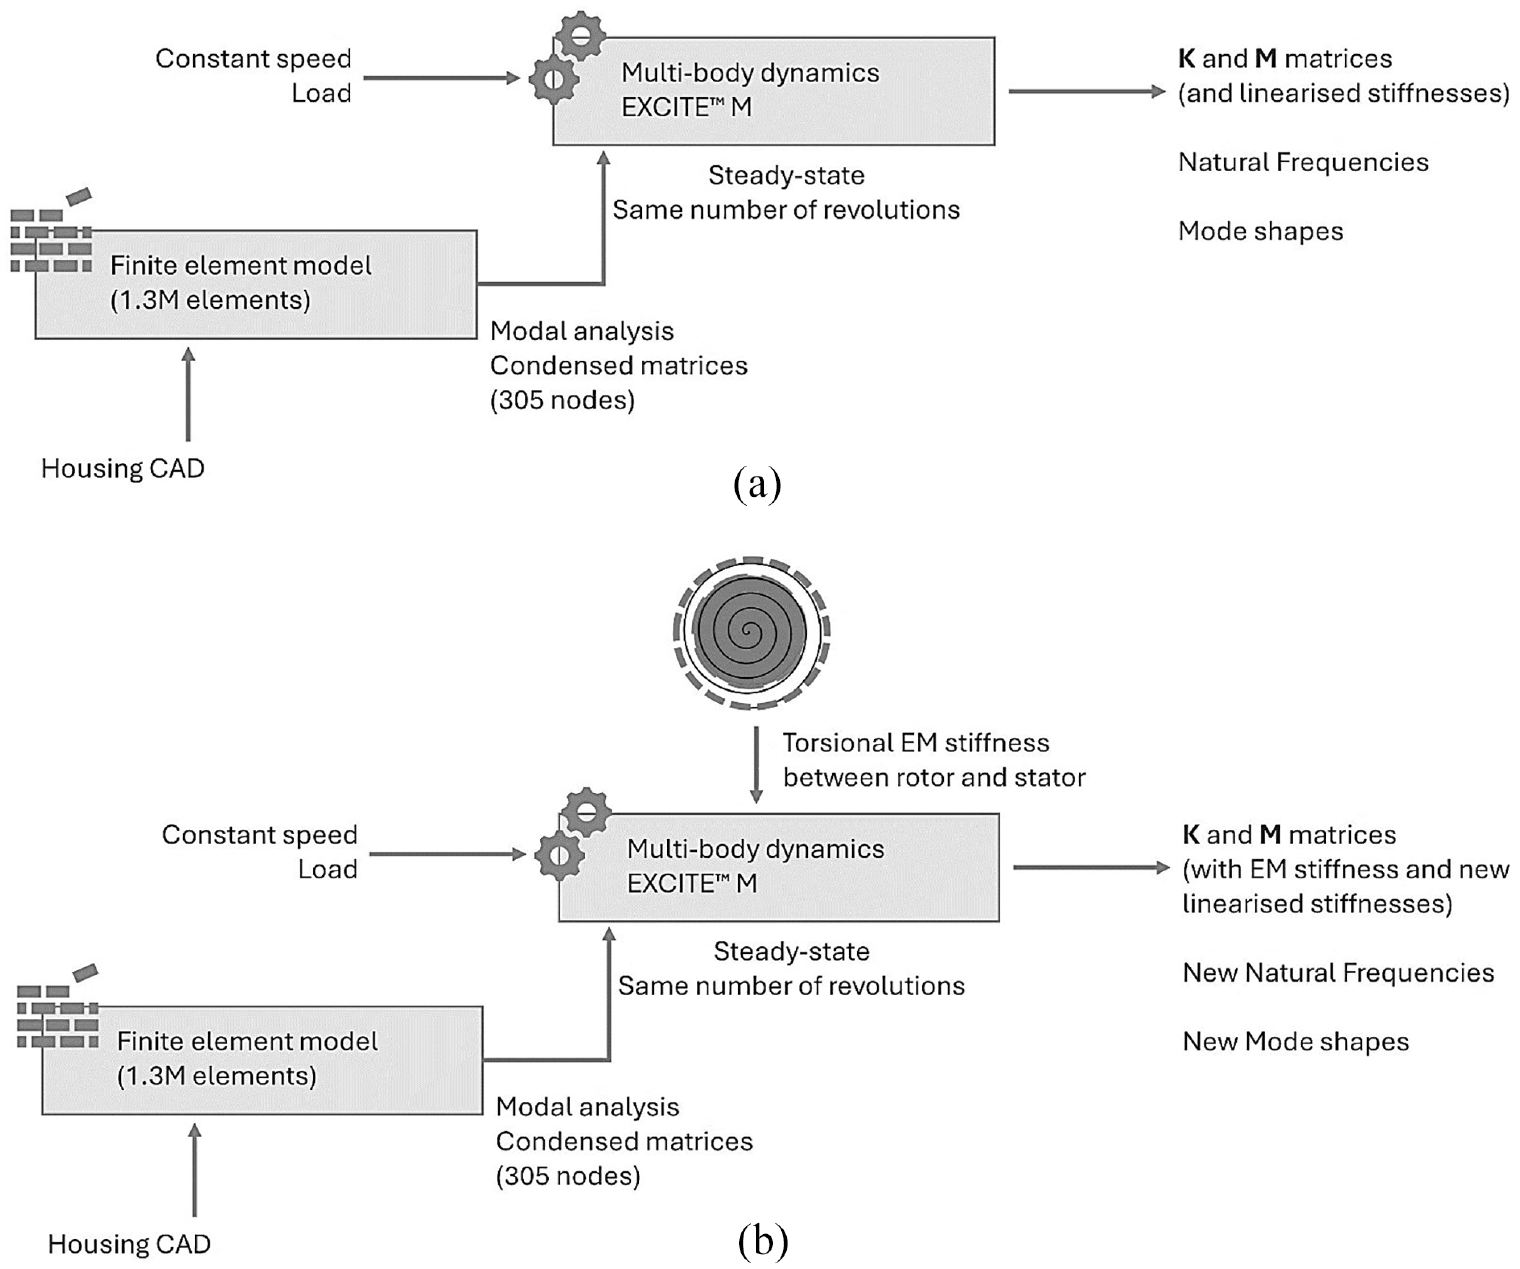
Modal analysis flow chart: (a) without the EM stiffness and (b) including the EM stiffness, thus affecting the complete stiffness (
Effect of the EM stiffness on the bearing linearised stiffness
The modelled e-powertrain is shown in Figure 15, with the indication of the bearing locations and their labelling. Considering the 5000 rpm at 150 Nm operating point, a comparison between the linearised stiffnesses of the bearings that connect the powertrain to the housing is conducted. The results are shown in Figure 16. It can be noticed that the EM stiffness affects the bearing linearised stiffness in all six degrees-of-freedoms and not only in the torsional direction of the powertrain.
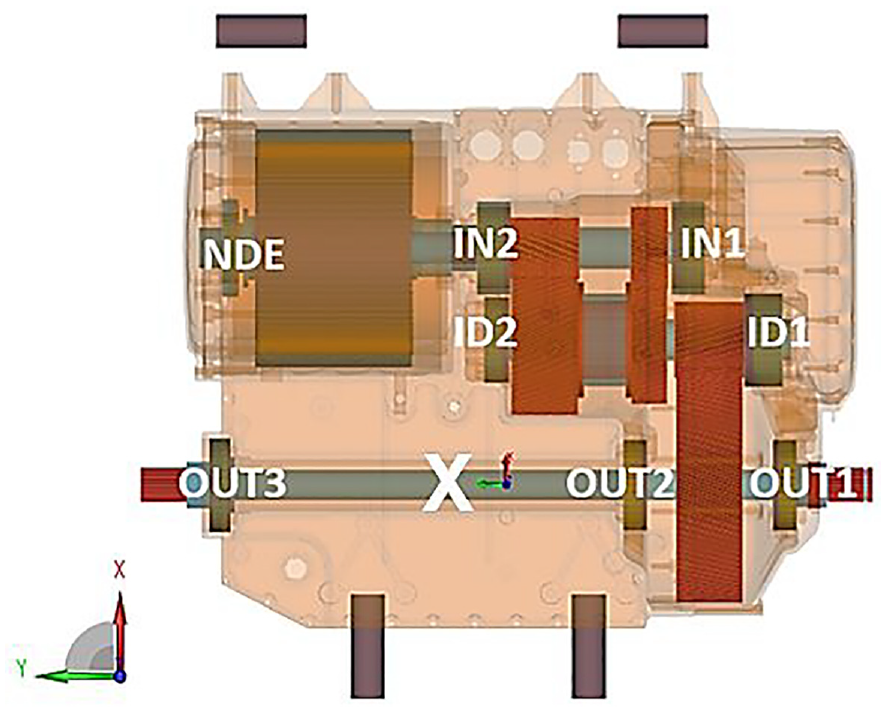
Location of the bearings and their identification along with X marking where the acceleration data was measured and calculated.
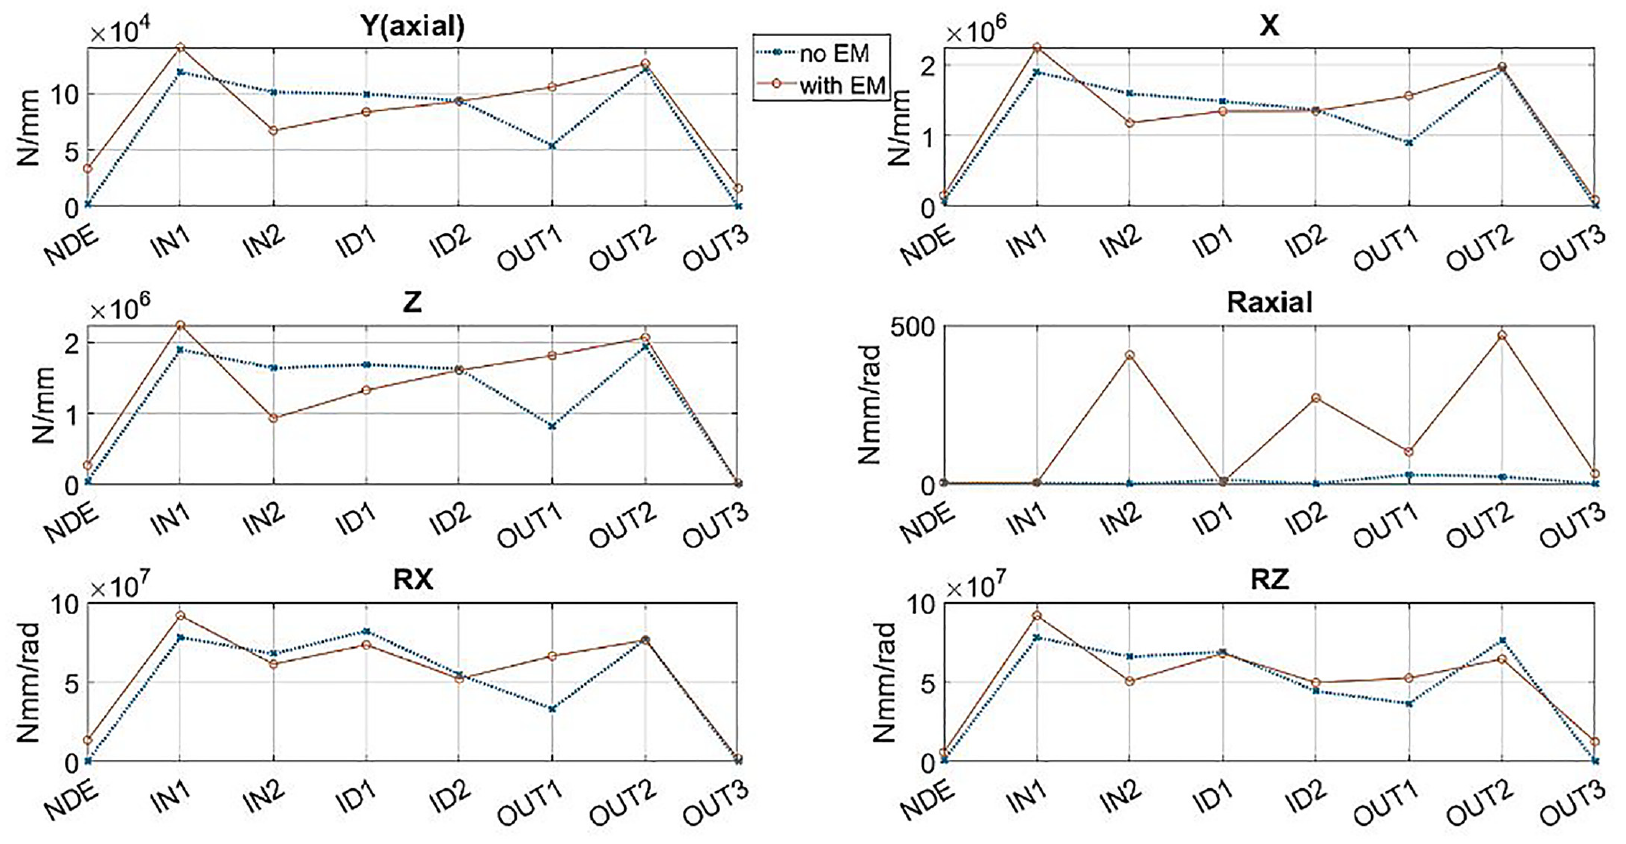
Effect of the EM on the linearised stiffness of the bearings (5000 rpm, 150 Nm).
Moreover, Figure 17 shows the linearised stiffness of the bearings at the same speed but for different torque demands, without considering the EM stiffness. Qualitatively, the inclusion of the EM stiffness has a similar effect on the system running at a different operating point. However, the EM stiffness has a higher effect on the torsional stiffness of the bearings in the axial direction.
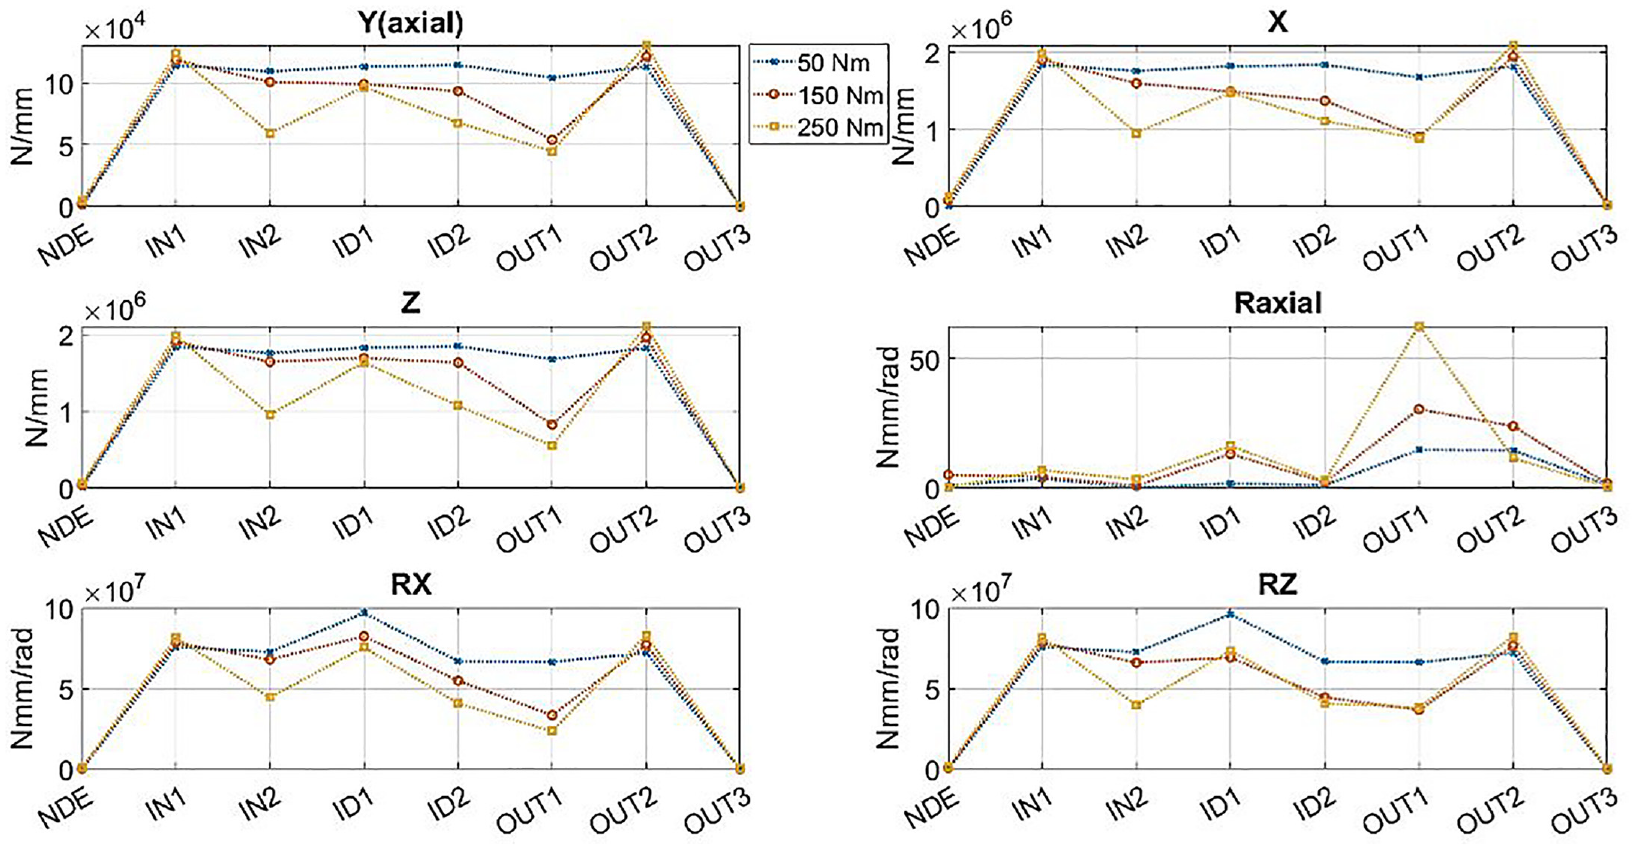
Linearised stiffness of the bearings at 5000 rpm and different torque demands without considering the EM stiffness.
E-powertrain natural frequencies and mode shapes
From the condensation process, it is seen that the first natural frequency of the housing that is not a rigid-body mode is at 537 Hz. At 5000 rpm the region around this frequency does not present any significant NVH effects. The amplitudes of both vibration and radiated noise are low when compared at higher orders such as 11.2 and 22 (gear meshing) and 36 (e-motor). The modal analysis that includes the EM stiffness however sheds some light on how to explain effects that can be observed in the experimental data. At 5000 rpm, in the 500–600 Hz range, the system is excited by the sixth order, with origin in the EM forces of the motor. Figure 18 presents the experimental out-of-plane acceleration at a point of the inverter cover (the black dot highlighted by the yellow circle in Figure 19 shows its location). The 500 Hz excitation component can be seen in the acceleration data. However, it also shows peaks with similar amplitudes at around the bending mode of the inverter cover at 537 Hz and an additional peak at around 560 Hz. The system also responding at the predicted natural frequencies confirms the validation of the mechanical properties used in the FE model.
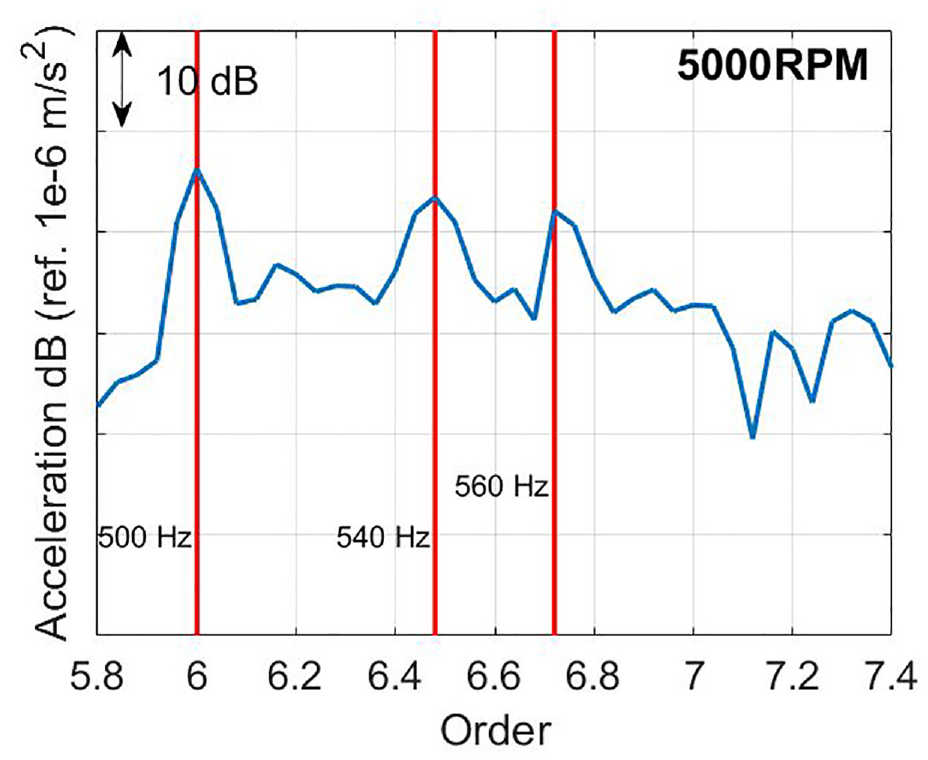
Experimental out-of-plane vibration data of the inverter cover (ordinate values omitted due to confidentiality, each division corresponds to 10 dB).
The main mode of the housing (first bending mode of the inverter cover) is not altered by the inclusion of the EM stiffness. However, the mode shape at around 560 Hz that is dominated by the bending motion of the output shaft and has no contribution from the housing when the EM stiffness is not considered, changes behaviour and now shows deflection of the housing similar to the bending mode at 537 Hz. Such a combination does not exist when the EM stiffness is not considered. The corresponding mode shapes and natural frequencies are summarised in Figure 19. The inclusion of the EM stiffness in the modal analysis better explains the additional peak in the experimental data at around 560 Hz by showing a mode nearby that exhibits this exact behaviour.
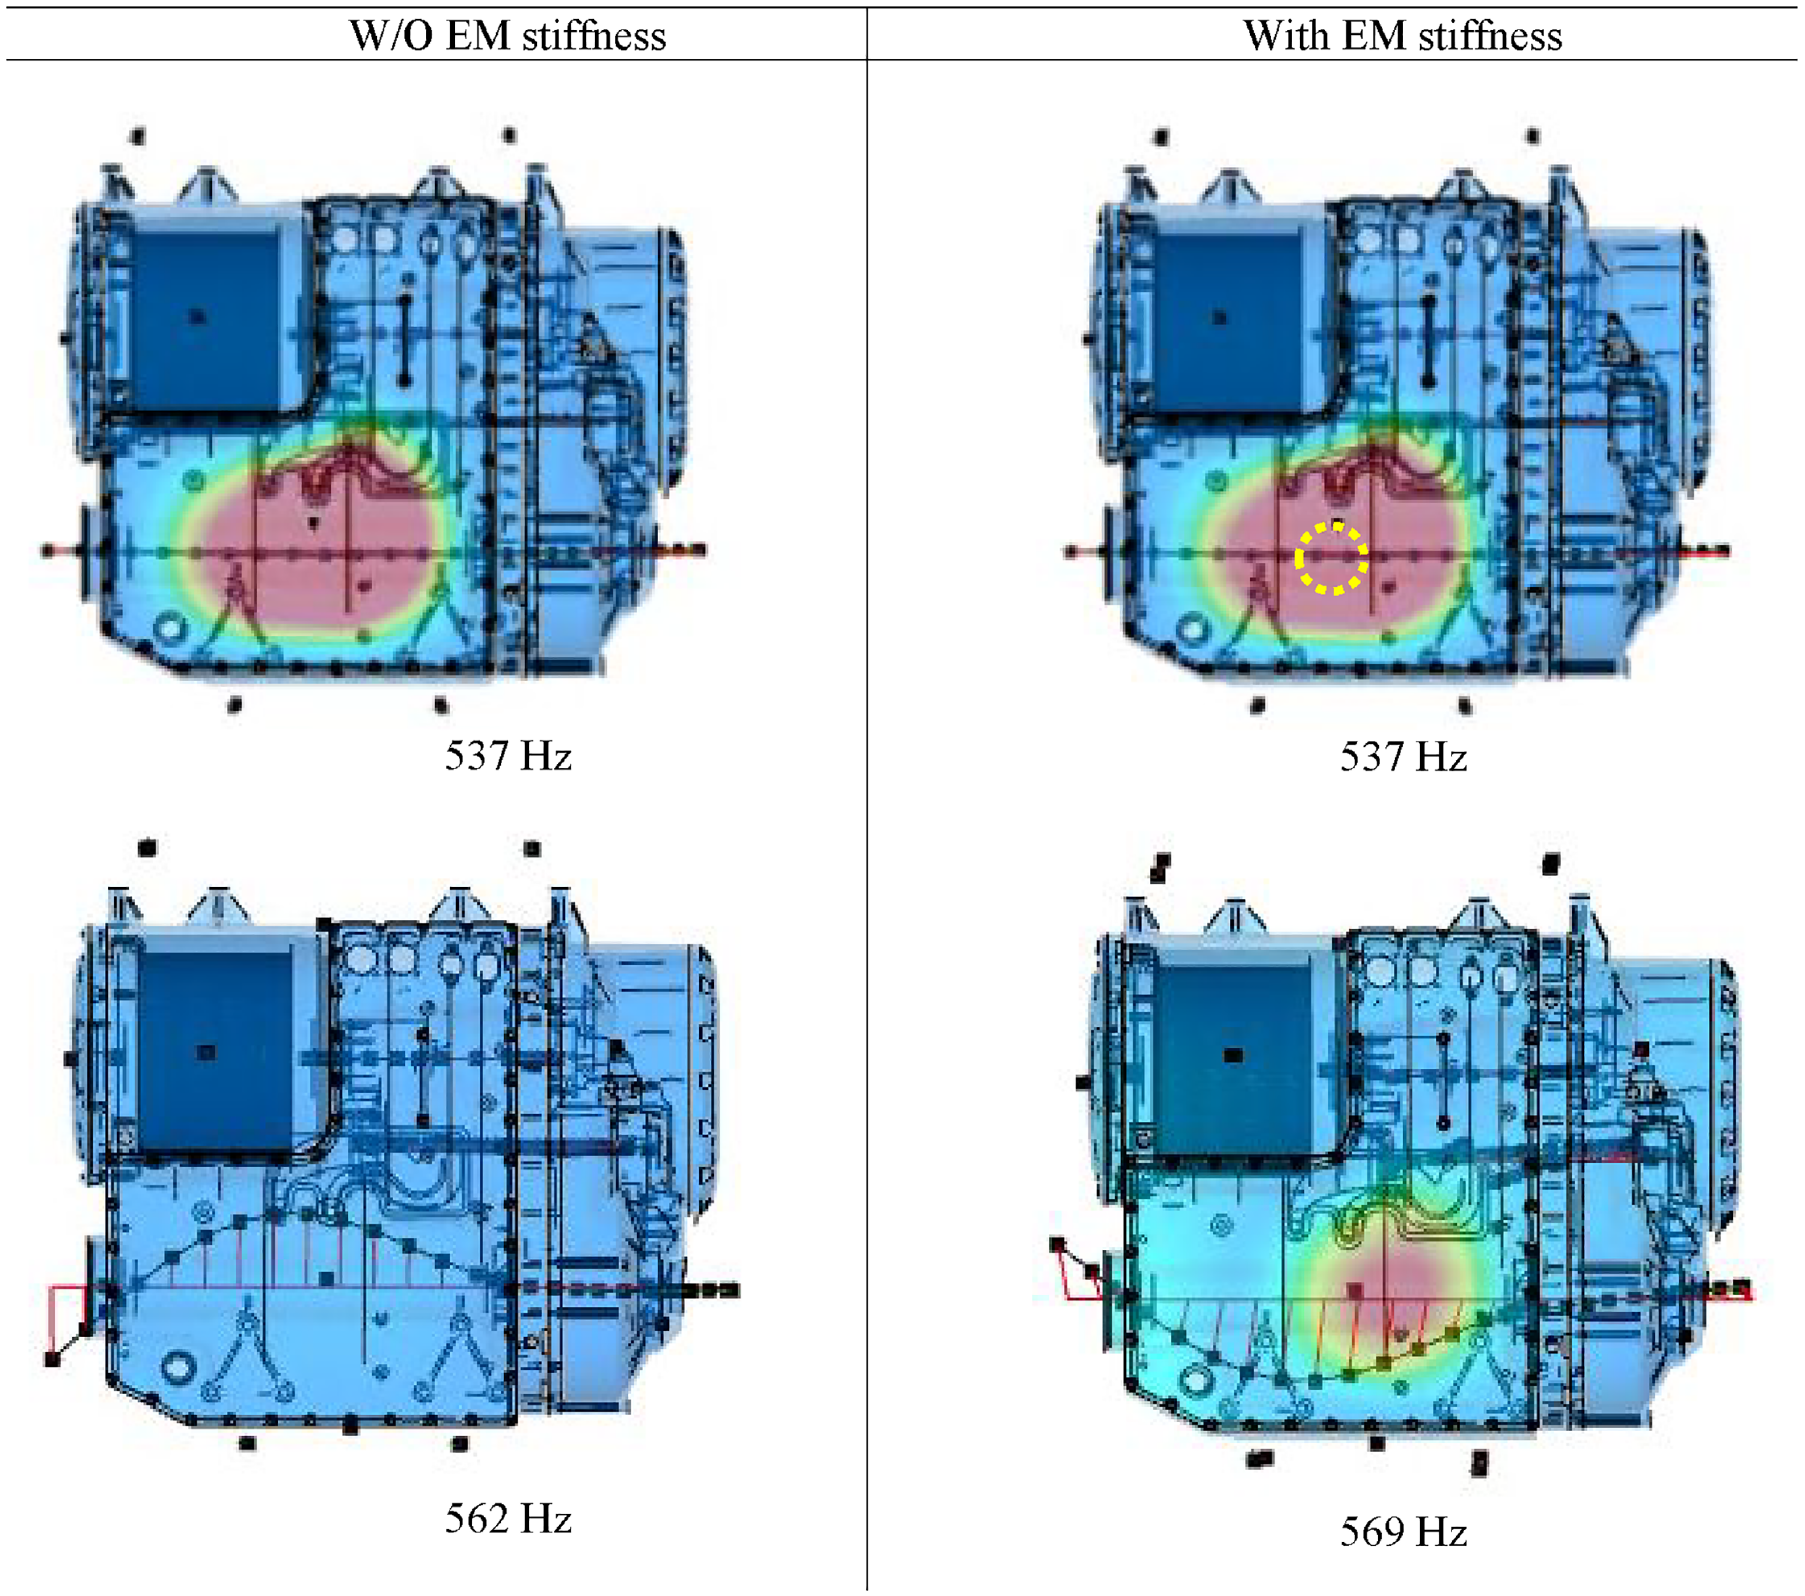
Effects of the EM stiffness on the mode shapes of the housing and natural frequencies.
Along with the change in the mode shape, there is a 7 Hz difference in the natural frequency, as it can be seen in the bottom row modes of Figure 19. Performing a first-order sensitivity analysis 49 by calculating the difference in the natural frequency divided by the difference in the linearised stiffness for each bearing and each one of the six degrees-of-freedom, it can be noted that the system is more sensitive to the changes in the torsional stiffnesses of the bearings around the axial direction, as shown in Figure 20.
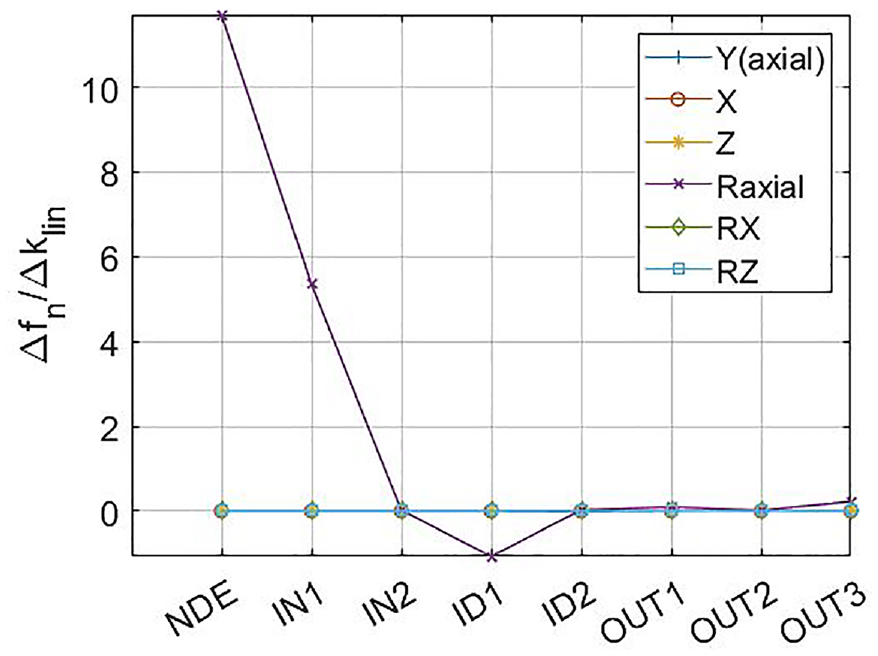
First-order sensitivity analysis on the change in the natural frequency.
Considering the powertrain operating range from 2600 to 3300 rpm, the 537 Hz mode of the housing occurs nearby different important excitation orders of the system. Namely, order 11.2 due to gear meshing of the final reduction and order 12 from the e-motor. At these speeds, for the same torque demand, the EM stiffness is the same as discussed in the previous section. Considering 150 Nm torque, the comparison between mode shapes and natural frequencies with and without the EM stiffness is shown in Figure 21. The 537 Hz mode appears in both cases as previously shown for 5000 rpm at 150 Nm. The EM stiffness is slightly higher for these speeds than for 5000 rpm. The mode at 569 Hz (5000 rpm) occurs now at a slightly higher frequency of 574 Hz. Once again, the inclusion of the EM stiffness changes the mode shapes not only for the 574 Hz mode, but also for the one at 532 Hz. In the case without the EM stiffness, this mode occurs at 518 Hz and does not produce significant deflection in the housing. Moreover, a new mode at 596 Hz appears when the EM stiffness is considered. Such mode cannot be seen in the case without the EM stiffness either at higher or lower frequencies.
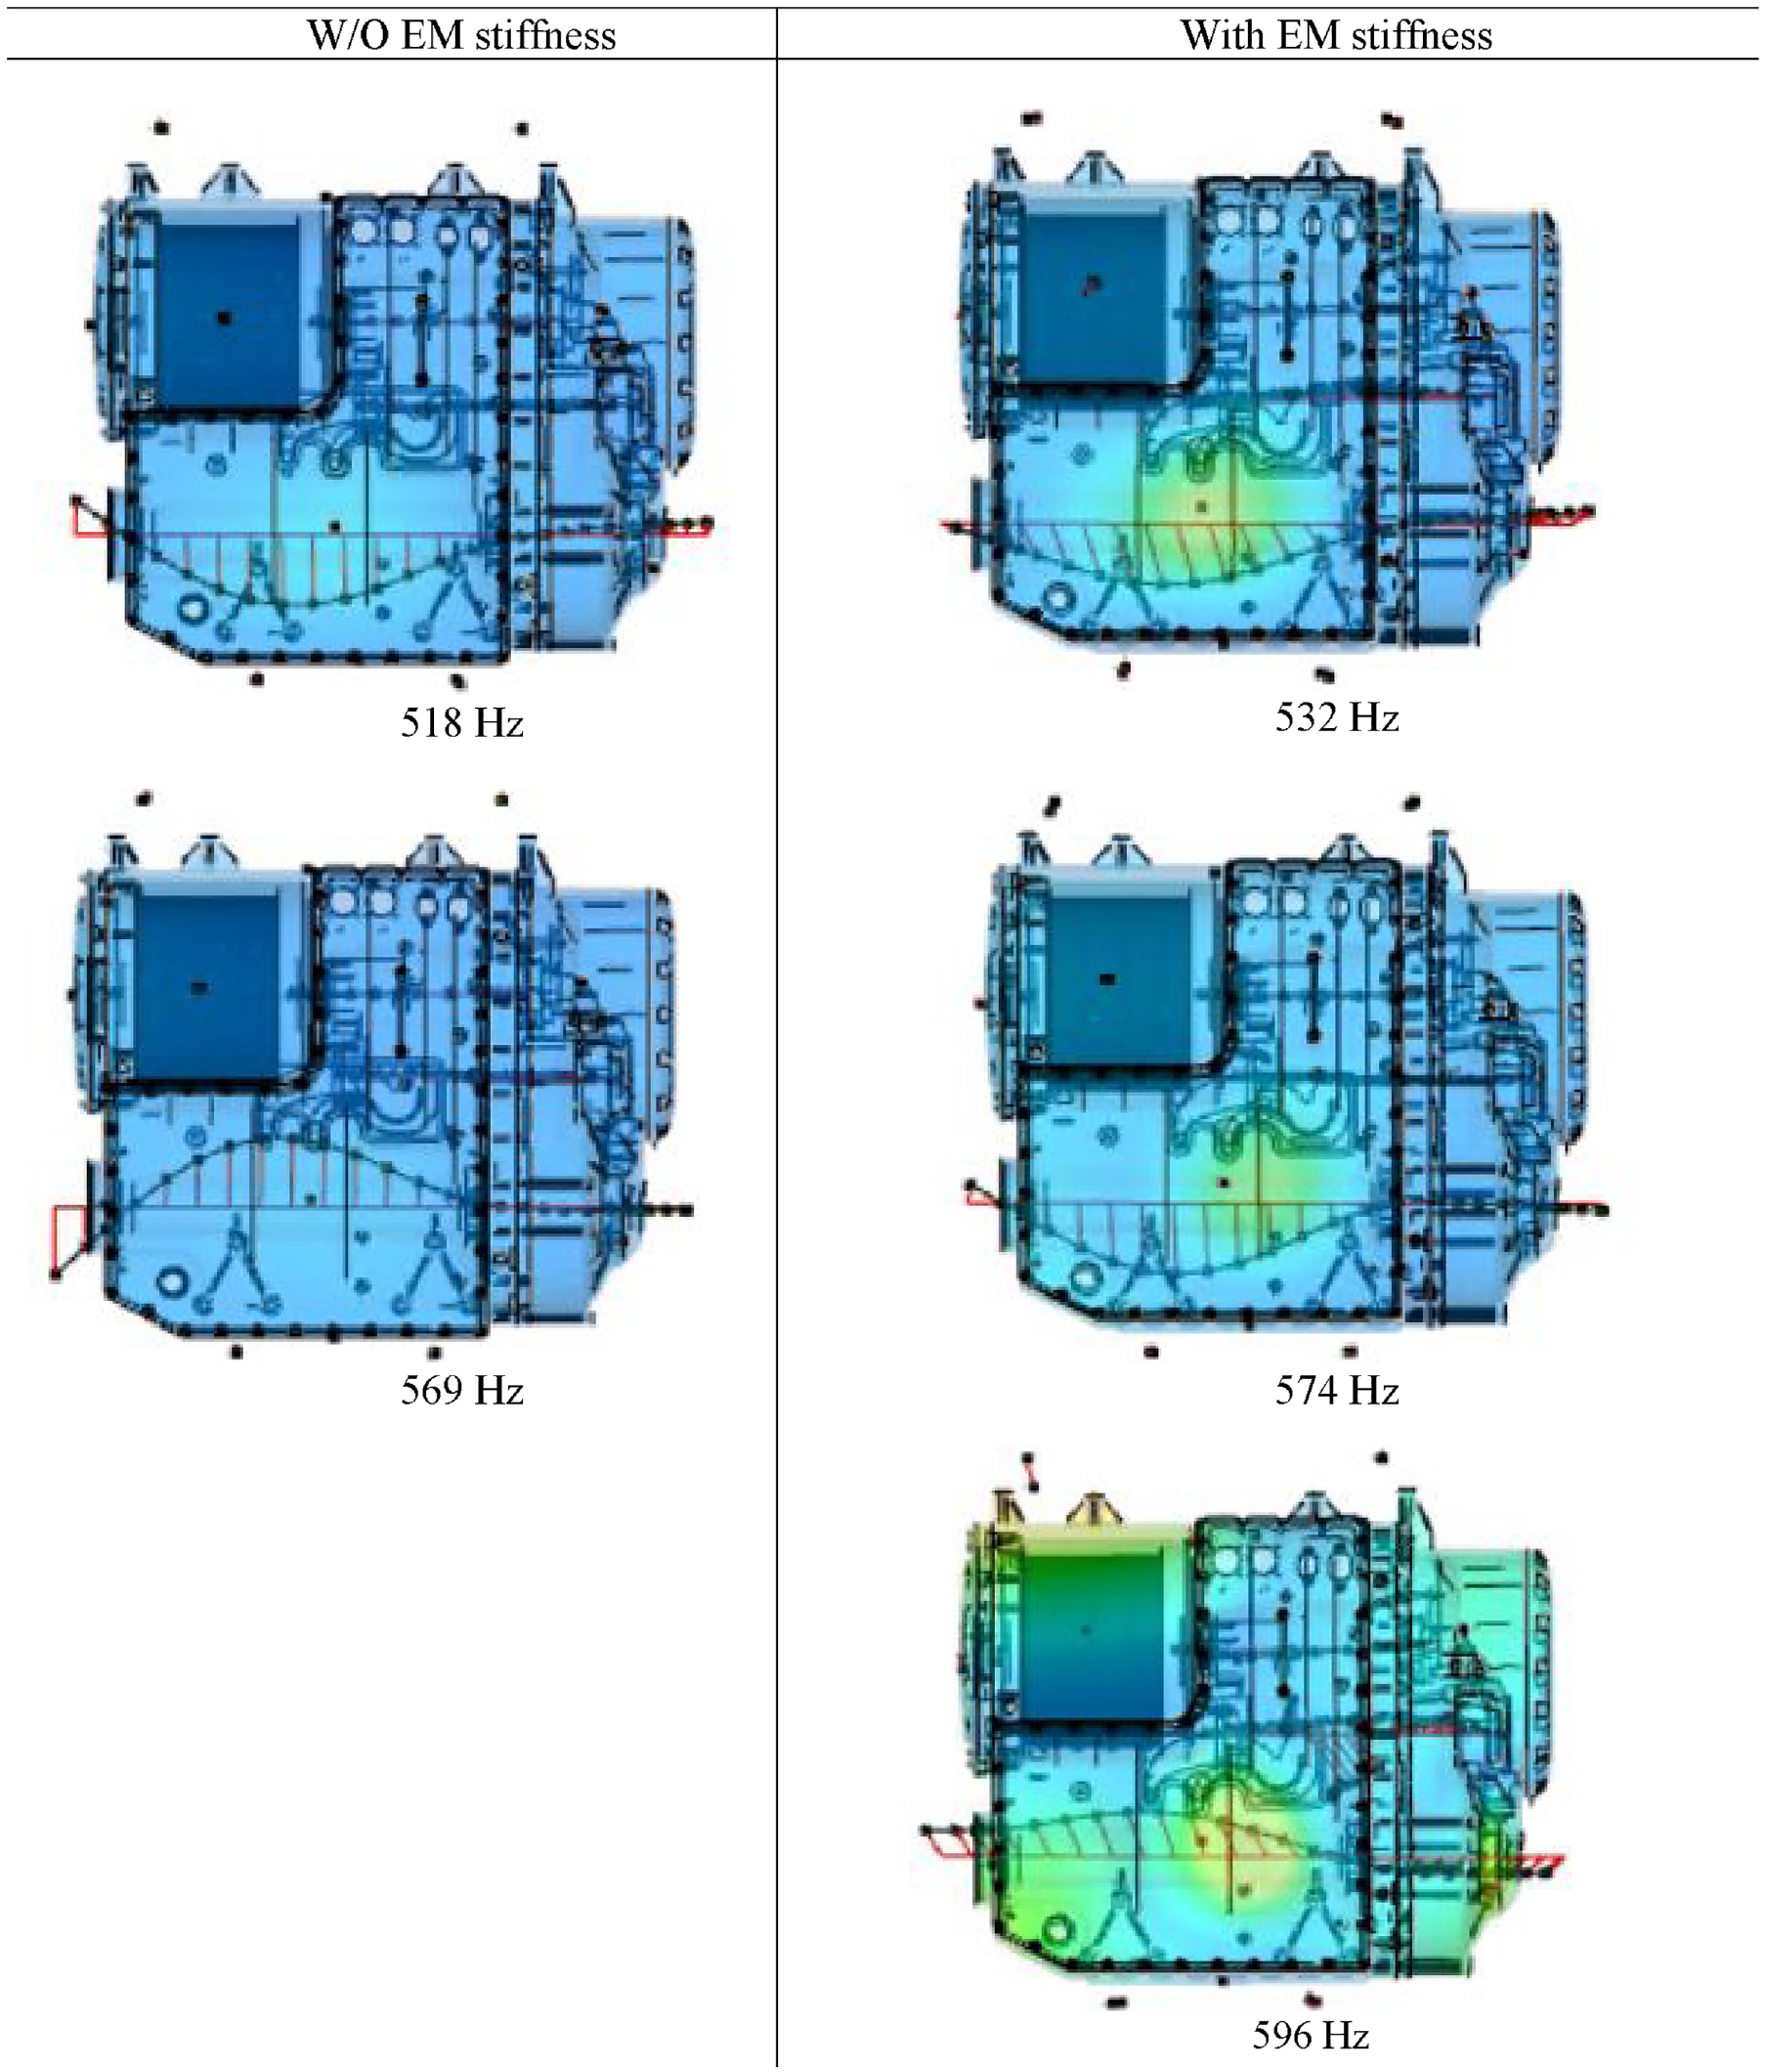
Effects of the EM stiffness on the mode shapes of the housing and natural frequencies in the 2600–3300 rpm range.
At these lower speeds, the changes in natural frequencies and mode shapes due to the EM stiffness can have NVH implications. As mentioned, the excitation at order 11.2 originates from the meshing of the final drive, whilst the excitation at order 12 is due to the EM forces generated at the e-motor. A summary of experimental order tracking for these two orders is shown in Figure 22. At these speeds and frequency ranges, the response of the powertrain is governed by gear whine. It would be expected that the highest contributions would come from speeds and orders resonating with the 537 Hz mode. However, the experimental data shows that the highest contribution of gear whine occurs at 2825 rpm instead of 2900 rpm. Once again, the consideration of the EM stiffness offers a better explanation on why that occurs. The nearby mode predicted at 532 Hz contributes with shaft bending, especially the output along with deflection of the inverter cover. In terms of motor whistling, there is an amplification at around 2950 rpm that is also better explained by the 12th order excitation (590 Hz) being resonant with the mode predicted at 596 Hz in the presence of the EM stiffness.
Considering only the effects of the EM stiffness on the mode shapes of the housing, one can examine the Modal Contribution Factor (MCF) to determine what modes are the largest contributors to the acceleration of the selected point of the inverter cover at a given frequency. The response of the system can be written as a linear combination of the modal response multiplied by different scale factors.35,50 Here, the MCF is given by 50 :

where
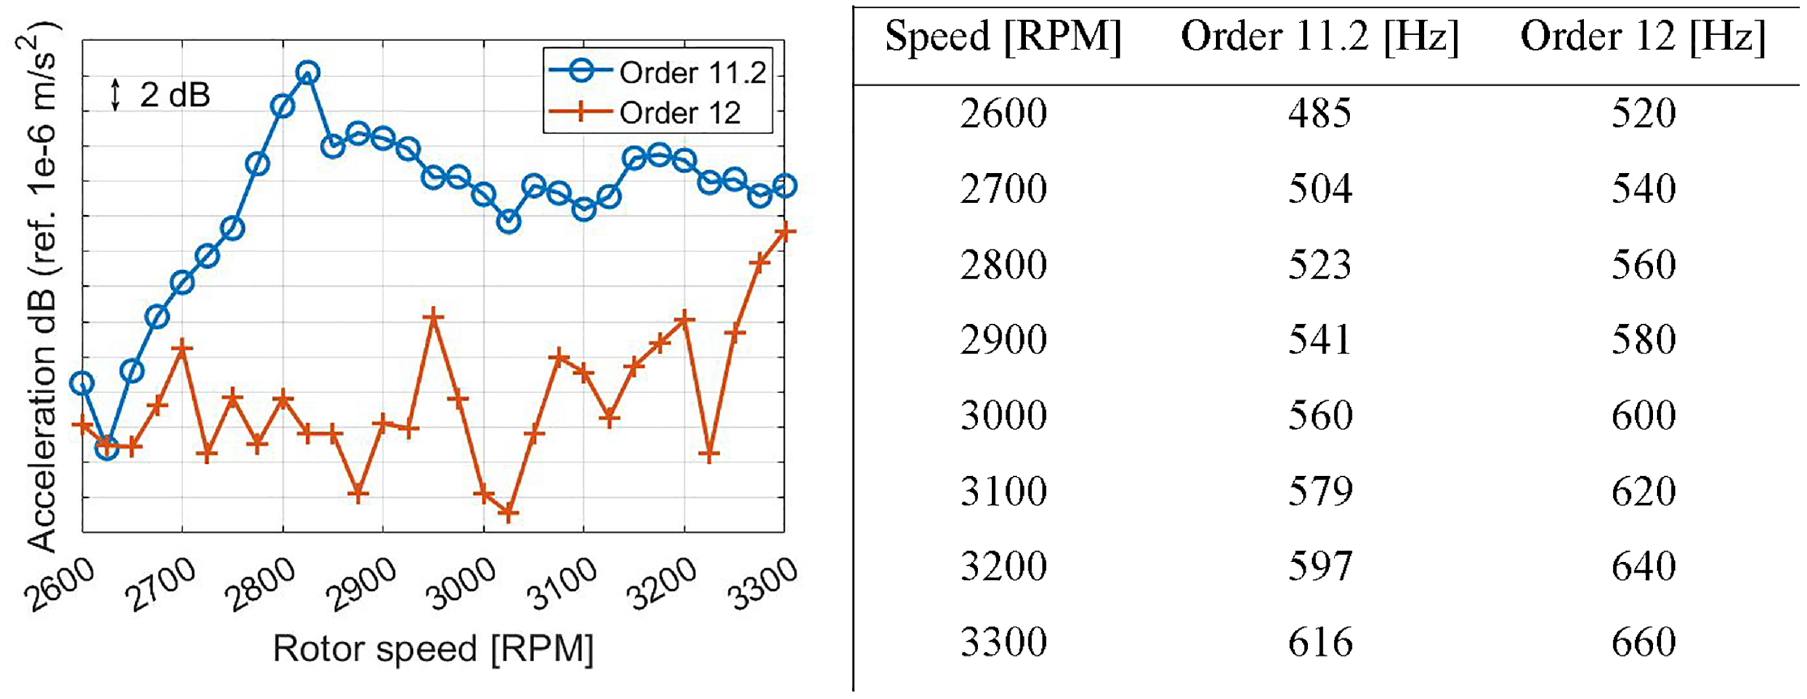
Order tracking and excitation frequencies. Experimental out-of-plane acceleration at the inverter cover (ordinate values omitted due to confidentiality).
Figure 23 shows the MCF at 600 Hz when the rotor speed is 3000 rpm at 150 Nm.
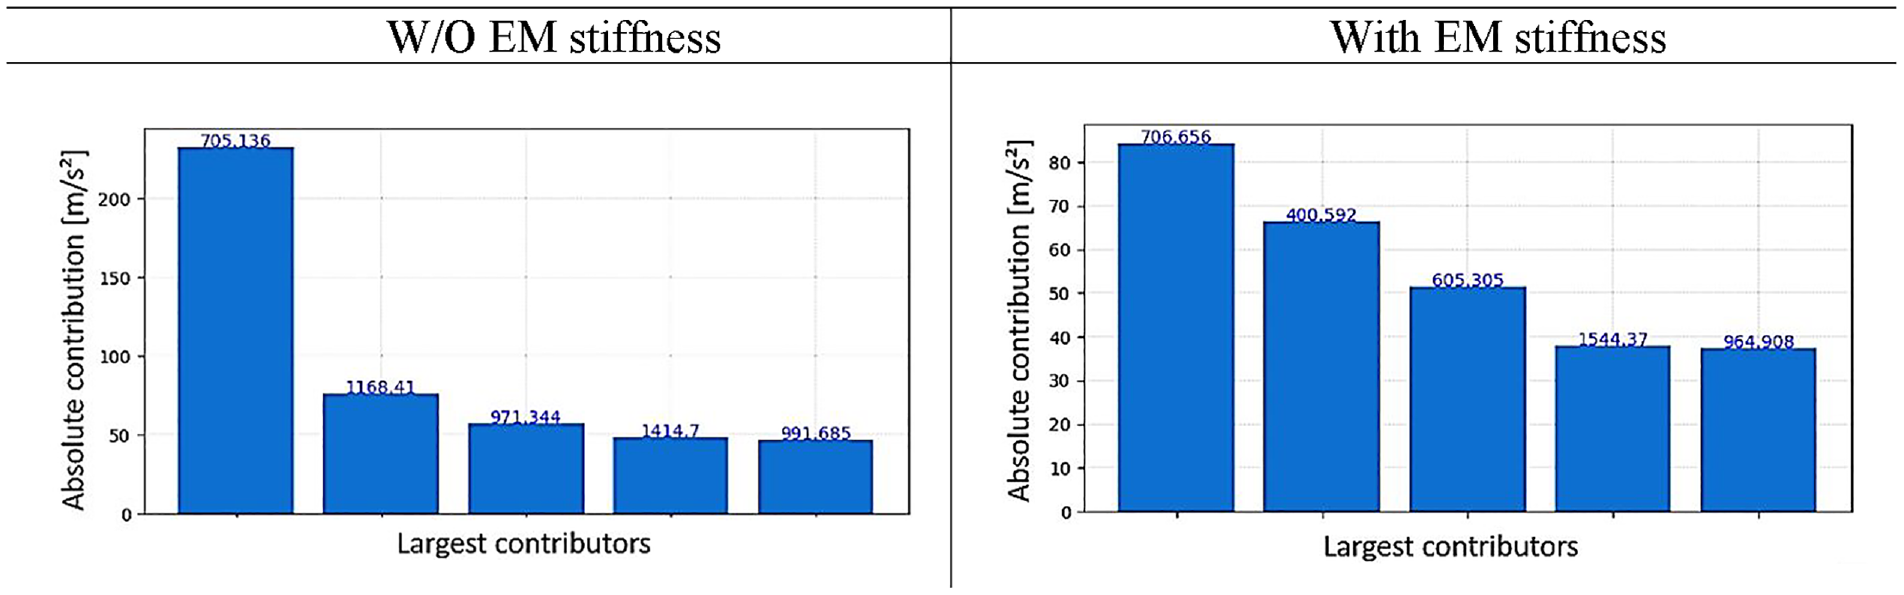
600 Hz – Modal Contribution Factor (3000 rpm, 150 Nm).
The mode at 705 Hz is directly linked to the housing (second bending mode of the inverter cover). One can note that without the EM stiffness, the acceleration is largely dominated by this mode. Whilst when the EM stiffness is considered, a more uniform contribution from different modes is observed including, for example, the mode at around 400 Hz, which does not exist in the modal analysis without the EM stiffness. The mode at 605 Hz (with the EM stiffness) has a similar counterpart in the modal analysis without the EM stiffness at 620 Hz. However, the latter mode (without the EM stiffness) has a small contribution to the inverter cover, and it is not amongst the largest five contributors for the acceleration of the housing. Figure 24 compares the mode shapes with the three largest MCF (EM stiffness considered) with the mode shapes close in natural frequencies where the EM stiffness is not considered.
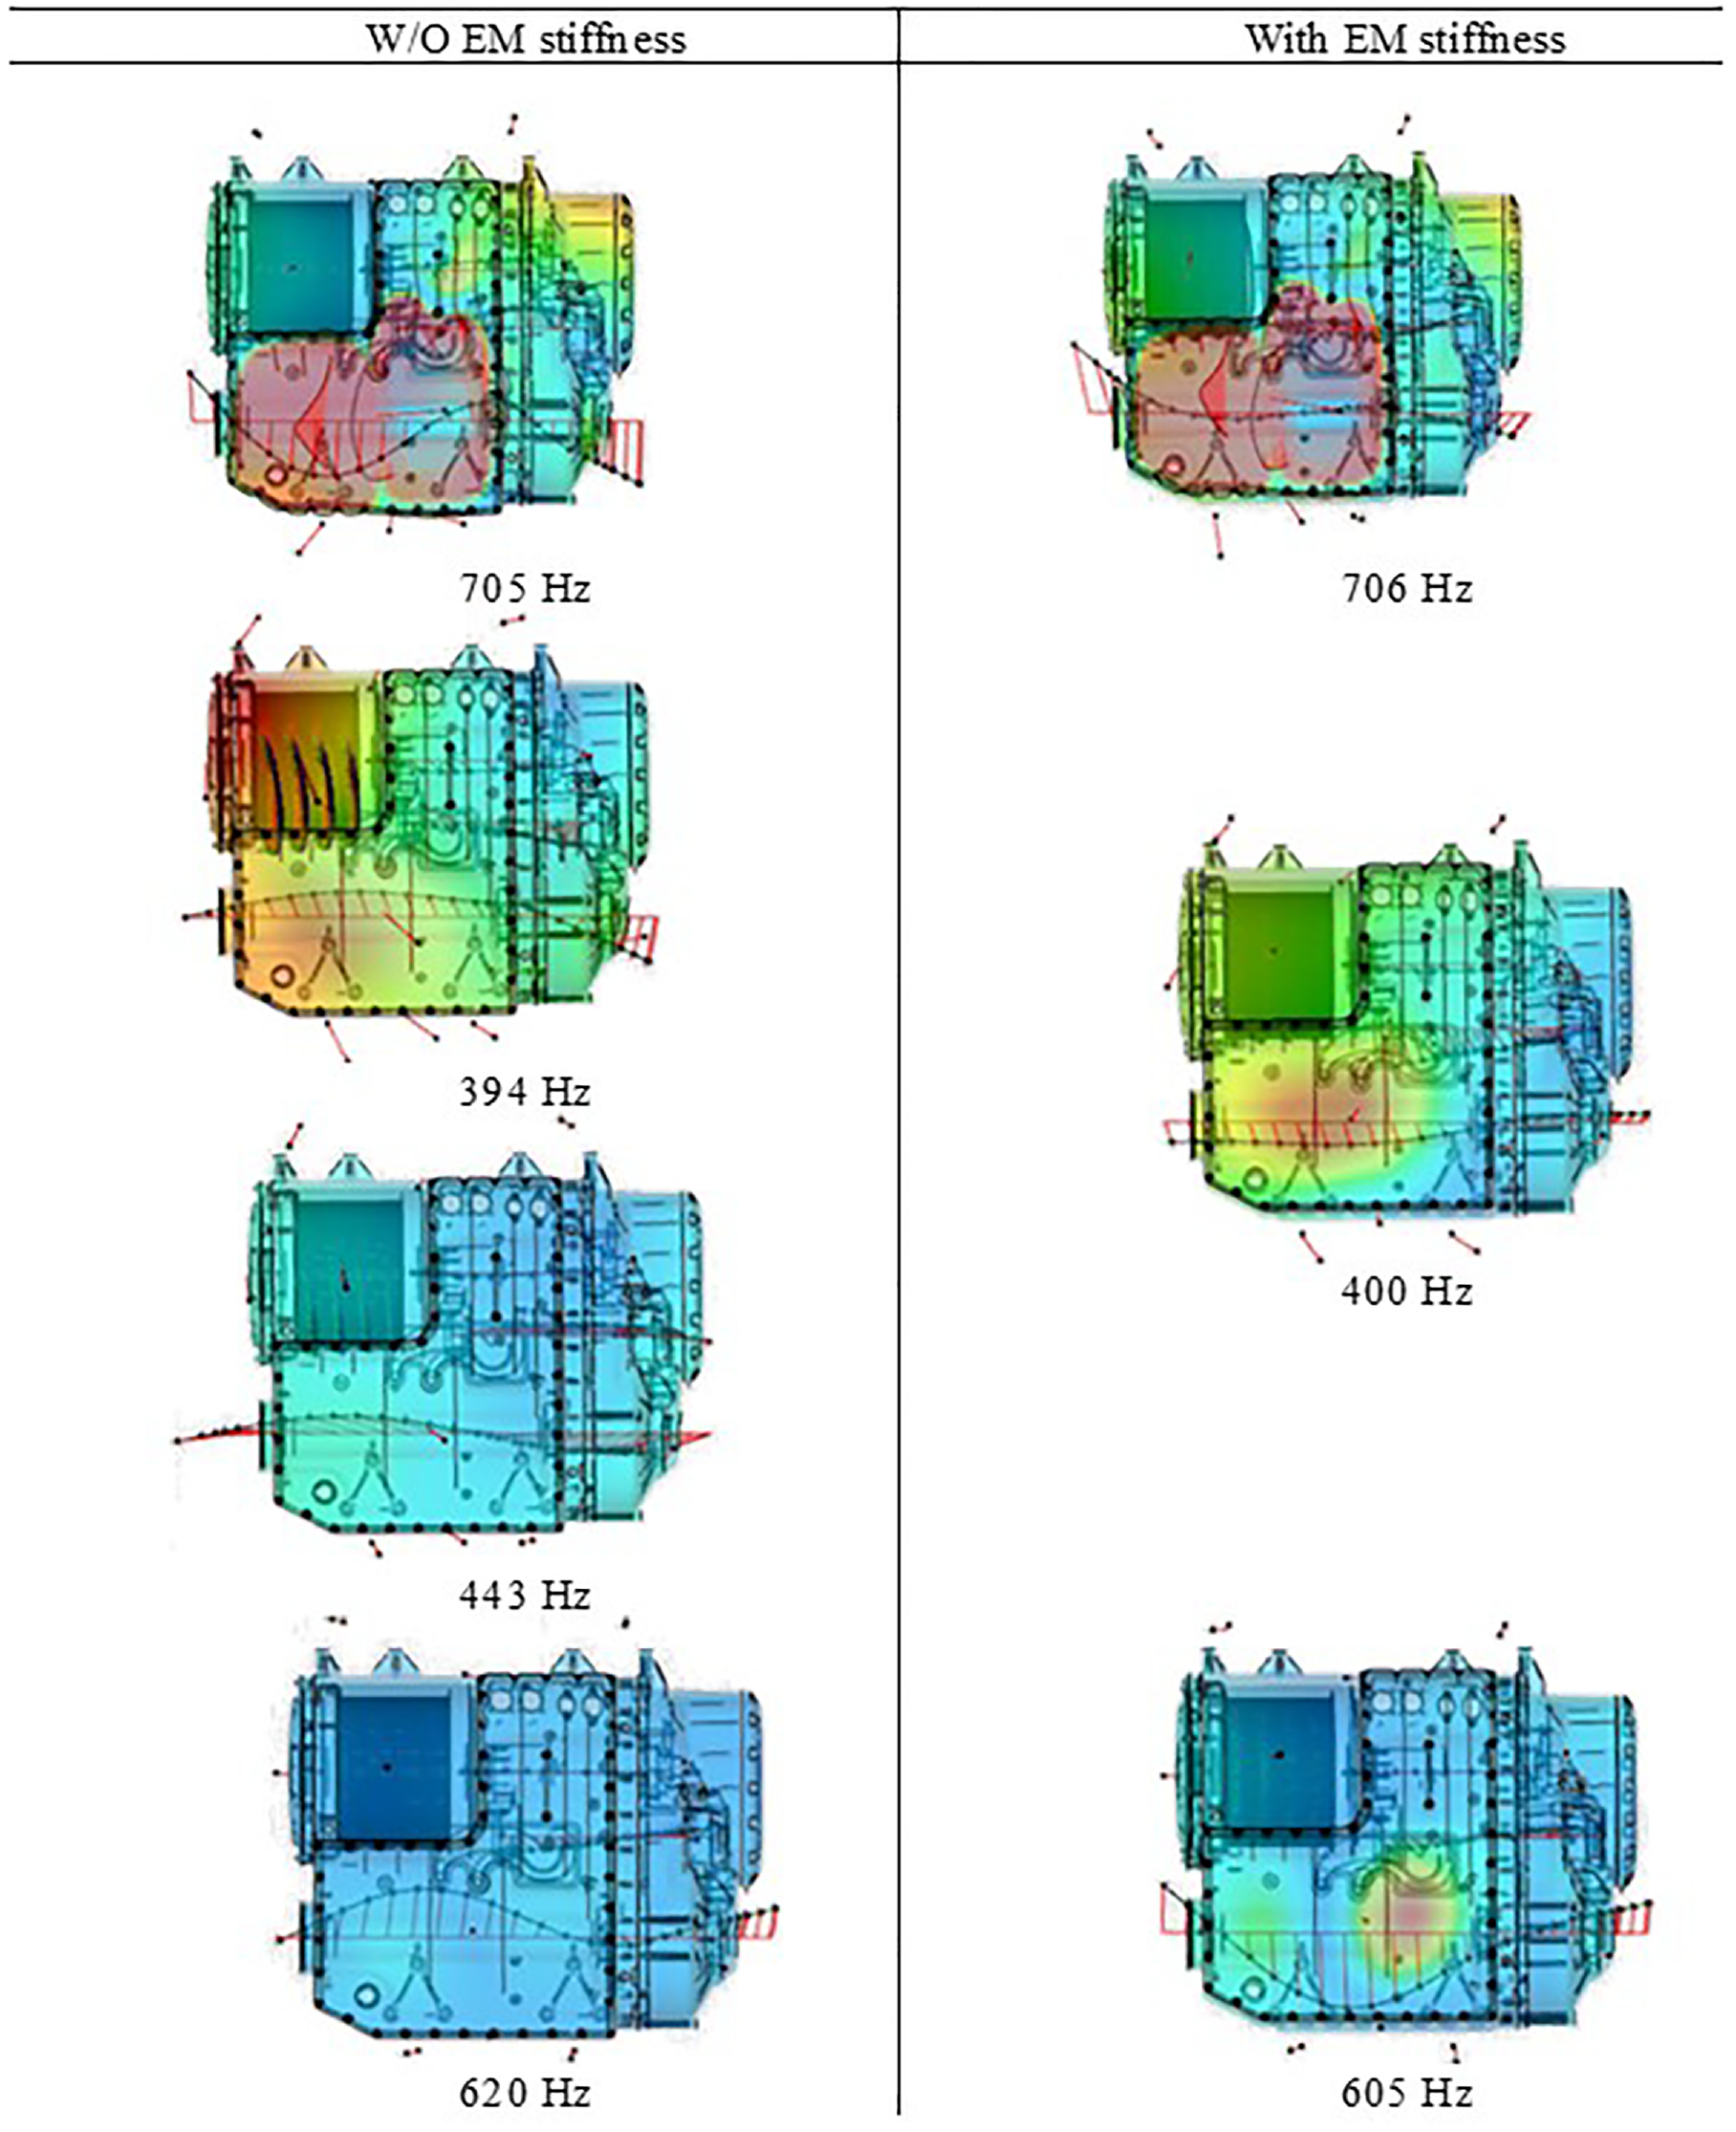
Three largest modes contributing to the acceleration of the inverter cover compared to the closest modes without EM stiffness (3000 rpm, 150 Nm).
At 4600 rpm and 150 Nm, the contribution of order 36 (due to the EM forces) in the vibration and noise is higher than at 4800 rpm. The model and experimental vibration data of the inverter cover for these two speeds are shown in Figure 25, with zoomed plots on this region of the spectrum in the bottom row. At 4600 rpm, the order 36 occurs at 2760 Hz. The modal analysis that considers the EM stiffness has a natural frequency at 2762 Hz. In the MCF for the vibration of the inverter cover, this mode is the second largest contributor to the out-of-plane acceleration of the housing. Using the modal analysis without the EM stiffness, the response is largely due to the mode at 3023 Hz, which has MCF almost twice as large as the second largest contributor. The natural frequency without the EM stiffness closest to the excitation is 2742 Hz. The MCF results are summarised in Figure 26. The presence of the EM stiffness once again betters explain why order 36 is higher at 4600 rpm when compared to the higher 4800 rpm speed. The relevant modes are shown in Figure 27.
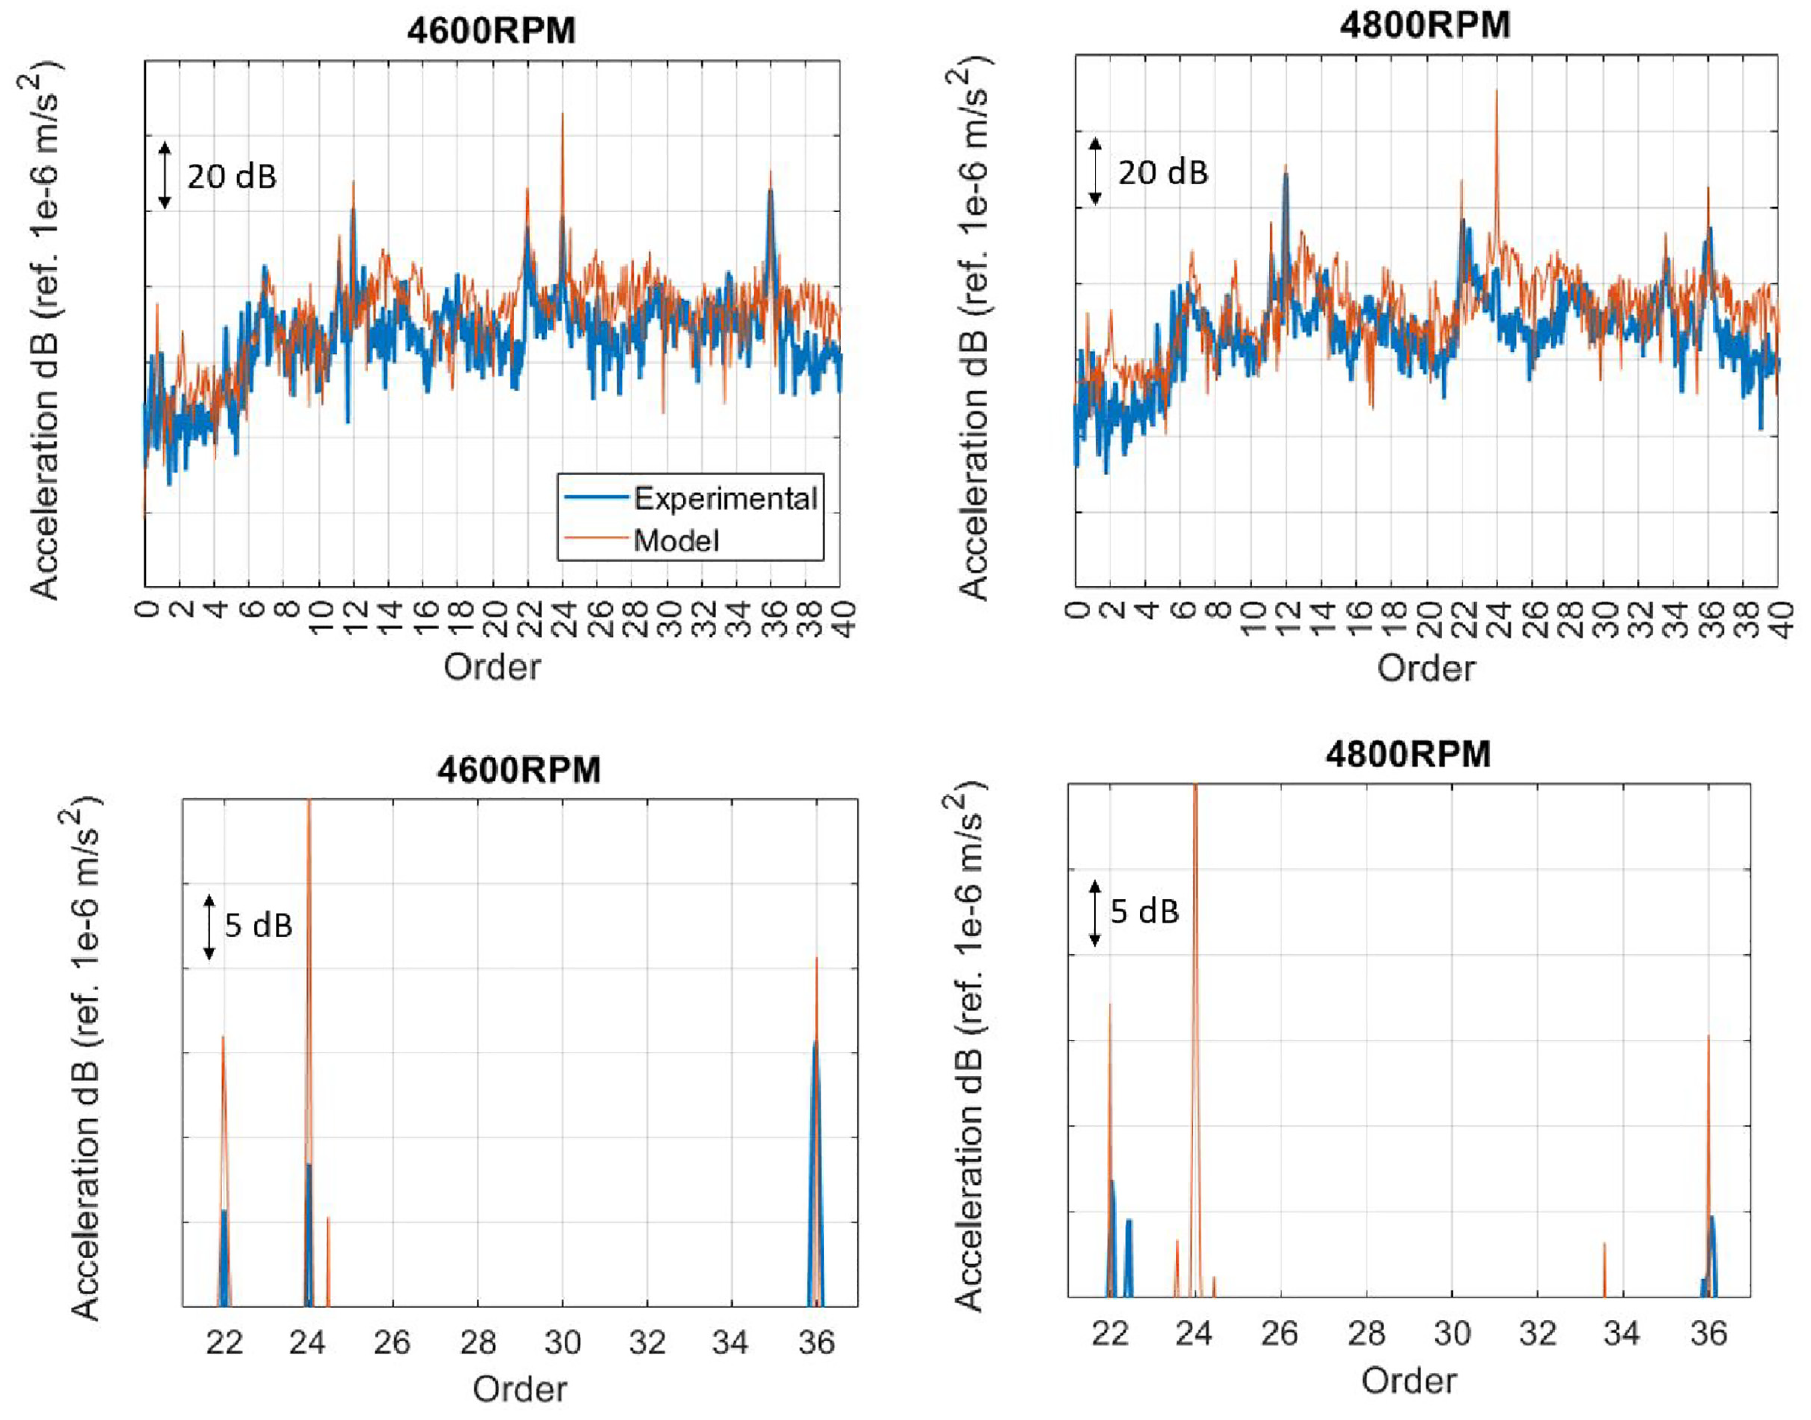
Acceleration data for 4600 and 4800 rpm at 150 Nm (ordinate values omitted due to confidentiality). In all figures, the limits between the Y axis match in the same row.
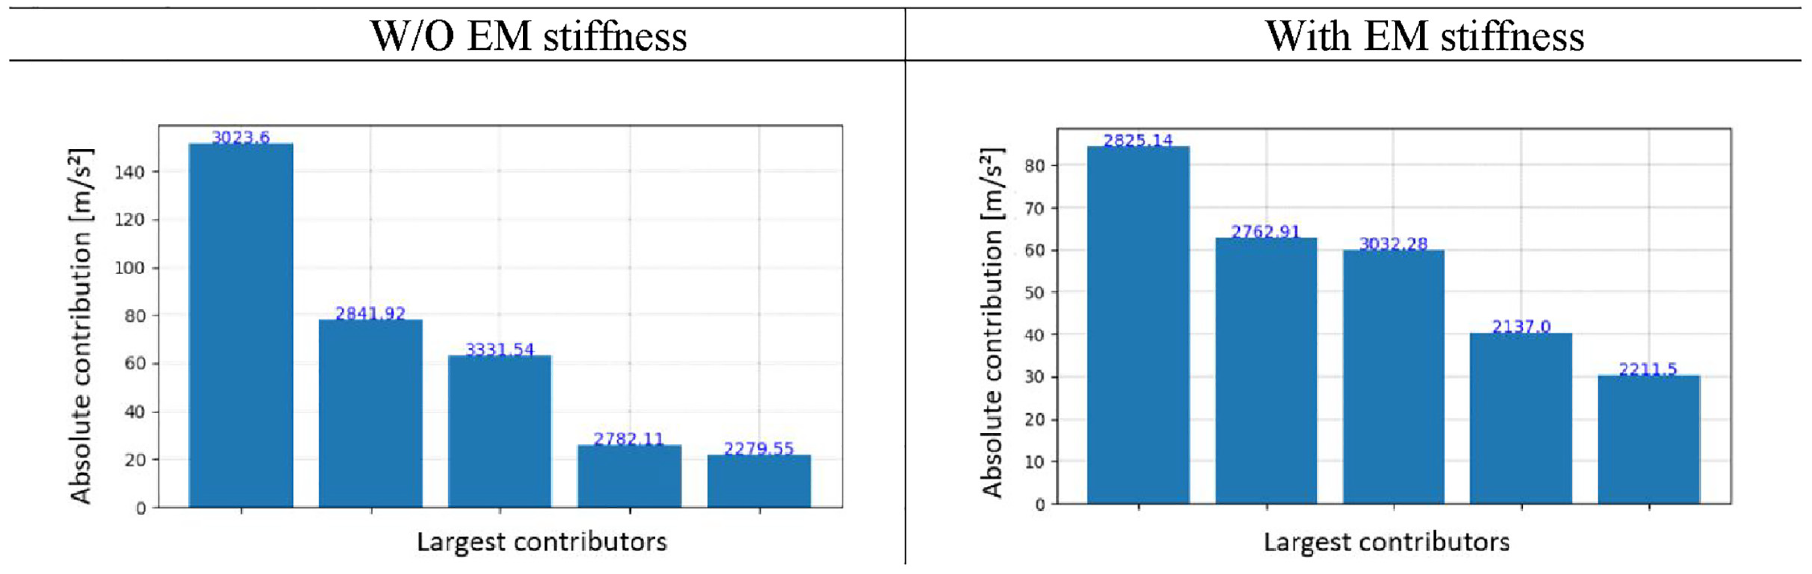
MCF at 2760 Hz (4600 rpm, 150 Nm).
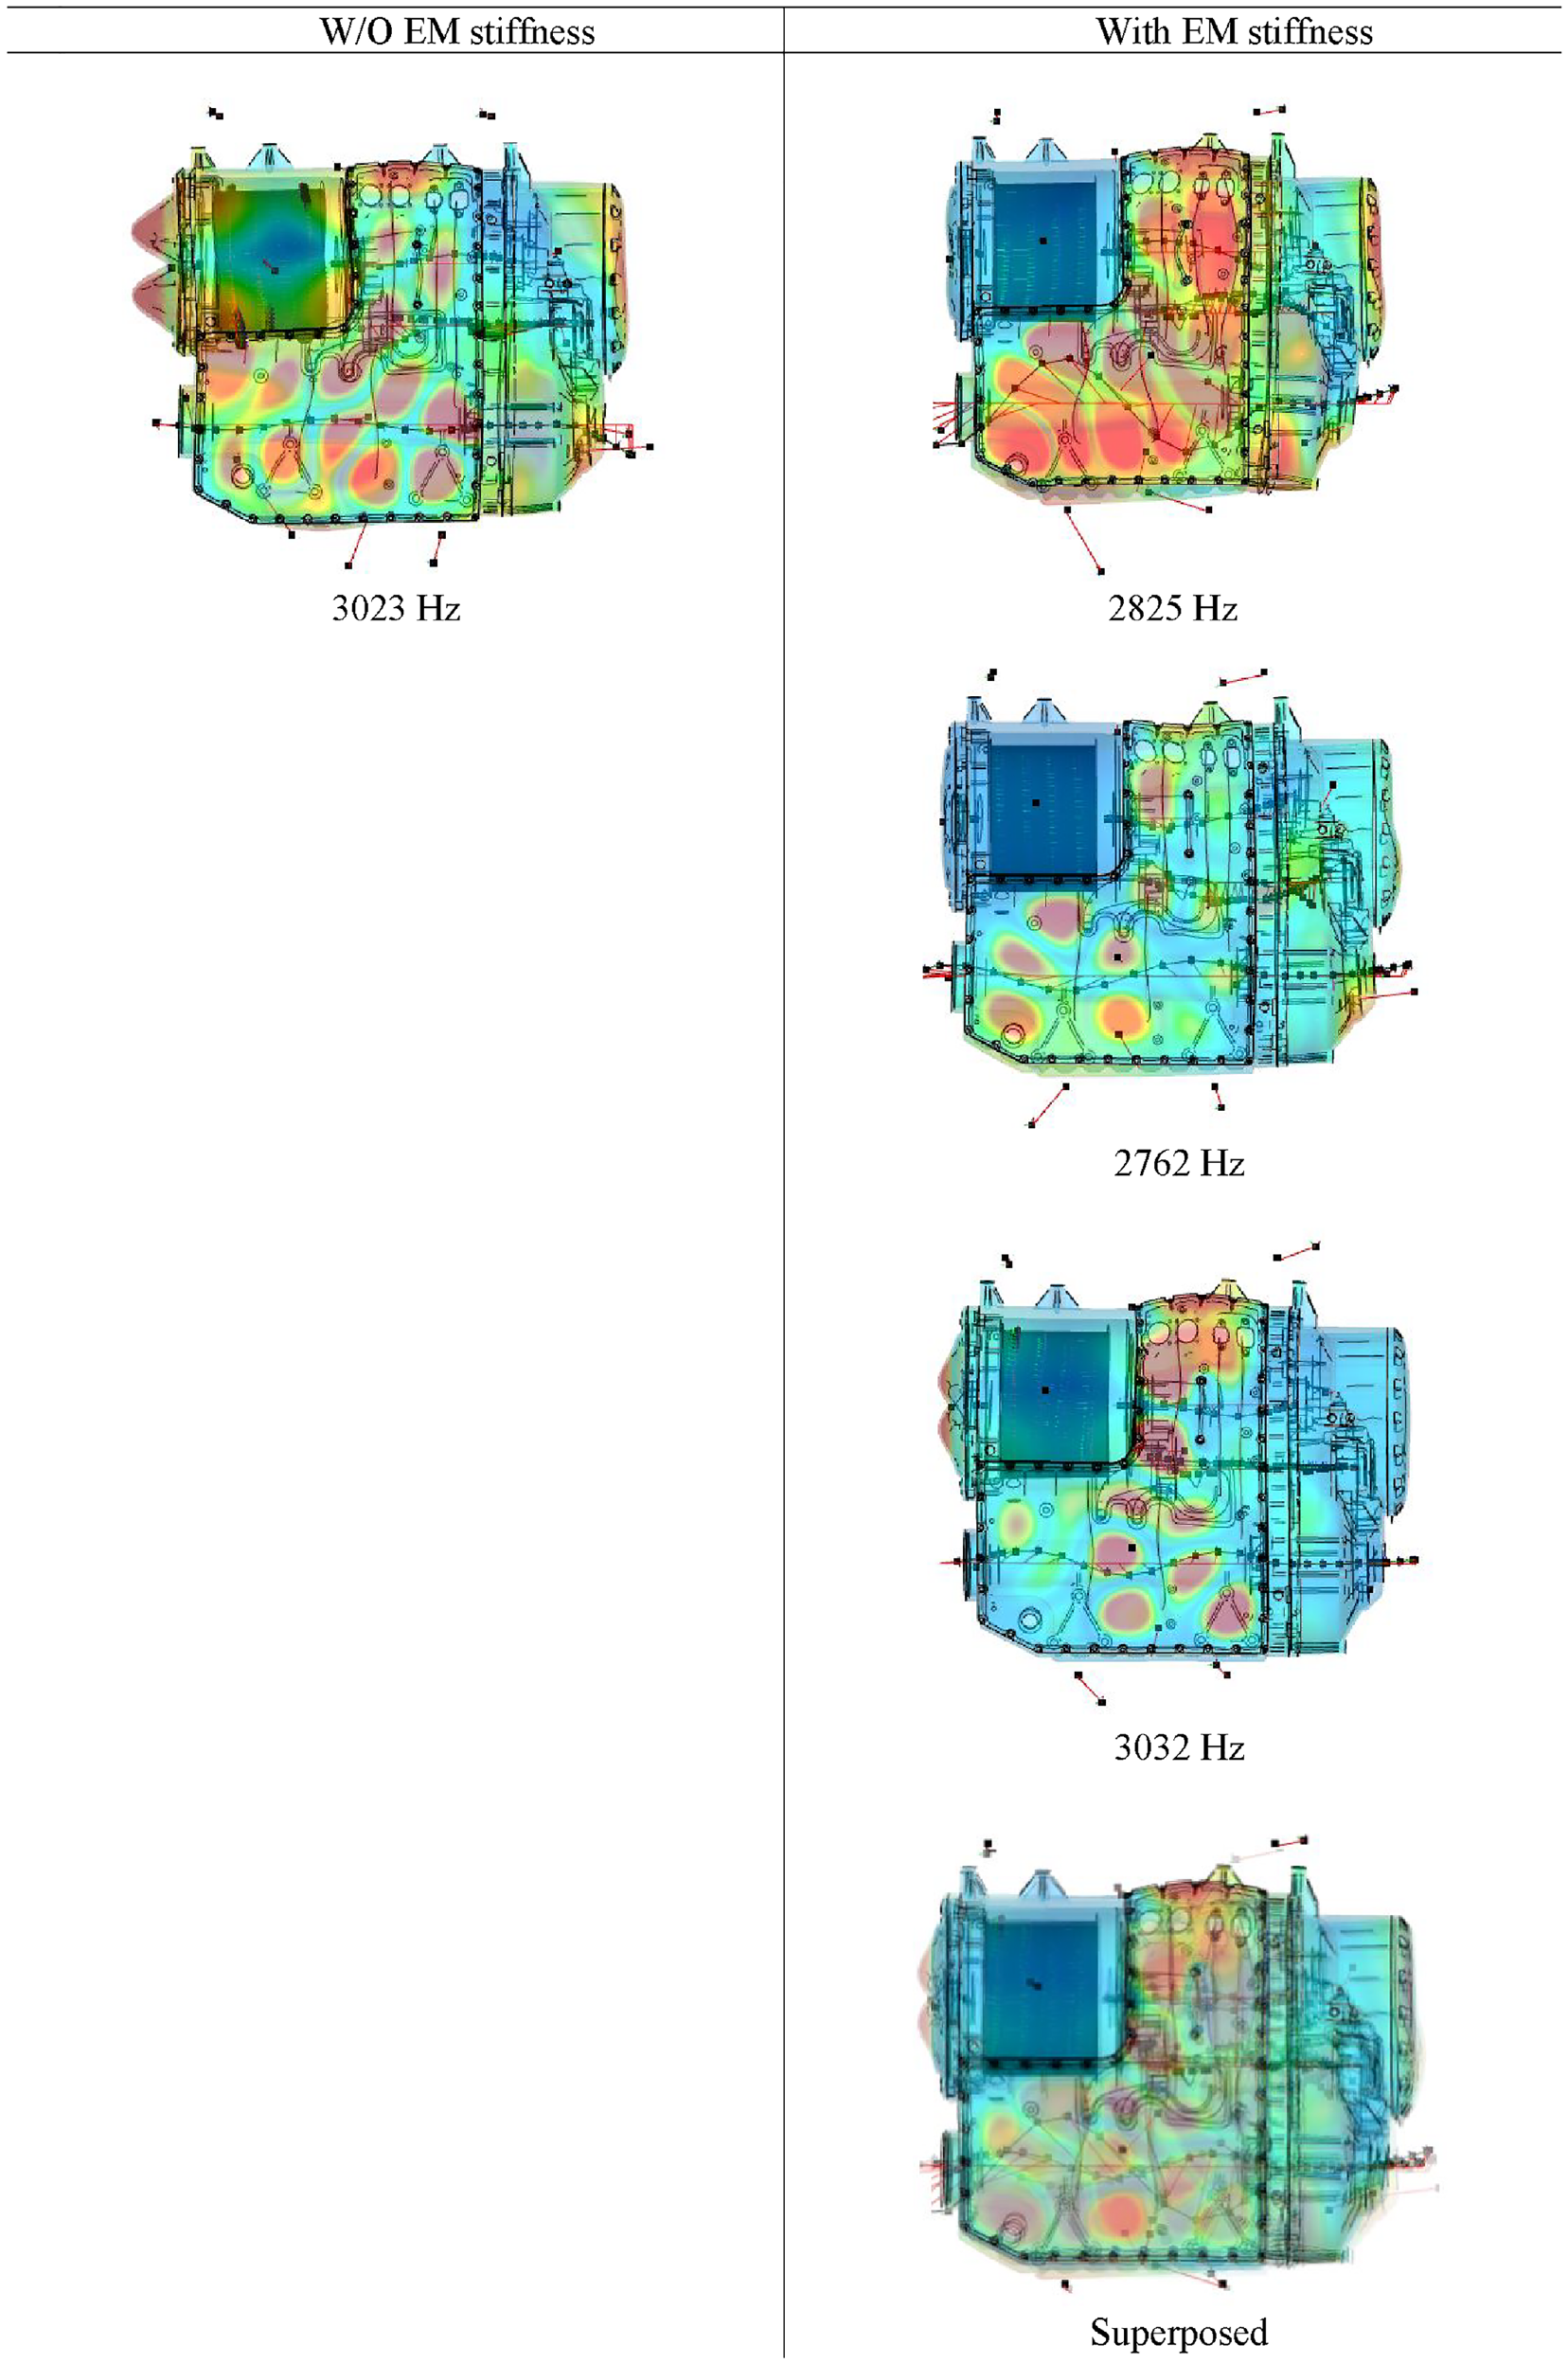
Relevant modes contribution for the vibration of the inverter cover (4600 rpm at 150 Nm, order 36).
By visual inspection, a comparison between the superposition of the shown mode shapes with the EM stiffness seems to better agree with the out-of-plane acceleration of the housing at 2760 Hz, shown in Figure 28 (especially at the high levels on the bottom left corner and the vertical line on the right of the housing). Both regions are highlighted in the figure.
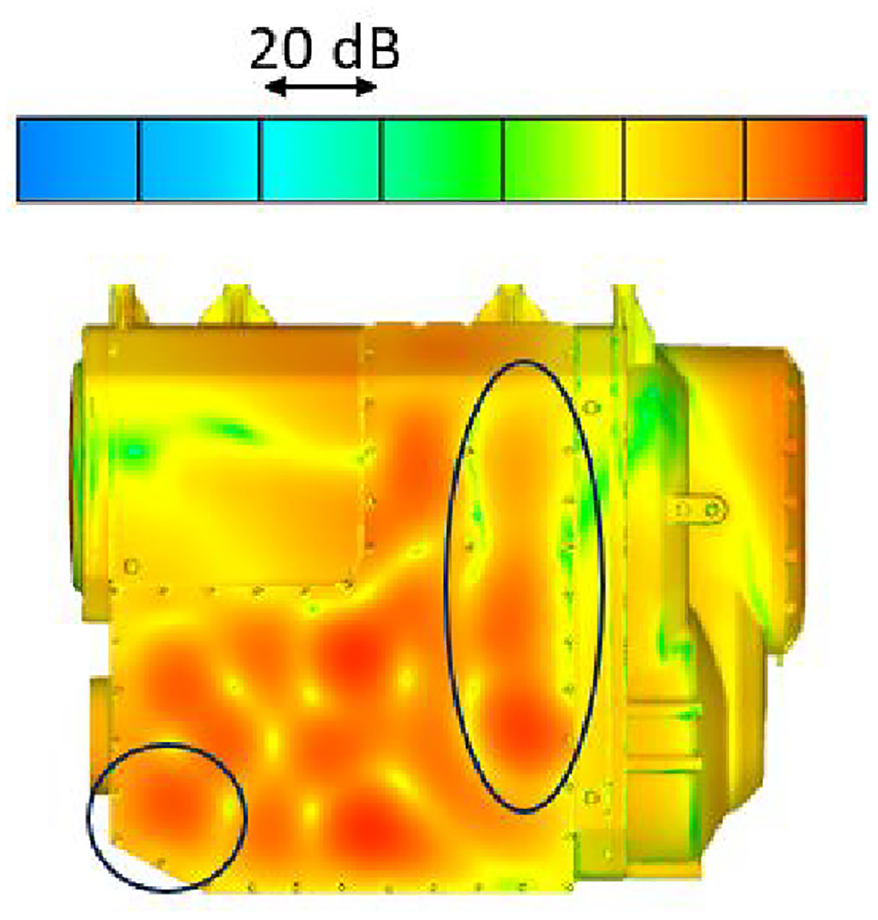
Acceleration of the housing during operation (4600 rpm, 150 Nm, 2760 Hz).
The out-of-plane acceleration at a different location on the system was also measured and it is shown in Figure 29(a). One can note the vertical line at around 1340 Hz and amplifications in the response when this is crossed by gear or motor orders. Figure 29(b) shows the acceleration calculated by the model while the motor operates at 3000 rpm and 150 Nm, 1340 Hz.
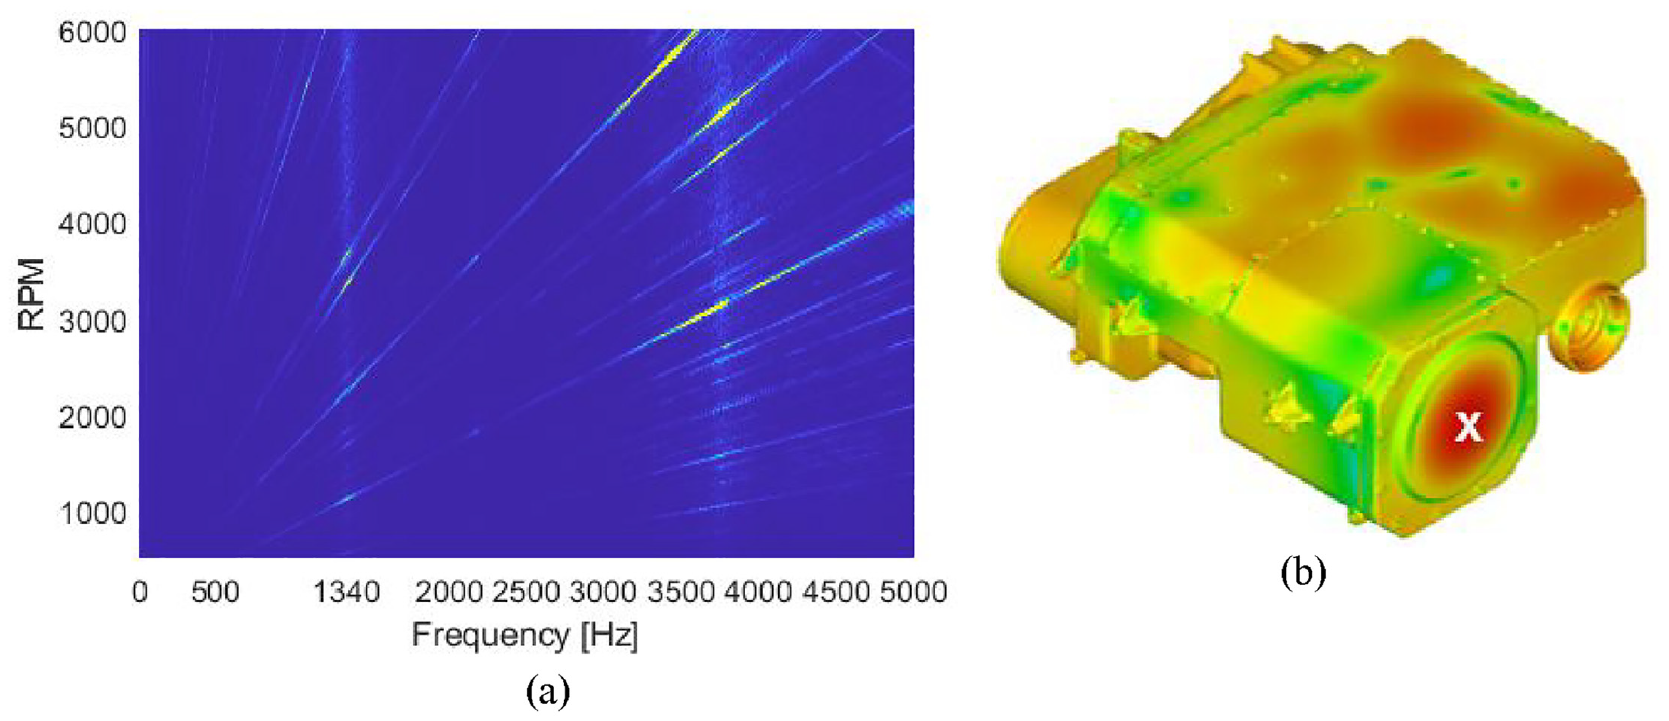
Measured out-of-plane acceleration in (a) and operational acceleration in (b) at 3000 rpm, 150 Nm, 1340 Hz. The white X marks the location where the acceleration was measured (acceleration values omitted due to confidentiality).
Again, the most relevant mode shapes (MCF results) when the EM stiffness is considered agree better with the operational acceleration, as shown in Figure 30. This is highlighted by the higher deflection at the left-hand side of mode 1121 Hz, for instance and by the single higher level around X in contrast with the two lobes that mode 2115 Hz would contribute with.
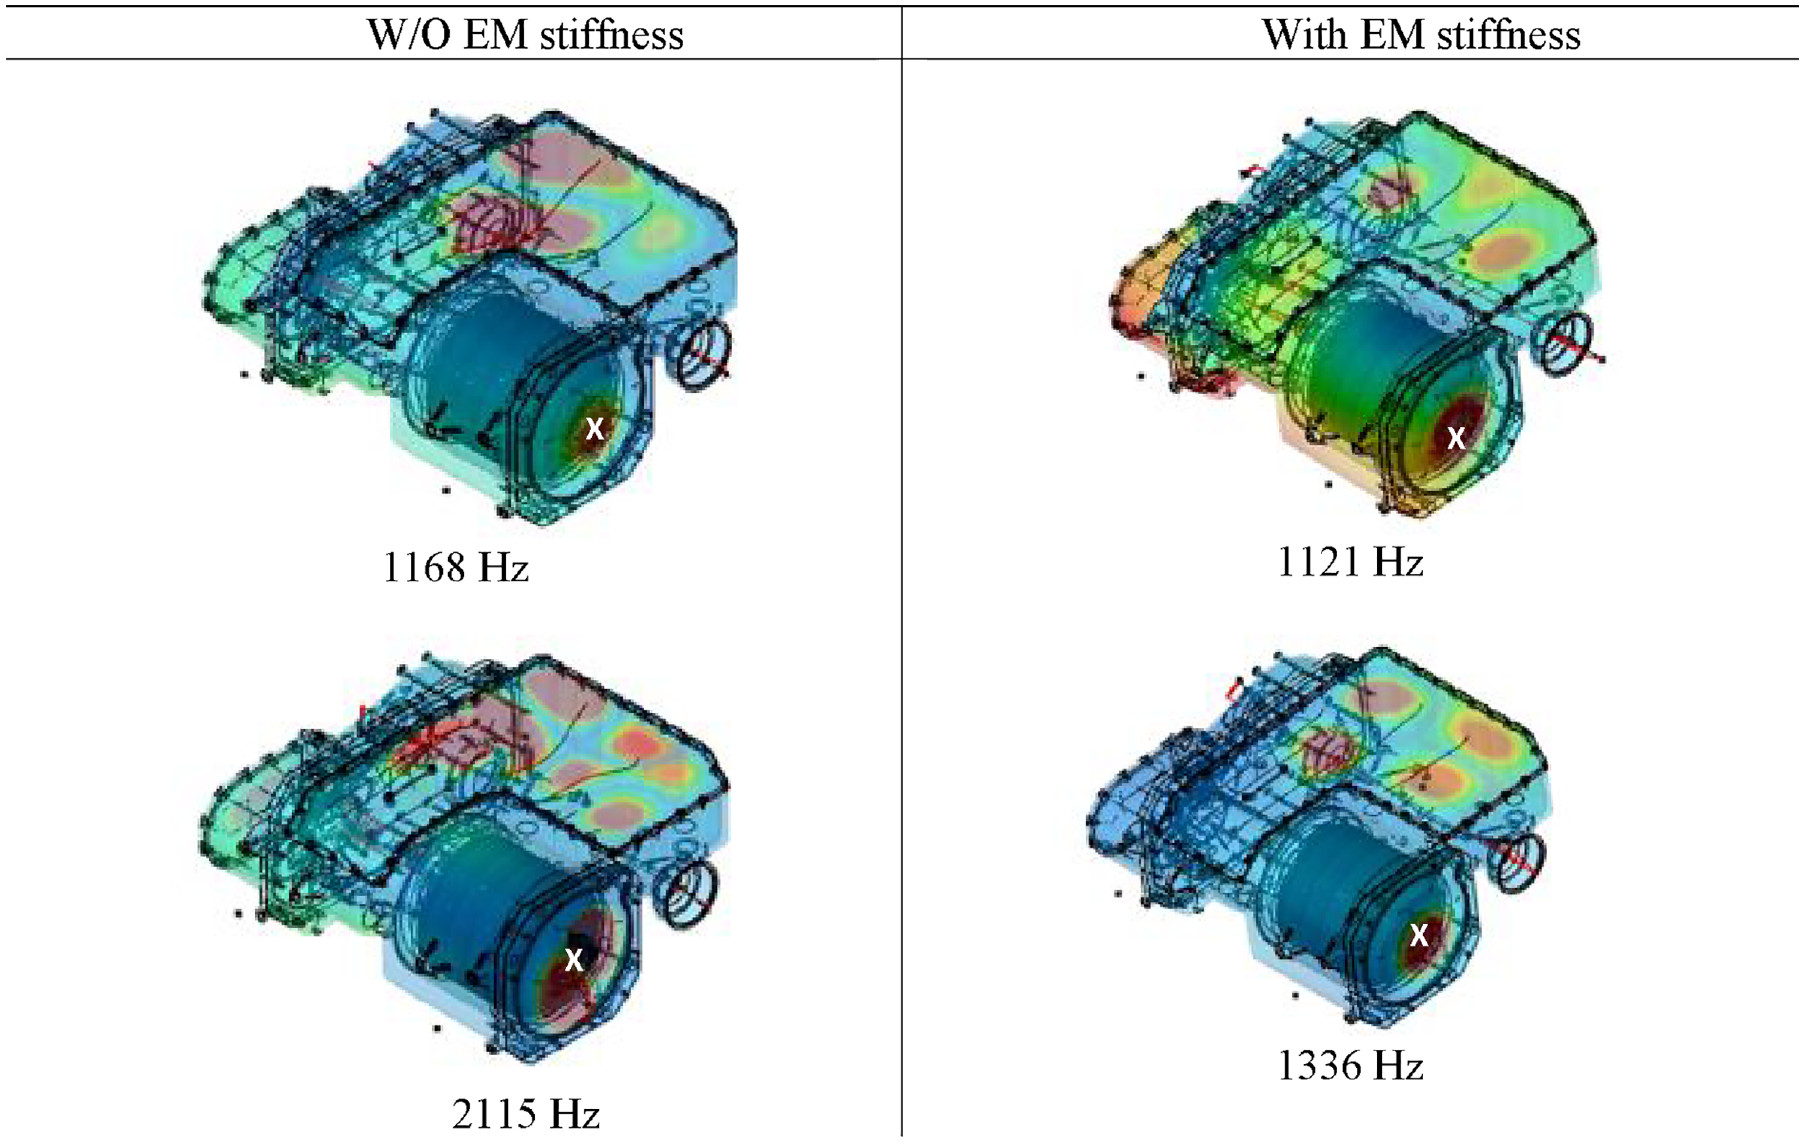
Highest MCF modes, vibration of the motor cover (3000 rpm, 150 Nm, 1340 Hz).
The flow chart in Figure 31 summarises the three different phases in the methodology. The system is simulated as whole, to observe how it behaves during operation. From this, the radiated noise can be calculated and the vibration of the housing, for instance. In parallel, the EM stiffness can be calculated. Following that, two modal analyses are completed, with and without the EM stiffness. After the modal analyses, the MCF can be calculated based on the two different sets of modes and the shape of operational vibration of the housing is compared with the mode shapes with and without the EM stiffness. The flow chart also highlights how the modes when the EM stiffness is considered better explain the experimental and numerical data.
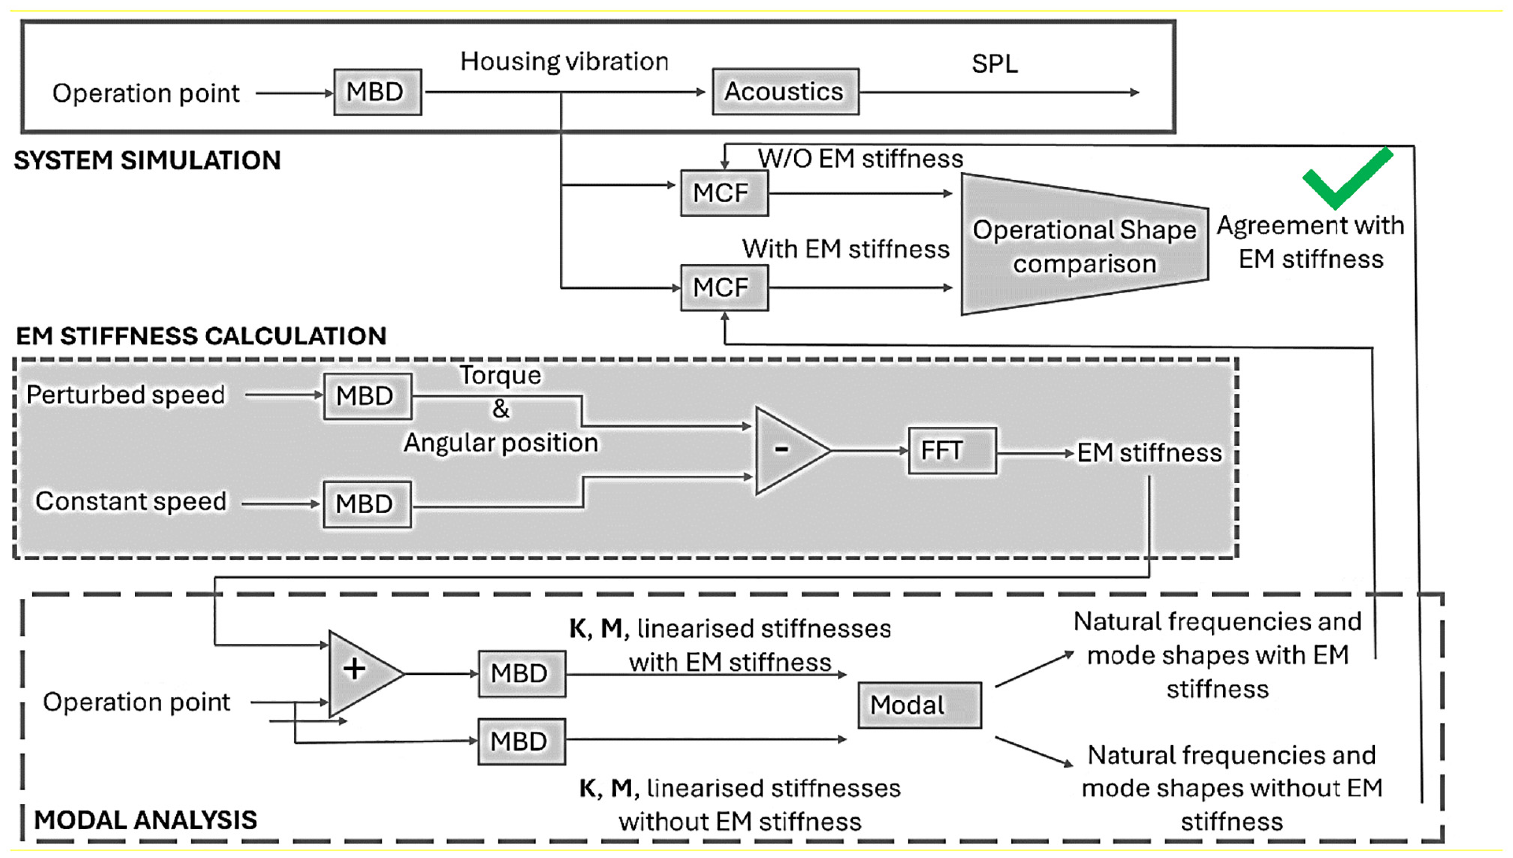
Flow chart of the methodology.
Conclusions
This work investigates the effects due to EM interactions between rotor and stator in an e-powertrain, which are acting as a virtual torsional spring, affecting the modal content of the system and thus, its dynamic response. The analysis covers various operating conditions (e-motor speed and transmitted torque), focusing on the deflection of the flexible housing that surrounds the powertrain. This was done through flexible multi-body dynamics model results (modal analysis and dynamic response) and experimental data. The paper contributes to the state-of-the-art of design methods by expanding the analysis on the effects of the EM stiffness in the modal behaviour of e-powertrains beyond the typically reported low frequency torsional dynamics. The novel results obtained show that the EM stiffness can affect the natural frequencies and mode shapes at higher frequency regions. Due to the 3D flexible nature of the e-powertrain model considered in this research, it was possible to better explain phenomena observed in experimental measurements, also reflected in the model predictions when the electromechanical coupling is considered for the analysis of aggressive NVH response.
The results have shown that the EM stiffness values for the same motor torque are very similar up to the corner speed of the motor. Beyond that, the EM stiffness depends on both the speed and torque of the rotor. The modal analysis results (multibody dynamics model) indicate that the consideration of the EM stiffness affects the linearised stiffness matrix of the e-powertrain (e.g. bearing stiffness) used in the eigenproblem in a similar manner as a variation in the system’s operating condition. Furthermore, the mode shapes and natural frequencies of the system are more sensitive to changes in the torsional linearised stiffness of the bearings around the direction of rotation of the motor.
Before the e-motor corner speed, the modal analysis considering the EM stiffness predicts a mode shape that combines shaft bending and deflection of the inverter cover, which is completely missing in the modal analysis without the EM stiffness. Experimental data show that e-motor whistling harmonics exhibit an amplified response and could be resonating with the predicted mode. Similar conclusions can be drawn for various operating speeds. In an analogous manner, when the EM stiffness is considered, harmonics related to gear whining show higher contribution at modes combining shaft bending and deflection of the flexible housing in contrast to observed shaft bending mode when the EM stiffness is not included in the analysis. Overall, for both e-motor whistling and transmission whining, the modal analysis that includes the EM stiffness reveals the activation of a variety of flexible housing modes (breathing, out-of-plane) that contribute in a proportional manner to the dynamics, which agrees better with the experimental data obtained from a real powertrain.
The effects due to considering the EM stiffness are generic and extend to different operating conditions (speed and torque) and frequency ranges considered in this study. The above observations show how the EM stiffness can introduce implications in the NVH response of an e-powertrain, since it can cause resonance at unexpected speeds, if not considered in the modal analysis, leading to amplification of e-motor whistling and gear whining. Further work in this topic could address experimental operational modal analysis of e-powertrains including the housing of the system.
Footnotes
Acknowledgements
Thanks are also due to AVL List GmbH and Arrival Ltd for their technical support and to the Loughborough University Lovelace High Performance Computing Service.
Declaration of conflicting interests
The author(s) declared no potential conflicts of interest with respect to the research, authorship, and/or publication of this article.
Funding
The author(s) disclosed receipt of the following financial support for the research, authorship, and/or publication of this article: The authors would like to express their gratitude to the Engineering and Physical Sciences Research Council (EPSRC) for the financial support extended to the ‘Automotive electric powertrain whistling and whining: fundamental root cause analysis to novel solutions’ [Grant No. EP/V053353/1].
Data availability
The datasets generated and/or analysed during the current study are not publicly available due to commercial confidentiality. Data are however available from the authors upon reasonable request and with permission of the industrial collaborators.