
Abstract
In this paper, an objective method for the conversion of post-crash vehicle deformation to crash energy is presented. While the crash severity assessment for standard crash test configurations is relatively robust, bias in real-world crash reconstruction is a well-known problem. A method to reduce the bias in crash severity reconstruction is constructed by focusing on post-crash deformation, the principle direction of force (PDOF), and vehicle type (VT) only. The analysis was restricted to 12 PDOF and six VT. A voxel model, onto which the depth information of the post-crash deformations was mapped, was constructed for every PDOF and VT. Standardized crash tests were used to normalize the deformation energy assigned to each voxel. The plastic deformation energy was computed by integrating this energy across all deformed voxels. This energy is expressed as the “energy equivalent speed” (EES). The method allows for a retrospective calculation of the EES from deformations. Thus, objective EES values can be computed for crash databases like CISS or GIDAS and even for legacy databases like NASSCDS. The results from the EES model will become part of the standard GIDAS database. The EES model was tested using a car-to-car crash test, a 40% offset frontal-frontal collision of an Audi Q7 against a Fiat 500.
Keywords
Introduction
Car crashes have been occurring ever since the introduction of the automobile. While at first, the reliability of the vehicles was the main focus point, interest shifted to focus on car crash-related mortality. While the focus on crash-related injuries and death is not contested, a marked deficiency in the objectivity of the real-world crash reconstruction and estimation of the involved energies was noted. Existing approaches often include a comparison with crash tests or estimations of other experts, see Unger. 1 In this paper, an objective approach to crash reconstruction solely based on static, post-crash deformation of the vehicle is presented.
For processing, the post-crash deformation depths are mapped to a voxel model closely representing the vehicle. One of the six internal vehicle shape models, spanning from super-micro to luxury sedan to SUV, is used for this process. Shape morphing was used to address minor differences between the vehicle under investigation and the shape model. The energy needed for the compression of each voxel has been assessed using real-world crashes and parameterized by crash test data at different speeds, impact angles, targets, and vehicle shapes. Finally, the dissipated crash energy is computed by summating the energies associated with the deformed voxels.
The crash deformation energy is reported in the form of the energy equivalent speed (EES), that is, the speed of a barrier crash test resulting in the same static deformation. 2 Note that the EES is independent of the crash opponent’s mass or velocity.
Materials and methods
The reconstruction of the involved energies in a real-world crash is often based on subjective estimations. Therefore, an objective measure of the collision energy, based on post-crash deformation and impact direction only, see Figure 1, was developed.
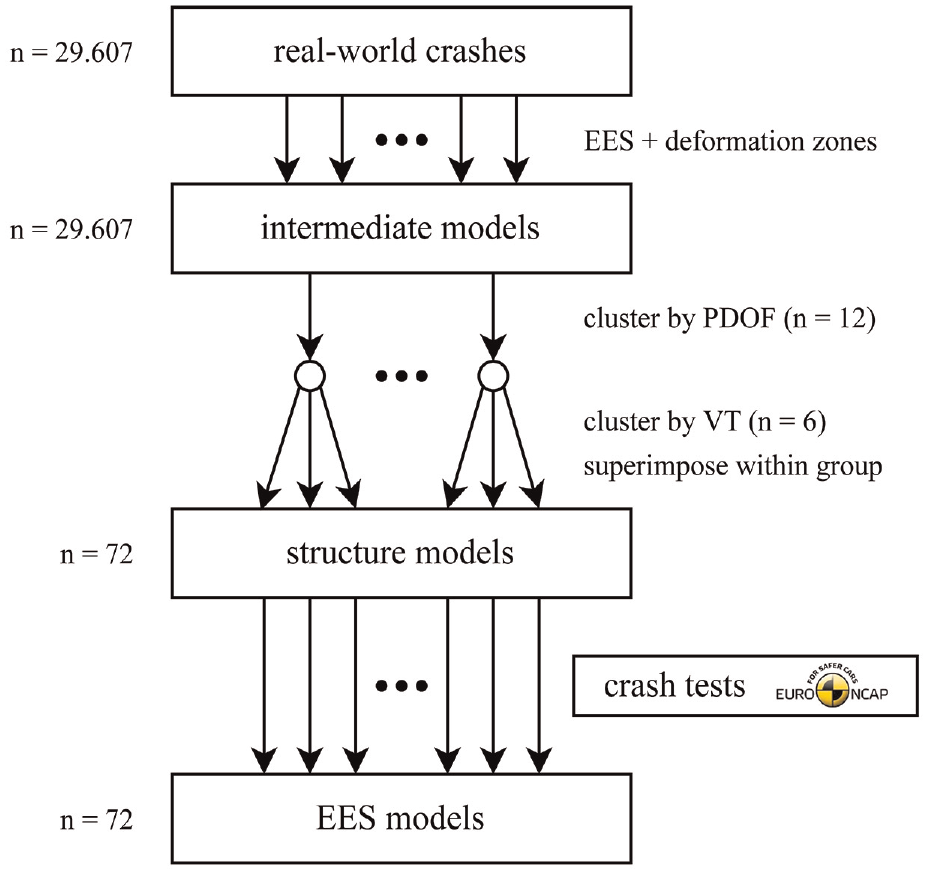
Diagrammatic representation of the developed method.
As a first step, the subjective estimates of the collision energy in a database of real-world crashes were correlated to the deformations for each car’s voxel model. Thus, each deformed car resulted in an intermediate EES model. Next, the intermediate EES models were grouped by principle direction of force (PDOF) and vehicle type (VT). The structure EES models were obtained in the next step by averaging the intermediate EES models within each PDOF–VT group. These structure models contain information on the stiffness of each voxel and, consequently, the stiffness of the structural parts of a vehicle. Finally, the structure EES models are scaled using crash tests from EuroNCAP to eliminate the influence of the subjective energy estimations of the intermediate EES models. These resulting models are called EES models and can be used to calculate an objective EES based on deformation.
Data sources
Real-world crash data (NASSCDS/GIDAS)
The presented method of deformation-based EES calculation uses real-world crashes taken from two crash databases: The “National Automotive Sampling System—Crashworthiness Data System” (NASSCDS) 3 and the “German in-depth Accident Survey” (GIDAS). 4
The crashed vehicles are stratified by principle direction of force (PDOF) 5 and vehicle type (VT). 6 Vehicle deformation information was extracted from real-world crash databases and converted into the format shown in Figure 2.7,8 Each vehicle side was partitioned into three vertical zones plus the sill. Furthermore, the front and rear were split into four horizontal zones, while the right and left sides were cut into five horizontal zones. This somewhat restricted number of deformation zones was previously shown to be adequate for model building and EES estimation from the built model. 8 Moreover, the small number of well-defined deformation zones eases data acquisition in the field, improving the reliability and validity of the measurements.
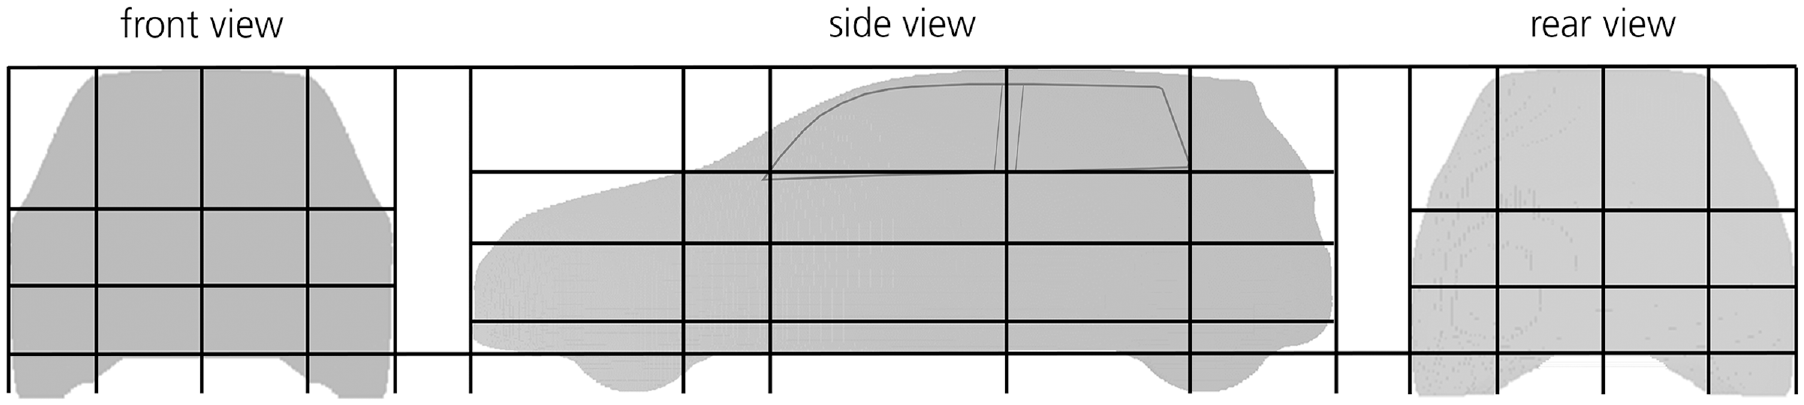
Deformation zone coding schema.
It was found that the six vehicle types (see Figure A4 for details) could account for most of the vehicles (95%) in the GIDAS database, but for sportscars and transporter vehicles, as they are all unibody constructions. Furthermore, it should be noted that the number of vehicle types
An energy equivalent measure is needed to match the documented deformations to the deformation energy. These energy equivalents only describe the energy required for plastic deformation, that is, not the elastic deformation during the crash. The plastic deformation energies are part of the in-depth crash databases as they are estimated during crash reconstruction. It is named “barrier equivalent speed” (BES) in NASSCDS, 3 while in GIDAS, it is called “energy equivalent speed”EES. 9
Crash test data (single-vehicle crash tests)
To normalize the deformation versus energy correlation obtained from the real-world crashes, we used crash test data from standardized crash tests undertaken at ADAC, Landsberg am Lech, and EuroNCAP 10 :
frontal, full width ridged barrier,
frontal, 40% overlap, offset deformable barrier (ODB),
frontal, 50% overlap, mobile progressive deformable barrier (MPDB) with 1400
side oblique pole, angle of 75° with the vehicle longitudinal centerline,
side, advanced European mobile deformable barrier (AE-MDB) with 1400
Longitudinal or lateral accelerometer data for the center of gravity (CG), measured EES values, and photo/video documentation was provided for all crash tests. Furthermore, the post-crash deformation was measured, following the Technical Bulletin TB 034 from Euro NCAP. 16 Like in the case of real-world crashes, the crash tests were grouped by principle direction of force (PDOF) and vehicle type (VT).
Model verification crash tests
A car-to-car crash test was used for overall model verification as our EES models are based solely on barrier tests, that is, single-vehicle crash tests. An Audi Q7, model year 2006, was crashed in the 40% offset configuration with a Fiat 500, model year 2007. Both vehicles had a collision speed of 56 km/h. The crash test was part of the ADAC’s compatibility tests. 17
Furthermore, standardized vehicle-to-barrier tests of the Audi Q7 and the Fiat 500 were needed to compute the EES values of the car-to-car crash. For this purpose, mobile progressive deformable barrier (MPDB13,18) crash tests were used to correlate energy and deformation for each vehicle and each MPDB. Thus, the vehicle acceleration curves and the energy intake of the deformable barrier could be compared.
Note that all crash tests used in the comparison were not used in the EES model generation, that is, neither the car-to-car crash test nor the MPDB crash tests.
Voxel model
A voxel model is a three-dimensional vehicle model built from volumetric pixels. The voxel models are based on 3D CAD models with protruding vehicle parts, for example, rearview mirrors and antennas, cleaned. The voxel size was set to an edge length of 1 cm. To put this into perspective, this results in a model size of about 10 million voxels for a Volkswagen Golf 5.
Shape morphing
The vehicle type (VT) is stratified by six, with each different voxel model representing a specific VT: super-compact, mini-compact, compact, sedan, station wagon, and SUV, to account for differences in vehicle size, vehicle mass, and front-end stiffness.
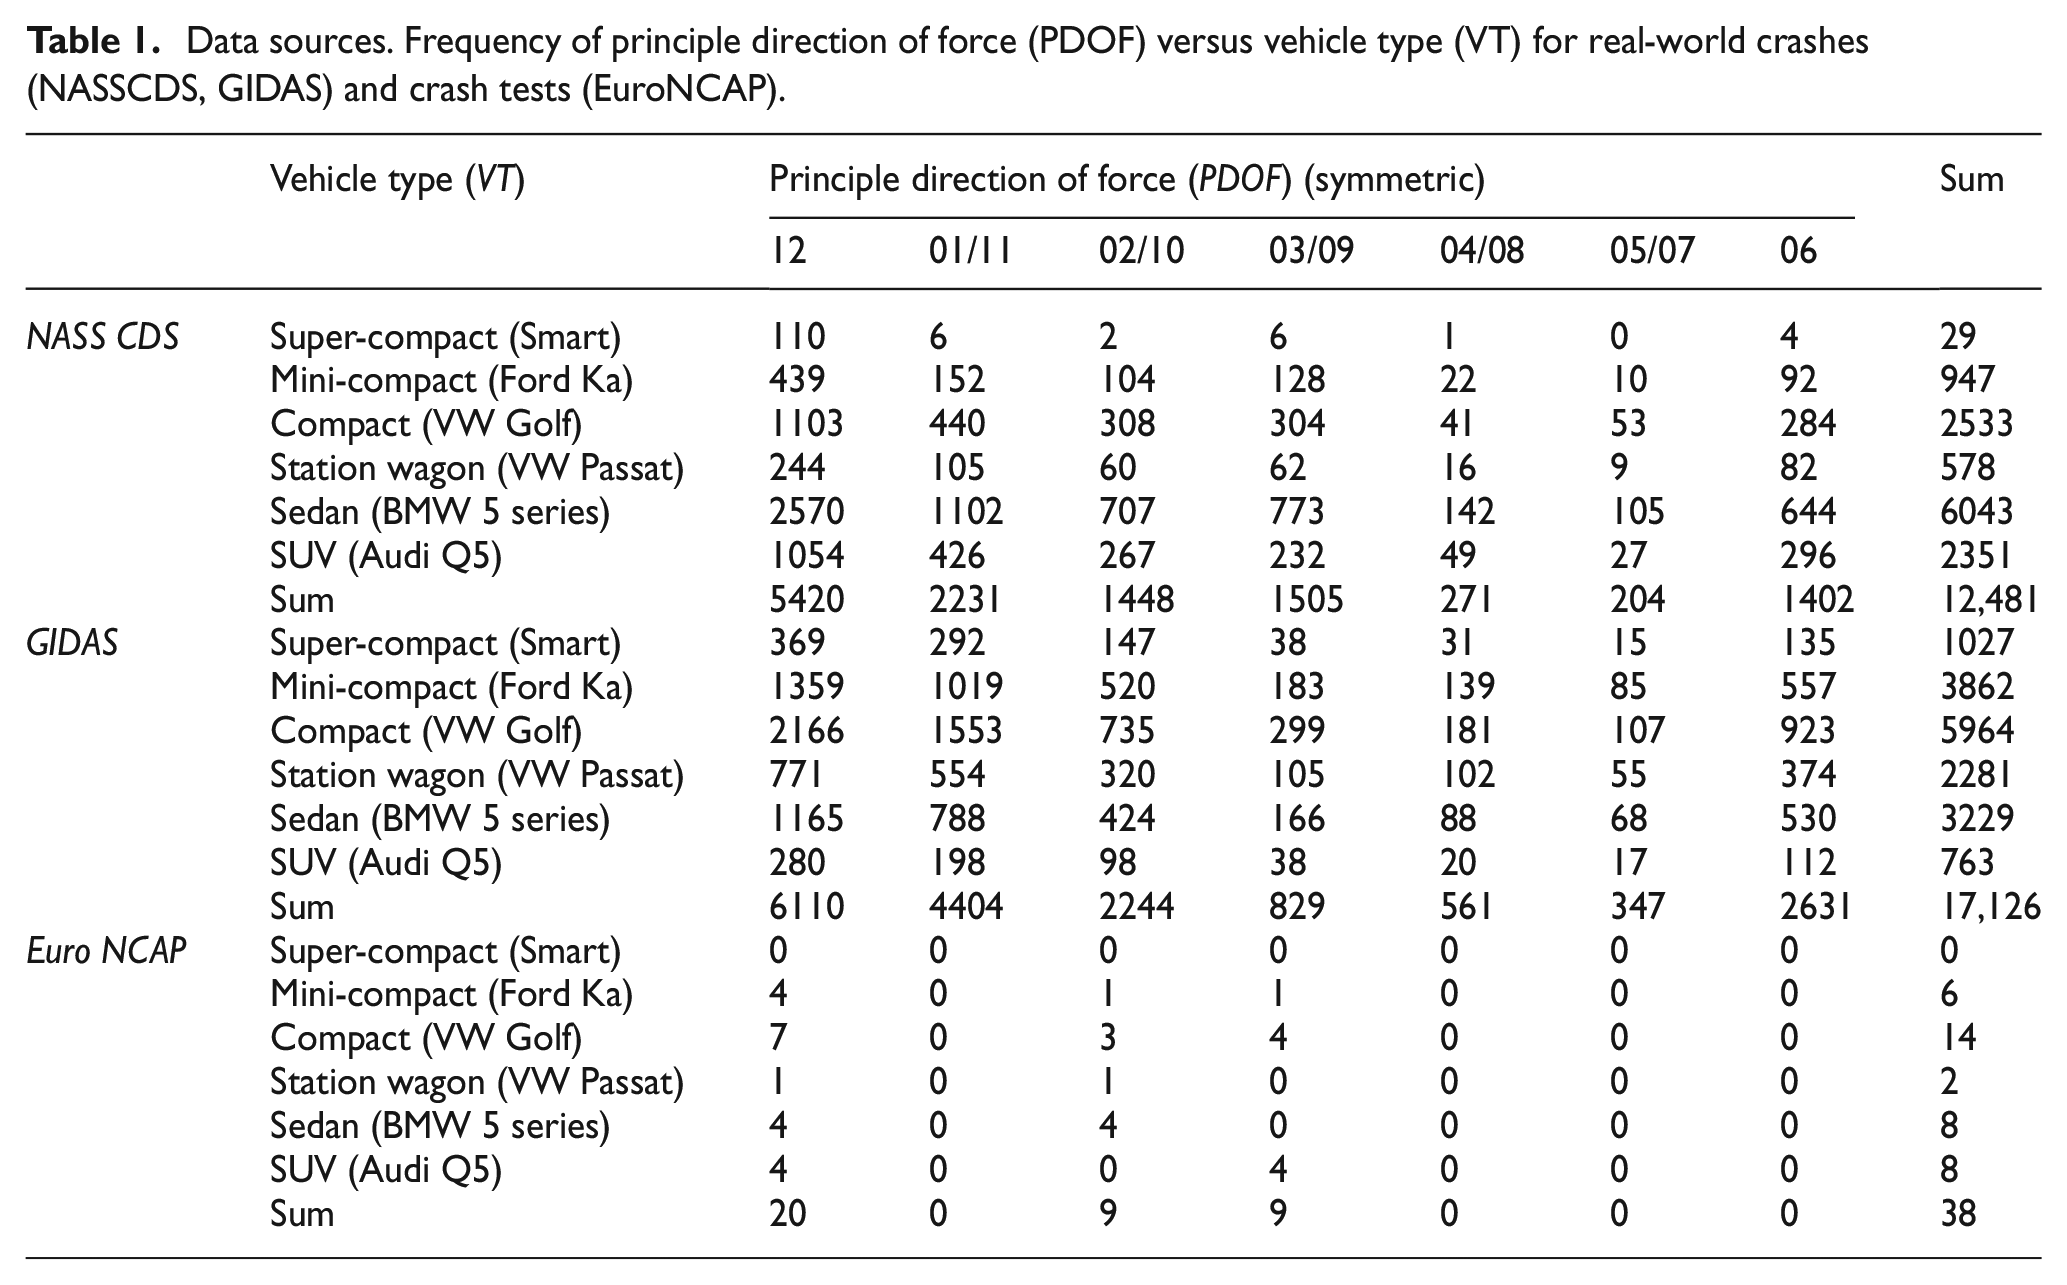
The frequencies of VT stratified by principle direction of force (PDOF) are given in Table 1.
Data sources. Frequency of principle direction of force (PDOF) versus vehicle type (VT) for real-world crashes (NASSCDS, GIDAS) and crash tests (EuroNCAP).
Deformation mapping
The plastic deformations coded in the real-world crash databases are mapped onto the voxel models by transferring the deformation depth of each deformation zone (see Figure 2) onto the model. For mapping, the deformations zones to the voxel model, the borders between the deformation zones are scaled to the voxel model. Distinct vehicle regions were used for the mapping, for example, a-pillar, b-pillar, and wheel-well.
The neighboring deformation depths are bilinearly interpolated to smooth the transition between deformation zones. In the next step, all the deformed voxels are marked as such, and deformation frequency voxel models can be constructed.
Energy mapping
In addition to deformation information, the real-world crash databases NASSCDS and GIDAS contain energy equivalent descriptors for each crashed vehicle. We use these energy equivalents to compute the plastic deformation energy of a collision. The plastic deformation energy is causal for the post-crash deformation (see Goldsmith, 19 pp.4 and 154). Thus, the sum of all the plastic deformation energies of deformed voxels equals the total plastic deformation energy of the collision, which is equivalent to stating that the plastic deformation energy of the crash can be distributed onto all deformed voxels.7,8
A linear impact force is assumed over the deformation depth in the principle direction of force (PDOF). In that case, the resultant plastic collision energy has a quadratic distribution in PDOF (see e.g. Morgan,
20
section 11.1). The plastic collision energy associated with each deformed voxel is converted into Joule. While the relative uncertainty in the EES value is estimated to be
To eliminate the influence of the vehicle mass
In constructing this model – which will be called the “intermediate EES model”– only a single real-world crash was used. The sum of the EES values of all deformed voxels will result in the EES of the collision. Please note that the intermediate EES model’s utility is limited, and the values of the model are not objective, that is, not independent of the person doing the crash reconstruction.
Structure EES model
There is one intermediate EES model for each deformed vehicle. First, the intermediate EES models were stratified along the principle direction of force (PDOF) and vehicle type (VT). Then, within each sub-group, the intermediate EES models were aggregated by averaging to form the “structure EES model,”7,8 that is, one structure EES model for each PDOF and each VT.
The intermediate model aggregation assumes a mirror symmetry along the longitudinal axis to ease sample size constraints. Furthermore, the uncertainties specified in the intermediate EES models for each voxel were averaged across the intermediate EES models of equal PDOF and VT in the aggregation process to give the uncertainty for each voxel in the structure EES model.
By summing up the EES values associated with the deformed voxels, the structure model allows for calculating the EES values and the associated uncertainties of a single collision or a whole vehicle. The uncertainty is computed by summing up each deformed voxel’s upper bound of the deformation energy. This energy can be converted to an upper bound of the EES value.
Even though the intermediate models are stratified by PDOF and VT for structure model generation, their number is still large enough to imprint fundamental vehicle structures, for example, longitudinal members, cross beam, sill, and firewall, on the structure model.
Note that the structure EES model is solely based on real-world crash data.
Normalizing the structure EES model using crash tests
The structure model needs to be normalized to correct the bias introduced during crash reconstruction, that is, its non-objectivity.
21
This bias was primarily introduced into the intermediate EES models but can propagate into the structure EES models. Crash tests with their precisely known deformations and EES values were used as the basis for the normalization process. The crash tests’ deformation depth and corresponding measured crash energy
The structure model adjusted by the crash test-derived correction factors is called the “EES model.” Thus, there is one EES model for every principle direction of force (PDOF) and every vehicle type (VT).
Due to limitations in the number and variability of the standardized crash tests available, the correction factors were not stratified for VT when using the crash tests to scale the structural EES models. Furthermore, as rear-end crashes are not part of the EuroNCAP test portfolio, the correction for all missing PDOF is done via pre-computed ratios. The number of currently available crash tests is relatively low but will steadily increase with new test results being provided by EuroNCAP as they become available. Their information will be incorporated into the model-building process.
The source and the current number of data points for each EES model are given in Table 1.
Comparison of the results from EES models with a car-to-car crash test
A car-to-car crash test (see section “Model verification crash tests”) is used to compare the measured EES values
Theory
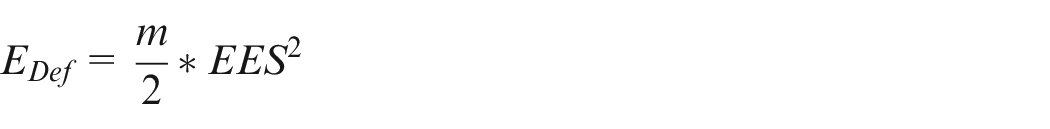
The plastic deformation energy
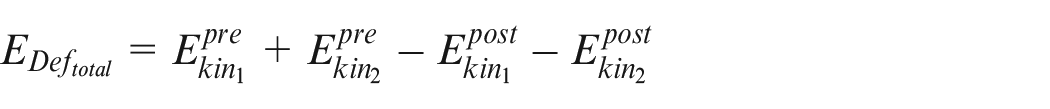
The information from a car-to-car crash test is only suitable for the deformation energy of both cars together, that is, the information on the split of energy between the vehicles is missing. Therefore, two car-to-barrier tests, in our case two MPDB-tests, are used to determine the individual vehicles’ deformation energy as the barriers’ deformation energy is known.

Thus, the MPDB crash tests provide the ratio between the deformation energy of the vehicle and the deformation energy of the barrier.
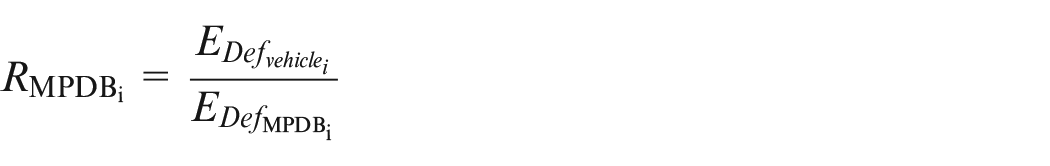
Relating these ratios for the two vehicles to each other, we obtain the split of deformation energies between the vehicles in the car-to-car crash. Note that the vehicles have to have a similar design philosophy, that is, in this case, unibody construction, and similar design criteria for acceptable injury severity levels as forced onto manufacturers by legal requirements UN-ECE, 22 USNCAP, 23 and EuroNCAP.11–15
This ratio
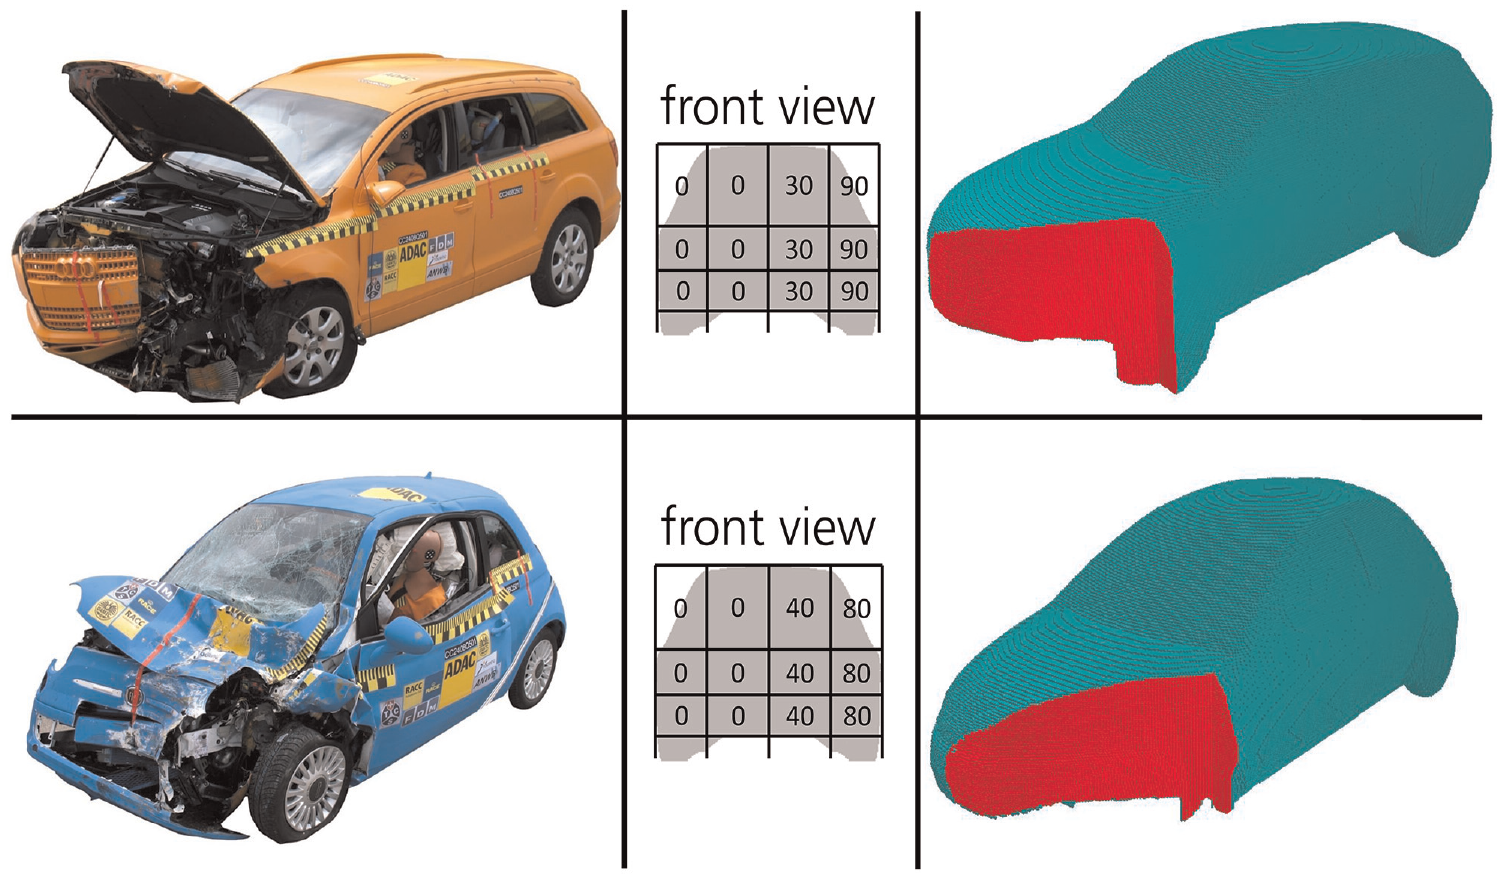
The deformation depths of the crash-tested vehicles were estimated using the standard post-crash photo documentation. Measurements complemented visual deformation inspection of the most striking vehicle structures on the photogrammetrically reconstructed 3D models. The deformation depths were transferred to vehicle-specific EES models by measuring the deformation depths according to the grid shown in Figure 2 and transferring the deformation grid to a VT-specific voxel model while using bilinear smoothing between the deformation grid points. The result is shown in Figure 3.
Audi Q7 versus Fiat 500, 50% overlap car-to-car crash test.
Crash test specifics
Both vehicles (Audi Q7, and Fiat 500) were damaged in the front only, see Figure 3. The frontal deformation depths showed no vertical variation. The measured deformation depths for the relevant frontal deformations are documented in the middle column of Figure 3. The right column shows the respective voxel models with the cut-out smoothed deformations.
The Audi Q7 was assigned the vehicle type (VT) SUV, which for EES model computation is the shell of an Audi Q5, while the Fiat 500 is classified as a mini-compact vehicle and morphed into a Ford Ka for the EES model. Using the respective EES models and the projected post-crash deformation, the
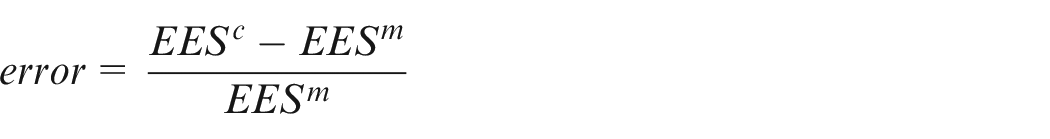
The error between the model-based EES value and the EES value measured in the car-to-car crash test is defined as:
Post-crash deformations Audi Q7 (upper row) and Fiat 500 (lower row), as photographs (left side), extracted deformation zones (mid) and projection to the EES models for the vehicle types SUV and mini-compact (right side), respectively.
Application to crash databases
One application of the EES models is the retrospective calculation of the EES values in crash databases like NASSCDS or GIDAS.
A proof of concept is provided for GIDAS: The database contains 14,004 crashed vehicles with deformation measurements for crash years 2000–2018. A model-based EES value – called
Results
The model-based approach was used to calculate the EES values in crash databases to check for any bias in the EES values from the crash reconstruction. Focusing on the GIDAS database, the EES values were overestimated for frontal and rear-end crashes, while EES values for side collisions were underestimated.
Furthermore, The EES model was used to estimate the EES values in a car-to-car crash test based on deformation depth, principle direction of force (PDOF), and vehicle type (VT) only. The error of the model-based EES values were 2.5% and 6.5% compared to those measured during the crash test.
Comparison to crash test
The primary purpose of this comparison is to show the objective nature of the derived EES model. Therefore, the EES values measured from a car-to-car crash test
The different energies of the two MPDB crash tests and the car-to-car crash test are shown in Table 2.
Comparison with car-to-car crash test results.
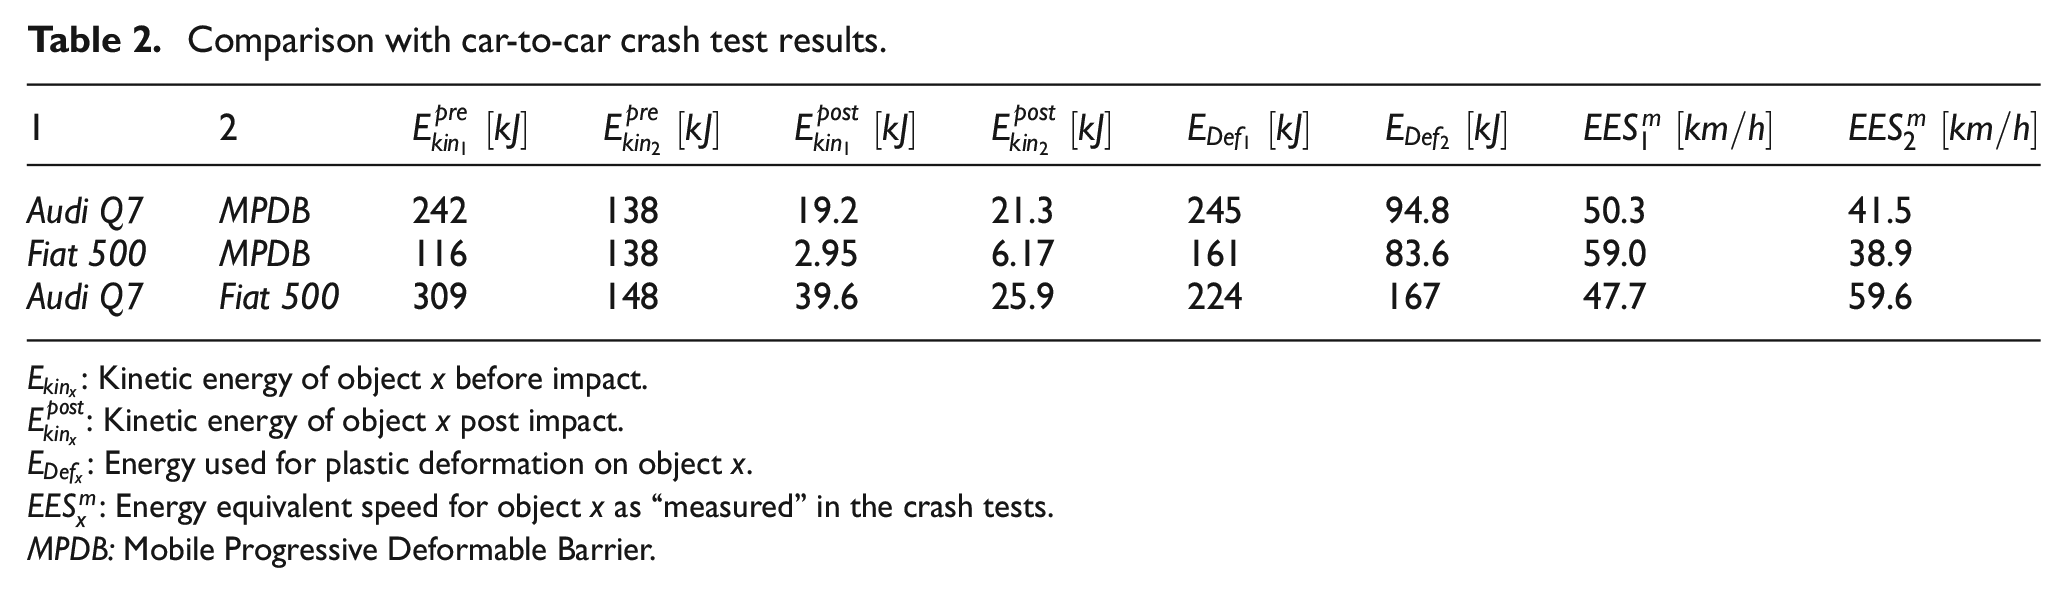
MPDB: Mobile Progressive Deformable Barrier.
For the Audi Q7 the results are:
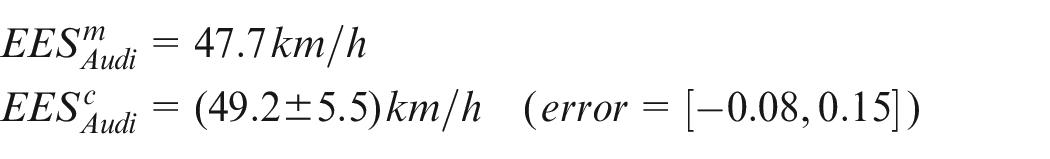
and for the Fiat 500:
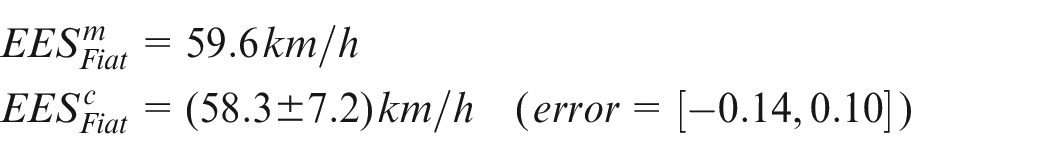
The deviation between the crash test-derived EES values and our model-based EES values is 2.5% for the Audi Q7 and 6.5% for the Fiat 500.
Application to GIDAS
The error between the EES given by GIDAS and our model-based EES values are summarized in the boxplots in Figure 4. An overview of the absolute differences and a stratification of relative and absolute boxplots by vehicle type can be found in the appendix (Figures A1–A3, respectively). The whiskers mark the 2.5 and 97.5 percentiles.
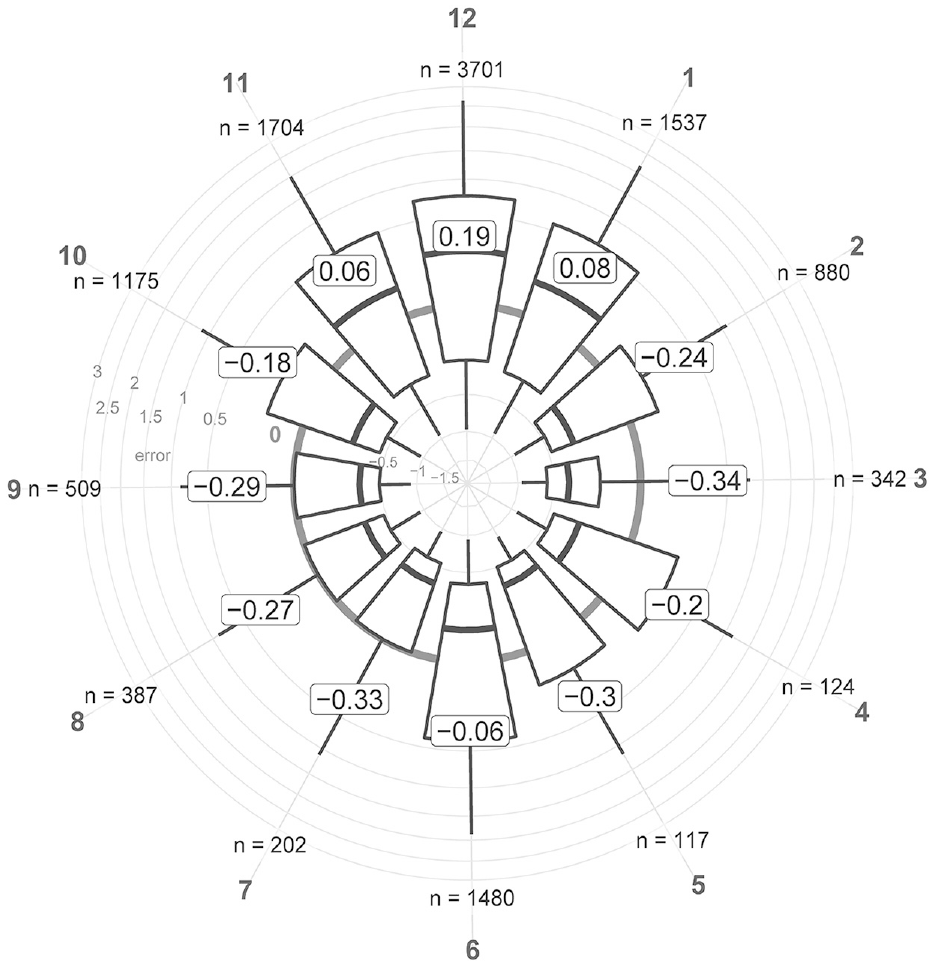
Box-plot visualization of the error (computed = GIDAS, measured = EES model) by PDOF in (km/h). Box-plot whiskers represent 2.5 and 97.5 percentiles, median values are given within the box.
When looking at the mean EES, the deformations at the front of the vehicle are overestimated. In contrast, the car’s side and rear deformations are underestimated.
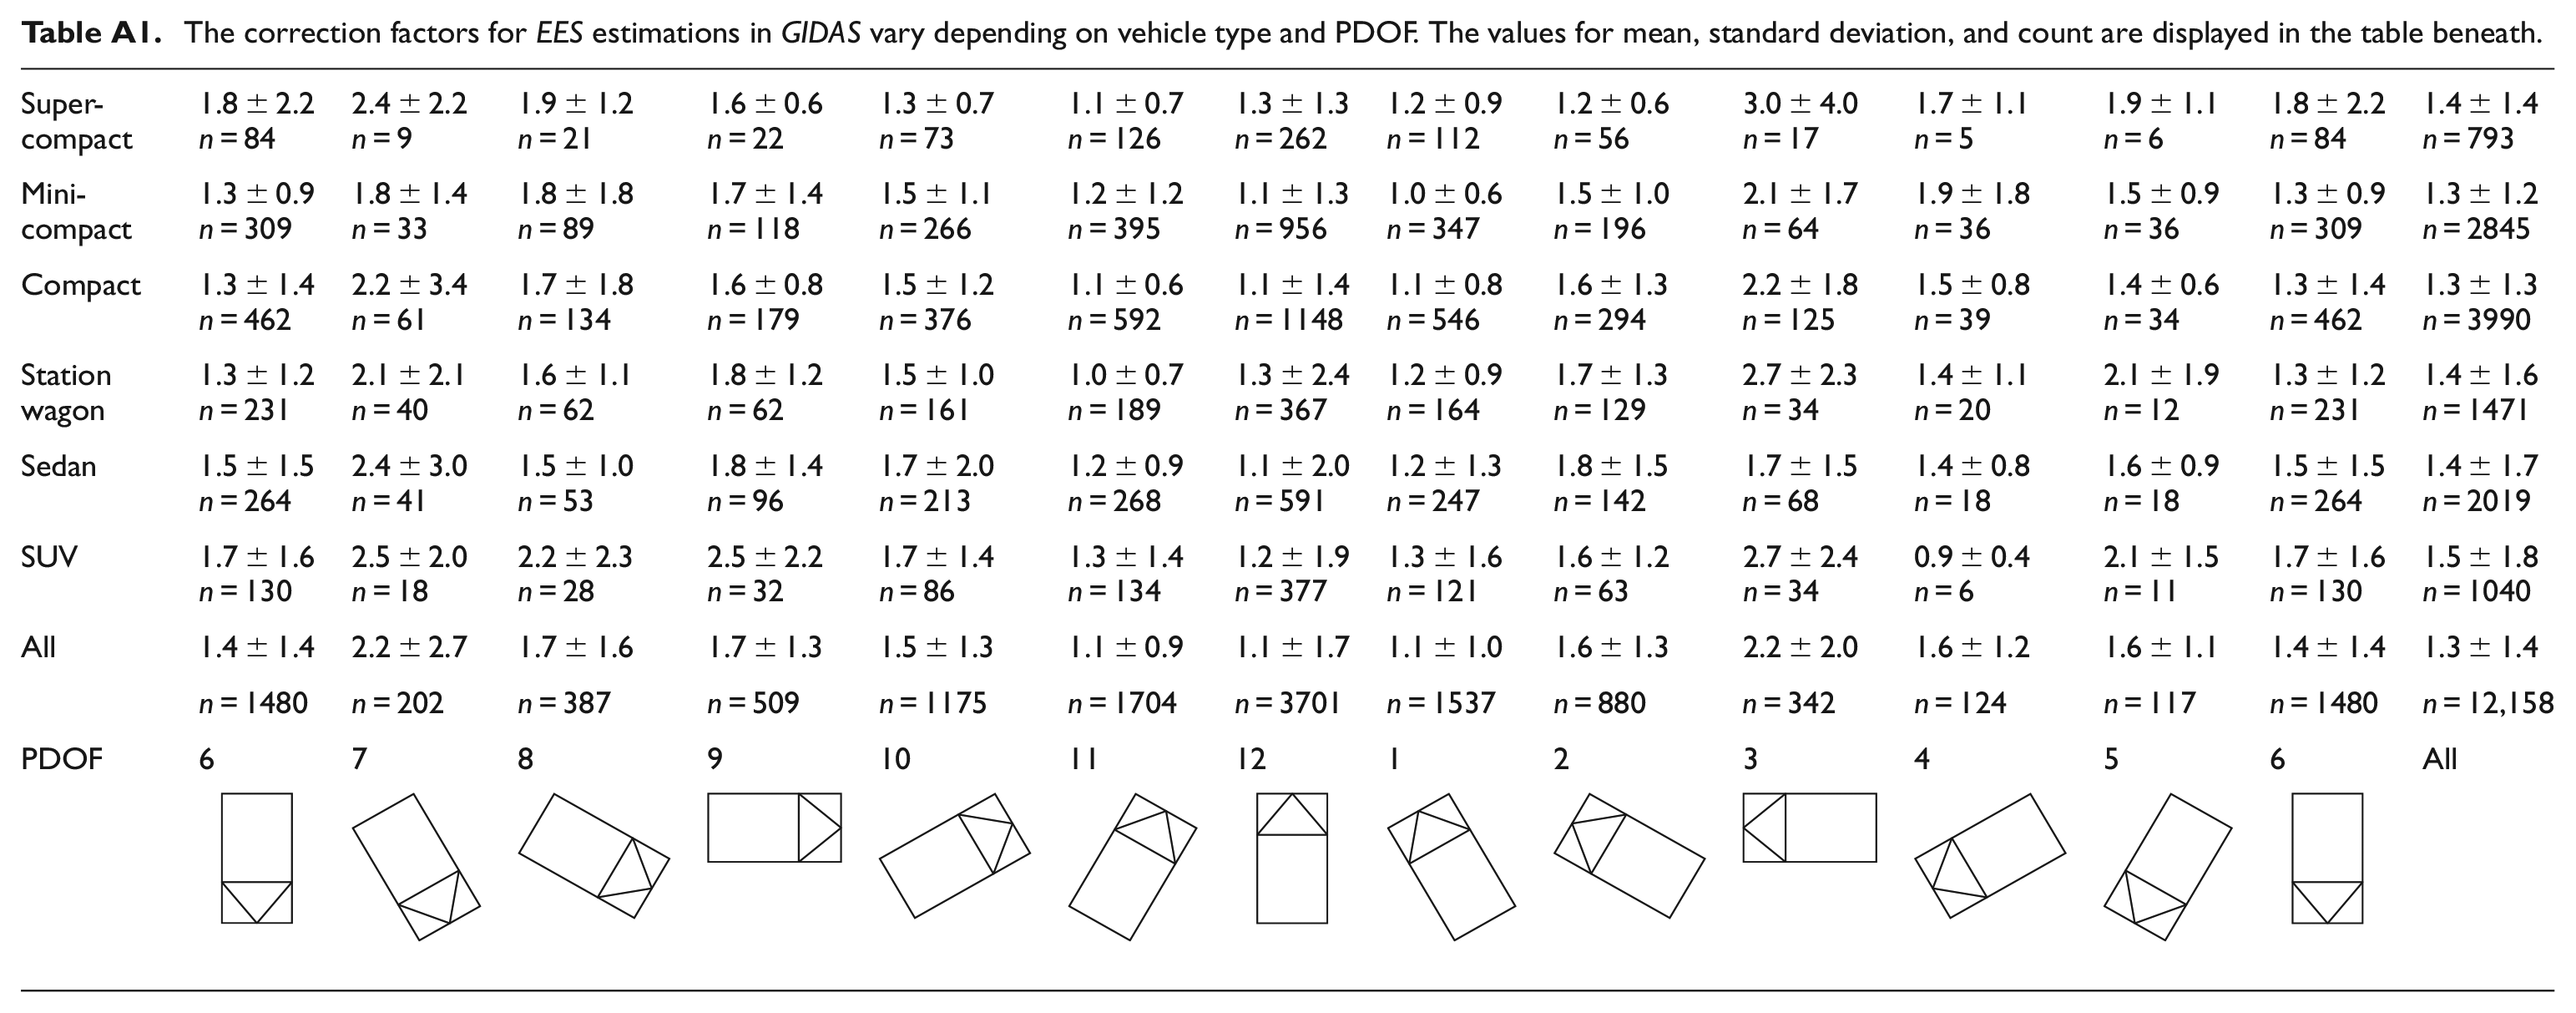
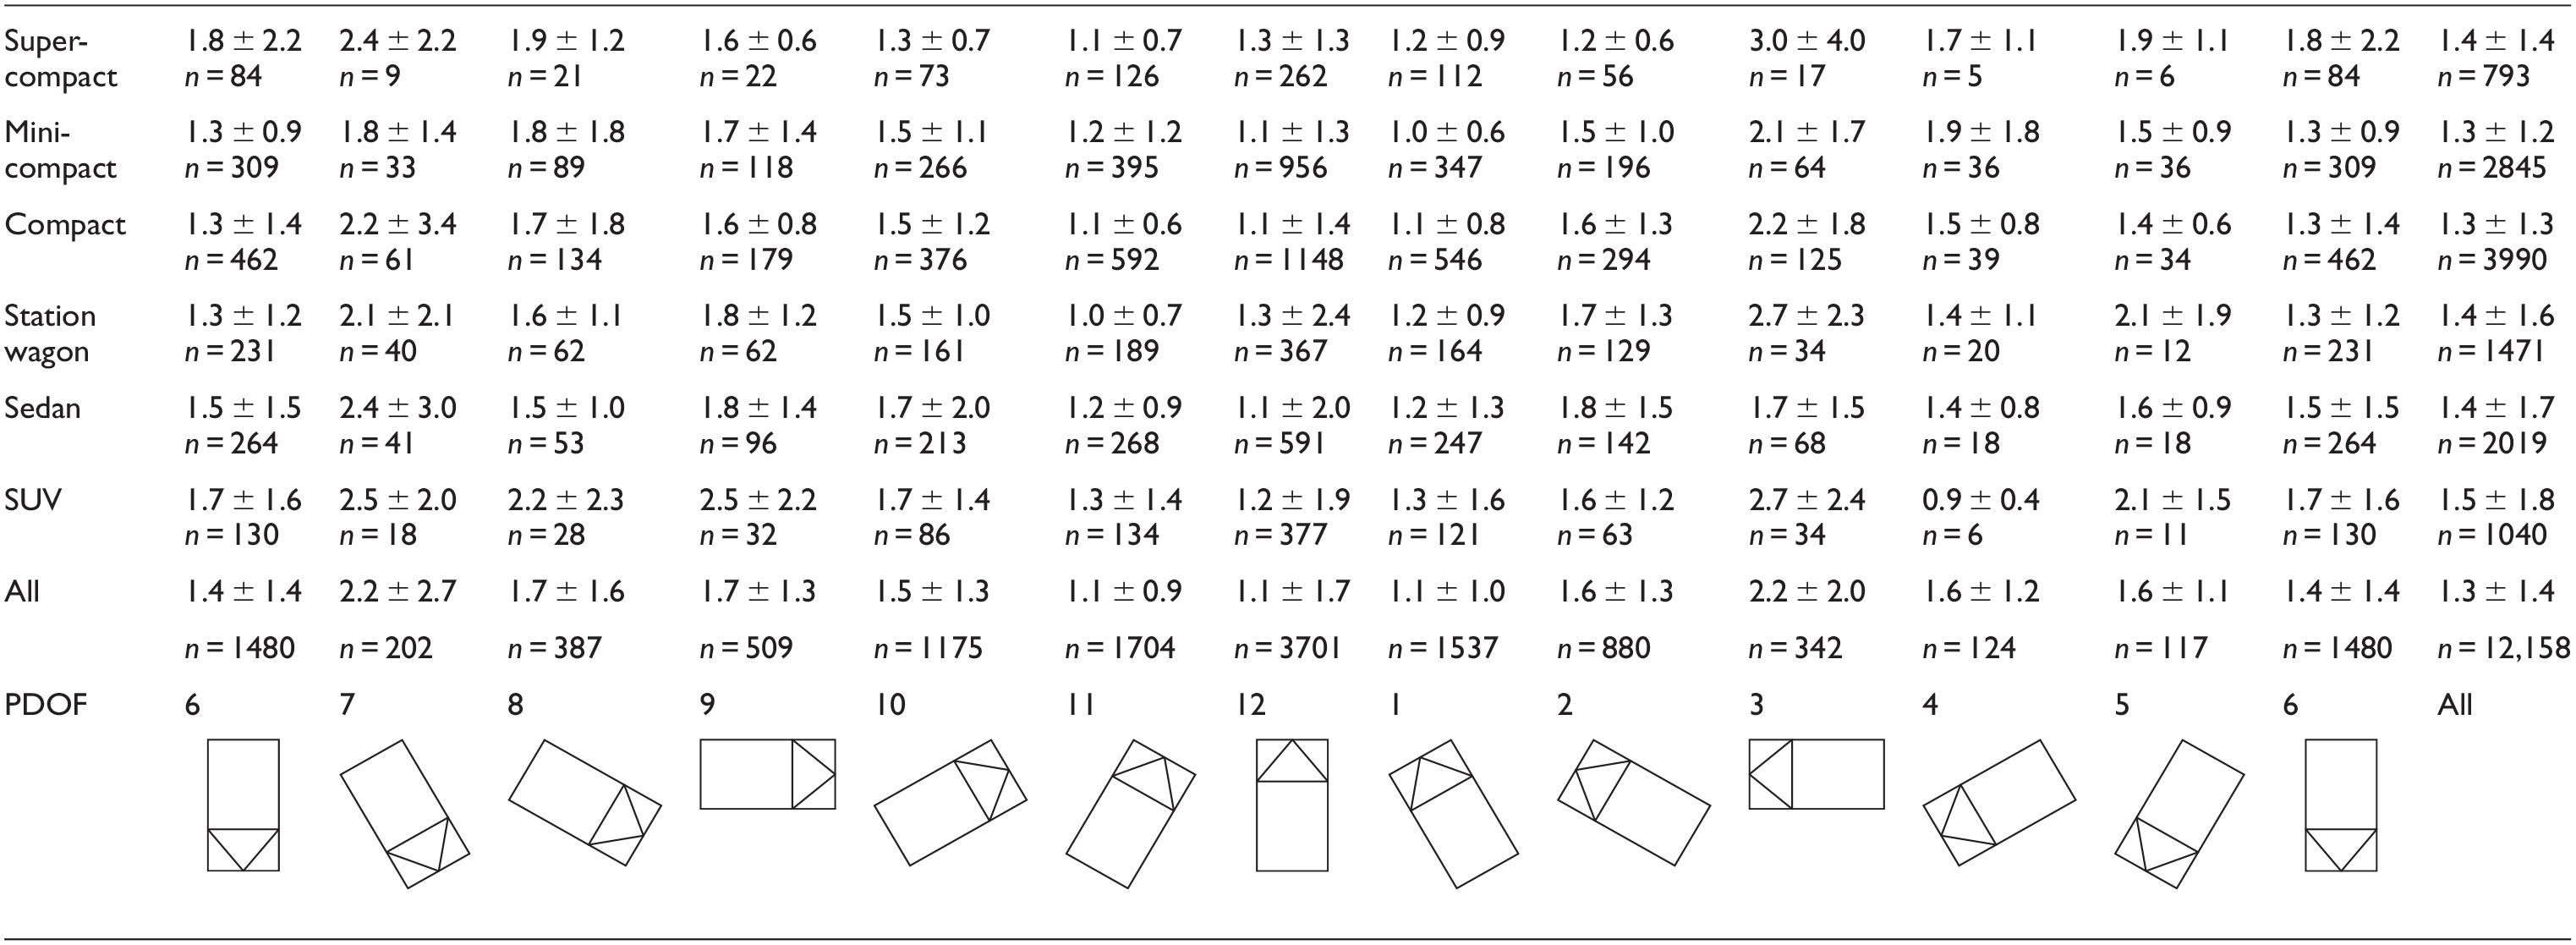
The calculated EES correction factors and their standard deviations to assess the reconstructor bias retrospectively are shown in Table A1.
Discussion
Comparison with car-to-car crash test data
While Erbsmehl 8 already validated the creation of the structure EES models, a comparison data set to validate the developed objective EES models is missing. Therefore, a high-speed, car-to-car 40% offset crash test of vehicles with different masses and vehicle types was used to compare the model results.
Due to the differences in mass and structural stiffness of both vehicles, a car-barrier crash test, in our case, an MPDB crash test,13,18 was needed to allocate the correct deformation energy to each vehicle. Furthermore, geometric compatibility was assumed between the cars, meaning that the interface between the vehicles in the crash is infinitesimally thin, that is, both vehicles support each other during the crash interaction.24,25 Therefore, the ratios of energy uptake in the MPDB crash test between car and barrier can be applied to the car-to-car crash test. Thus, it became possible to calculate the EES values for the car-to-car crash test retrospectively.
The post-crash deformation depth was determined using the photographic documentation of the crash test. The discretization of these deformation zone codings (see Figure 2) and projection of the smoothed results onto the respective voxel model enabled the EES calculation for each vehicle. Despite very different crash opponents, that is, vehicle types and vehicle masses, the EES model was capable of computing non-biased EES values based on deformation information only.
Comparison with literature
Görtz 26 compiled a list of all post-crash EES estimation methods as part of his thesis. He identified several subjective biases in his evaluation and called for an objective EES calculation. His approach to bias reduction was the combination of the known methods of EES estimation by using their mean, even though it is well known that taking the mean does not lead to a bias reduction.
The CRASH3 methodology used for crash severity computation, that is, determining the EES values and the absolute value of the change of velocity in the crash
The presented approach addresses these problems by stratifying the EES model using the principle direction of force (PDOF) and vehicle type (VT). Furthermore, the focus is on post-NCAP vehicles, and the structural EES model is mass-free. Finally, the method uses deformation depth as an input that correlates with collision speed, that is, from a given PDOF, crashes with higher collision speeds deform additional voxels compared to low-speed crashes. Thus, the stiffness of the EES model is adapted to crash severity.
The EES computation method presented in this paper uses objectively measurable input variables. The need for a specific vehicle model is circumvented by using the six vehicle types and aggregating the real-world crash deformation into the structural EES models normalized to crash test deformations. Thus, all the observed crash deformations were used to set up the EES models for each vehicle type. Therefore, the EES model output is only the crash severity measure independent of the crash reconstruction process, besides the deformation information itself.
Application to real-world crash databases
The EES models presented in this paper can be used to recompute the EES values in crash databases. Since our proof of concept implementation using the GIDAS crash database, the deformation-derived EES values are set to become an integral part of the database.
The measurements of the deformation depth in crash databases are very reliable, as shown by Otte et al. 4 for GIDAS and Sharma et al. 31 for NASSCDS. Thus, the deformation depth can be seen as an objective measure of the crash severity, that is, a measurement independent of the investigator.
During the EES re-computation effort of GIDAS, we encountered some bias: An overestimation of the EES for front and rear-end collisions and an underestimation for side collisions. However, it should be noted that the medians of the absolute EES values in GIDAS exhibit nearly no bias – when stratified by PDOF– as shown in Figure A1. At the same time, the relative differences do (Figure 4). The biases can be attributed to the usage of an outdated and, thus, non-appropriate stiffness model for crash reconstruction. The re-computation of the EES-based crash severity by using deformation depths can make collision severity estimates bias-free and more objective in real-world crash databases without redoing the full crash reconstruction.
Limitations
Currently, the EES model is stratified by six different vehicle types. These vehicle types covered 93% of all newly registered vehicles in Europe in 2019. 32 The missing 7% comprises VT of vans, pick-ups, full-size SUVs, and sports cars. If an EES model is needed for one of these vehicle types, the structurally most similar vehicle model of the six should be used, necessitating an extra thorough review of the results. The stratification of the structure EES model by the 12 PDOF and six VT is imposed by sample size restrictions of the real-world crash databases (see Table 1). A more refined PDOF segmentation or a separation into micro directions on a time scale seems possible only for the most frequent vehicle types. Furthermore, PDOF could be replaced by crash configuration along the lines of Brumbelow. 33 This approach would rely more on crash reconstruction than our deformation-only approach and, thus, a more objective method.
The normalization process could benefit from further crash tests, primarily non-standard ones. The goal is multiple crash tests for each principle direction of force and vehicle type combination. These additional tests would benefit the stratification for the vehicle type in particular.
Furthermore, special treatment of multi-impact deformations, primarily if they affect the same body panel, could fine-tune the EES model and increase its precision.
Outlook
The presented EES models allow for unbiased estimation of the EES values of a crash without the need for user-supplied stiffness information. The developed EES models can be used to retrospectively provide objective EES values, that is, unbiased crash energy information, to real-world crash databases. These deformation-based EES values can address any subjectiveness of the crash reconstructions, especially for rare crash configurations or high crash energies. Furthermore, expert witnesses could use the EES models to validate their crash reconstruction. A specialist platform is currently under construction.
Footnotes
Appendices
The correction factors for EES estimations in GIDAS vary depending on vehicle type and PDOF. The values for mean, standard deviation, and count are displayed in the table beneath.
|
Acknowledgements
ADAC Stiftung, EuroNCAP, Forschungsvereinigung Automobiltechnik (FAT) e.V., Porsche AG.
Declaration of conflicting interests
The author(s) declared no potential conflicts of interest with respect to the research, authorship, and/or publication of this article.
Funding
The author(s) disclosed receipt of the following financial support for the research, authorship, and/or publication of this article: The Fraunhofer IVI received financial support for parts of the research and the publication of this article from ADAC Stiftung. Furthermore, the Forschungsvereinigung Automobiltechnik (FAT e.V. and the Porsche AG supported this work by funding research projects.