
Abstract
Natural frequencies of powertrain mount brackets have great influences on NVH (Noise, Vibration, Harshness) performances of a Powertrain Mount System. Usually, large relative error between the measured- and the estimated natural frequencies using finite element analysis existed. In this paper, a methodology to refine the mount bracket finite element model is proposed based on global response surface method and optimization methods. The material parameters uncertainty and the constraint boundary (bolt joint) are taken into account for model update parameters, since they are the main factors affecting the accuracy of the calculated natural frequencies of bracket. The material parameters are optimized by minimizing the errors between calculated and measured un-constrained natural frequencies of the mount bracket. The bolt joint are modeled using the equivalent stiffness of spring element that are optimized by minimizing the deviations between the calculated and measured constrained natural frequencies of the bracket. Another mount bracket is used to obtain natural frequencies calculated using the refined finite element model and measured, and the comparisons of the calculated versus the measured natural frequencies shown that the refined finite element model of mount bracket with identified material parameters and boundary stiffness values exhibits high prediction precision for estimating natural frequencies of the brackets. This indicates that the proposed finite element model refinement methodology for mount bracket is effective and can help the NVH engineers to design larger natural frequencies of mount brackets.
Keywords
Introduction
With requirement enhancement of customers on comprehensive performance of passenger cars, higher demands are put forward to NVH performance. The vibration and noise from powertrain are key contributions to vehicle NVH behavior, besides wind noise and road excitations. Generally, powertrain mount systems connecting powertrain to vehicle body or subframe are utilized to control/isolate the vibration and noise transmitted to vehicle body, in addition to support the powertrain and control displacement of the powertrain center of gravity under various quasi-static loads. A mount system with satisfactory dynamic characteristics can effectively improve the NVH performance.1–5
As shown in Figure 1, a powertrain mount system consists of powertrain side mount bracket, rubber vibration isolator, and body side mount bracket connected in series. Since the rubber isolator and brackets are arranged in series, if the stiffness of the bracket is very large, then the stiffness of the rubber isolator and brackets is approximately the stiffness of the rubber isolator. 6 Once the stiffness of the bracket is insufficient, the mount system will not only deteriorate the vibration isolation effect, but also cause local resonance of brackets. In other words, the vibration isolation of a mount depends on the stiffness and damping of the rubber isolators and the natural frequencies of mount brackets (bracket stiffness and mass). 7 Therefore, in the design stages, the natural frequencies of the mount bracket are required to above a given value, and FEM (finite element method) is used to estimate the natural frequencies.
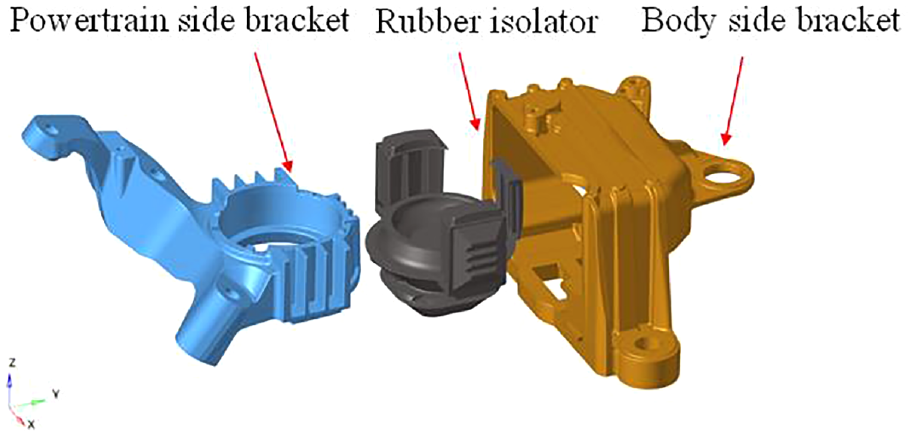
Structure diagram of a mount.
However, there are always errors between the finite element simulation and the measured natural frequencies due to ideal input parameters and simplifications used in calculation. Therefore, a refined F.E. model of mount brackets is of great necessity to guarantee the dynamic characteristic requirements and further improve the vehicle NVH performance.
At present, lots of research works related to mount bracket have been published.8–17 It has been proved that FEA of the bracket is an effective method to study and improve the performance of brackets. Baba H et al. 8 study the vibration modes of mount bracket using FEM and reduce low frequency brake squeal. Rohilla et al. 9 propose a new design of the Front End Accessory Drive (FEAD) mounting bracket for bus application based on FEA data. The design is also optimized to attain maximum possible weight reduction advantage using FEM. The resulting design is validated physically and good correlations are achieved. Celik et al. 10 present a strength-based design analysis protocol using FEA for a damaged engine mounting bracket. The FEA results successfully capture the failure area of the bracket. The redesigned bracket can meet the safety requirement. However, the exact fracture plot is not represented in the paper, since the static and linear solving approach with linear elastic material model used in the FEA. Carpenter et al. 11 investigate the effect of various loads on Transmission Control Module (TCM) mount brackets. It is found that mean stress can increase or decrease the vibration fatigue life of TCM bracket depending on its nature. Mekalke G 12 studies an engine mount bracket for an India Supra car aiming to mitigate the vibration. Static and modal analysis of the bracket is conducted, and the frequency and loading response of the brackets are checked using FEA. He et al. 13 present a multi-objective structure optimization method for an end effector mounting bracket. The F.E. model of the bracket is established and verified with modal test. However, the constrained conditions are not considered.
Majority of the works focus on the structure optimization thus to meet the requirements of lightweight, structure strength or NVH performance. Some typical works are presented in literature.14–17 Guo R et al. 14 study the structure-borne noise by means of transfer path analysis based on powertrain source–path–receiver model. It is found that the main contribution path is the right mount. Thus the right mount bracket is redesigned to reduce the sound pressure level using FEM combined with experimental transfer path analysis. Zhu et al. 15 and Zhang et al. 16 comprehensively consider the static and dynamic performance of the mount bracket, and carry out topology optimization for the mount bracket on the premise of meeting the performance of the bracket, finally achieve the purpose of structural lightweight. The strength test and durability test are conducted and the test results show that the bracket designs satisfy the strength requirement and durability index, but the dynamic performance of the bracket is not validated. Whereas, the F.E. models of the brackets are not verified and the estimated result is not validated. Pan et al. 17 conduct shape optimization for mount bracket taking die direction and other casting process parameters into account. The optimized bracket can meet the lightweight requirement and improve the structural rigidity and strength significantly.
The performance analysis and optimization of mount brackets using FEM have been studied extensively and the dominant issue determining the validity of analysis and optimization results is the accuracy of F.E. model. In general, model parameters and simplification operations, especially the boundary (bolt joint) simplification in F.E. model, are the main causes of the deviation between the estimated results and real behaviors of the bracket.
Mechanical face contacts are widely used inside a component or connected with different components. The contact part is modeled using contact stiffness and damping. 18 The contact stiffness and damping are difficult to be estimated accurately. In the F.E. model of brackets for estimating natural frequencies, the assumption that the contact stiffness is assumed to be infinite will cause the estimated natural frequencies and modal shapes have large relative errors compared with experiment results. 19
Many efforts have been made to dynamic characterization of mechanical face contacts. Generally, the research methods can be categorized into two types: direct methods and indirect methods.
For direct methods, dynamic characteristics of mechanical face contacts are studied using mathematical models developed from microscopic perspective. Fu et al. 20 establish a theoretical model of the joint surfaces and investigate the stiffness and damping characteristics qualitatively. The results show that the mount of influence of the static pre-load and exciting frequency on the stiffness and damping coefficient of the joint surfaces depends on the joint condition. Wen et al.21,22 establish fractal models of normal and tangential contact stiffness of bonding surfaces based on microscopic contact fractal theory. The simulation results showed that both normal and tangential contact stiffness of bond surfaces increased with the increase of the normal load applied to bond surfaces. Wang et al. 23 develop an average contact stiffness model of a vibration cycle within each deformation stage based on microscopic contact mechanics.
Since direct methods have disadvantages of measurement cost and complex calculation, indirect methods attract more and more attention now. For specific mechanical structures, experimental modal analysis or frequency response analysis can be combined with FEA to indirectly obtain the contact stiffness of the contact part.24,25 Dong et al. 26 identify the parameters of the bolt joint based on modal test data and verified its correctness based on modal analysis theory. To improve the calculation efficiency and accuracy, various intelligent optimization algorithms can be used. Adel et al. 27 adopt multi-objective genetic algorithm as an iterative algorithm to calculate the equivalent parameters of bolt joints for composite beam structures. Cui et al. 28 use response surface method as an iterative algorithm to identify the performance parameters of the joint. Yang et al. 29 simultaneously use response surface method and genetic algorithm to identify the parameters of the stiffness of machine tool joints.
In summary, the approaches to obtain bolt joint parameters by combining FEM, test data, and mathematical optimization model are very effective methods for model refinement. Among those approaches, the main differences are in the aspects of the modeling method of bolt joints, the optimization algorithm adopted, 30 and the type of experiment data used. At present most of the methods are applied to simple metal structure, such as composite beams, machine tool plates, etc., and few are applied to complex geometry such as mount brackets.
The motivation of this paper is to investigate the factors affecting the accuracy of the estimated natural frequencies of mount bracket, and to propose a model refinement methodology to enhance accuracy of mount bracket F.E. model for calculating natural frequencies and modal shapes of the brackets.
The organization of this paper is as follows: Firstly, the main causes of the errors between the modal test results and the finite element calculation results are analyzed. A model refinement methodology combining modal test data, finite element model and mathematic optimization model is proposed. Secondly, optimization methods for obtaining material parameters and stiffness of boundaries are presented based on global response surface algorithm to minimize the errors between the test and simulation results, respectively. At the end, to verify the accuracy of the refined F.E. model and the validity of the refinement methodology, an application example is given for another mount bracket.
Problem analysis and refinement methodology for mount bracket F.E. model
The body side bracket of a powertrain mount shown in Figure 1 is taken as the research object. To meet the requirement of NVH performance, the constrained natural frequencies of the mount bracket is the key concern in industry. Generally, a F.E. model is established to analyze the natural frequencies and further guide the bracket structure design. Since the actual vehicle frame is not available in the early development stage, the component level test of the bracket can only be carried out on the tooling, as shown in Figure 2. It can be seen that the bracket is bolted to the base and the base is then fixed to the ground. Correspondingly, the conventional F.E. model (CFEM) is shown in Figure 3.
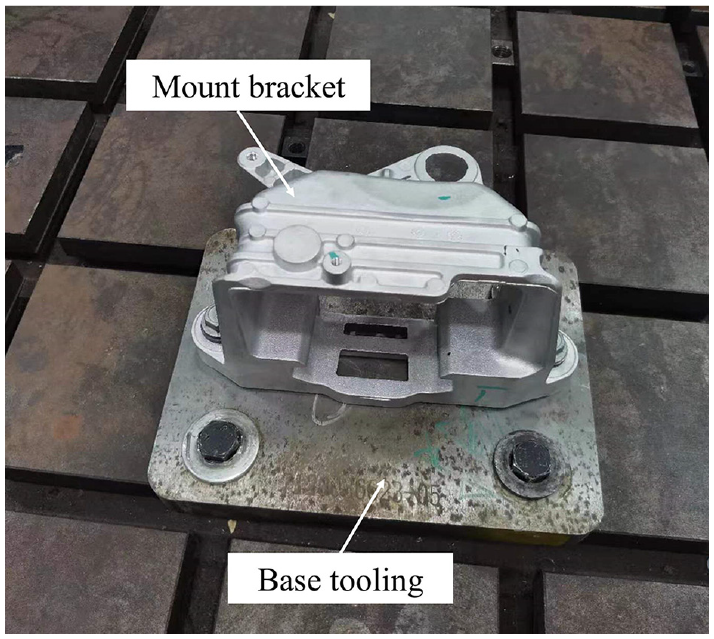
A bracket under constraints to be used for modal test.
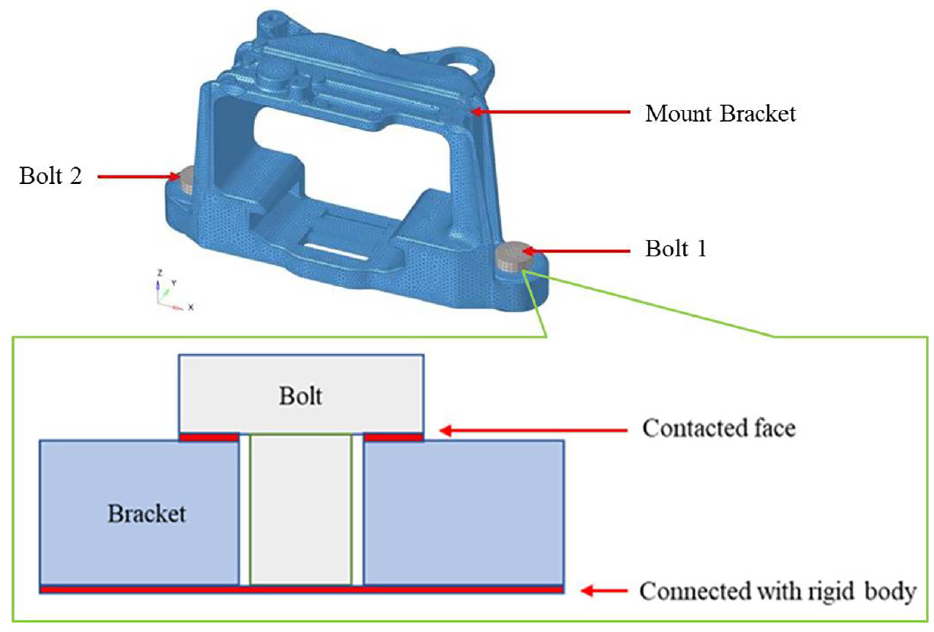
CFEM of the bracket under constraints.
In the CFEM, the modeling method of bolt adopts solid modeling. To improve the modeling efficiency, the local geometric characteristics of the bolt head are ignored, and the bolt head is simplified into a cylinder. The meshes of the contact part between the bolt head and the bracket are treated as common nodes. The stiffness of the tooling base is very large, so the tooling is usually simplified as the ground and the constraint boundary fixed by bolts is simulated by constraining the 6 DOF at the bottom of the mount bracket. As the schematic diagram of CFEM of the bracket under constraints shown in Figure 3, RBE2 rigid element is used to associate the contact bottom surface to its center point. SPC constraint element is established at the center point, and then the 6 DOF of the bracket bottom are constrained. The stiffness of bolt joint between the two structures connected through bolt are not considered.
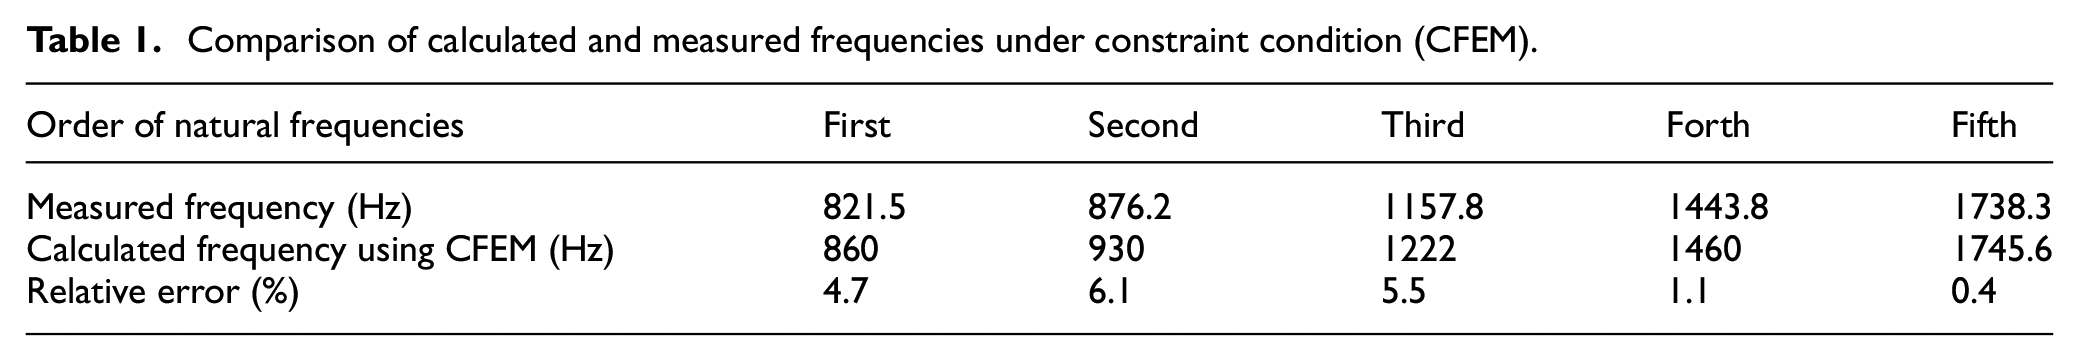
If the accuracy of the F.E. model is sufficient, that is, the error between the simulation results of the F.E. model and the test results is acceptable, then, the F.E. model of the bracket can be used to guide the structure design. However, for CFEM of the bracket as shown in Figure 3, the simulated natural frequencies show large errors compared with test results (see the example in Table 1). The specific test procedure is the same as that descript in section 4.1. It can be observed that, for the first three orders of natural frequencies, the average error is more than 5%. According to the requirements of the automotive industries, 31 the absolute values of errors between the calculated and measured frequencies under constraint condition should be within 3%, and the maximum absolute value of error should not exceed 5%, thus to ensure the design of bracket meet the NVH performance requirements.
Comparison of calculated and measured frequencies under constraint condition (CFEM).
It is well known that constrained natural frequencies of the bracket depends on the mass matrix and stiffness matrix of the system, which relies on the material parameters, bracket structure and constraint condition. Thus, the reasons of bigger relative errors existed can be analyzed from those aspects:
(1) In CFEM, the material parameters, that is, Young’s modulus E, Poisson’s ratio μ, and density ρ, are ideal values. In practice, the values of these parameters vary with raw material batches and processing methods;
(2) In constraint condition, the bolt joint that is the contact area between the two structures connected through bolts is ideally simplified as smooth contact in conventional FEM. In reality, it is contact between two rough surfaces (see Figure 4) and has stiffness characteristics and damping characteristics under the bolt pre-tightening force.
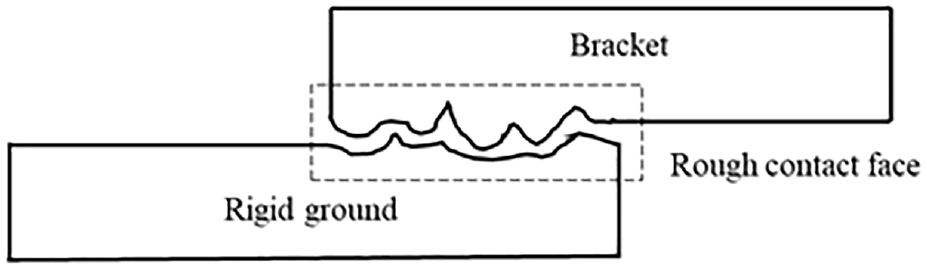
Contact of nut versus rigid ground through rough surfaces.
Hence the values of material parameters and the modeling method of the constraint boundary should be reconsidered to refine the FEM of the bracket.
If the bracket structure is determined, the material parameters are the only factors affecting the free natural frequencies of the bracket. Once the material parameters are accurate, the stiffness of the constraint boundary are the only factors affecting the natural frequencies of the constrained bracket for a determined bracket structure. Therefore, a model refinement methodology is put forward as follows: Firstly, optimize the material parameters of F.E. model using global response surface method (GRSM) based on the free modal test data and FEA results of free natural frequencies; Secondly, refine the constraint boundary model considering the stiffness of bolt joint and optimize the stiffness using GRSM based on the measured and estimated constrained natural frequencies. The detailed methods will be presented in the following sections.
Identification of material parameters for mount bracket
The global response surface method (GRSM) is used to identify material parameters. The optimization objective is to minimize the errors of free natural frequencies obtained using measurement and with FEA under un-constrained condition. In this section, the free natural frequencies of a bracket are estimated and measured. The influences of the material parameters on the calculated frequencies are investigated. Then the optimization method to identify the mount bracket material parameters using GRSM is proposed.
F.E. model for estimating free natural frequencies of the mount brackets
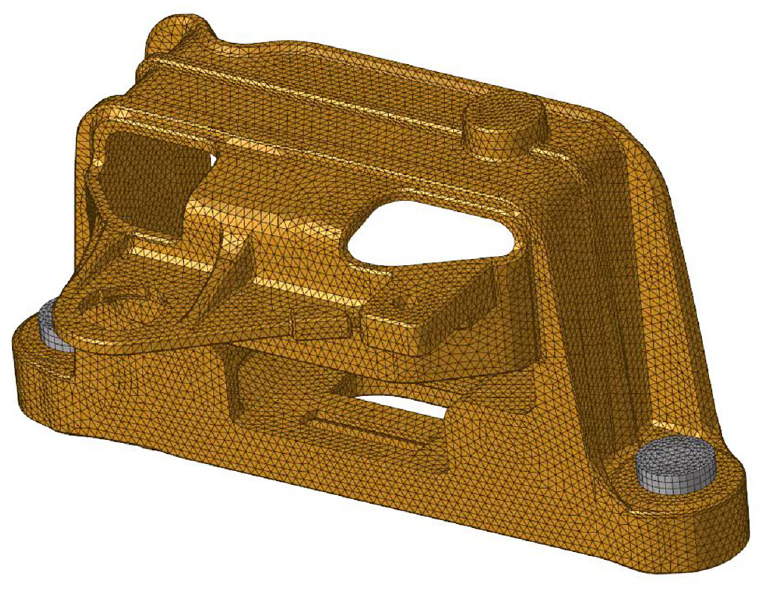
The FEA of the mount bracket includes three steps: meshing, modeling and solution, and post-processing. The tetrahedral mesh is used to mesh the bracket and the meshed bracket is shown in Figure 5. To reduce the calculation errors, the mesh size is set to 2–3 mm and elements with second-order displacement interpolation are used. Lanczos method is used for estimating natural frequencies and mode shapes. HyperView is used for post processing. Since free natural frequencies are to be calculated, the mount bracket is assumed to without any constraints. Material parameters, including Young’s modulus E, Poisson’s ratio μ, and density ρ are set as design variables. With given material parameters, and with the established F.E. model of a bracket, the natural frequencies of a bracket are then estimated.
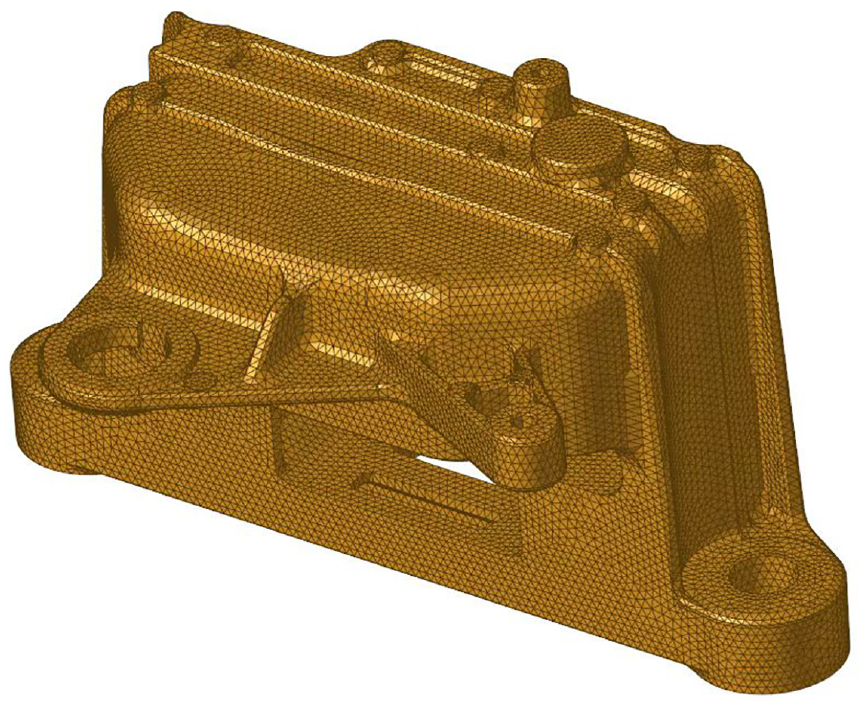
The meshed mount bracket without any constraints.
Influence of material parameters
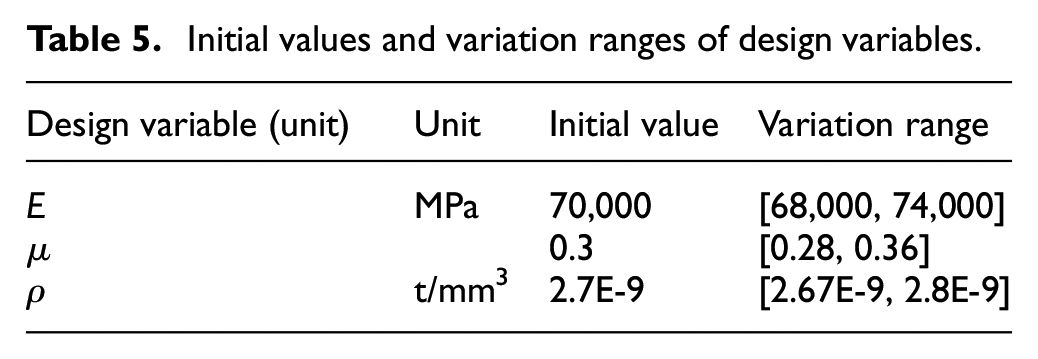
Before parameter optimization, the influences of Young’s modulus E, Poisson’s ratio μ, and density ρ on the modal frequencies are investigated, and a series of F.E. calculation runs have been performed. For each run, one of the material parameters varies, while the other two parameters are fixed as the nominal values. The nominal values of the material parameters (Young’s modulus E, Poisson’s ratio μ, and density ρ) of the mount bracket are 70,000 MPa, 0.3, and 2.7E-9 t/mm3, respectively.
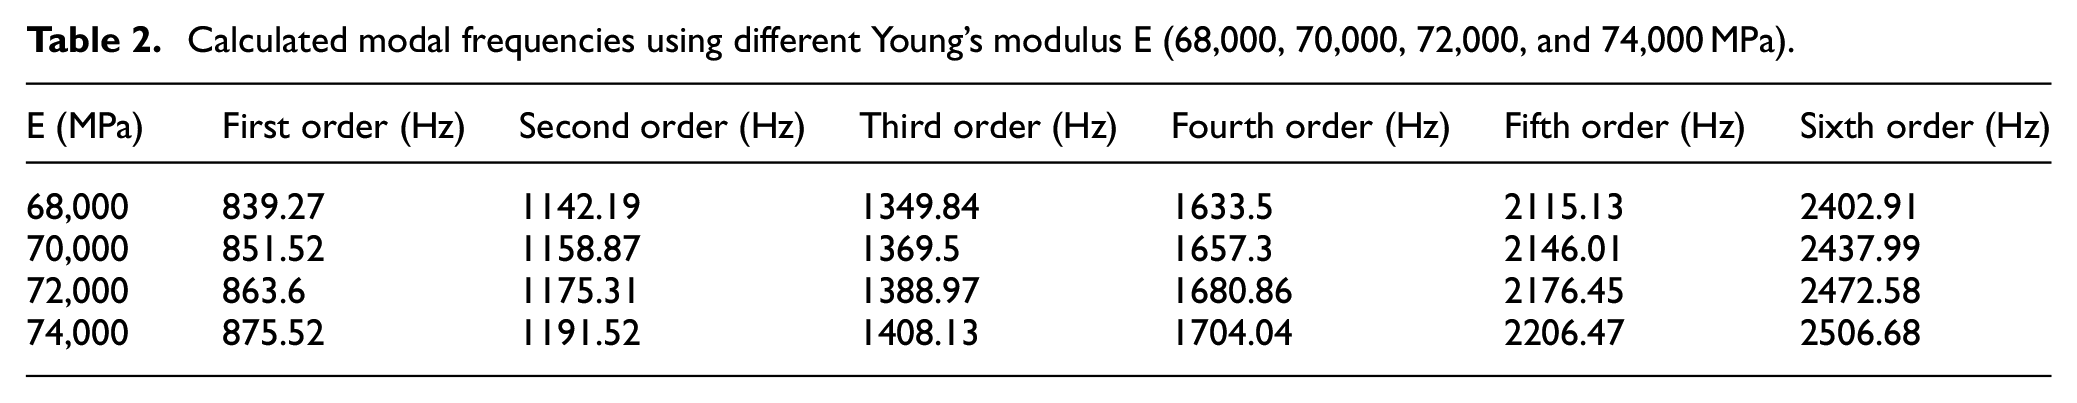
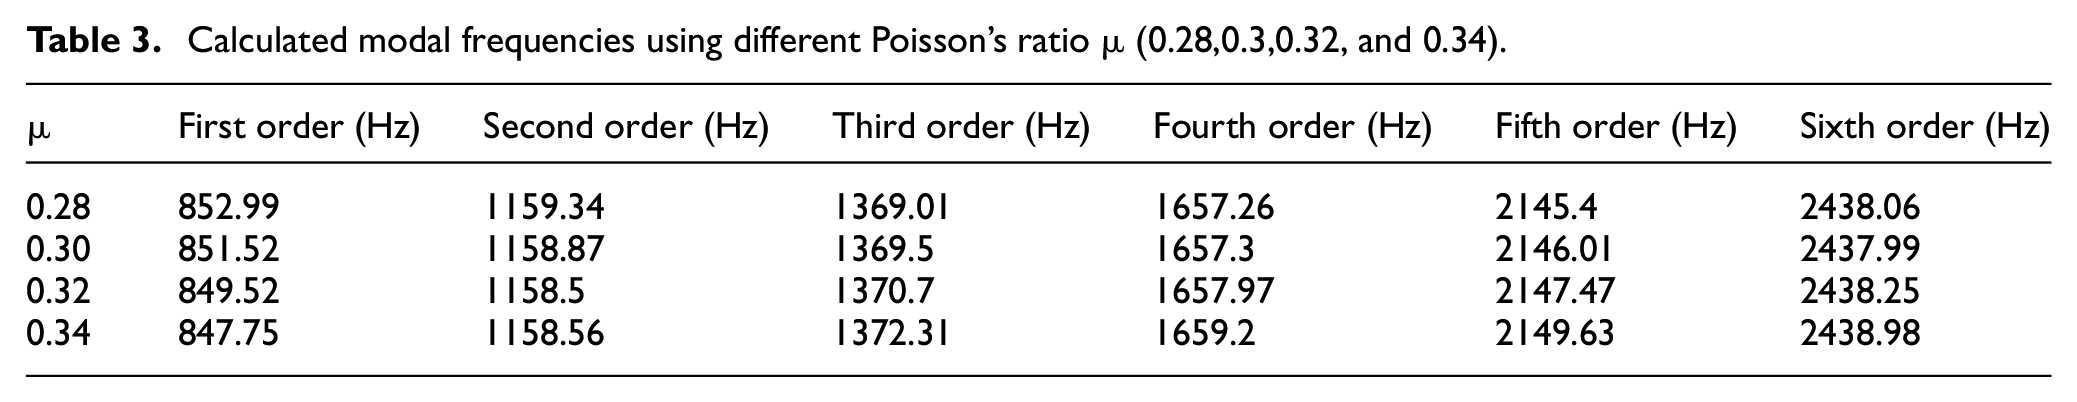
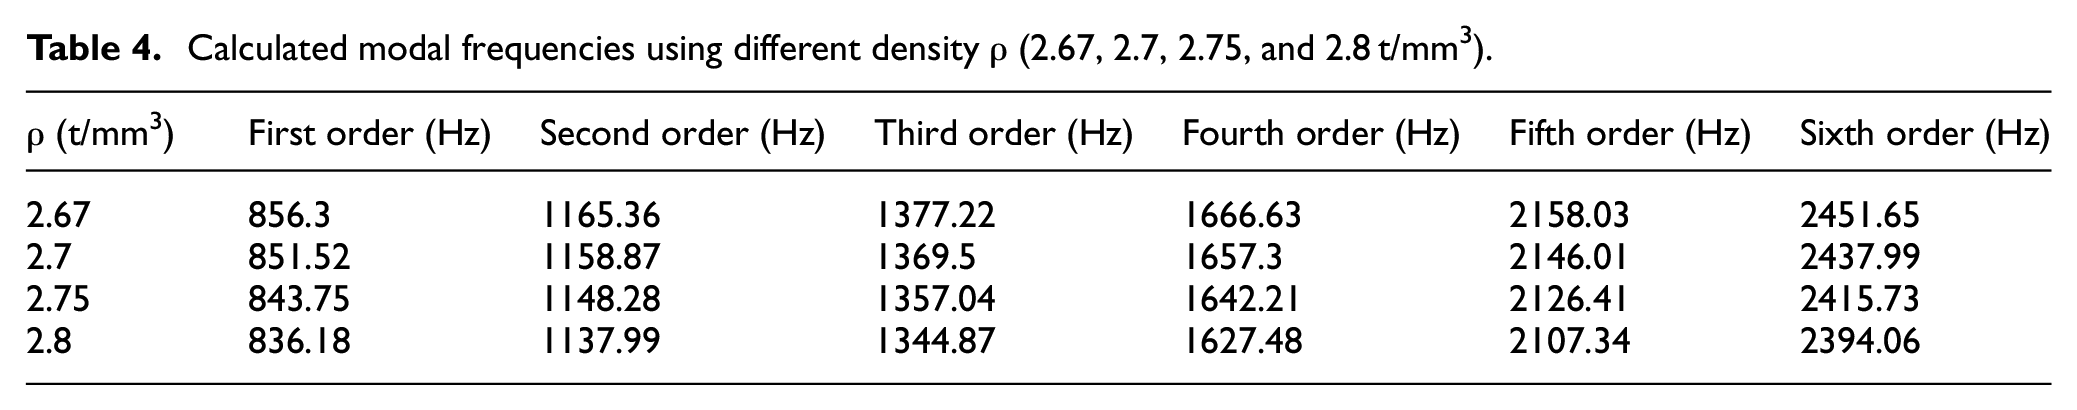
Table 2 shows the influence of the Young’s modulus on the first 6 modal frequencies of the mount bracket. The calculated modal frequency of each mode increases with increase of the Young’s modulus. Tables 3 and 4 present the calculated frequencies for the first 6 modes when Poisson’s ratio and material density varies. It is found that the calculated frequency of each mode decreases when the density value gets bigger. The Poisson’s ratio has relatively small effect on the calculated modal frequencies, but it does affect the calculated frequencies. Thus, all these material parameters need to be optimized to make sure the deviation between measured and F.E. calculated modal frequencies as small as possible.
Calculated modal frequencies using different Young’s modulus E (68,000, 70,000, 72,000, and 74,000 MPa).
Calculated modal frequencies using different Poisson’s ratio μ (0.28,0.3,0.32, and 0.34).
Calculated modal frequencies using different density ρ (2.67, 2.7, 2.75, and 2.8 t/mm3).
Measurement of free modals of a bracket
In the measurement of free natural frequencies and modal shapes, impulse excitation using hammer is used. In this experiment, the mount bracket without constraints is hit by a force hammer and then acceleration response at different locations at bracket is measured.
The schematic of free modal test for a mount bracket and the test spot is shown in Figure 6. It is seen that the test system is composed of a data acquisition system, acceleration sensors connected with the bracket, and a force hammer. The force hammer is used for generating excitation. The data acquisition system is used to establish the geometric model, acquire signals from force hammer and accelerations, and estimating natural frequencies and modal shape.
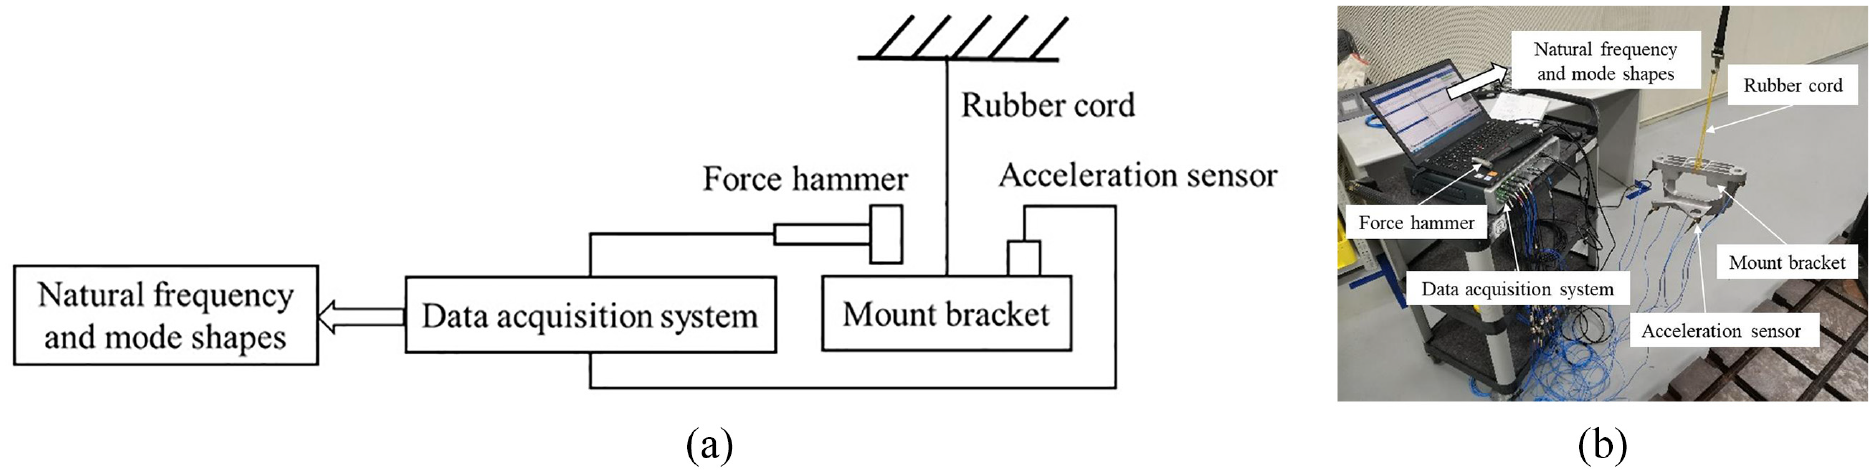
Natural frequencies and modal shape measurement of a mount bracket: (a) schematic diagram and (b) measurement spot.
The modal shapes of a bracket are calculated using the F. E. model and is used to determine the sensor layout scheme. The approximate frequency bandwidth in the measurement is determined by the calculated natural frequency. In this study, the commonly used aluminum alloy material parameters, namely, Young’s modulus 70,000 MPa, Poisson’s ratio 0.3 and density 2.7E-9 t/mm3, are substituted into the F.E. model to obtain the initial calculated modal parameters of the bracket. Combined with the calculated results, the sensor layout scheme is shown in Figure 6(b), and the measured bandwidth is set within the range of 2700 Hz.
In addition, a rubber cord with very low stiffness is used to characterize the free boundary of the mount bracket and is as shown in Figure 6(b). The rubber cord is long enough and soft enough and the suspension point is selected at a node point according to the calculated modal shapes.
Force hammer hits at different points and the measured FRFs (Frequency Response Function) are used to obtain natural frequencies and modal shapes. In this test, six points are selected for hitting, corresponding to the positive and negative directions of three axes respectively. Since the mass of the sensor has influence on the measured natural frequency, only one sensor is used in measuring natural frequencies of the bracket.
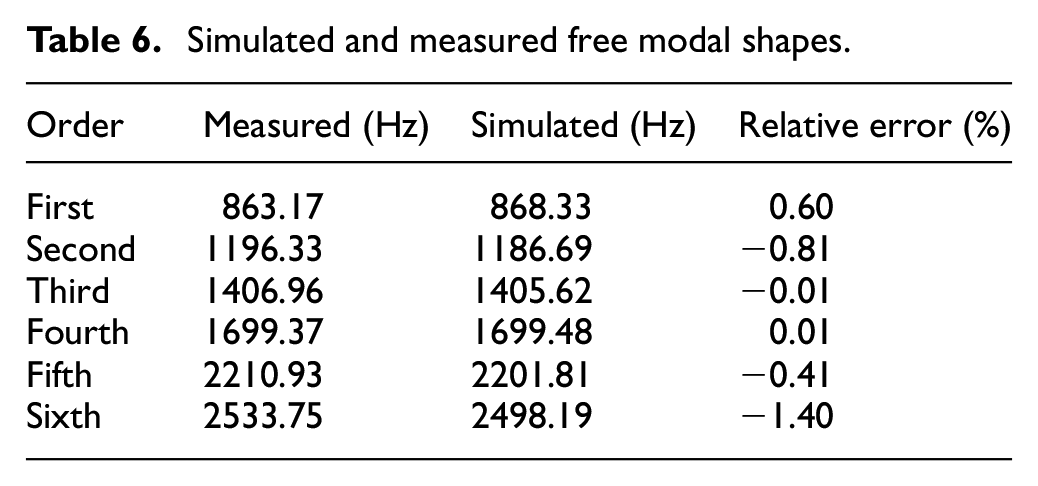
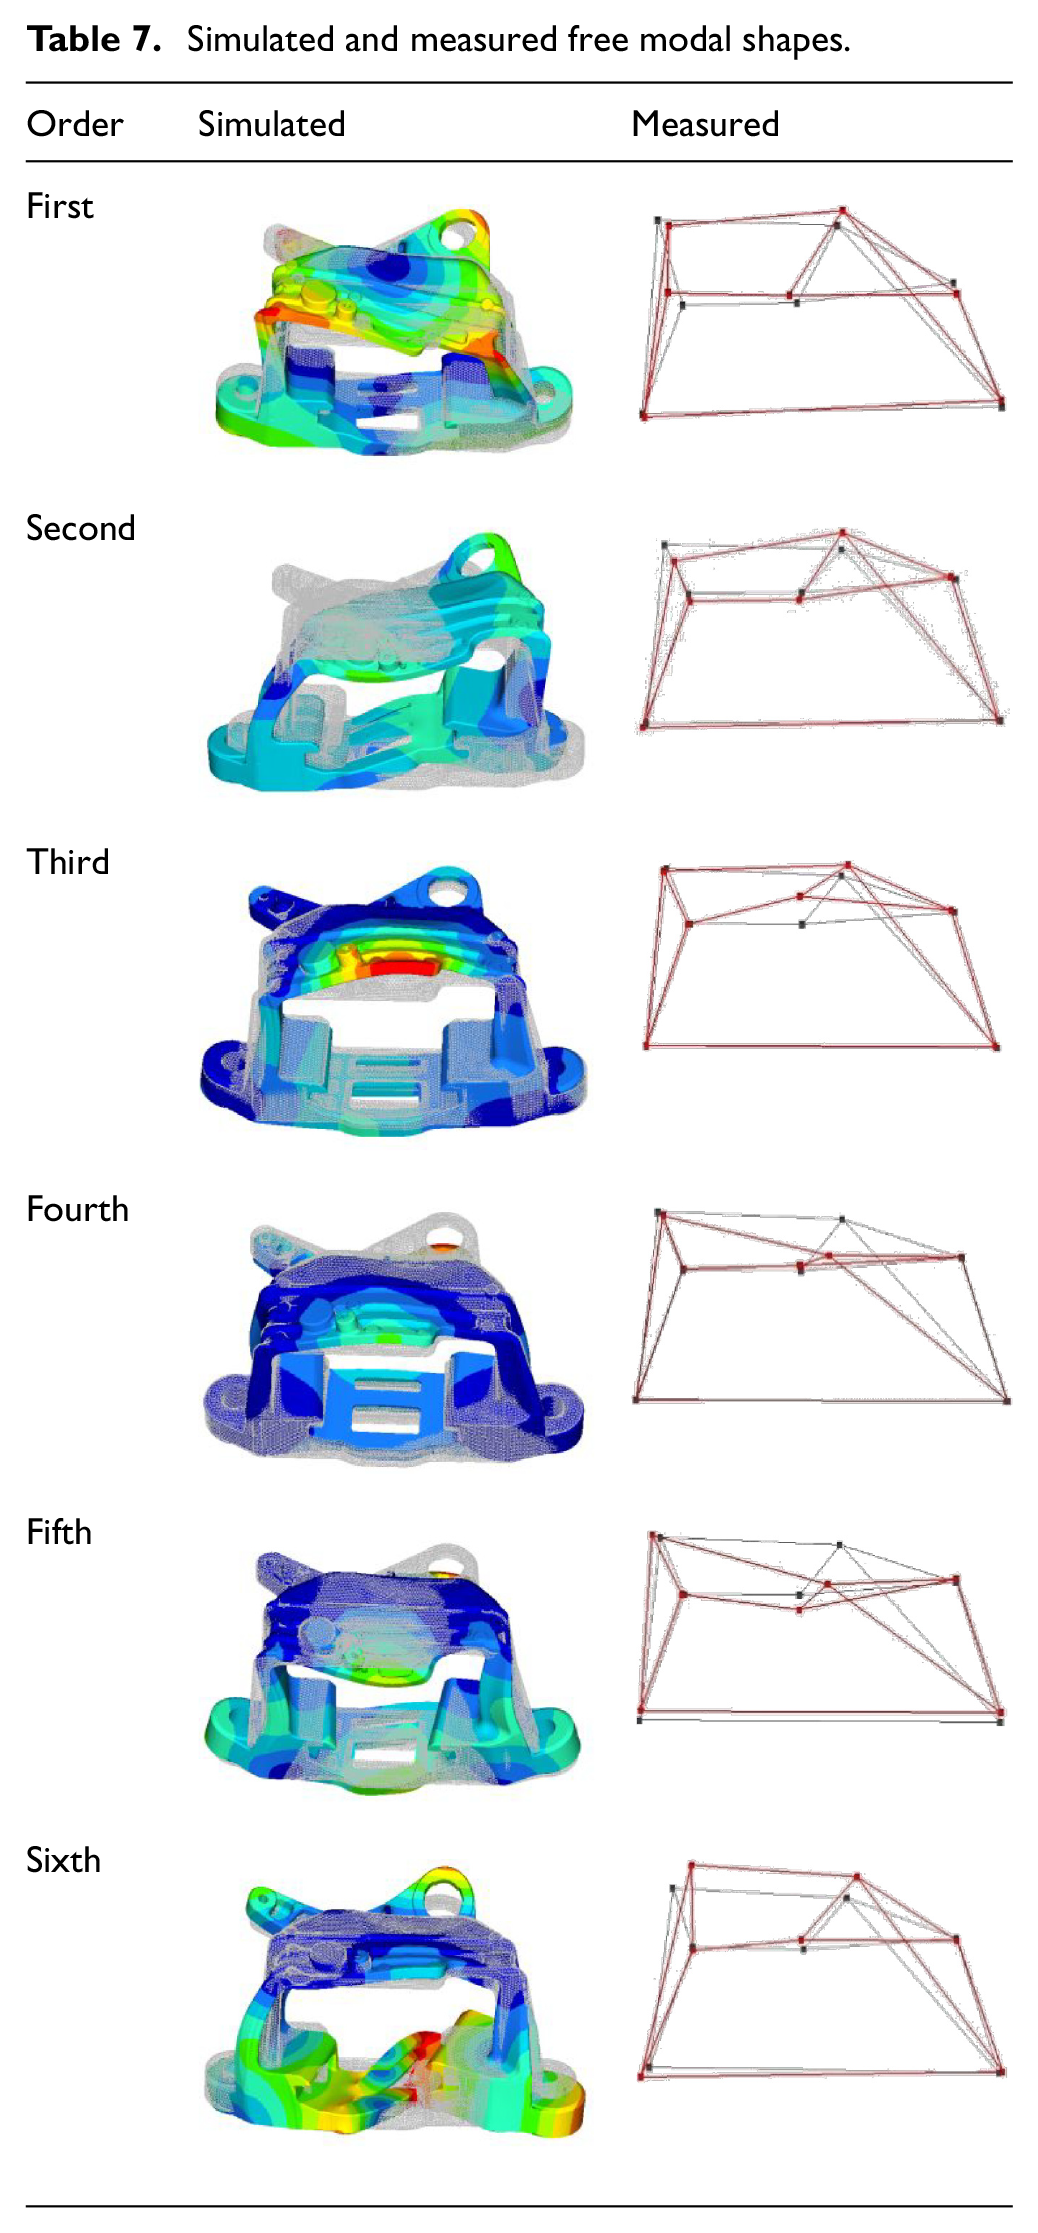
The first 6 order natural frequencies and modal shapes are measured, and the data are shown in Tables 6 and 7, respectively. In the mode shape, the gray lines represent the initial state of the bracket, and the red lines represent the modal shape.
Initial values and variation ranges of design variables.
Simulated and measured free modal shapes.
Simulated and measured free modal shapes.
Optimization of material parameters
The GRSM 32 is used to identify the material parameters of the bracket in this paper. Compared with commonly used genetic algorithms and traditional response surface methodology (RSM), GSRM is more computational efficiency 32 and is used in this study.
In this study, objective function are fitted using second-order polynomial:
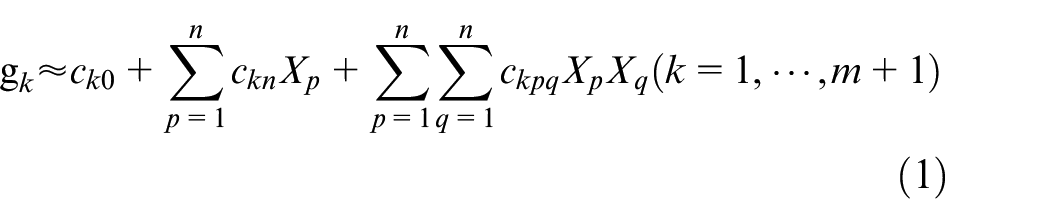
where m and n are the number of constraints and design variables, respectively. And
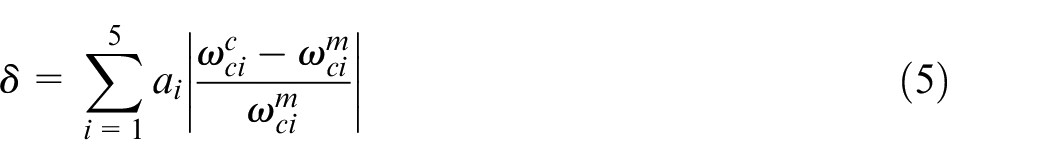
To obtain the optimal material parameters, following objective function should be minimized:
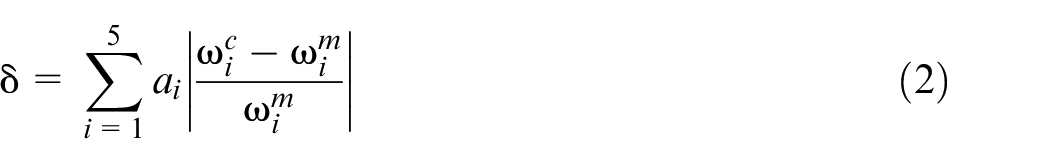

where δ is the sum of the weighted absolute errors between the simulated natural frequency
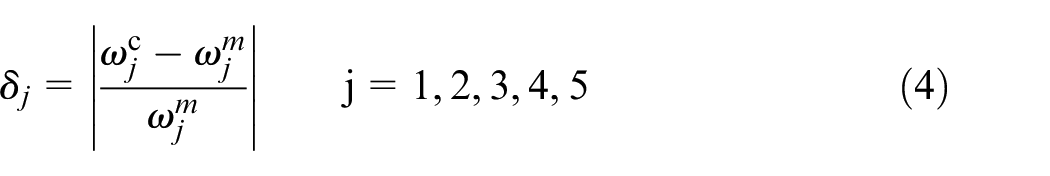
To meet the requirement of high precision in optimizing equation (2), the constraint function is set as equation (4), which shows that the absolute relative error
The initial design variables and ranges are shown in Table 5.
The GSRM is used and the flowchart for material parameter identification is shown in Figure 7. The steps are as follows:
Step 1: Assign design points according to the given initial value and the variation range;
Step 2: Calculate the objective function according to equation (3);
Step 3: Establish/update response surface and search the optimal point based on response surface using GRSM;
Step 4: Check the convergence condition of equation (4): if the condition is satisfied, end the iterative calculation, otherwise update design points and go back to step 2.
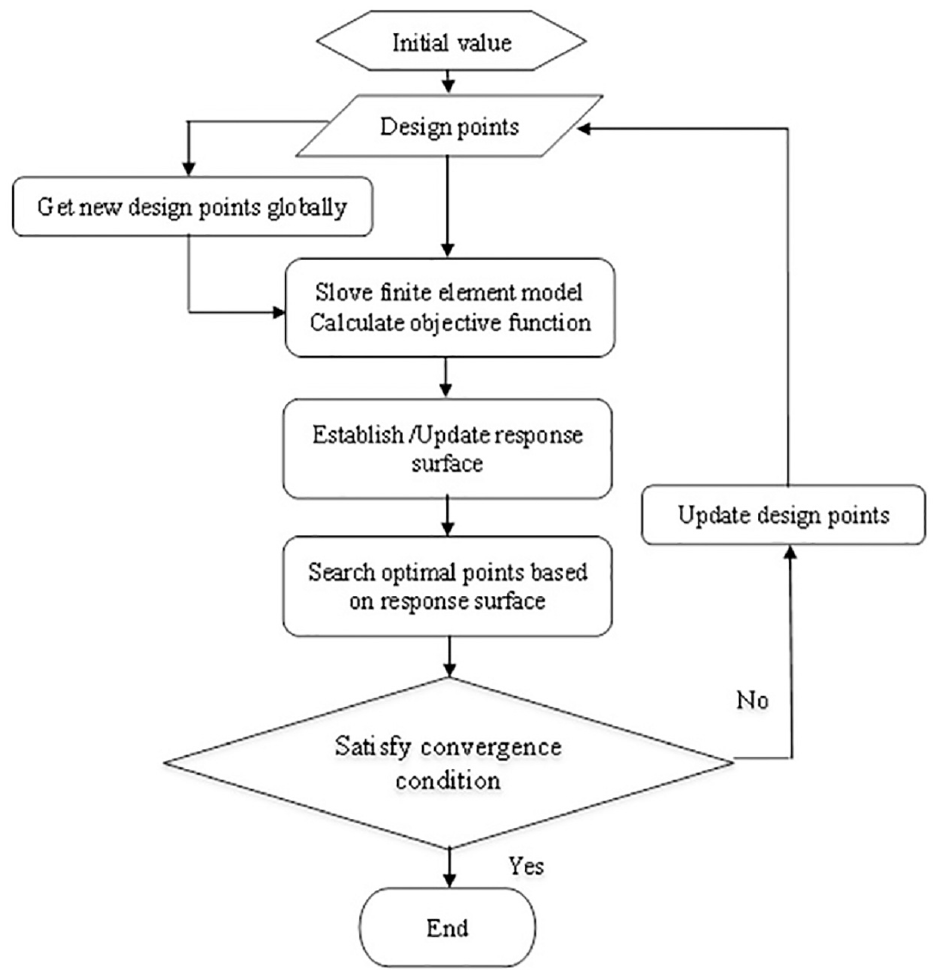
Flowchart for material parameter identification using GSRM.
The number of design points must be determined considering the optimization accuracy and calculation efficiency. If the number is too small, the optimization accuracy will not meet the requirement, and if the number is too large, it will decrease the calculation efficiency. After reasonable tuning, the number of design points in this paper is set to 50, which can ensure the optimization accuracy and improve the calculation efficiency. Following above procedure, the convergence condition is approached after 24 iterations. The optimal material parameters of the bracket are: Young’s modulus (E), Poisson’s ratio (μ) and density (ρ) are 72896 MPa, 0.36, and 2.68E-9 t/mm3, respectively.
Then, the optimized material parameters are substituted into the F.E. model, and the estimated natural frequencies are compared with the measurements. Table 6 lists the comparison of first–sixth natural frequencies. It is found that the absolute values of relative errors for first five orders are less than 1%, and for the sixth, it is within 2%. The modal shapes are also compared and shown in Table 7. The gray area in Table 7 represents the original state of the bracket. It is observed that the simulated and tested modal shapes are agreed well, which indicates that the methods for obtaining model parameters and free natural frequencies are effective.
Constraint boundary refinement for mount bracket F.E. model
In this section, the measured natural frequencies under constrained of the mount bracket are presented. The refine method of constraint boundary (bolt joint) of the mount bracket F.E. model is presented and the boundary parameters (equivalent stiffness of bolt joint) are identified using GRSM combined with the FEA results and test data.
Constrained modal measurement of mount bracket
The constrained modal test of a mount bracket is the same as the free modal test except that bracket is constrained. Since the boundary stiffness of the mount bracket has great influences on the measured frequencies. In the measurement, the bracket is fixed on the base through the bolt of M12. The equivalent stiffness of the contacted face between bracket and ground is modeled considering the bolt pre-tightening force, and the bolt pre-tightening force is adjusted by a torque wrench. The influence of pre-tightening force on the measured natural frequencies and modal shapes are studied in this paper.
Figure 8 shows the measured natural frequencies of the bracket under constraint if pre-tightening torque varies from 50 to 100 N/m. It is found that natural frequencies increase with the increase of pre-tightening torque, and then achieve to a stable value after the torque of 70 N/m. Thus, 70 N/m is considered as the ultimate preload torque in this measurement. In this test, the pre-tightening torque is set to 90 N/m and the measured natural frequencies and modal shapes are shown in Tables 9 and 10, respectively.
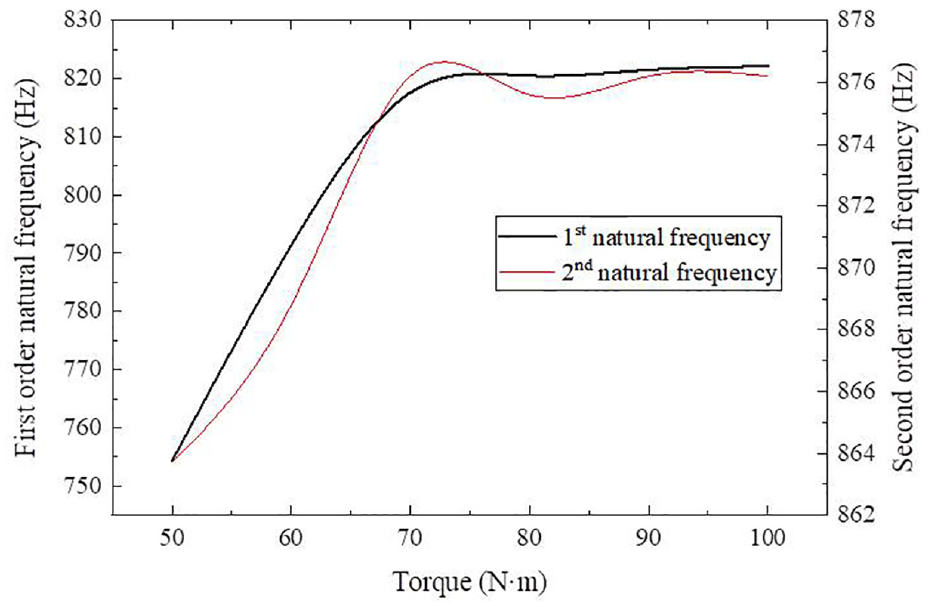
The first two natural frequencies vary with the pre-tightening torque.
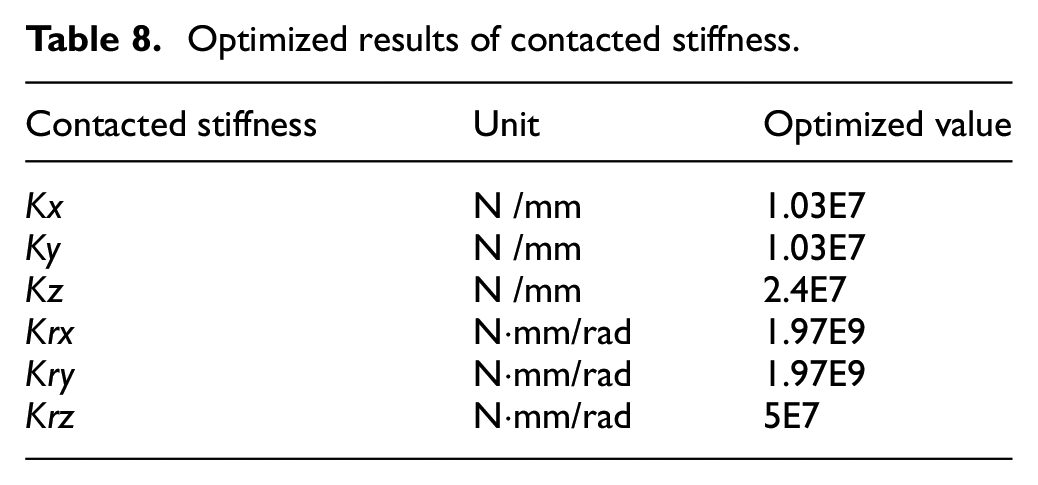
Optimized results of contacted stiffness.
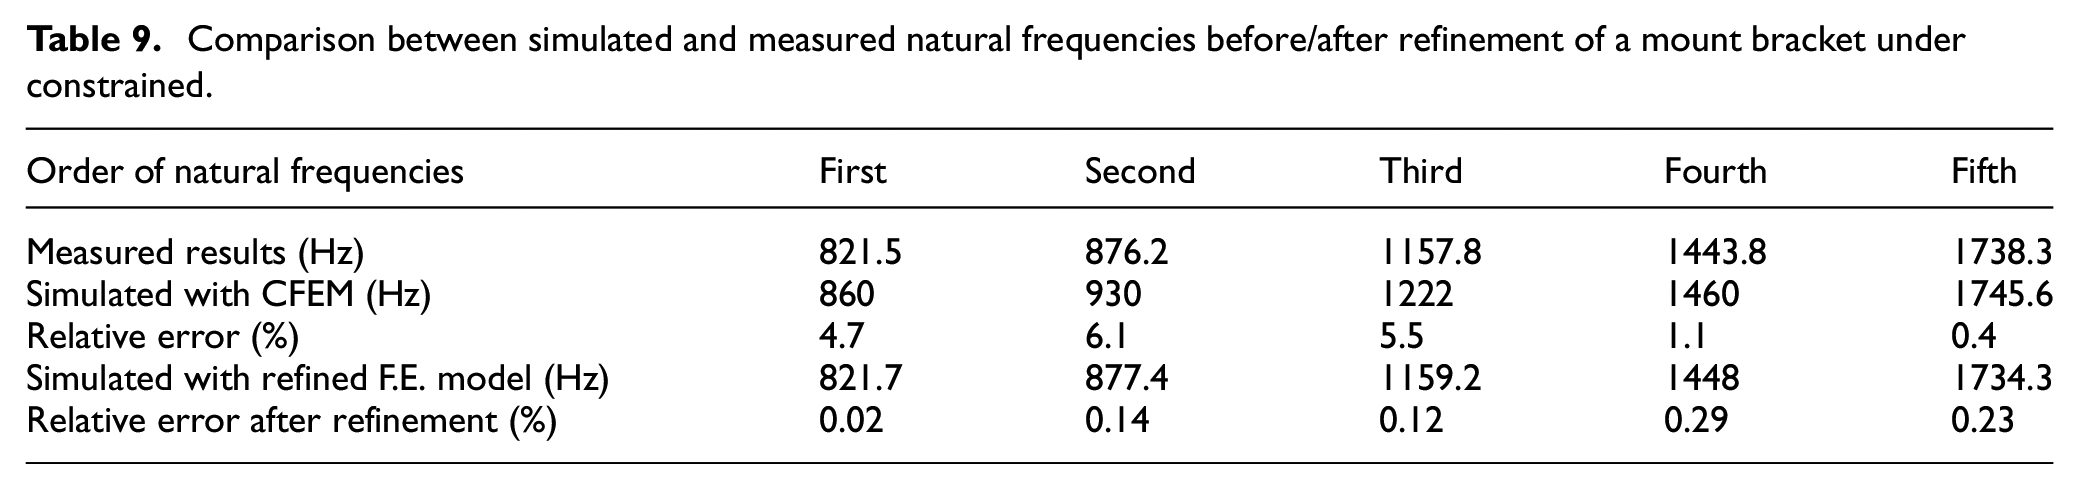
Comparison between simulated and measured natural frequencies before/after refinement of a mount bracket under constrained.
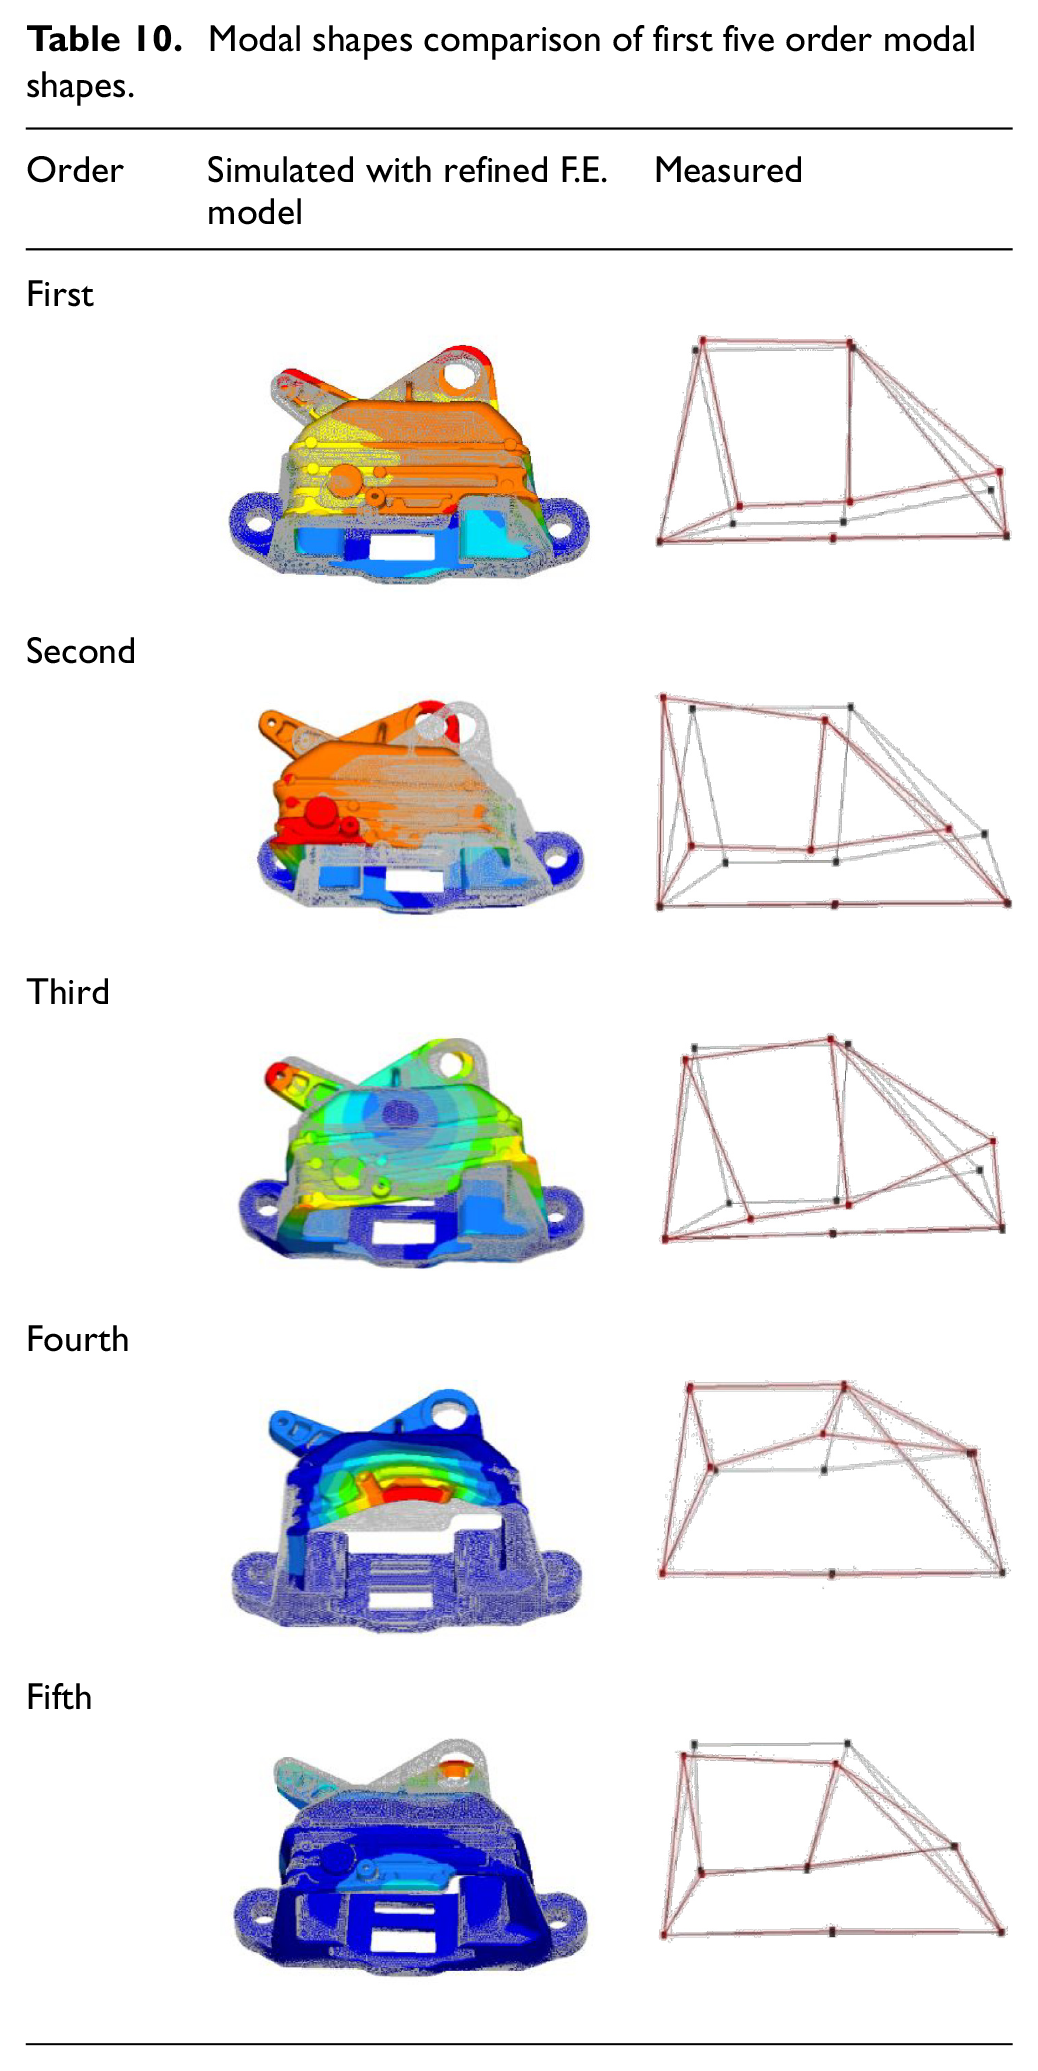
Modal shapes comparison of first five order modal shapes.
Refined model of bolt joint
Considering the stiffness of the bolt joint and the elastic properties of the base, the equivalent dynamic model for the constraint modal test of the mount bracket is shown in Figure 9, where K1 and C1 are the connection stiffness and damping between the bracket and the base, and K2 and C2 are the connection stiffness and damping between the base and the ground. If the ratio of the mass for bracket and base is less than 1/10, the ground can be regarded as a rigid base. 33 The mass of the bracket is 1.3 kg. The material of the base fixture is No. 45 steel having high strength and strong deformation resistance and the mass of the base is 14.5 kg. It can be found that the mass ratio meets foresaid requirement. Therefore, the equivalent dynamic model can be further simplified as shown in Figure 10, where Kj and Cj are the equivalent stiffness and equivalent damping of the bolt joint between the bracket and the base.
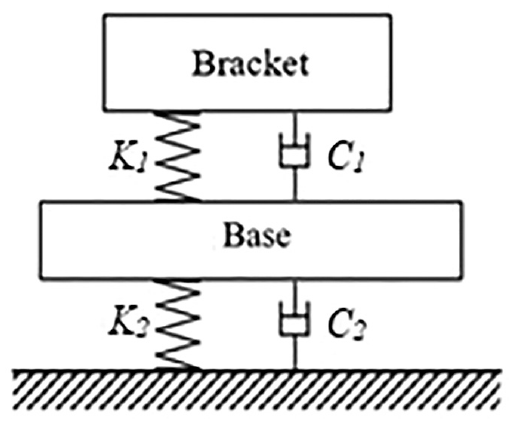
Initial simplified bolt model.
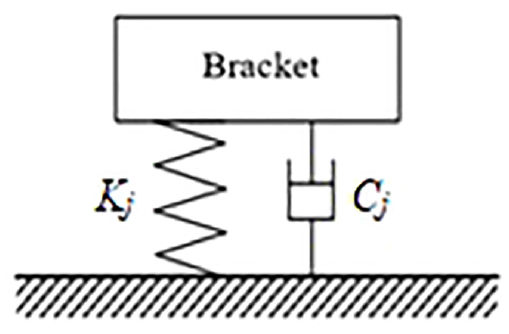
Finally simplified bolt model.
The natural frequencies of a bracket depends on its stiffness and mass, so if the bracket structure and material parameters are assumed as invariant, the equivalent stiffness Kj of the bolt joint is the only variable parameter for determining natural frequencies of a bracket. In CFEM, the constraint boundary is over simplified as rigid base, and the stiffness of the bolt joint is assumed to be infinite.
The contacted area of bolt joint between the bracket and base should be modeled with contact stiffness and it is depended on the pre-tightening torque of bolt and the size of the connected part. In this study, the contacted area is measured by placing a piece of sensing paper on the contacted face between the bracket and the base, and the pre-tightening torque is set to N*m. The pressure sensing paper will show red in the contacted area. And it is found from Figure 11 that the contacted area between bolt and ground is a kind of convex surface.
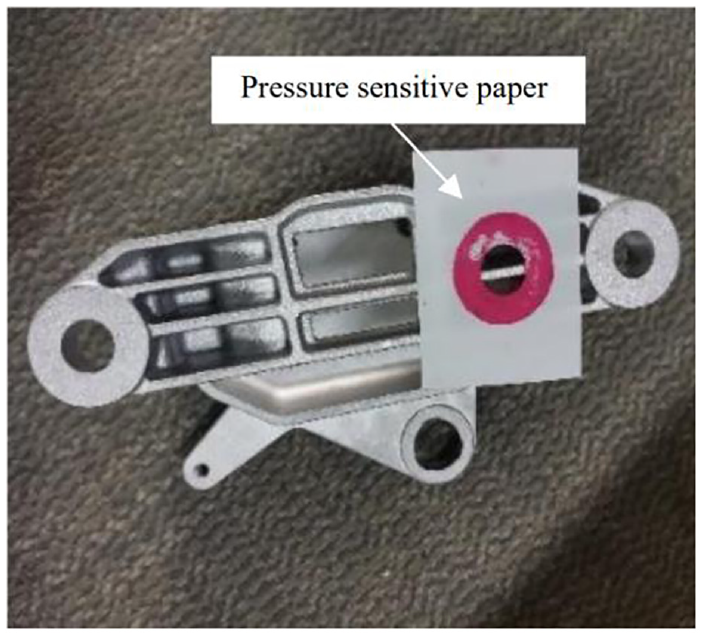
The contacted area between nut and ground.
Based on above mentioned issues, the constraint boundary model is refined and its schematic diagram is shown in Figure 12. The equivalent stiffness of the contacted face is characterized by a spring element with 6DOF. The modeling procedures are: firstly, a spring element is set in the center of the constraint face; secondly, a rigid element is defined to the constraint region between the bracket and the fixed base, and the rigid element connected with the spring element; Thirdly, the other end of the spring element connected to the base is fixed without any degrees of freedom.
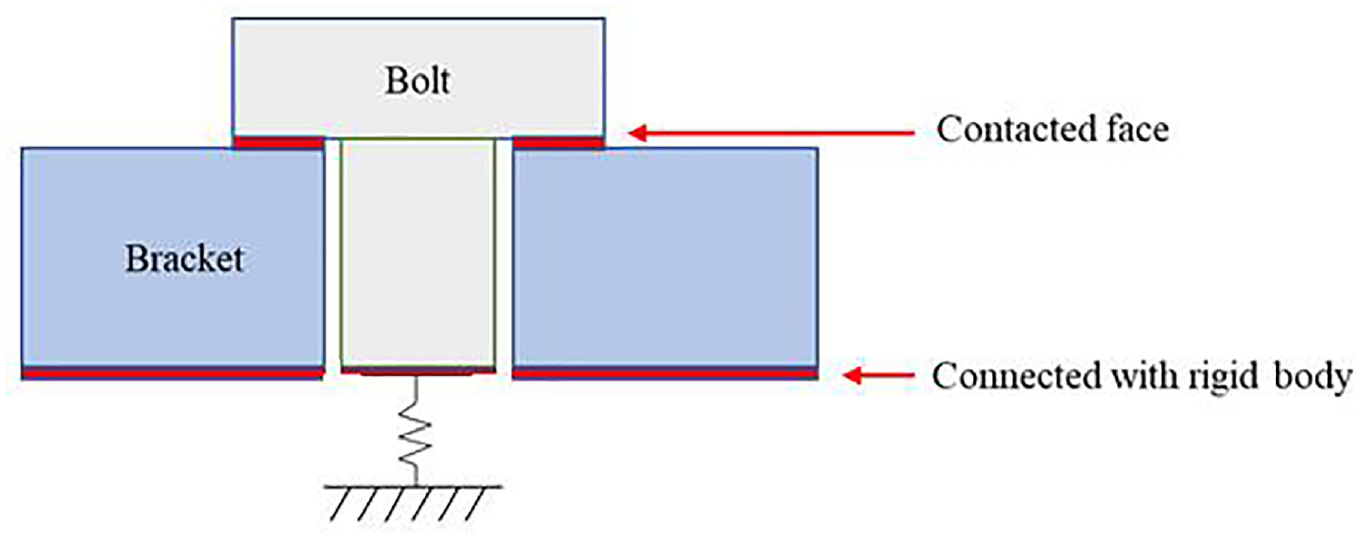
Schematic diagram of the refined boundary model.
Identification of stiffness of contacted face
After refined the boundary model, the equivalent stiffness of the contacted face, that is, the stiffness of the spring element, needs to be determined so as to obtain the refined F.E. model of the mount bracket. Thus, a method utilizing GRSM to obtain the stiffness of spring element is proposed in this paper.
Firstly, initial stiffness ranges of the spring element are obtained by adjusting the spring stiffness parameters and comparing the simulated- and measured- constrained natural frequencies.
To improve the optimal efficiency, following assumptions are made: the tangential stiffness Kx and Ky in translational stiffness are assumed as the same, and the torsional stiffness Krx and Kry around X-axis and Y-axis are assumed the same. Thus, the design variables can be reduced as four design variables
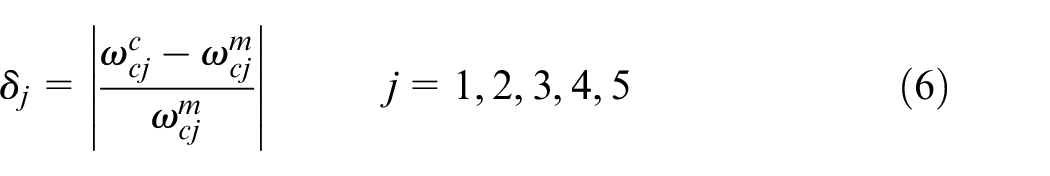
The optimization target is to minimize the error between the simulated and the measured natural frequencies under constraints. The objective function is expressed as:
Where
To meet the requirement of high precision in estimating of constrained natural frequencies, the constraint function is set as equation (6), which represents that the absolute relative error
Similarly, the optimization of the stiffness values is conducted by following the procedure in Figure 7. The optimized stiffness values of the spring element are listed in Table 8.
The optimized stiffness values are substituted into the F.E. model with refined constraint boundary, and then the simulation results of the refined F.E. model of the mount bracket are obtained. The modal shapes are compared with the measured results and are shown in Table 10. The gray area represents the state when the bracket is static. It can be observed that the simulated modal shapes match with the test ones well for each mode. This means that the simulated and measured natural frequencies for each mode are in good agreement. It is seen from Table 9 that the relative error range of the simulated natural frequencies using the refined F.E. model versus measured results are less than 1%, and the maximum error has decreased from 6.1% before the refinement to 0.29%, which validates the refined F.E. model and methods for obtaining modal parameters.
Application example
To verify the accuracy and validity of the proposed F.E. model refinement methodology, another mount bracket is taken as studying object. The previous studied bracket is named as Bracket A and the bracket to be studied is named as Bracket B. Brackets A and B are the same type of bracket but the geometric model is different. Bracket B weighs 1200 g, which is lighter than that of Bracket A. Figure 13 shows the constrained F.E. model of Bracket B. The two brackets are made of the same material and tested with the same tooling and bolt, that is, their constraint boundaries are also the same, so the material and stiffness parameters for Bracket A can be used for Bracket B
The constrained F.E. model of Bracket B.
The constrained modal test of bracket B is conducted following the same procedure presented in section 4.1. Figure 14 shows the spot for measuring natural frequency of Bracket B when it is confined on the base. Figure 15 shows the locations of acceleration sensors when modal shapes are to be measured.
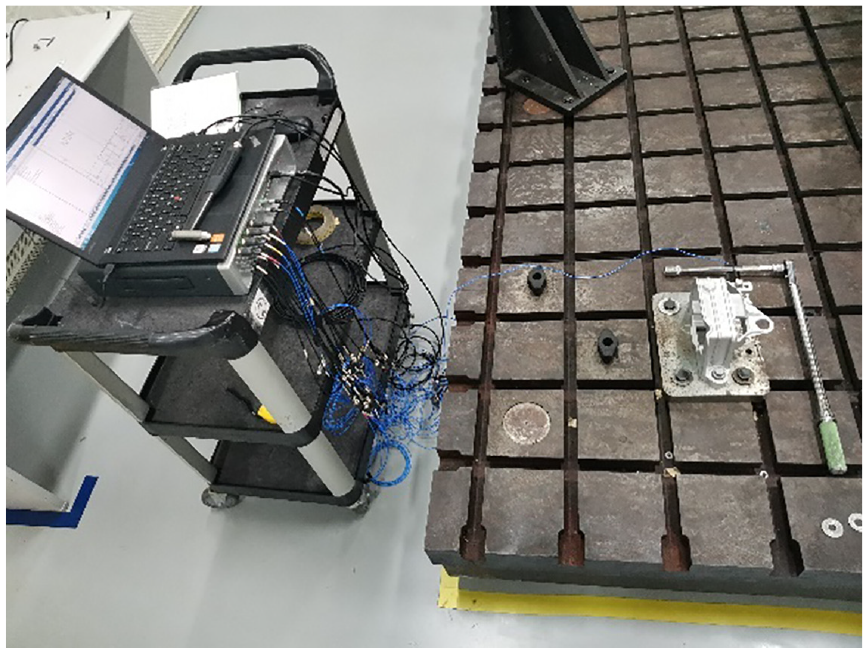
Constraint modal test site of Bracket B.
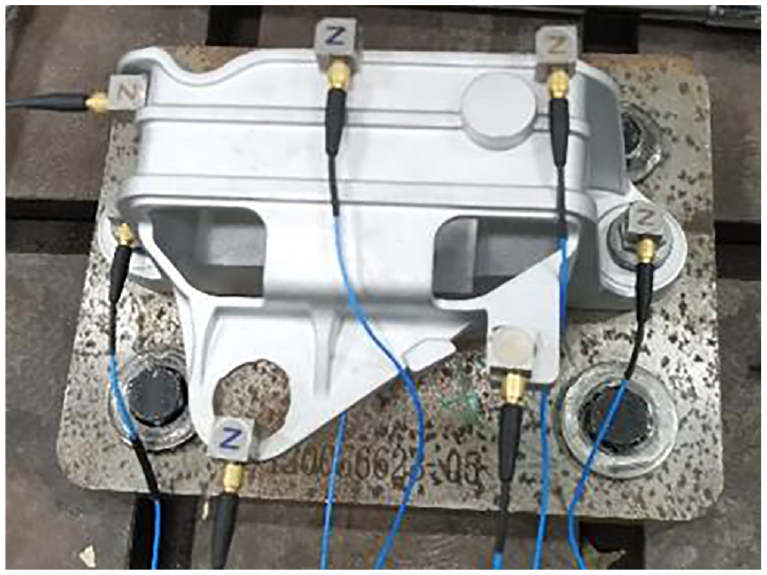
Sensor layout scheme for modal shape test of Bracket B.
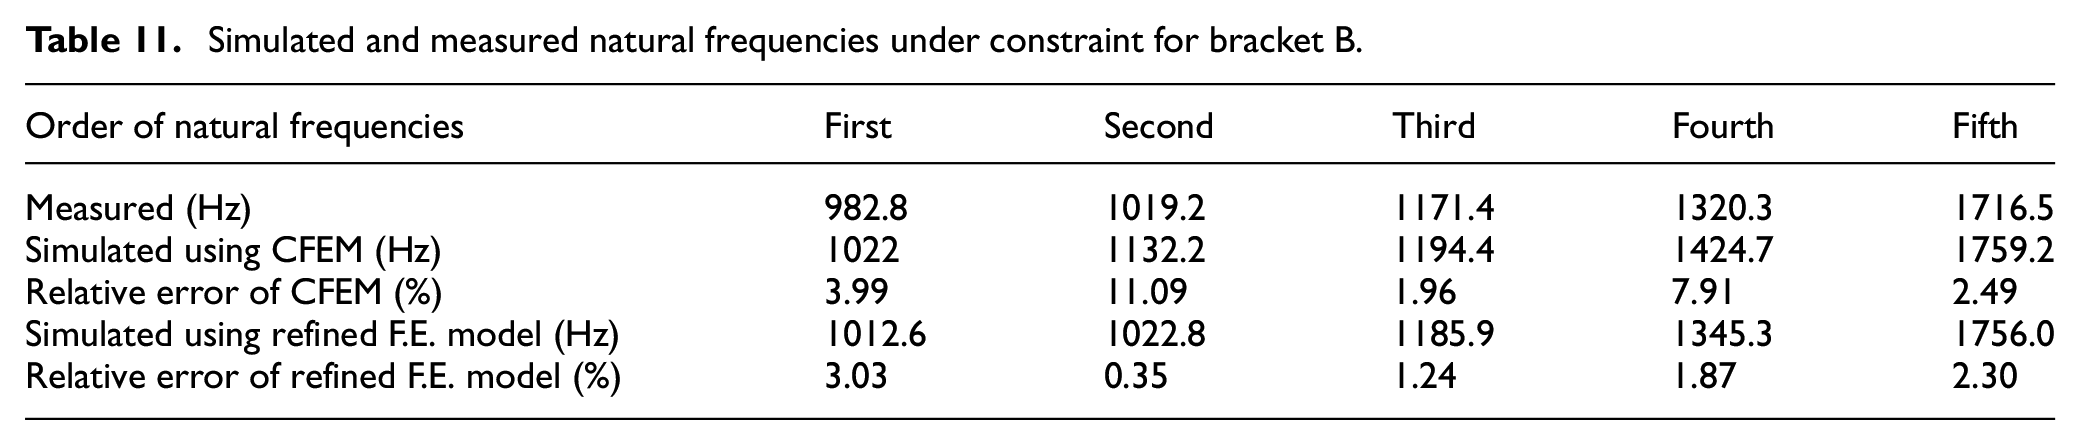
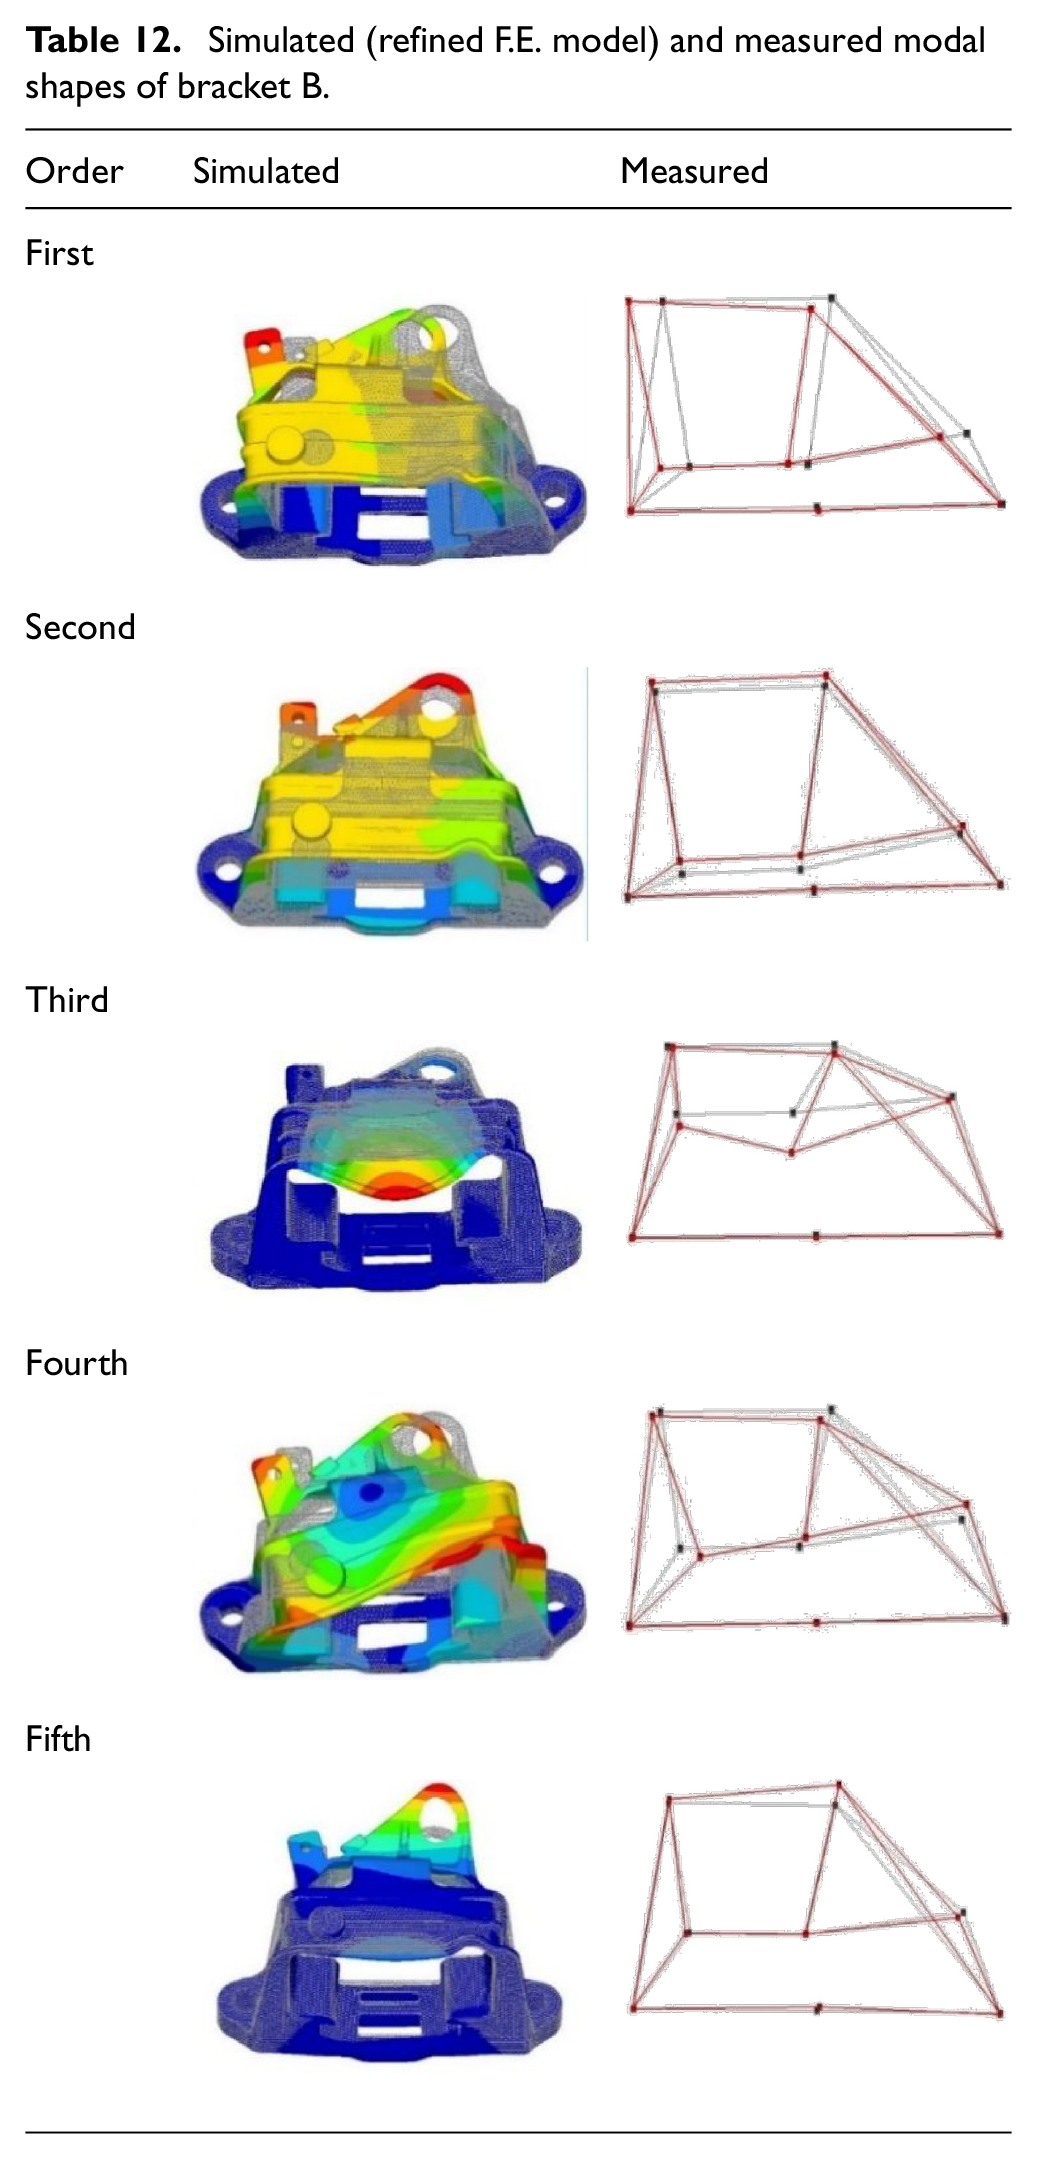
Table 11 summarizes the simulated and measured natural frequencies under constraint for Bracket B. It is found that the maximum relative error of the constrained natural frequencies obtained using refined F.E. model decreases from 11.09% to 3.03% by adopting the proposed refinement methodology. Table 12 shows the simulated and tested modal shapes of the first five modes and it is observed that the simulated modal shapes are in good agreement with the measurement.
Simulated and measured natural frequencies under constraint for bracket B.
Simulated (refined F.E. model) and measured modal shapes of bracket B.
From above analyses, it is concluded natural frequencies and modal shapes of a bracket can be well estimated using the refined F.E. models proposed in this paper.
Conclusions
In this paper, a refinement methodology for F.E. model of mount brackets calculating constrained natural frequencies is proposed. The test methods of measuring un-constrained and constrained natural frequencies and modal shapes are presented in detail. A refined F.E. model of mount bracket for calculating constrained natural frequencies and modal shapes are developed and the following conclusions are obtained.
(1) The material parameters uncertainty and the stiffness of the bolt joint (constraint boundary) must be take into account in order to well estimated natural frequencies of mount brackets.
(2) A F.E. model refinement methodology for mount bracket to estimate natural frequency and modal shapes under constraint is proposed and validated. The relative error of the simulated natural frequencies using the refined F.E. model versus measured are less than 1%, and the maximum error has decreased from 6.1% if conventional methods is used to 0.29% if the refinement model is used.
(3) It is concluded that pre-FEA is helpful to locate acceleration sensors and to improve the test efficiency. Saturated pre-tightening torque of bolt should be applied in order to make contacted area to be fully constrained.
Footnotes
Appendix
Declaration of conflicting interests
The author(s) declared no potential conflicts of interest with respect to the research, authorship, and/or publication of this article.
Funding
The author(s) disclosed receipt of the following financial support for the research, authorship, and/or publication of this article: This study was supported by the 2021 Annual Open Fund of State Key Laboratory of Vehicle NVH and Safety Technology (Grant No. NVHSKL-202117).