
Abstract
With the rapid development of the automobile industry, automobile manufacturers begin to pay more attention to NVH (Noise, Vibration, Harshness). The sound of car closing the door is one of the characteristics of NVH. Therefore, it is of great significance to analyze and improve the door closing sound quality of cars to improve the comprehensive performance of automobile. The dynamic characteristics of car door closing can indirectly reflect the sound quality of car door closing. In this paper, firstly, a finite element model of a quarter of car body with the complete structure of door, window and sealing system was established by HyperMesh software. Secondly, stress-strain tests of sealing strip were performed, and their data were input into the hyperelastic material setting in ABAQUS for selecting the most suitable strain energy function. Thirdly, the sealing strip model was introduced into ABAQUS, a simulation of reaction force and compression displacement on the sealing strip was performed by ABAQUS to generate the sealing strip CLD curve, and be verified by test. Fourthly, the finite element model was introduced into ABAQUS, the Y-direction (rightward direction from driver) acceleration of the three specified points at door closing, such as the upper corner of the door, the midpoint of the window and the body points on the B-pillar, were studied numerically. Finally, their Y-direction jitter acceleration were studied numerically and experimentally. The results showed that the relative error between calculated and experimental maximum values of Y-direction jitter acceleration at three specified points at door closing is less than 5.5%, and the acceleration attenuation trend is consistent with the test.
Introduction
The closing sound of a car door is objectively not related to the intrinsic quality of the vehicle, but it is an important subjective parameter for vehicle evaluation. Therefore, the sound quality of closing door is paid more and more attention by vehicle manufacturers and their R & D personnel.
The most intuitive evaluation method of door closing sound quality is subjective and objective evaluation experiment. Similarly, the closing jitter (acceleration at the moment of closing the door), closing energy, closing force, door sheet metal mode and its dynamic stiffness of the car can also characterize the vehicle closing process, and they will directly or indirectly affect the sound quality of closing the door. In the field of computer-aided analysis, the finite element method used in the dynamic simulation analysis of door closing process is more accurate than infinite element, boundary element and energy statistics. The dynamics of car door closing process can explore the relationship between door structure and door closing sound quality, so as to optimize door structure and improve door closing sound quality. 1
In recent years, a lot of research on the prediction of car door closing sound quality have been done. Siavoshani and Vesikar 2 analyzed the time and frequency function relationship between door structure and door closing sound based on the transfer path analysis (TPA) method, and studied the effects of door sealing strip, gravity center of door and stiffness of door on door closing sound quality. Xing et al. 3 predicted the sound quality of door closing by using the optimal wavelet packet transform and artificial neural network (OWPT–ANN). Xie et al. 4 analyzed door closing sound quality of a car using CAE, and determined the high sensitivity area of the panel outside the door. They found that when the resistor was pasted in this area, the sound quality of door closing was improved. Tian et al. 5 determined firstly the sound source of door closing noise by using the acoustic camera and then optimized the tremor when the door was closed. Hu et al. 6 optimized the door lock, stopper, hinge and sealing strip to improve the sound quality of door closing. Zhu et al. 7 obtained the psychoacoustic objective parameters of door closing samples by grade scoring method, and established the objective mathematical evaluation model of door closing sound quality by fitting regression. Kavthekar and Badadhe 8 analyzed the effects of these parameters, like hinge friction, hinge axis inclination, sealing, latch, and air blind effect, on door closing velocity. They established a mathematical model to evaluate door closing velocity by calculating the contribution of each parameter to energy, and the calculated results were verified by experiments. Champ and Silvestri 9 found that the quality of the numerical results of door slamming depends on the specific simulation method used. Zhu et al. 10 developed a numerical analysis and optimal design method for new sealing with variable cross-section regarding the door panel’s complex 3D profile. Experiment results indicated that it provides an effective method for new door sealing design with variable cross-section. Liang et al. 11 calculated the vibration response of door sheet metal structure according to the collision force obtained and the radiated sound field of infinite element method to reduce the radiation noise of door closing.
In summary, the research on door closing sound quality mainly focuses on its subjective evaluation, objective evaluation and the simulation of door closing vibration and noise. However, in the process of objective evaluation, multi-scheme optimization cannot be implemented, resulting in low research efficiency. In addition, in the simulation analysis of door closing dynamics, the door system and sealing strip are usually simplified, or the experimental data are input as boundary conditions, which will also lead to a slight deviation from the actual results.
In this paper, the door closing dynamics of SUV vehicle was studied by the combined method of simulation and experiment to improve the R&D efficiency of door closing sound quality and reduce the cost. A finite element model of a quarter of car body with the complete structure of door, window and sealing system was established by HyperMesh software. The compression test and tensile test of sealing strip were performed to obtain the material parameters of sealing strip, and the most suitable strain energy function was determined by ABAQUS software. The Y-direction acceleration of the upper corner of the door, the midpoint of the window and the body points on the B-pillar at door closing were studied numerically by ABAQUS. The Y-direction jitter acceleration for the above points at door closing were studied experimentally.
Basic theory of finite element explicit analysis
Finite element analysis
In finite element analysis, the solution region is composed of many small elements (subdomains) interconnected at the nodes. The model provides the piecewise (subdomain) approximate solution of the basic equation. Because the element (subdomain) can be divided into finite elements of various shapes and sizes, it can well adapt to complex geometry, complex material properties, and complex boundary conditions. 12
Finite element analysis, essentially, is to apply the infinitesimal calculus in mathematics to physical simulation. The basic principle of infinitesimal calculus is to divide a continuous function into infinite number of infinitesimal elements, and add them together after calculating and analyzing each micro element.
In physics, infinitesimal elements do not exist, but in finite element analysis theory, infinitesimal elements in calculus are replaced by finite and measurable elements. This method has been widely used after the popularization of computers. Computers can replace manual work to complete complex iterative work efficiently and quickly, and the smaller the size of the divided finite element is, the more accurate the final iterative result will be. 13
Material nonlinear problem
The equilibrium equations expressed by displacement are nonlinear, because the constitutive relationship of the material is nonlinear. Material nonlinear problems can be divided into two types: The first type is the nonlinear elastic. In this case, the relationship between the stress and strain of the material is nonlinear, such as for rubber and plastic, and the deformation process of the material is reversible. The second type is nonlinear elastoplastic. For this case, once the stress in materials exceeds the yield limit, the deformation process of the material will be irreversible. The sealing strip material belongs to the first type. Material nonlinear problems in engineering practice include nonlinear elasticity (including piecewise linear elasticity), elastoplasticity, viscoplasticity, and creep.14,15
Simulation analysis of door-closing dynamics
In this study, a SUV vehicle was selected as sample vehicle, because SUV vehicle is favored by consumers, especially young consumers. The SUV body has a structure with four-doors and two-covers, and the door is sealed with hole sealing strip and side sealing strip. This work mainly focuses on the left front door.
The process of closing door involves rotational movement of door system around the hinge axis, collision between door lock and latch, door and sealing strip, and door opening strip and door system sheet metal. In this process, there is a nonlinear collision of hyperelastic materials, so it needs to be calculated by explicit FEM. 16
Establishment of a car body finite element model
Establishment of a car body model
The finite element model was established by HyperMesh software. Because the structure of car body and door is complex, and it involves explicit dynamic calculation, the model was simplified in order to reduce the calculation time. A quarter of the body in white model was selected, and retaining the complete structure of the door, window and vehicle sealing system. The door system was connected with the body through hinges.
The sheet metal part of the body and door structure was meshed by shell element (S4R element), while the sealing strip and hinge were meshed by hexahedral solid element (C3D8R element). When meshing the finite element model of the door, the middle surface of the sheet metal part was extracted and meshed. However, this method is usually suitable for the sheet metal part with a thickness of less than 10 mm. For the sheet metal part with approximately the same length, width, and height, it is not suitable to use the meshing method through extracting mid-surface. 11
Finally, the mesh was divided, and the mesh size was selected as 8 mm. Except for the solid mesh of motor and hinge, the sheet metal was divided by 8 mm mesh. The finite element model of a car body with the complete structure of door, window and sealing system is shown in Figure 1.
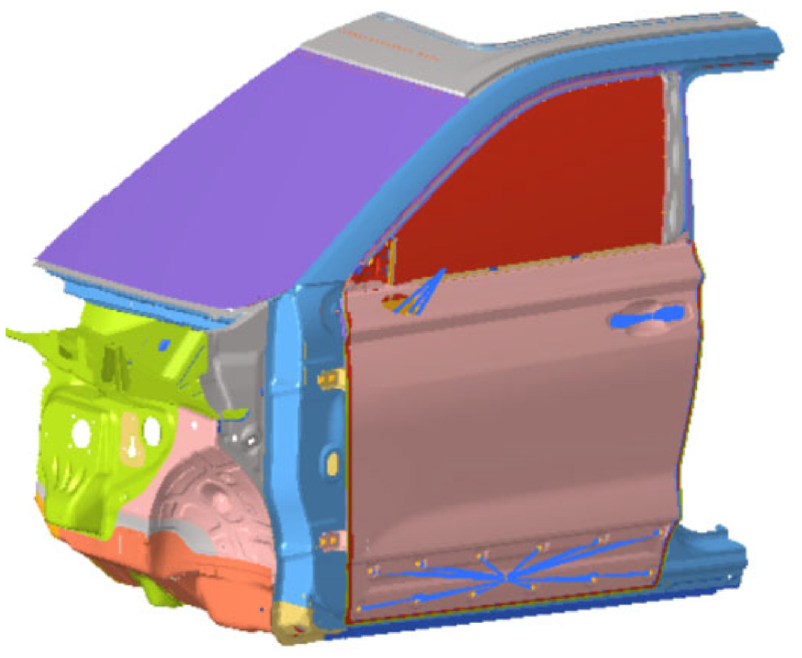
Finite element model of a car body with the complete structure of door, window, and sealing system.
Component connection
In the actual production process, the various components are connected by welding, clinching, bonding, screwing, gluing, etc. After meshing, there is no contact between sheet metal parts. If you want to get accurate simulation results, it is necessary to simulate the connection between sheet metal parts. Generally, when establishing the connection, the spot welding is simulated by ACM (shell gap) element, the weld is simulated by CWELD element, and the adhesive element is simulated by adhesive element. 17
Most sheet metal parts are connected by spot welding, and two-layer welding and three-layer welding are usually used. When simulating spot welding in HyperMesh, the tolerance is set to a value greater than the distance between sheet metal parts, and the welding radius is usually 6 mm, and the number of welding layers is determined. The material properties of welded parts are usually the same as those of steel. Due to the small quality of the welding joint, the material density can be ignored. The welding spots attribute is set to 3D cell. CWELD element is usually used to simulate the weld line between sheet metal. Their materials and properties are the same as welding spots. 18
In addition to welding spots connection, bolt connection is also commonly used for sheet metal parts. Bolt connection is usually simulated by RBE3 element (rigid connection). Another connection is flexible connection which is usually used for the connection of interior, buckle and mass point. The connection is simulated by RBE3 element.
When using RBE2 connection, the element nodes around the bolt washers of the upper and lower layers of sheet metal are connected at one point, and the degrees of freedom in six directions are constrained, the part does not move or rotate in any direction.
Establishment of sealing strip model
The sealing strip materials and manufacturing methods used by various automobile manufacturers are different, so the properties and material parameters of the sealing strip should be tested before simulation to ensure the accuracy of the simulation.
Before the compression test of the sealing strip, the sealing strip was divided into body side and door side. The sealing strip on door side was divided into five sections, including ROOF section, hinge section, threshold section, door lock section and door opening section, and several small sections with a length of 10 mm were cut out from each section for standby.
Compression test of sealing strip
The CLD test bench of sealing strip is shown in Figure 2.
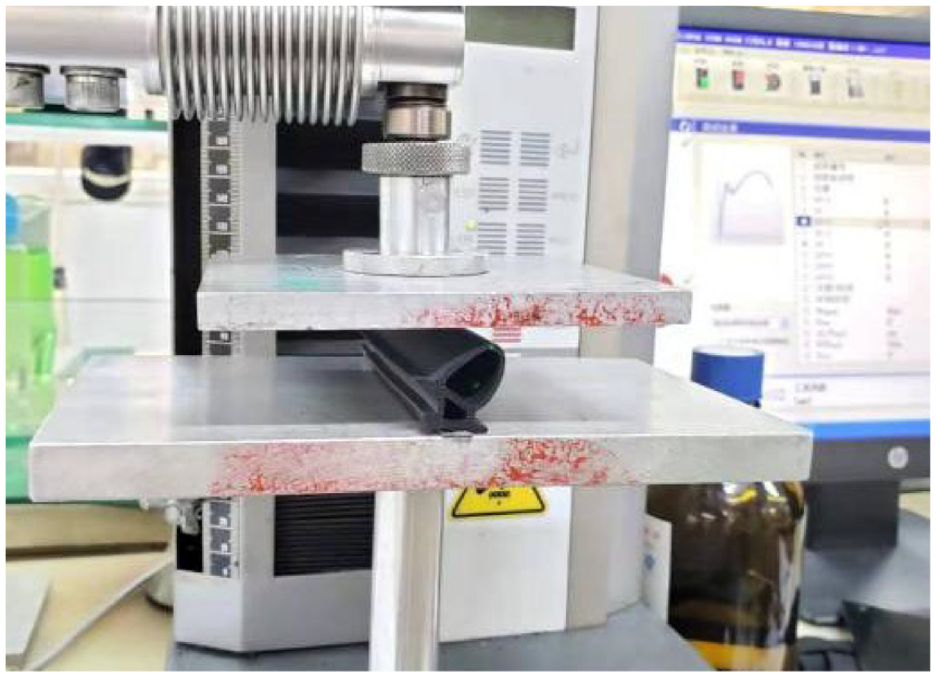
CLD test bench of sealing strip.
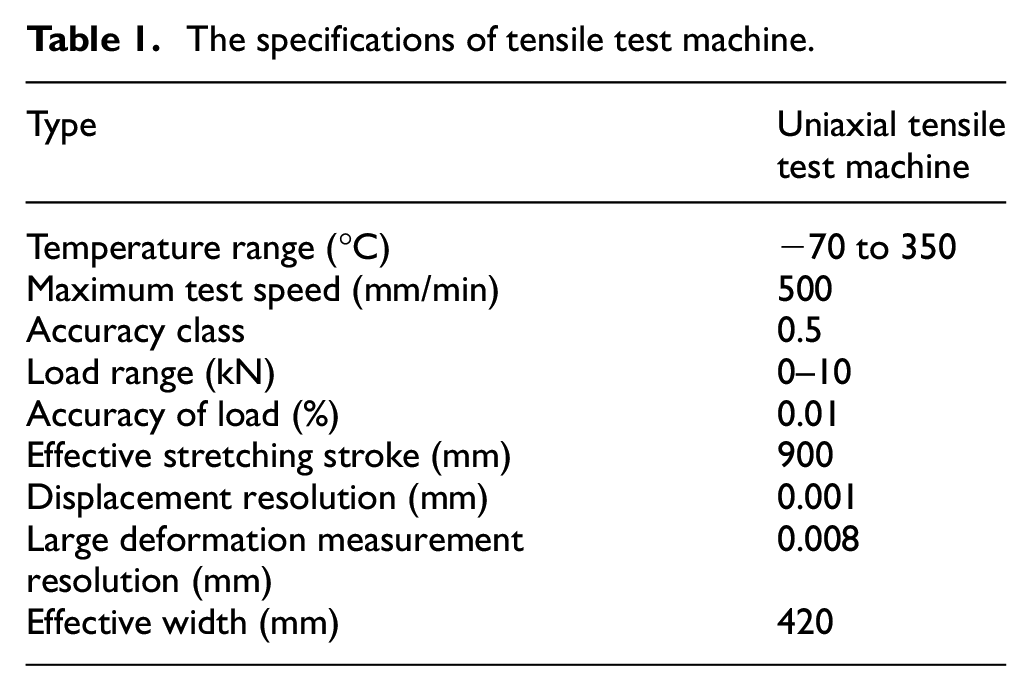
The specifications of tensile test machine are shown in Table 1.
The specifications of tensile test machine.
The sealing strip sample with a length of 10 mm was installed into the clamping apparatus. The sealing strip should be preloaded for three times before the formal test to ensure the data consistency in the formal test. The displacement of compression is 8.5 mm, and the compression speed is 10 mm/min. The formal test should be conducted for five times, and the measured values should be averaged. The CLD test curve is shown in Figure 3.
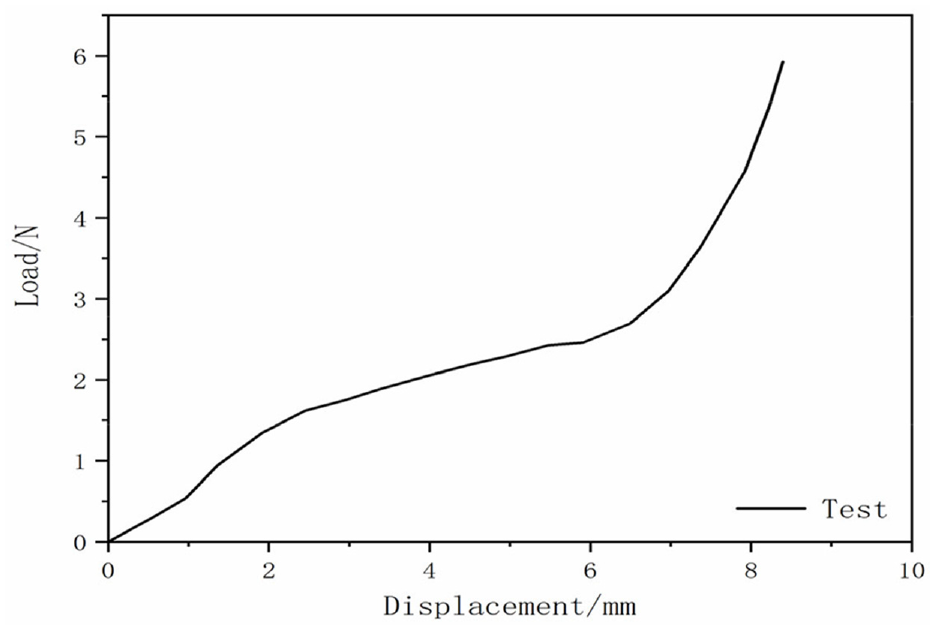
The CLD test curve of sealing strip on the body side.
Tensile test of sealing strip
According to the standard GB/T 21282-2007 (Chinese), five original sealing strips were cut into dumbbell shape with a cutting machine, as shown in Figure 4. 19 The length C of the middle section of the sample is 25 mm.
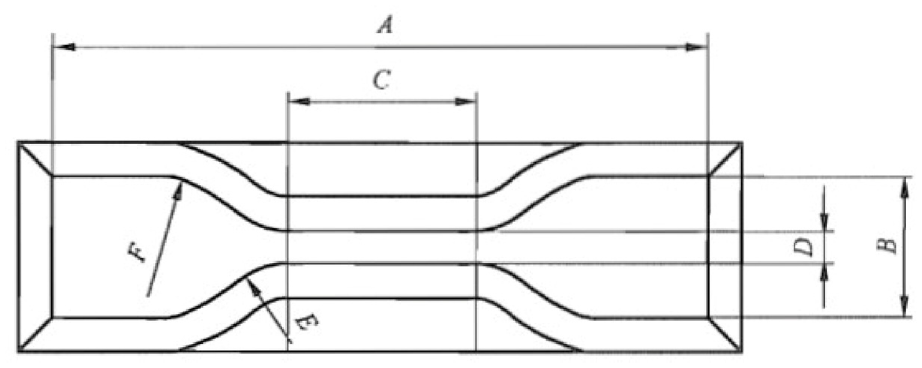
Geometry of dumbbell-shaped sealing strip.
The stress-strain test of the sealing strip was performed on a uniaxial tensile testing machine. The upper and lower parts in the middle of the sample were clamped respectively on the upper and lower grippers of the tensile testing machine. 20 A rubber tension extensometer sensor was installed on the inner side of the upper gripper to measure the stress-strain value of the sample.
During the experiment, the lower gripper was fixed and the upper gripper moved upward at a speed of 500 mm/min ± 50 mm/min until the narrow part of the sample was broken. It should be pointed out that during the test, the sample must be broken in the narrow part, otherwise the result is invalid and the test needs to be repeated. The average values of five groups of the tensile stress-strain data of the sealing strip was selected as the input parameter of simulation to fit the material parameters.
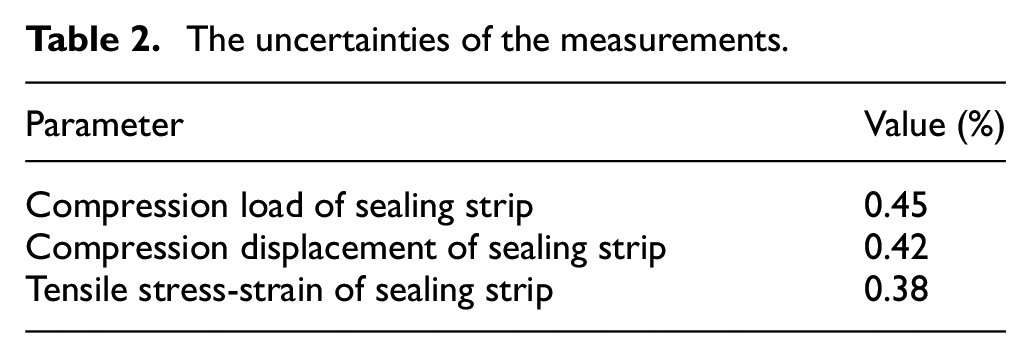
The measurement values were evaluated using the uncertainty analysis method in reference. 21 The measurement uncertainty is shown in Table 2. According to the uncertainty analysis results, the experimental data error is controlled within 5%, and the measurement results are acceptable.
The uncertainties of the measurements.
Fitting of material parameters of sealing strip
Load-displacement values by compression test and the stress-strain values by tensile test were input into the hyperelastic material setting in ABAQUS for evaluating a variety of strain functions. The deformation behavior of sealing strip is usually expressed by strain energy function. The common strain energy function models include Neo-Hookean, Mooney-Rivlin, Ogden, Arruda-Boyce, Gent, Yeoh, Blatz-Ko, and so on. The strain energy function models used in this study are Ogden and Mooney-Rivlin functions. Figure 5 shows the comparison between the various fitting curves and experimental curve.
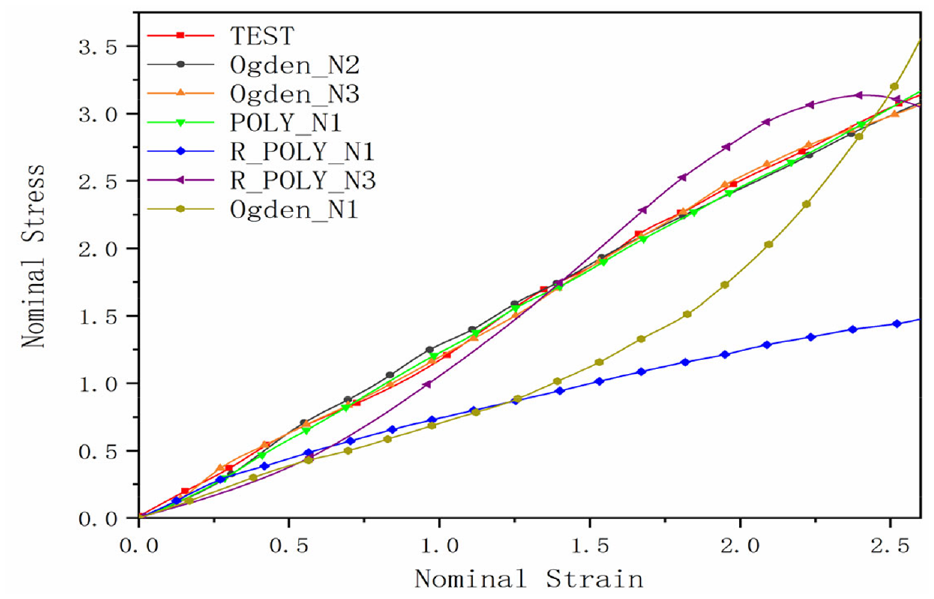
Comparison of fitting curves of strain energy functions with experimental curves.
Through the comparison with the test data, it was found that the Ogden3 function is the most suitable strain energy function due to its highest correlation with the experimental data.
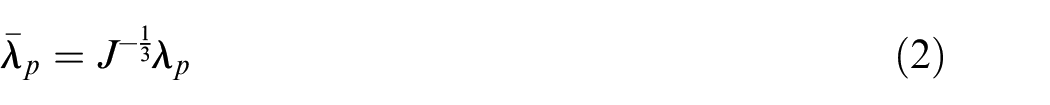
The strain energy potential function of the Ogden model is based on the principal elongation of the left Cauchy-Green strain tensor, which can be calculated using equation (1):
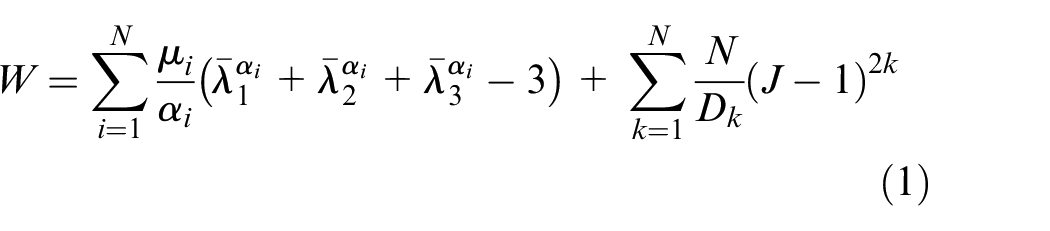
Among them, N is the order of the model, and usually N takes the number between 1 and 3.
From this strain function, it can be seen that the variables of the Ogden model are the principal elongation, and strain tensors in three directions
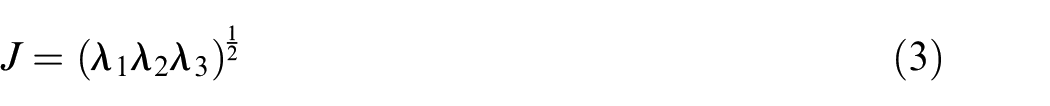
The strain energy function parameters are shown in Table 3, where “I” is the order of the function model, “Mu” is the shear modulus, “Alpha” is the strain hardening index, “D” is the compressibility parameter,

Parameters of strain energy function obtained by fitting.
Where “μ” is Poisson’s ratio
The parameters are used as the main material parameters input into the compression simulation of sealing strip.
CLD simulation of sealing strip
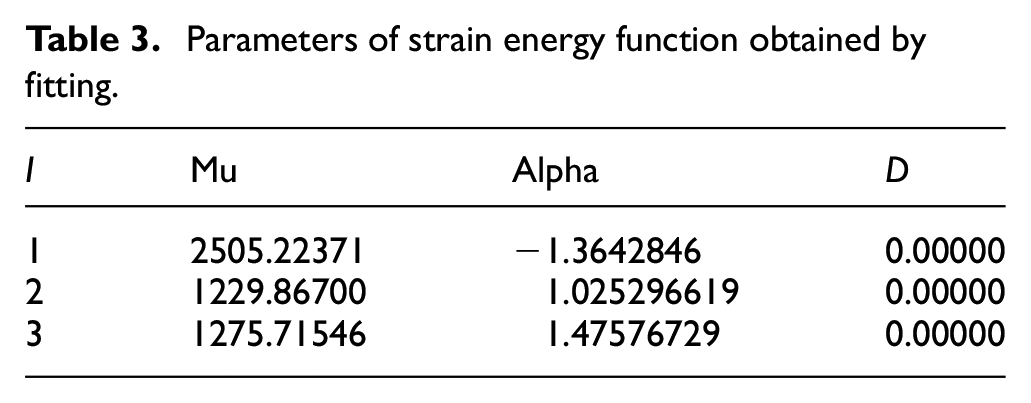
The material parameters of sealing strip, the contact and boundary conditions were set in HyperMesh. The sealing strip model was introduced into ABAQUS, as shown in Figure 6. The model uses the door opening strip for simulation. The upper and lower ends are rigid flat plates without deformation. The lower half of the sealing strip is constrained by six degrees of freedom to limit its displacement, and the bubble tube part of the upper half is compressed by the steel plate to produce deformation.
CLD model of sealing strip.
A simulation of reaction force and compression displacement on the sealing strip was performed by ABAQUS to generate the sealing strip CLD curve. The comparison of calculated and measured CLD curve of sealing strip is shown in Figure 7.
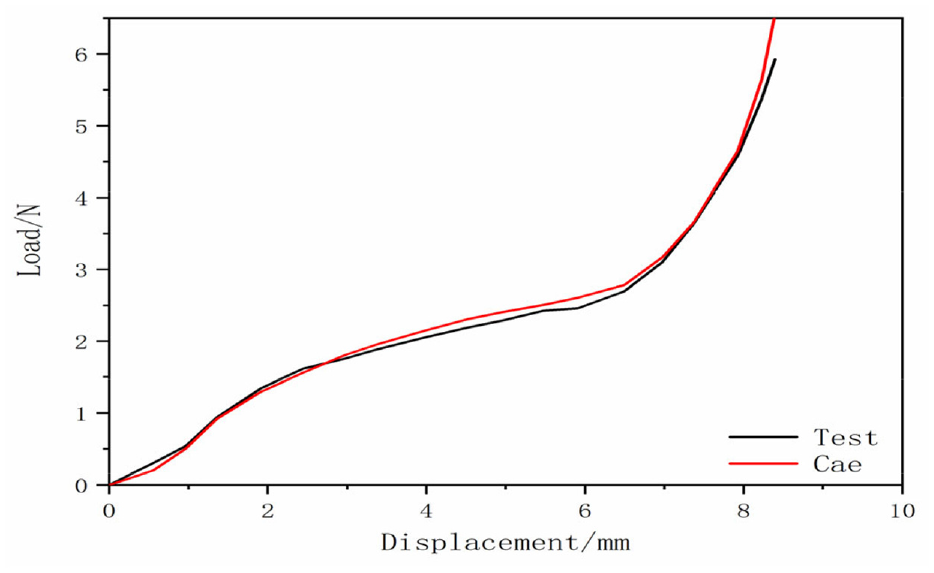
Comparison of calculated and measured CLD curve of sealing strip.
The trend of CLD curve obtained by simulation is basically consistent with that obtained by test. The maximum error between calculated data and measured data is 1.78%, and the error is within the acceptable range. Therefore, the material properties of the sealing strip set are close to the reality, and they can be added to the door closing dynamic model.
Simulation of door closing process dynamic
Boundary condition setting
At the plate truncation, six-degree of freedom constraints were applied to each element node. The door opening angle was set to 5°, and the initial closing speed was set to 1.27 rad/s. The door rotation radius is about 0.95 m. Through the conversion of angular velocity and linear velocity, the initial linear velocity of door closing is about 1.2 m/s, which is consistent with the speed requirements of the test. In calculation, the time step is 0.02 s. The contact between the sealing strip and the sheet metal, the buffer block and the sheet metal, and the door lock and the latch are all set as unit universal contact.22,23
Dynamic simulation
The finite element model was introduced into ABAQUS for calculation. As shown as Figure 8, the acceleration of door closing process for the three specified points, including the upper corner of the door, the midpoint of the window and the body points on the B-pillar, were simulated.
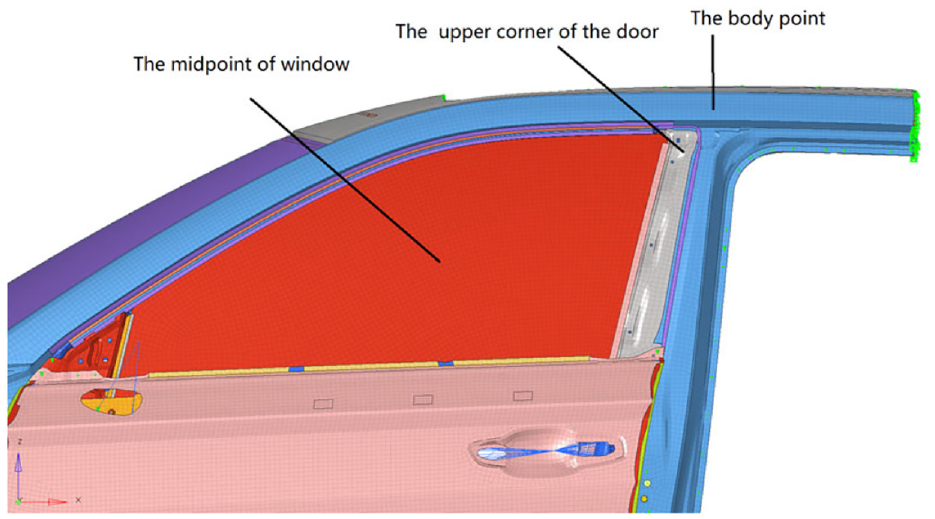
Output point diagram of simulation analysis.
According to the coordinate system of the whole vehicle, the direction X, Y, Z were defined respectively as the rightward direction from the driver, the backward direction from the driver, and a vertical upward direction from the driver.
Figure 9 shows the Y-direction acceleration of door closing process for the three specified points such as the upper corner of the door, the midpoint of the window and the body points on the B-pillar.
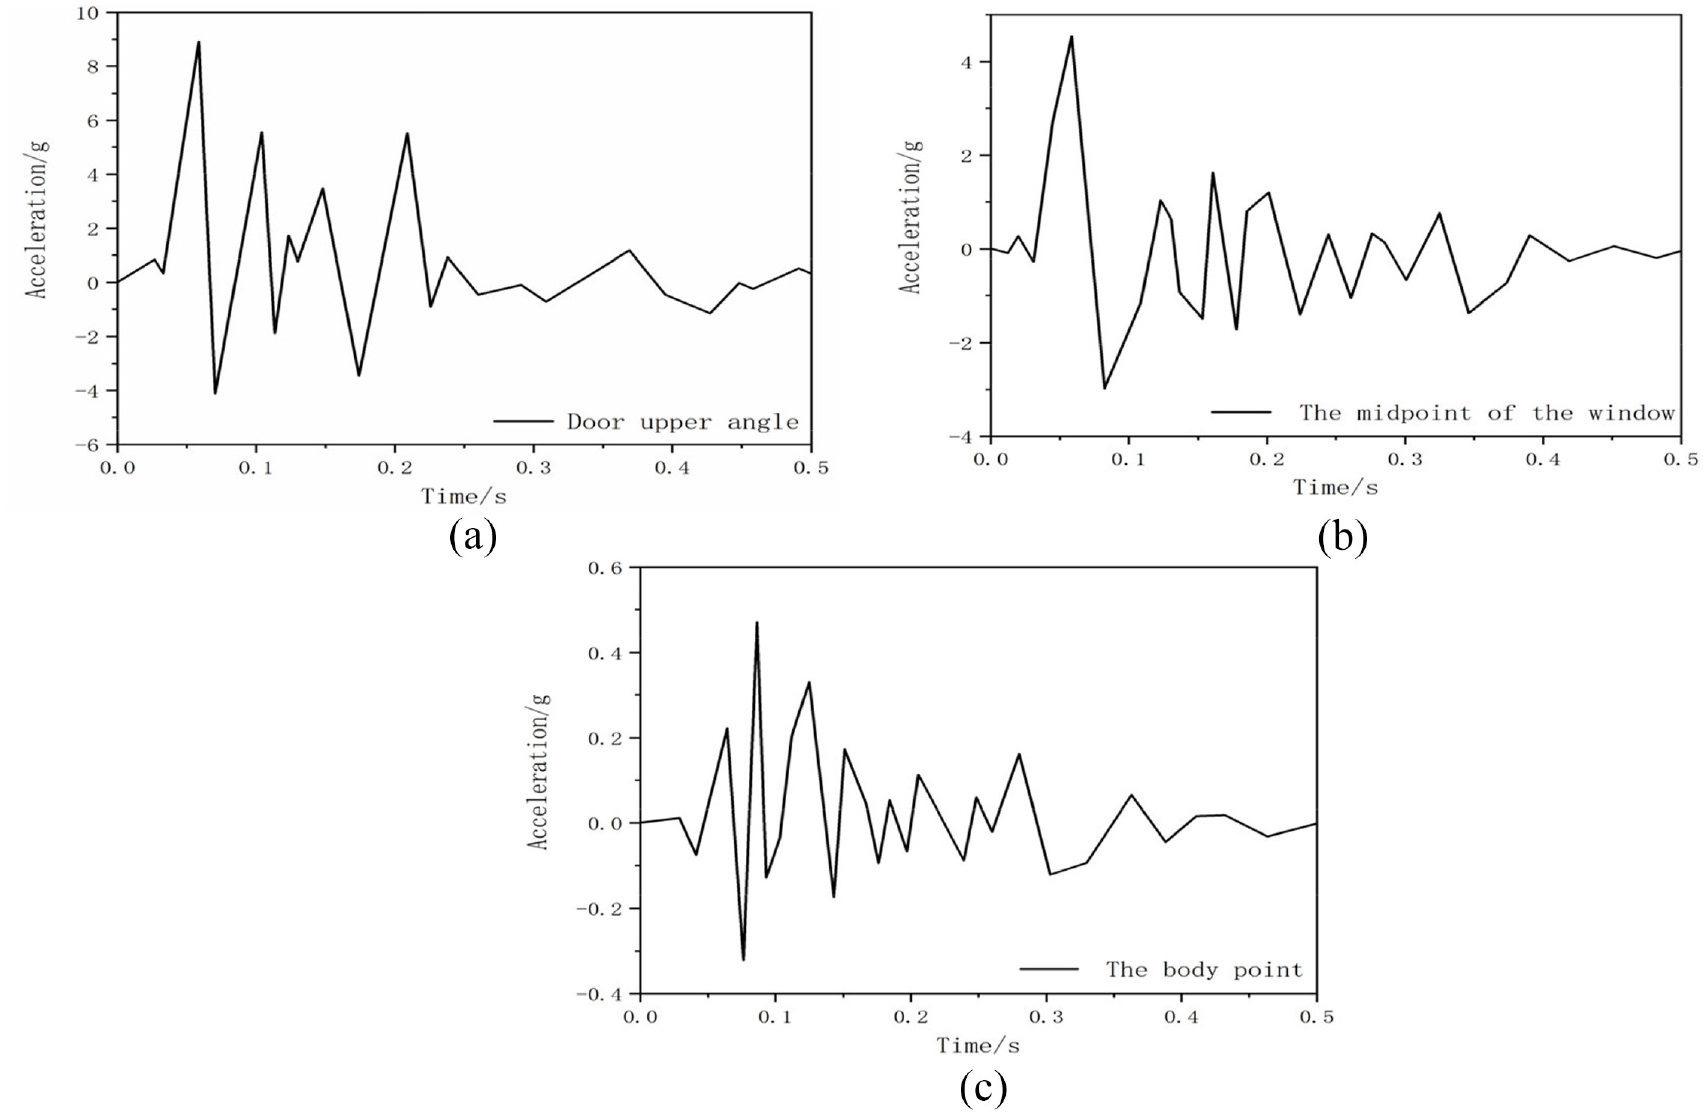
The Y-direction acceleration of door closing process for three specified points: (a) at upper corner of front door, (b) at midpoint of window, and (c) at body point on B-pillar.
It can be seen from the figure that the closing acceleration at the upper corner of the door is the largest, the jitter amplitude is the most obvious, the acceleration at the body point on B-pillar is the smallest, and the jitter amplitude is the smallest.
Jitter test at door closing
Jitter test system at door closing
In the evaluation of door quality, the jitter test of door closing is also an important one. The output data of jitter test of door closing is the acceleration during door closing. Door structure, sealing strip structure, door lock structure, latch installation position, limiter, hinge connection mode, etc. may have an impact on the instantaneous acceleration of door closing, and the value of door closing jitter can indirectly reflect the quality of vehicle door closing. If the acceleration attenuation is fast after the vehicle door closing, it means that the vibration attenuation caused by the vehicle door is fast, which produces less vibration noise. Therefore, the door closing jitter test also indirectly verifies the quality of door closing sound.
The test system includes the test environment, object, sensor, and data acquisition system.
Test environment
The door closing jitter test may be conducted in the semi-anechoic room, because the background noise does not have a great impact on the test data. The test was carried out in an open field with room temperature of 25°C and relative humidity of 35%.
Sensors and data acquisition system
Accelerations at the three spots (the upper corner, the midpoint of window and the body spot) were measured with three-direction piezoelectric acceleration sensors (PCB 356A16), and input into a 32-channel data acquisition system (Simcenter SCADAS). The sensor sensitivity is shown in the Table 4.
Sensor sensitivity.
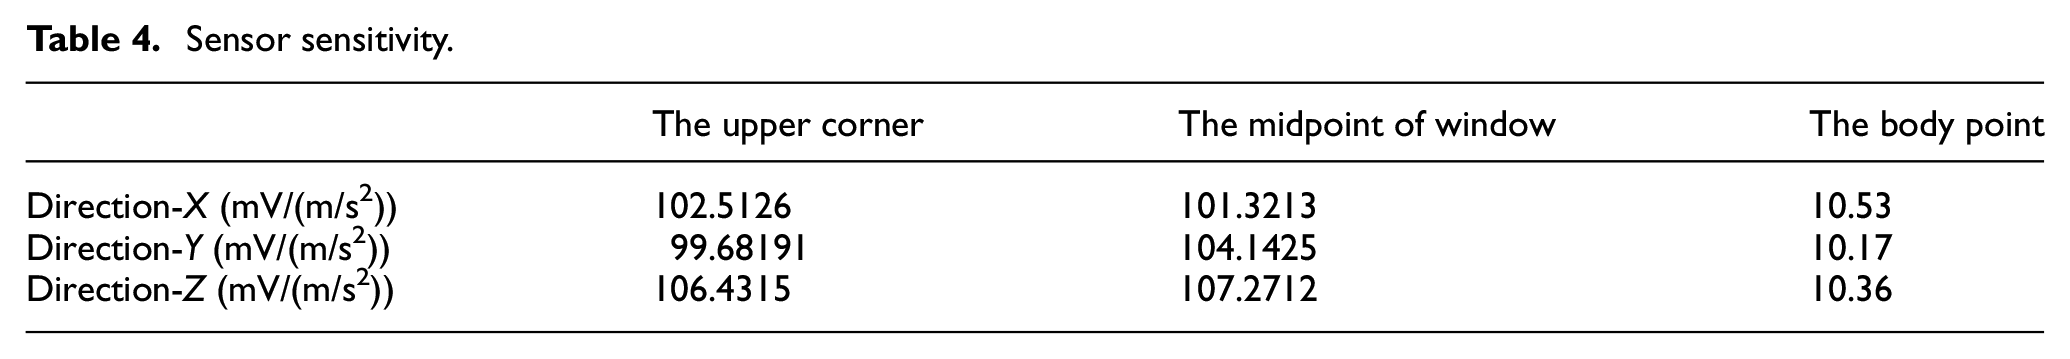
The acceleration unit set by data acquisition is m/s2. The sampling frequency is set to 100 Hz. Single test duration is 10 s.
Test method and working condition
The test vehicle was parked on a flat and open space, and a closing speed meter was placed near the right front door lock to test the closing speed.
The PCB three-way acceleration sensors were respectively arranged at the upper corner of the door, the midpoint of the window and the body point above the B-pillar, and the acceleration sensors were fixed on the body with glue or wax. The X, Y, Z-direction acceleration data of the above three spots were measured and input into LMS test lab software.
When the window was fully closed, the door closing jitter test was carried out at a door closing speed of minimum, 1.0 and 1.2 m/s, and the test was conducted for 3–5 times for each closing speed to ensure the consistency of test data. The test time was set to 10 s, and it is necessary to control the large-scale vibration generated by opening the door immediately after closing during the test to ensure the accuracy of the test results. The scene of jitter test of door closing is shown in Figure 10.
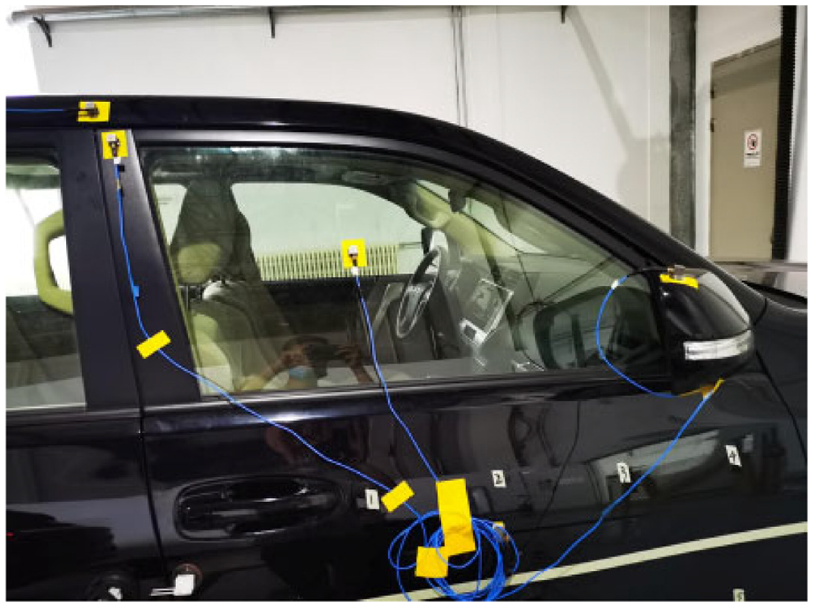
Scene of jitter test at door closing.
Results and analysis of jitter test of door closing
In the development of vehicle door closing quality, the door closing jitter of the left front door is representative. The evaluation items of door closing jitter are divided into three items: window jitter, front door corner jitter and body part jitter on B-pillar. The sensors used in the test are 3 three-direction acceleration sensors, so it is necessary to select representative a direction for result analysis.
Figure 11 shows that the Y-direction jitter acceleration for three specified points at door closing such as the upper corner of the front door, the middle point of the window and the body part on the B-pillar, respectively.
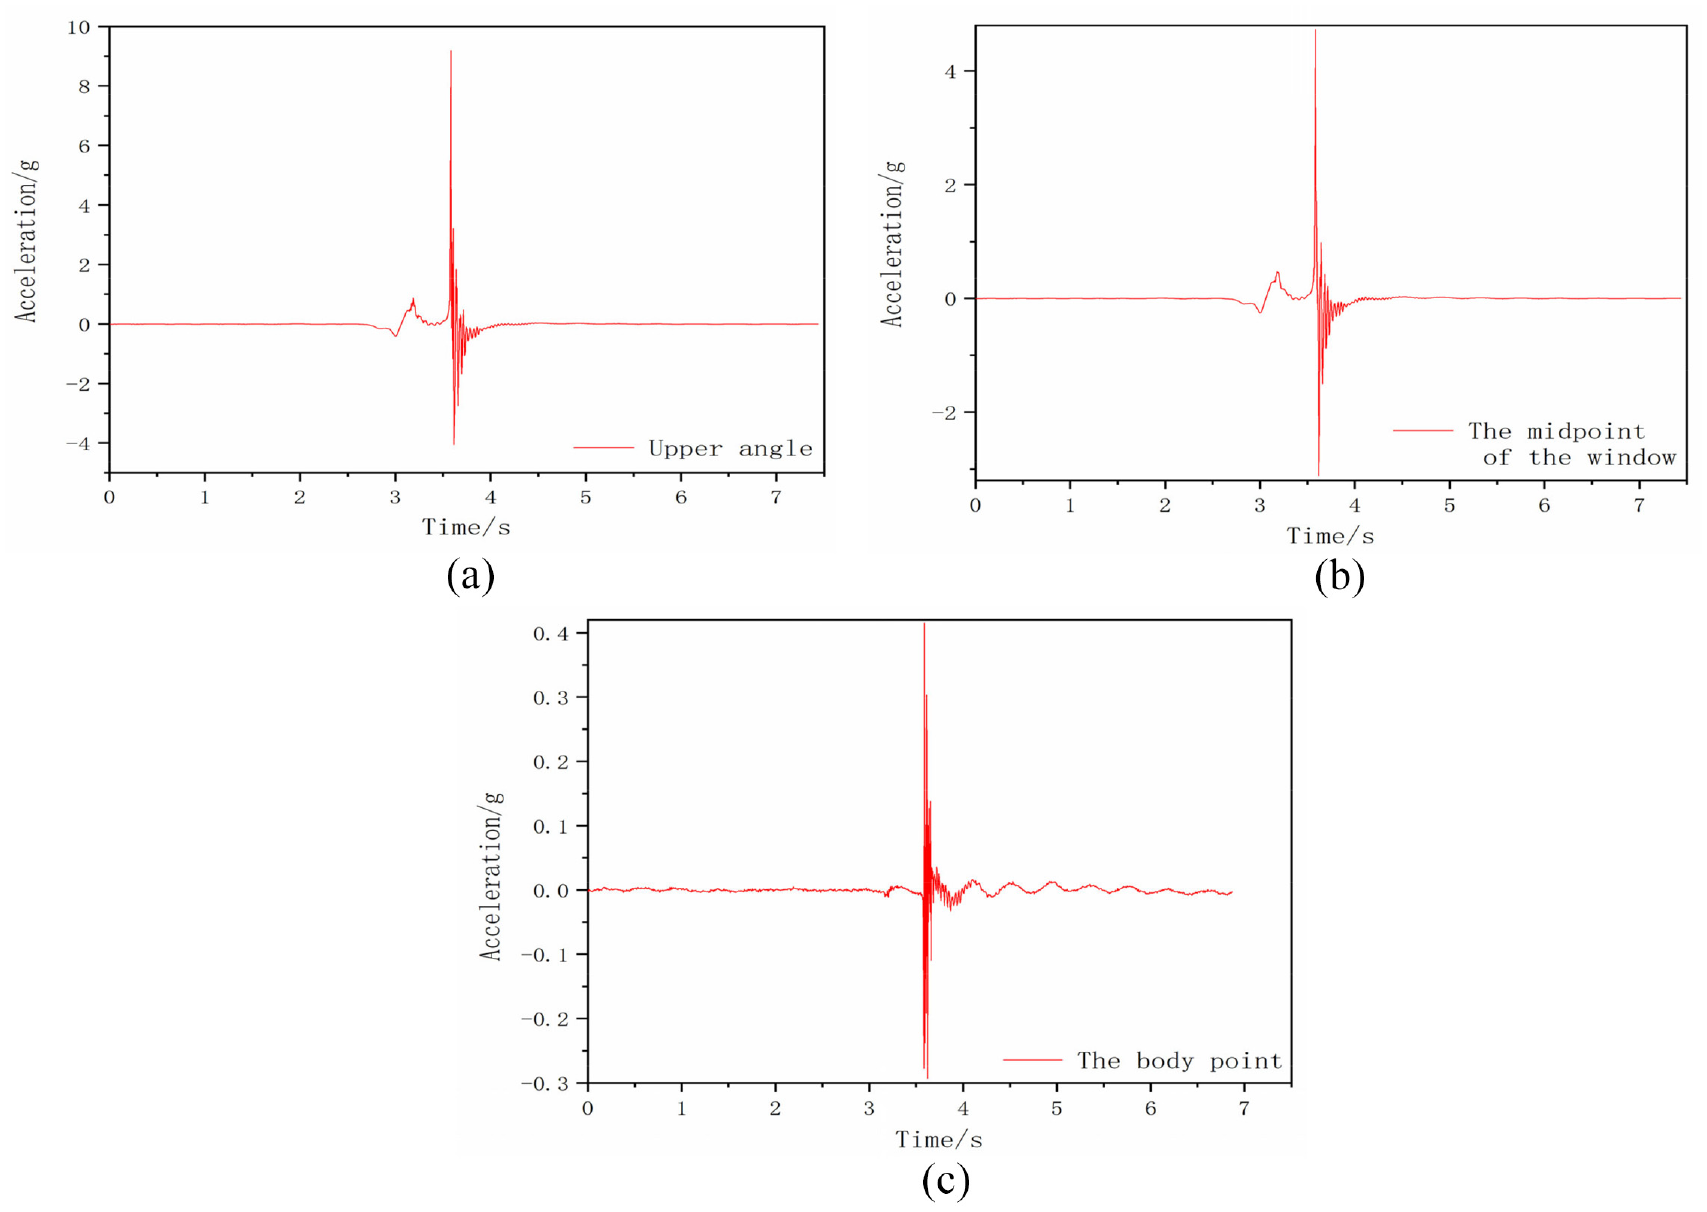
The Y-direction jitter acceleration for three specified points at door closing: (a) at the upper angle of front door, (b) at the midpoint of the window, and (c) at the body point on the B-pillar.
Figure 12 shows that the comparison of calculated and measured Y-direction jitter acceleration for three specified points, such as the upper corner of the door, the midpoint of the window and the body points on the B-pillar, at door closing. From Figure 12, it can be seen that the maximum Y-direction jitter acceleration values for three specified points at door closing are close to the test values, the maximum relative errors at door upper corner, window midpoint, and the body point on the B-pillar are 2.44%, 1.62%, and 5.13%, respectively. The relative error of maximum negative acceleration is 3.56%, 2.91%, and 5.43%, respectively. The acceleration attenuation trends and the time when acceleration decays to a stable value are consistent, which shows that this simulation method can be used to simulate the door closing acceleration.
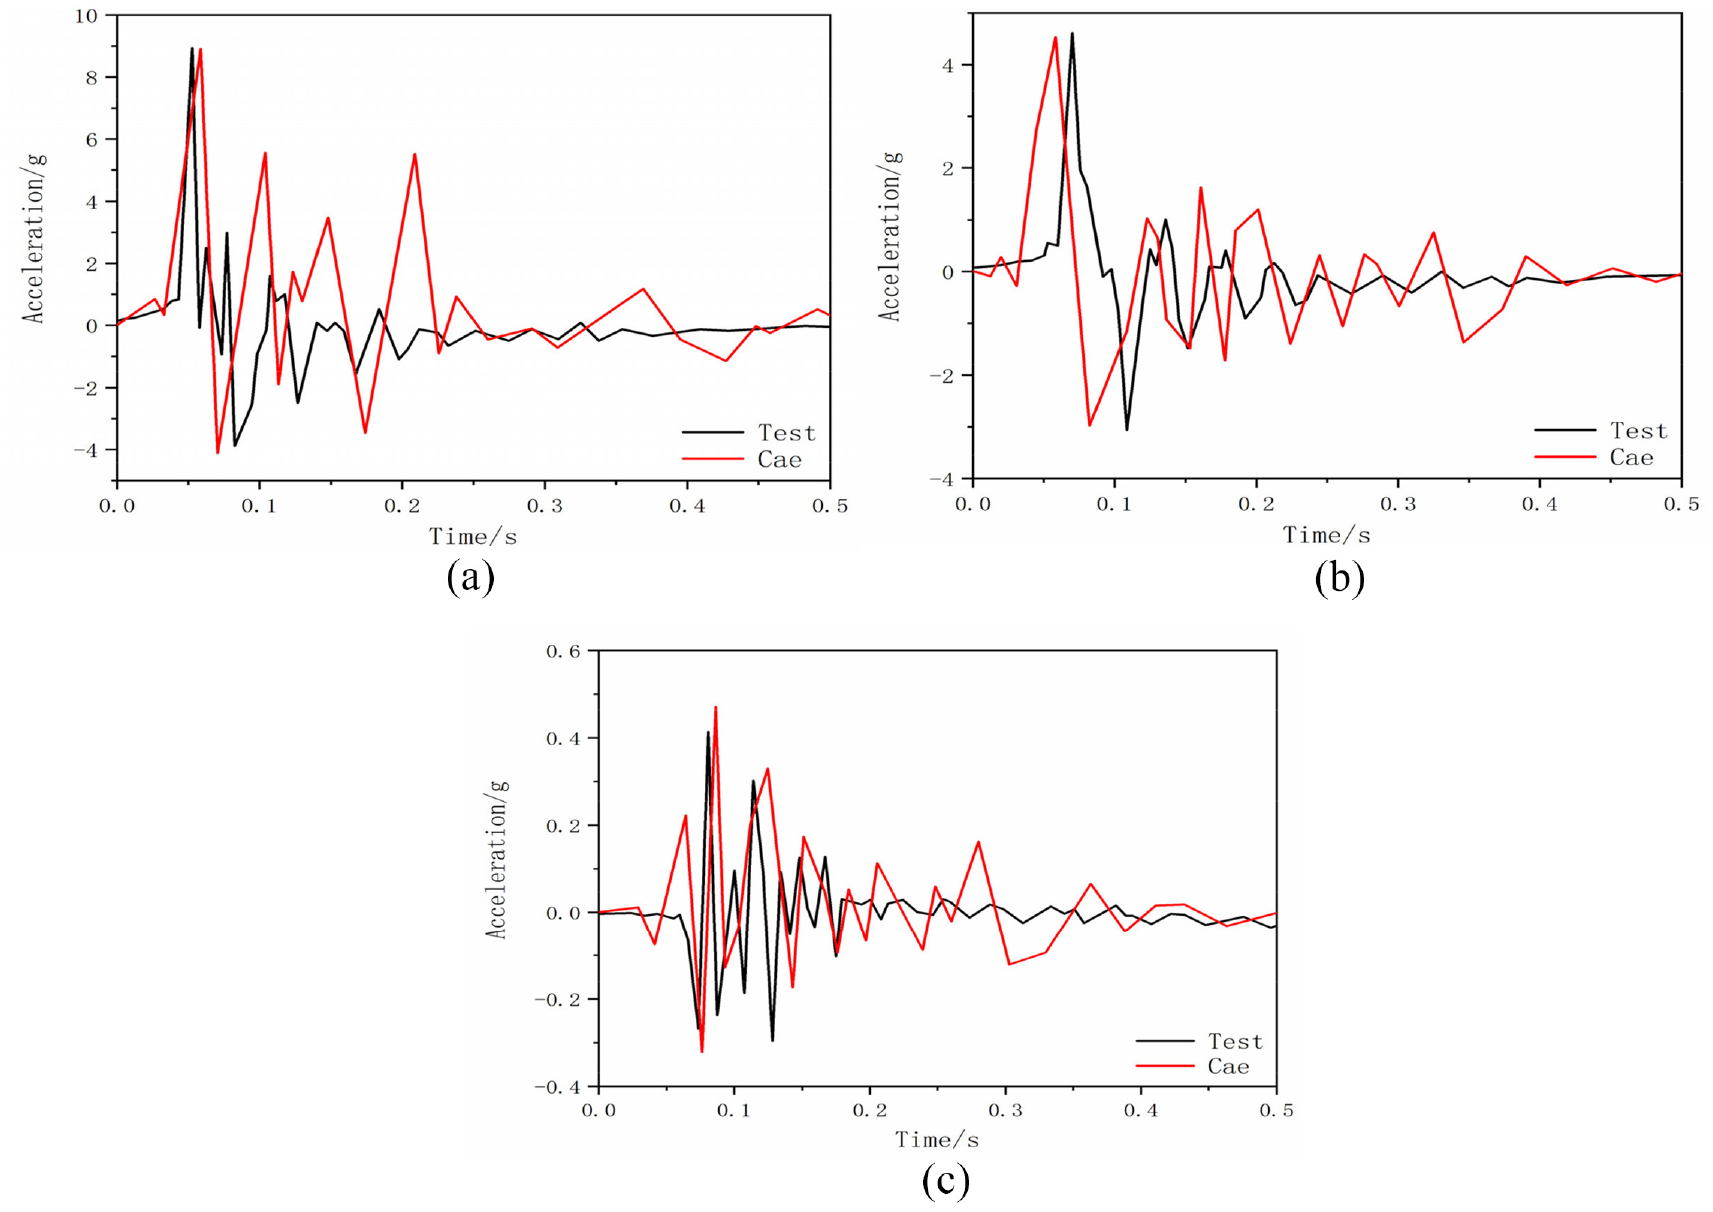
Comparison of calculated and measured Y-direction jitter acceleration for three specified points at door closing: (a) at the upper corner of front door, (b) at the midpoint of the window, and (c) at the body point on the B-pillar.
Conclusion
The prediction of a car door sound quality in the early stage of design are of great significance for reduction of the cost and improvement of the efficiency. In this study, the door closing dynamics of a SUV vehicle was investigated numerically. The numerical results were validated by experimental data. Some of the results of this research are summarized below:
A finite element model of a quarter of car body with the complete structure of door, window and sealing system was established by HyperMesh software.
The material parameters of sealing strip obtained from compression test and tensile test were input into the hyperelastic material setting in ABAQUS to evaluate various strain functions. The results showed that the Ogden3 function is the most suitable strain energy function because it has the highest correlation with the experimental data.
The Y-direction acceleration of the three specified points at door closing were studied numerically using ABAQUS. The results showed that it is the largest at the upper corner of the door, while it is the smallest at the body point on B-pillar.
The Y-direction jitter acceleration at three specified points at door closing were studied experimentally. The results showed that the calculated values of maximum Y-direction jitter acceleration at three specified points at door closing are close to the test values with the same the acceleration attenuation trend.
The door speed fluctuation caused by the presence of limiter should be further considered in the door closing dynamics study. The door lock with a ratchet, pawl, spring, etc. needs to be modeled to improve the calculation accuracy. The contact area and the changes of the thickness of the sealing strip should be considered in the study of door closing dynamics.
Footnotes
Appendix
Acknowledgements
The authors express thanks to the China Automotive Research Center for technical support. We would also like to express our special gratitude to Li Junquan for his revision of the language.
Declaration of conflicting interests
The author(s) declared no potential conflicts of interest with respect to the research, authorship, and/or publication of this article.
Funding
The author(s) disclosed receipt of the following financial support for the research, authorship, and/or publication of this article: This work was supported by the National Natural Science Foundation of China (Grant Number 51876145) and the Natural Science Foundation of Tianjin City (Grant Number 16JCTPJ C48700).