
Abstract
The failure phenomenon of automotive components within the service life is one of the most concerning issues in the automotive industry. In this paper, the concept of deformation gradient is introduced into the CAE simulation results to obtain the critical strain of the component under large deformation conditions. Subsequently, a complete quasi-static failure prediction method combined with the Johnson-Cook criterion is proposed. In addition, considering the cyclic hardening effect of the components’ material, the subcritical plane model is improved based on the Fatemi-Socie model to make the fatigue life prediction more accurate. According to the assembly relationship of the McPherson front suspension system, the proposed method and the improved model are used to predict the failure of the steering knuckle. Finally, the predicted results are compared with the rig test results. The comparison results validate the applicability and accuracy of the proposed quasi-static failure prediction method and fatigue failure prediction model.
Keywords
Introduction
The front suspension system supports the vehicle’s weight by connecting the chassis frame and the axle, absorbing the vibration caused by the wheels. 1 With the increasing requirements for comfort and handling, consumers have a higher demand for the performance of the automotive suspension system. Currently, designers are committed to making suspension components lighter and more cost-effective while ensuring vehicle safety. Lightweight suspension components conform to the trend of energy-saving and emission reduction in the automotive industry and improve vehicle handling performance. The steering knuckle is one of the most critical components in the front suspension system. Its function is to transfer and bear the front load of the automotive, support and drive the front wheel to rotate around the kingpin to make the vehicle steer. According to the assembly relationship of the steering knuckle in the front suspension system, the steering knuckle needs to bear the load and torque caused by collision, braking, and acceleration. Therefore, it is required to have high static strength and fatigue strength. Traditionally, steering knuckles are made of ductile iron. But in recent years, most luxury brands have adopted aluminum alloy steering knuckles to reduce unsprung mass. Although this increases the manufacturing cost of the steering knuckle, it can achieve the lightweight goal and increase the service life of chassis components.
According to the traditional strength design of automotive, it will inevitably lead to the one-sided pursuit of high yield strength of alloy materials. However, with the increase in yield strength of materials, the fracture strength decreases, resulting in a decrease in vehicle safety. In recent years, some automotive research institutes have taken the equivalent plastic strain (PEEQ) as a standard for components to meet the required fracture strength. To study the fracture mechanism of the steering knuckle, Huang et al. 2 conducted a large number of quasi-static tests on the E-grade cast steel steering knuckle. The test results show that ductile fracture is still the main reason for the failure of the steering knuckle. Dai et al. 3 proposed a new phenomenological damage model with strain rate and temperature terms to predict quasi-static failure. The predicted results show that the damage value of the component increases with the increase in temperature. In recent years, subroutines incorporating finite element (FE) commercial software have become an essential means of evaluating the fracture behavior of components. Xiang et al. 4 implemented a displacement-based quasi-static prediction model into ABAQUS through the user’s subroutine. Then he realized the damage evaluation of high-rise steel frame structures under ultimate loads. Ji et al. 5 et al. applied the improved MMC model to LS-DYNA for numerical simulation to describe the anisotropic yield and hardening behavior of 6061-t5 aluminum alloy. Lee et al. 6 proposed a constitutive model to describe the elastic-plastic behavior of the aluminum alloy under large deformation. Subsequently, the constitutive model was implemented into ABAQUS to predict the component’s initial failure and plastic deformation characteristics in the large deformation range. Peterson et al. 7 established a constitutive model for 7085-T711 aluminum alloy and used ABAQUS/ Implicit to predict the mechanical behavior. Subsequently, the accuracy of the constitutive model was verified by experiments. Xue et al. 8 used an extended Gurson constitutive model to predict the quasi-static failure behavior of alloys under tensile-torsional conditions. García-Guzmán et al. 9 proposed a model for calculating the relative displacement of elements and then applied the model to ABAQUS for two-dimensional analysis. Finally, the model’s applicability for predicting the fracture behavior of mechanical components was confirmed.
In the vehicle’s overall structure, the joint area is where the component connects and transfers the load. Because of the stress concentration near the joint area, the area is usually the weakest part of the system, which leads to the initiation of fatigue cracks. The existence of fatigue cracks will weaken the NVH performance of the vehicle and cause safety hazards. Therefore, the fatigue life of these components must be designed based on an accurate fatigue prediction model. The Fatemi-Socie (FS) life prediction model 10 based on the critical plane method has been widely used in recent years. The model takes the alternating strain as the main factor of fatigue crack initiation, better explaining the effects of normal stress and shear stress on fatigue damage. Gates and Fatemi 11 improved the FS model by multiplying the normal stress and strain terms. Then he proved that the strain-based FS model could provide a good fatigue life correlation for various materials and load conditions. However, parameters based on stress or strain terms cannot reflect changes in material constitutive behavior when performing fatigue failure analysis. On the other hand, Li et al. 12 predicted the fatigue life of metallic materials under non-proportional loading based on the critical plane method. The comparison with experiments confirmed the accuracy of the prediction model but found that it could not explain the cyclic hardening effect. The analysis of the critical element is crucial for predicting the fatigue life of components using the critical plane method. Using the three-dimensional stress tensor component of the critical element to calculate the equivalent stress, Kashyzadeh et al. 13 analyzed the fatigue life of automotive components under variable amplitude loads. Zhao et al. 14 proposed the subcritical plane method based on the critical plane theory. Then he confirmed that the accuracy and stability of the proposed model are better than the traditional model. Kadhim et al. 15 proposed a damage model based on FORTRAN and combined it with finite element software to predict the fatigue life of components. Qin et al. 16 and Esmaeili et al. 17 revealed the influence of preload on the fatigue strength of aluminum alloy bolted joints through multiaxial fatigue analysis and experiments. Zoroufi and Fatemi 18 studied the fatigue behavior of the steering knuckle by using the local strain life prediction method combined with the fatigue test. The research results show that combining the local strain model with the CAE simulation results can provide more accurate life predictions.
In this paper, a quasi-static failure prediction method is firstly proposed based on the deformation gradient concept. The method combines the Johnson-Cook (J-C) constitutive model and failure criterion, which is suitable for failure prediction of components under large deformation. Subsequently, the subcritical model is improved regarding the form of the FS model. The improved model considers the material cyclic hardening effect’s influence and obtains more accurate fatigue failure prediction results. Finally, taking the steering knuckle as the research object, a series of rig tests are designed to validate the applicability and accuracy of the proposed quasi-static failure prediction method and fatigue failure prediction model.
Failure prediction models of the steering knuckle in the McPherson front suspension system
As shown in Figure 1, the McPherson front suspension system described in this paper consists of a steering knuckle, a tie rod, a lower control arm, a brake caliper, and a shock absorber.
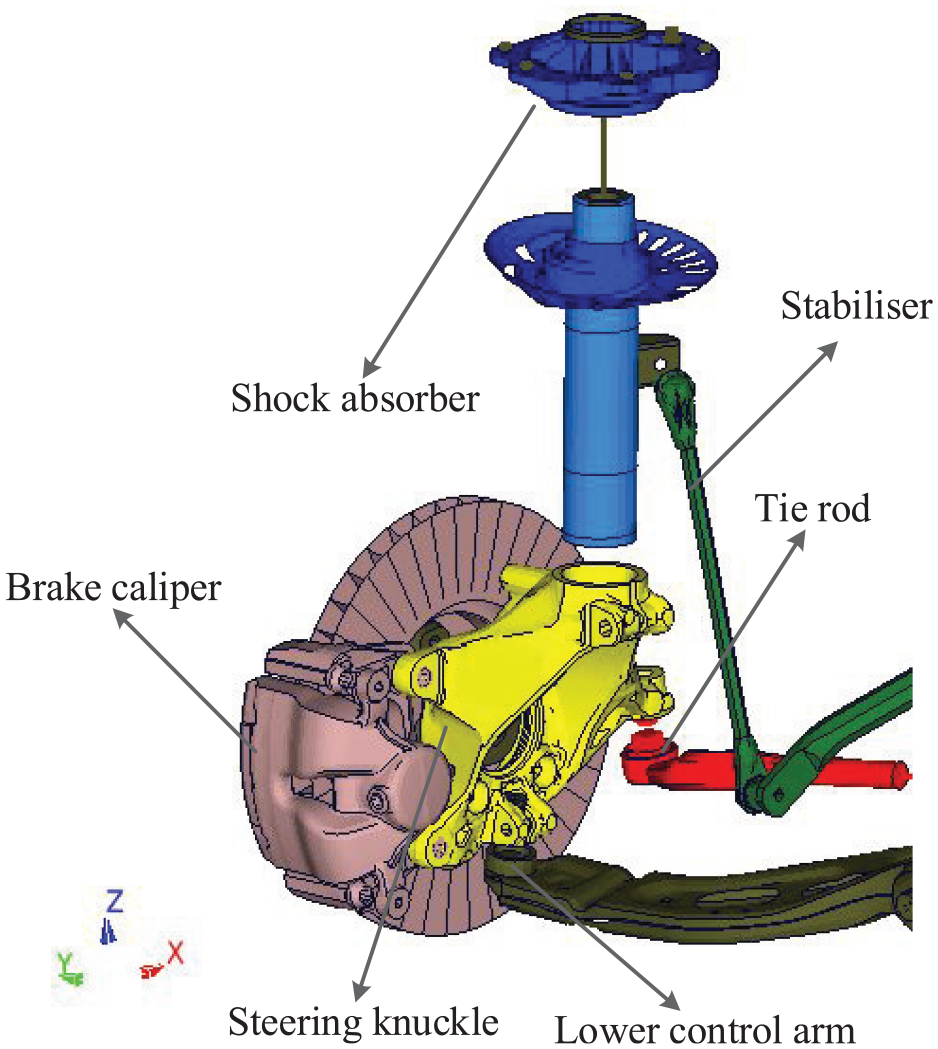
The assembly relationship of the steering knuckle in the McPherson front suspension system.
When the suspension deformation causes the components to bounce relative to the frame, the tie rods and lower control arms move relative to the steering knuckle. The ball studs are used to connect the components above to avoid movement interference. The upper end of the shock absorber is connected with the frame hinge, and the lower end is connected with the steering knuckle. In this section, the failure prediction models suitable for the steering knuckles will be proposed.
Quasi-static failure prediction model
As shown in Figure 2, take a connection mode of the steering knuckle in the front McPherson suspension system as an example. The ball stud of the steering knuckle realizes the power transmission between the different axles. It provides multi-angle rotation to make the steering mechanism rotate smoothly and reduce the vibration. Therefore, the connection areas between the steering knuckle and the ball stud bear a heavy load during operation, which is more prone to quasi-static failure. Therefore, this paper will first propose a quasi-static failure prediction method.
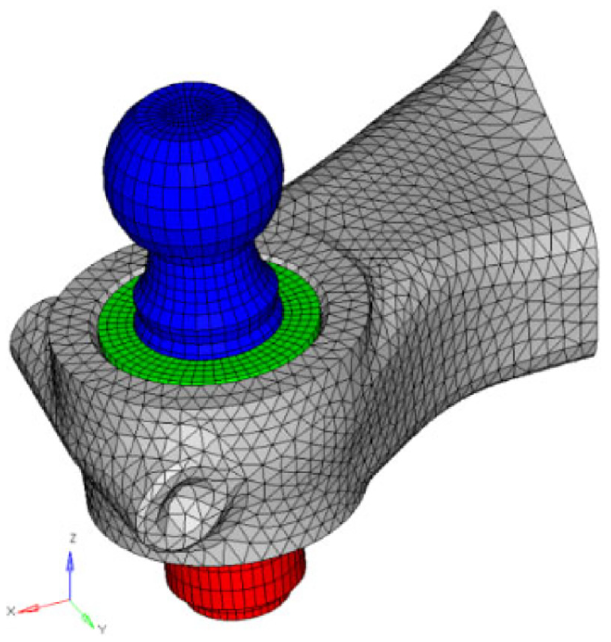
The connection mode of the steering knuckle.
The material of the steering knuckle studied in this paper belongs to Al-Mg-Si alloy, which has good ductility and tensile strength. Since the J-C model is suitable for describing the plastic behavior of metals under large deformation, the constitutive relation of the material is described based on this model. The general expression of the J-C model is as follows:
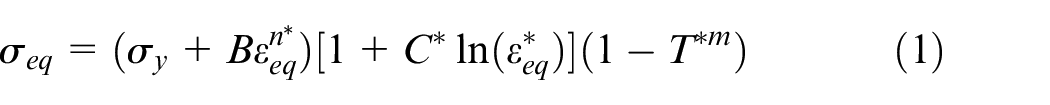
where
Since the material model is nonlinear, the nonlinear term is extended to the following stress state by using Mises stress potential and adjoint flow law:
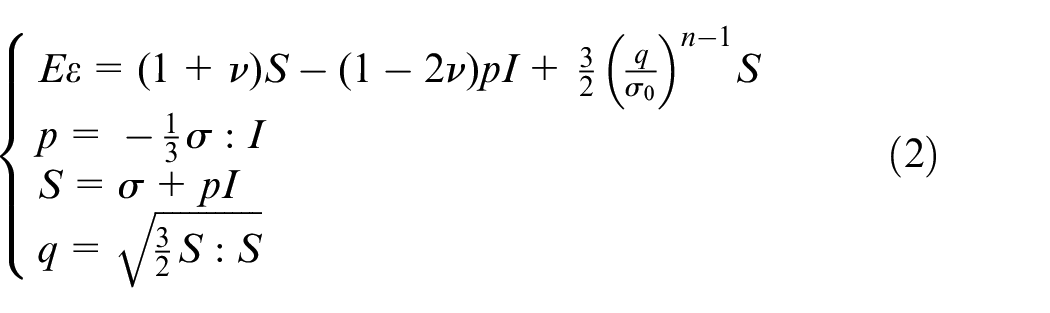
where
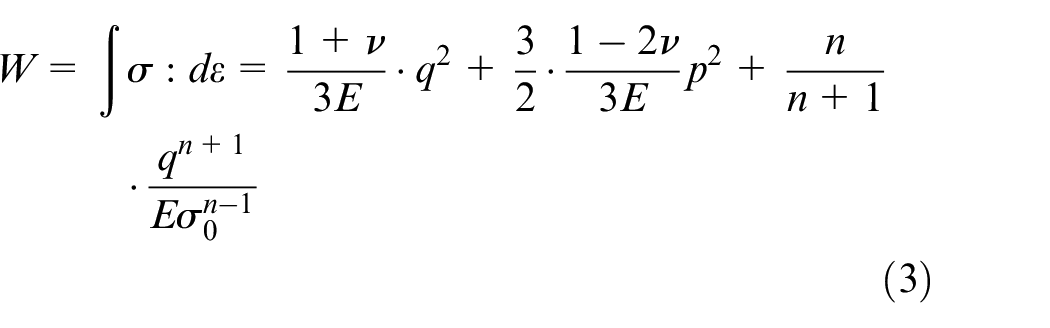
In the case of large deformation, it is necessary to consider the J-integral. The evaluation of J-integral requires strain energy density W, which is expressed as follows from equation (2):
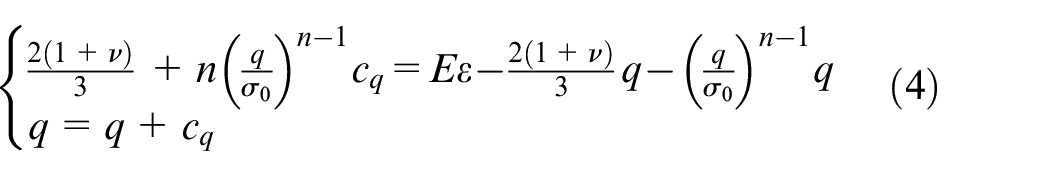
Taking cq as the increment of q, the Newton Raphson iterative method is used to solve equation (3). The iterative equation is as follows:
In the incremental iteration process, t and
The change of stress increment

The increments above should theoretically take the result of the end time of the current increment step. Then, the stress increment is transformed into strain increment according to the constitutive relationship, and the following is obtained:
In ABAQUS/standard,
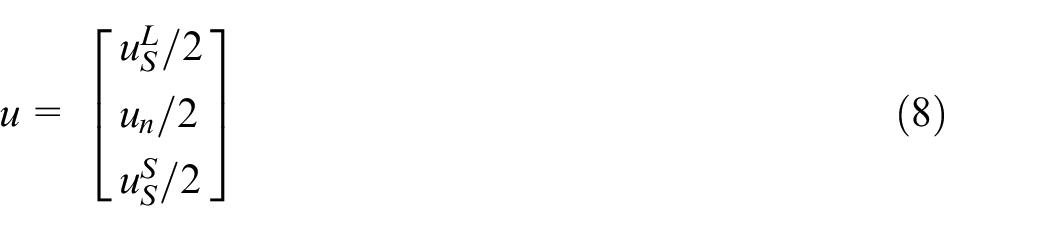
For proper analysis, the relative displacements of all elements need to refer to the global coordinate axis. As shown in Figure 3, {E1, E2} represents the global reference standard. The displacement vector u can be expressed as:
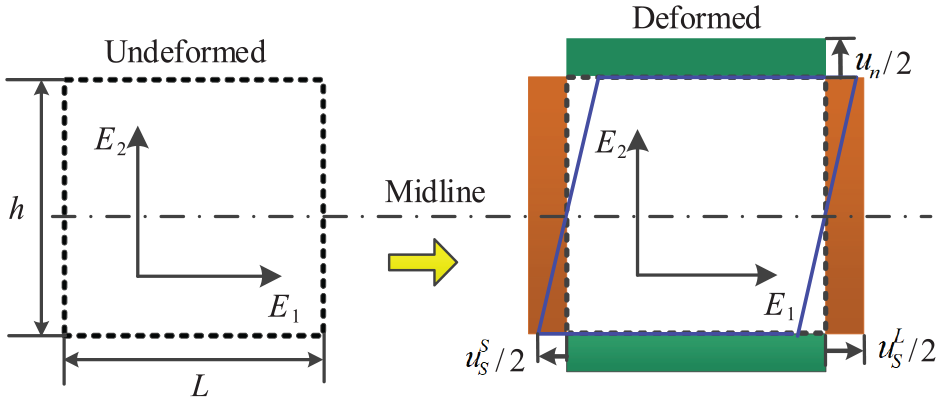
Deformation diagram of the element in the spatial coordinate system.
where
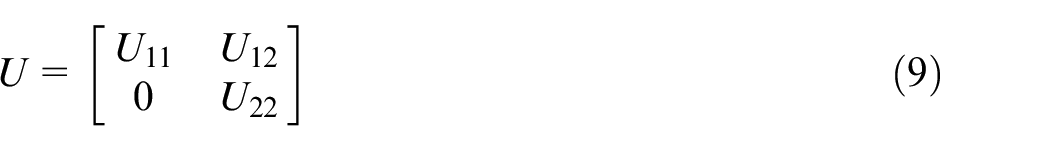
The second-order tensile tensor U can be derived from the following equation:

where X is the initial coordinate; I is the second-order cell matrix. The submatrix of U is derived from equation (10):
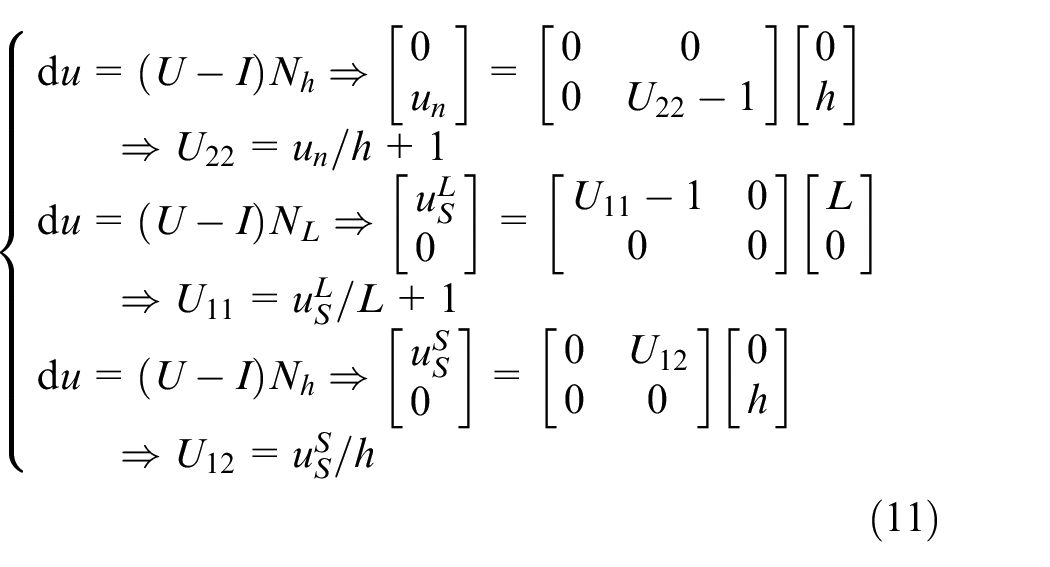
where vector
This paper introduces the deformation gradient F to obtain the strain of the element under the large deformation condition. The Cauchy green deformation tensor C is defined as 9 :

Since the tensor R is orthogonal, the deformation tensor is converted to the following form:

Thus, the strain tensor Eu can be derived:
In this study, the Johnson-Cook criterion 20 is used to predict the quasi-static failure of the steering knuckle. At room temperature, the J-C criterion is expressed as:
where C1, C2, and C3 are the constants determined by the material;
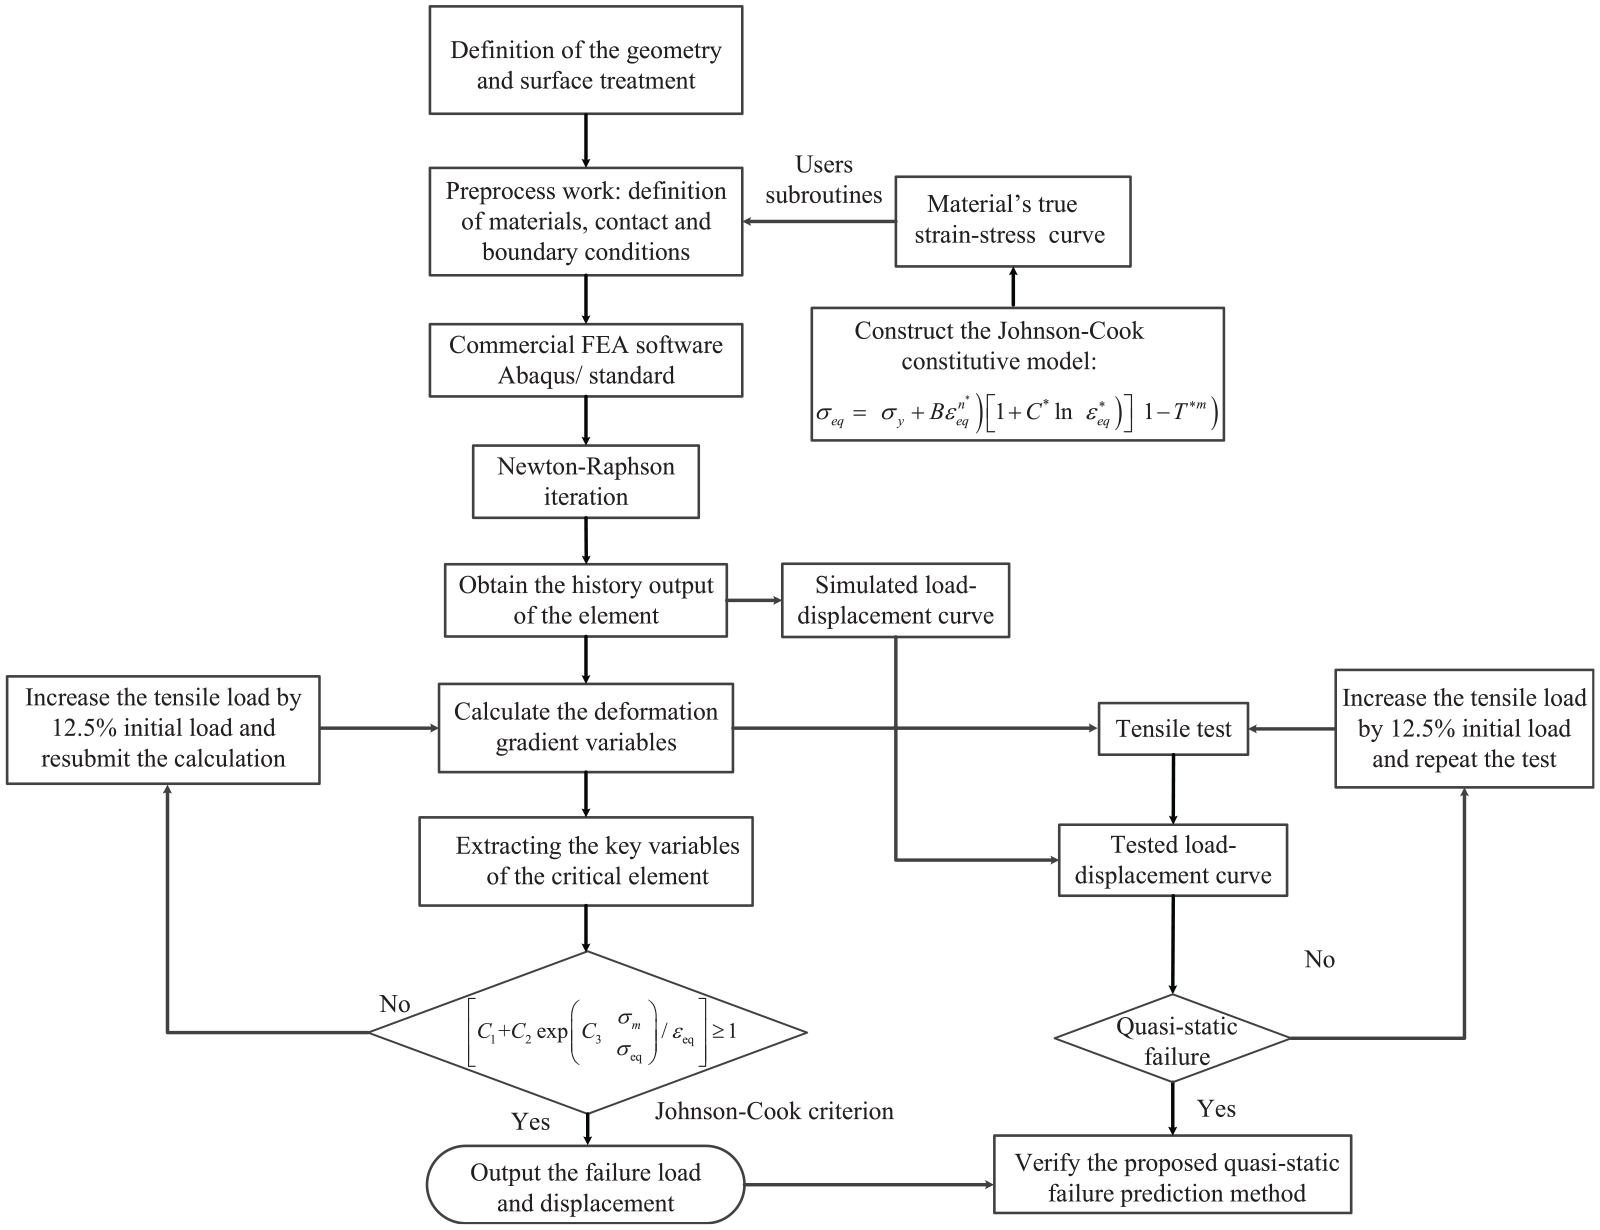
Flow chart of the proposed quasi-static failure prediction method.
Fatigue failure prediction model under cyclic loading
When the wheel is in contact with the road surface, the damping spring produces a large deformation through the function of the suspension system.
21
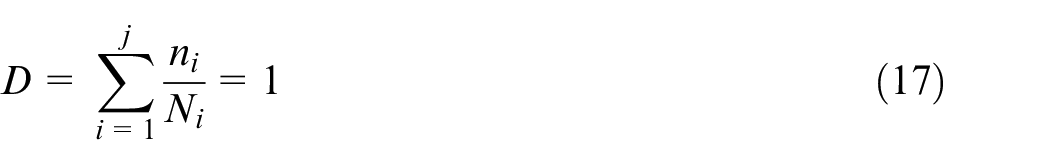
To limit the deformation of the spring, the ball studs are no longer stable. Therefore, the slight swing of the force points of the ball studs accelerates the local fatigue failure of the contact part between the steering knuckle and the joints. The Miner cumulative damage theory
22
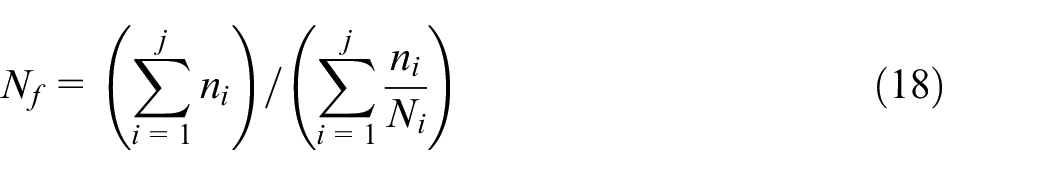
is widely used in engineering for fatigue damage calculation. The theory estimates the fatigue damage Di caused by each cycle. Then predicts the total damage D and the failure cycles
In recent studies, scholars have developed many improved damage parameters using the critical plane method to predict the fatigue failure of components. However, the most challenging problem is the interaction between the shear stress (strain) and normal stress (strain) components and their influence on fatigue damage.
Fatemi-Socie fatigue life prediction model
The main driving force of fatigue crack initiation is the alternating shear strain. Moreover, the normal stress on the critical plane also affects the crack initiation and propagation. 11 Fatemi-Socie proposes a critical plane-based damage model, which defines the critical plane as the plane with maximum shear strain. The damage parameters were subsequently modified using the maximum normal stress combined with the mean stress. This model can better predict the fatigue life of components and has been used by some researchers for fatigue failure prediction. Therefore, this paper will first take the Fatemi society (FS) model as a reference, and the fatigue failure prediction model can be expressed as:
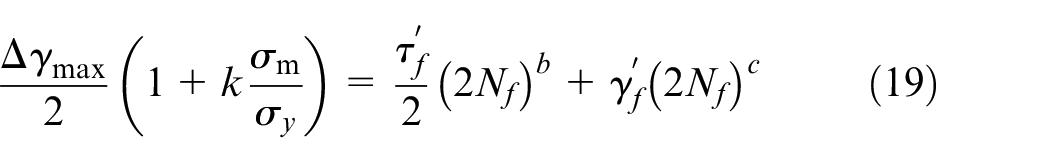
where
where
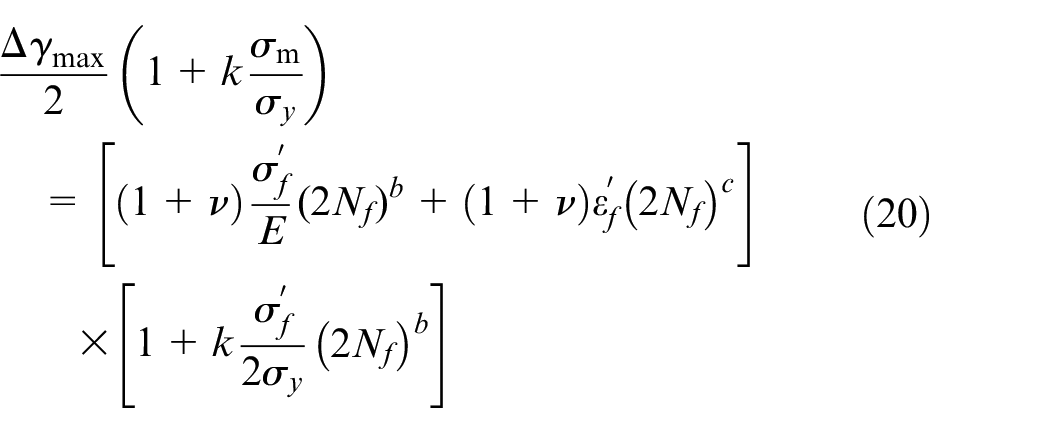
Improved subcritical plane model
In order to more accurately predict the fatigue failure of components, the influence of the cyclic hardening effect on the material is considered in this paper. An improved life prediction model is established by considering a cyclic hardening parameter to the subcritical plane model. At first, the damage parameter
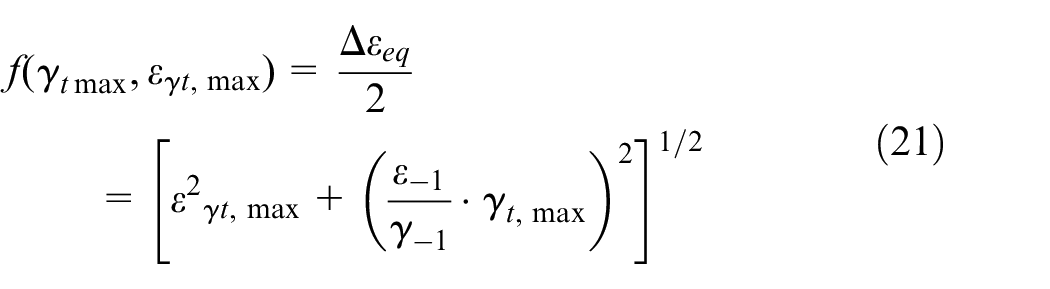
where
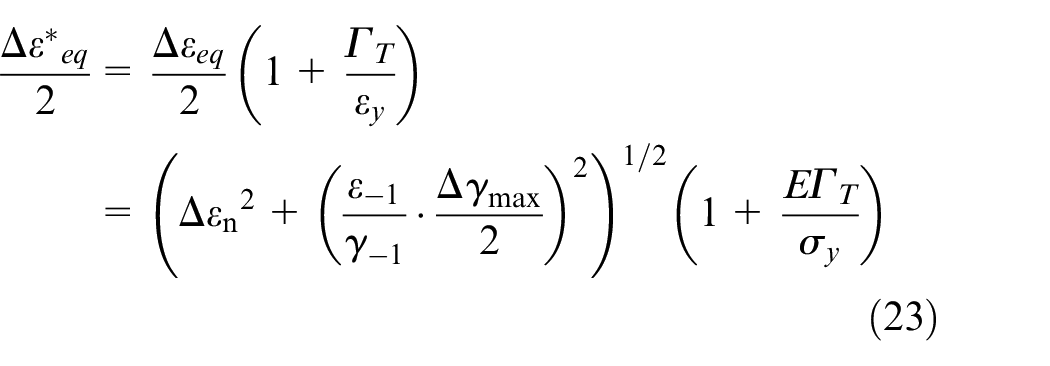
When establishing an improved subcritical fatigue life prediction model, the form of the FS model will provide a reference. Compared with the constant value k, the improved model considers a physical parameter
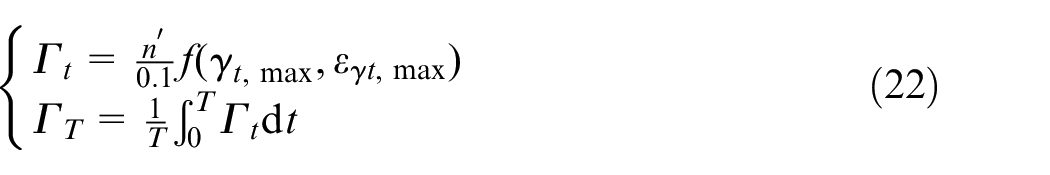
where
where
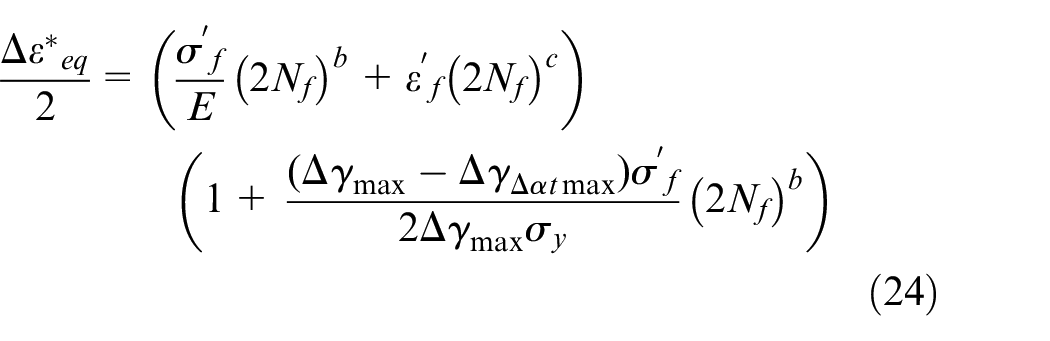
where
Failure prediction of the steering knuckle
This paper takes the steering knuckle of the front McPherson suspension system as the research object. The assembly relationship between the steering knuckle and its surrounding connecting parts is established through bolts and ball studs. As shown in Figure 5, the tightening torque of the four arc bolt joints is 120 N/m, and the tightening torque of two cylindrical bolt joints is 100 N/m.
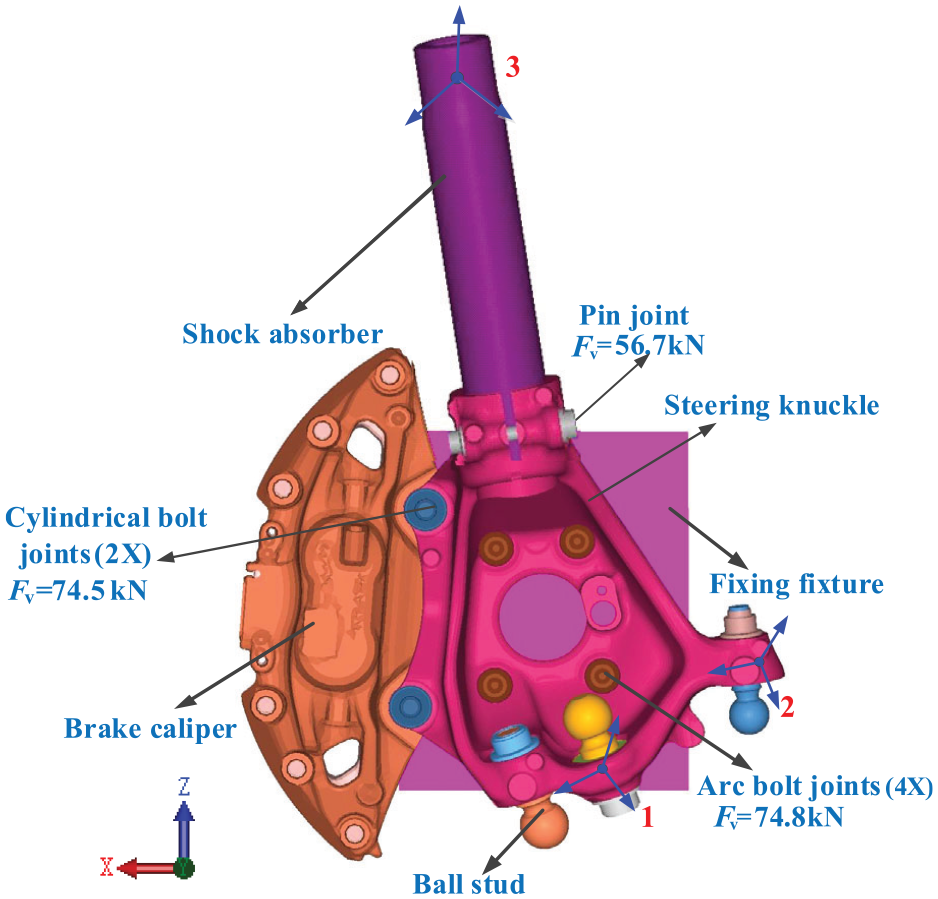
The CAE simulation model.
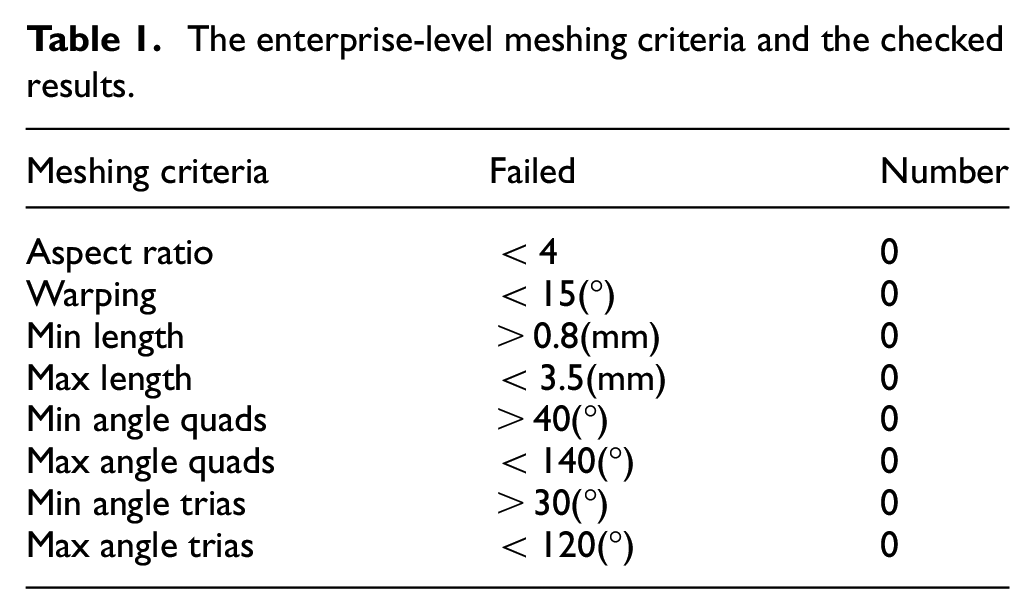
The preprocessing of the CAE model is carried out in ANSA v21.1.3. Since the rationality of mesh quality seriously affects the accuracy of simulation results, especially for fatigue analysis. Therefore, this study selected the industry-recognized mesh type C3D10M with a global size of 3 mm. The mesh quality is checked according to the enterprise-level meshing criteria. The checked results are shown in Table 1.
The enterprise-level meshing criteria and the checked results.
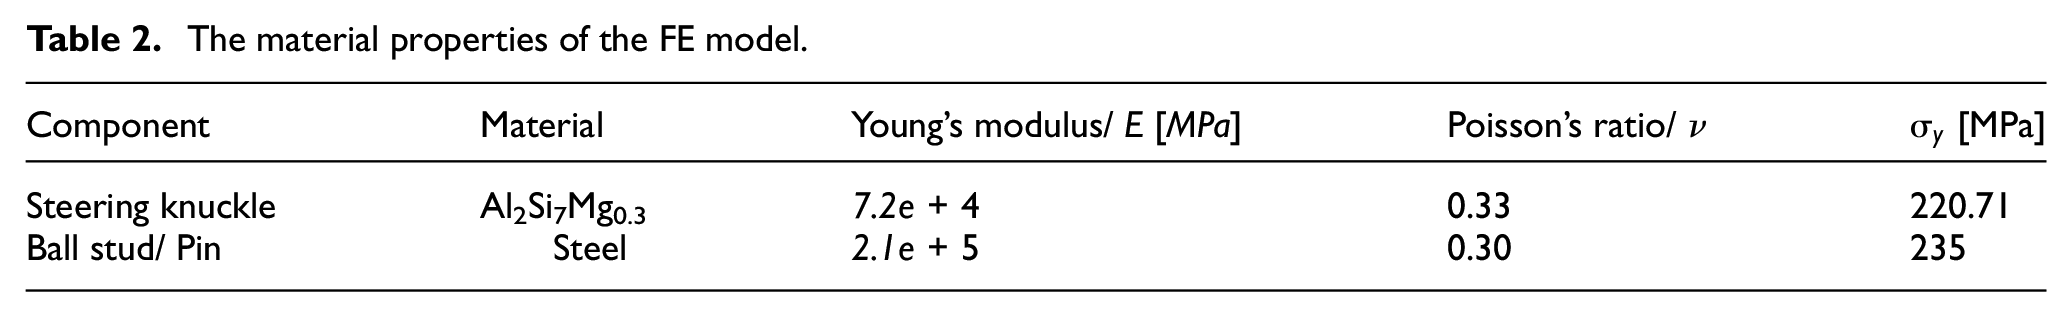
The boundary conditions of the steering knuckle are also shown in Figure 5. First, fix the steering knuckle on the fixing fixture through 4 arc bolt joints with the pre-tension load of 74.8 kN. Secondly, The brake caliper is connected with the steering knuckle through two cylindrical bolt joints with the pre-tension loads of 74.5 kN. Finally, the shock absorber is connected with the steering knuckle through a pin joint with a pre-tension load of 56.7 kN. All the pre-tension loads are calculated according to their specified tightening torques. Table 2 shows the material properties of the FE model.
The material properties of the FE model.
After completing the preprocessing work, the CAE model is submitted for calculation to obtain the basic variables included in the proposed prediction method and model.
Quasi-static failure prediction of the steering knuckle
This section will utilize the proposed method to carry out the quasi-static failure prediction of the steering knuckle. As shown in Figure 6, by fitting the true strain-stress curve of Al2Si7Mg0.3, the undetermined parameters
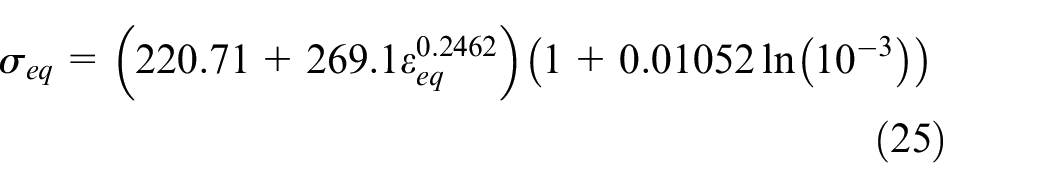
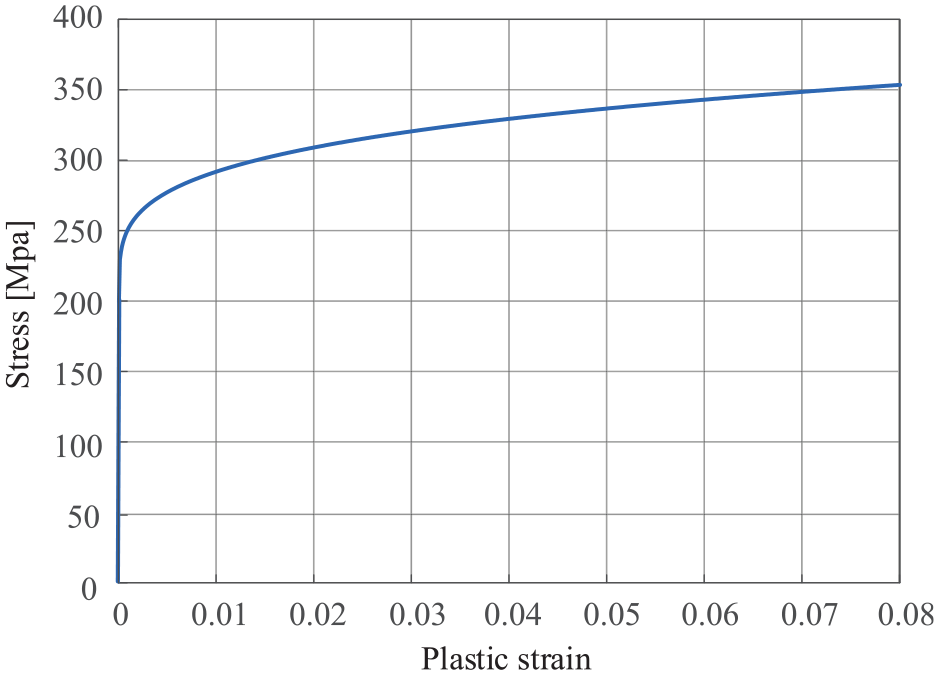
The true strain-stress curve of Al2Si7Mg0.3.
Subsequently, the constitutive model of the material is imported into the property module in ABAQUS/Standard through the user-defined subroutine to complete the definition of the material.
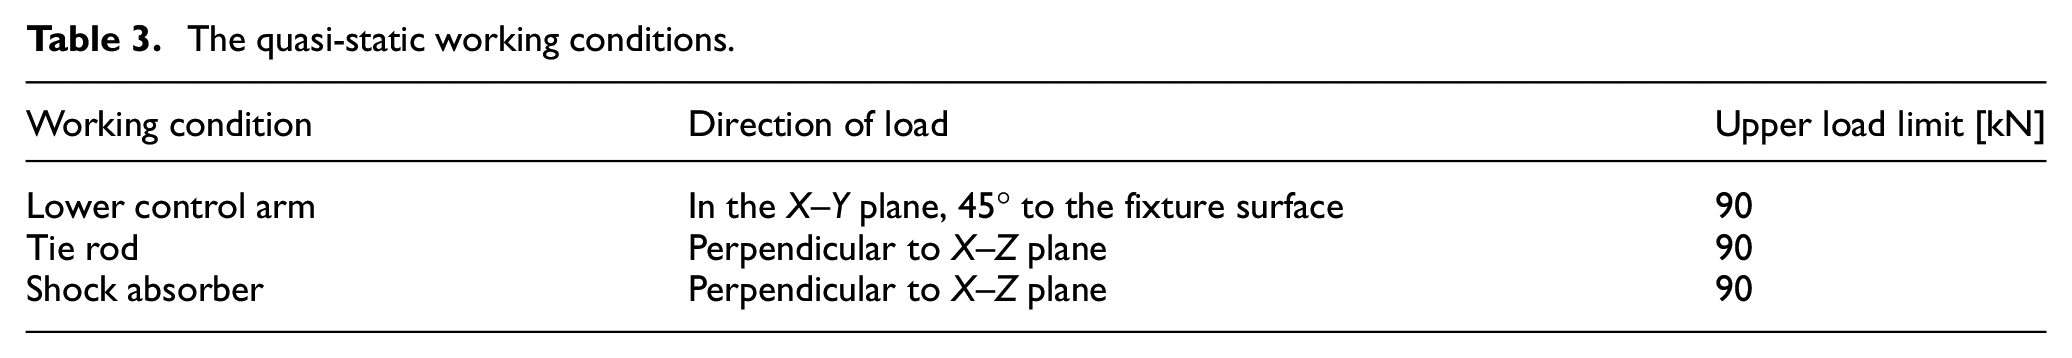
According to the connection modes described above, the quasi-static failure prediction of the steering knuckle is carried out under the three working conditions shown in Table 3.
The quasi-static working conditions.
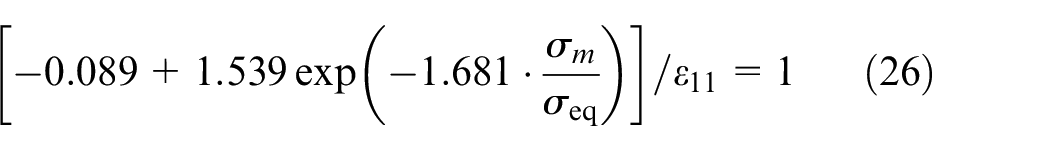
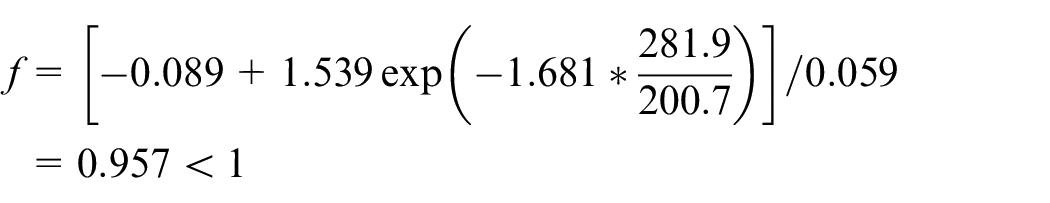
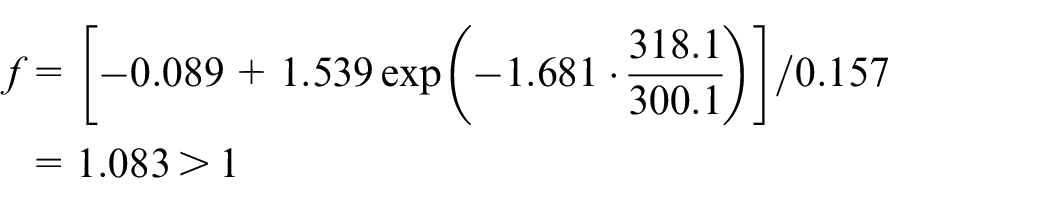
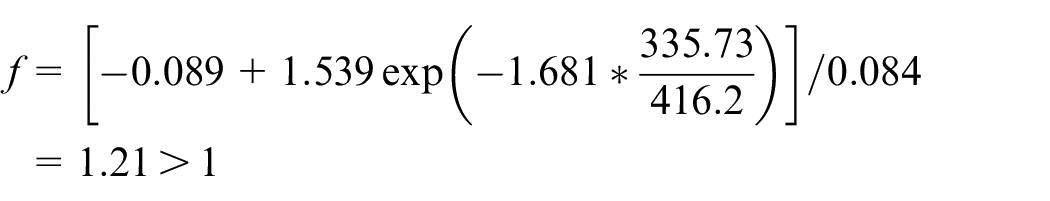
For the J-C criterion described in equation (16), the undetermined parameters C1, C2, and C3 of Al2Mg3Si0.7 were queried to be −0.089, 1.539, and −1.681, respectively. 23 Then the J-C criterion of the steering knuckle becomes:
Working condition 1: Lateral load at the lower control arm
According to Table 3 and Figure 5, the tension load in working condition 1 is 45° to the fixture surface in the X–Y plane. The load is increased gradually at the interval of 1 kN. The simulation results of working condition 1 are viewed through META v21.1.3 as follows:
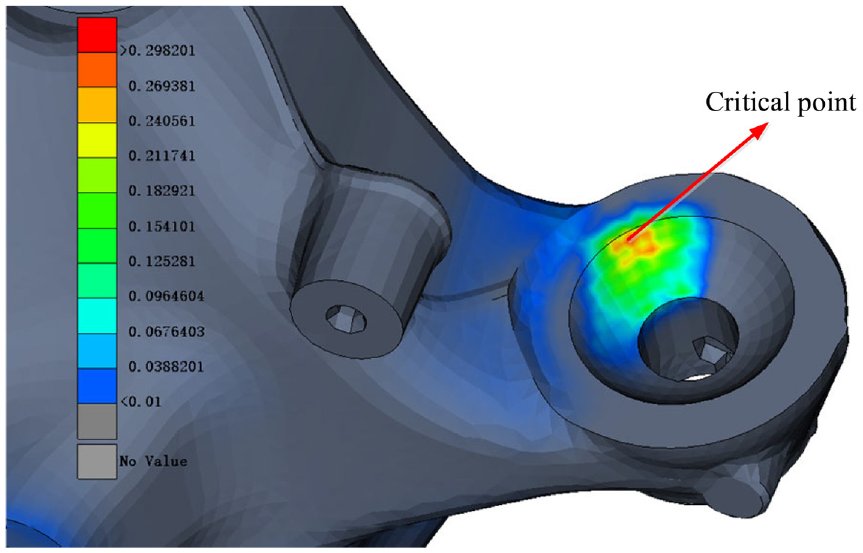
Figure 7 shows the strain distribution of the steering knuckle when the tensile load reaches 90 kN. The simulation results show that the critical point is located at the outer edge of the steering knuckle. Then, the load-displacement curve of the critical point is output.
The strain distribution of the steering knuckle in working condition 1.
As shown in Figure 8, the obtained load-displacement curve at the critical point shows that the plastic deformation of the steering knuckle begins to occur when the tensile load reaches 55 kN. When unloading to 0 at this time, we found a residual displacement of 0.03 mm at the critical point.
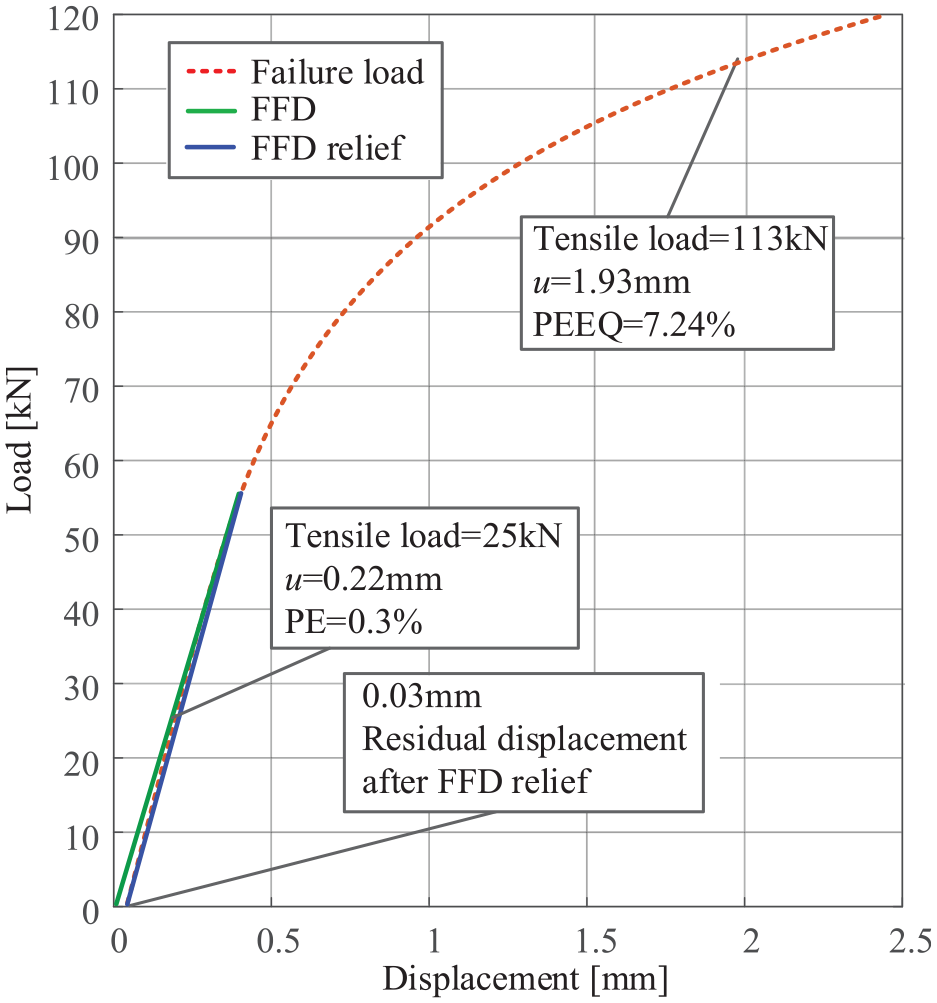
The load-displacement curve at the critical point (working condition 1).
Take the tensile load (55 kN) at which plastic deformation is about to occur as the FFD load. Then increase the tensile load by 12.5% of the FFD load each time on the basis of the initial FFD load. The displacement components of the critical point under different tension loads are recorded.
As shown in Table 4, the quasi-static failure prediction is carried out using the proposed method.
The key variables in the calculation process (working condition 1).
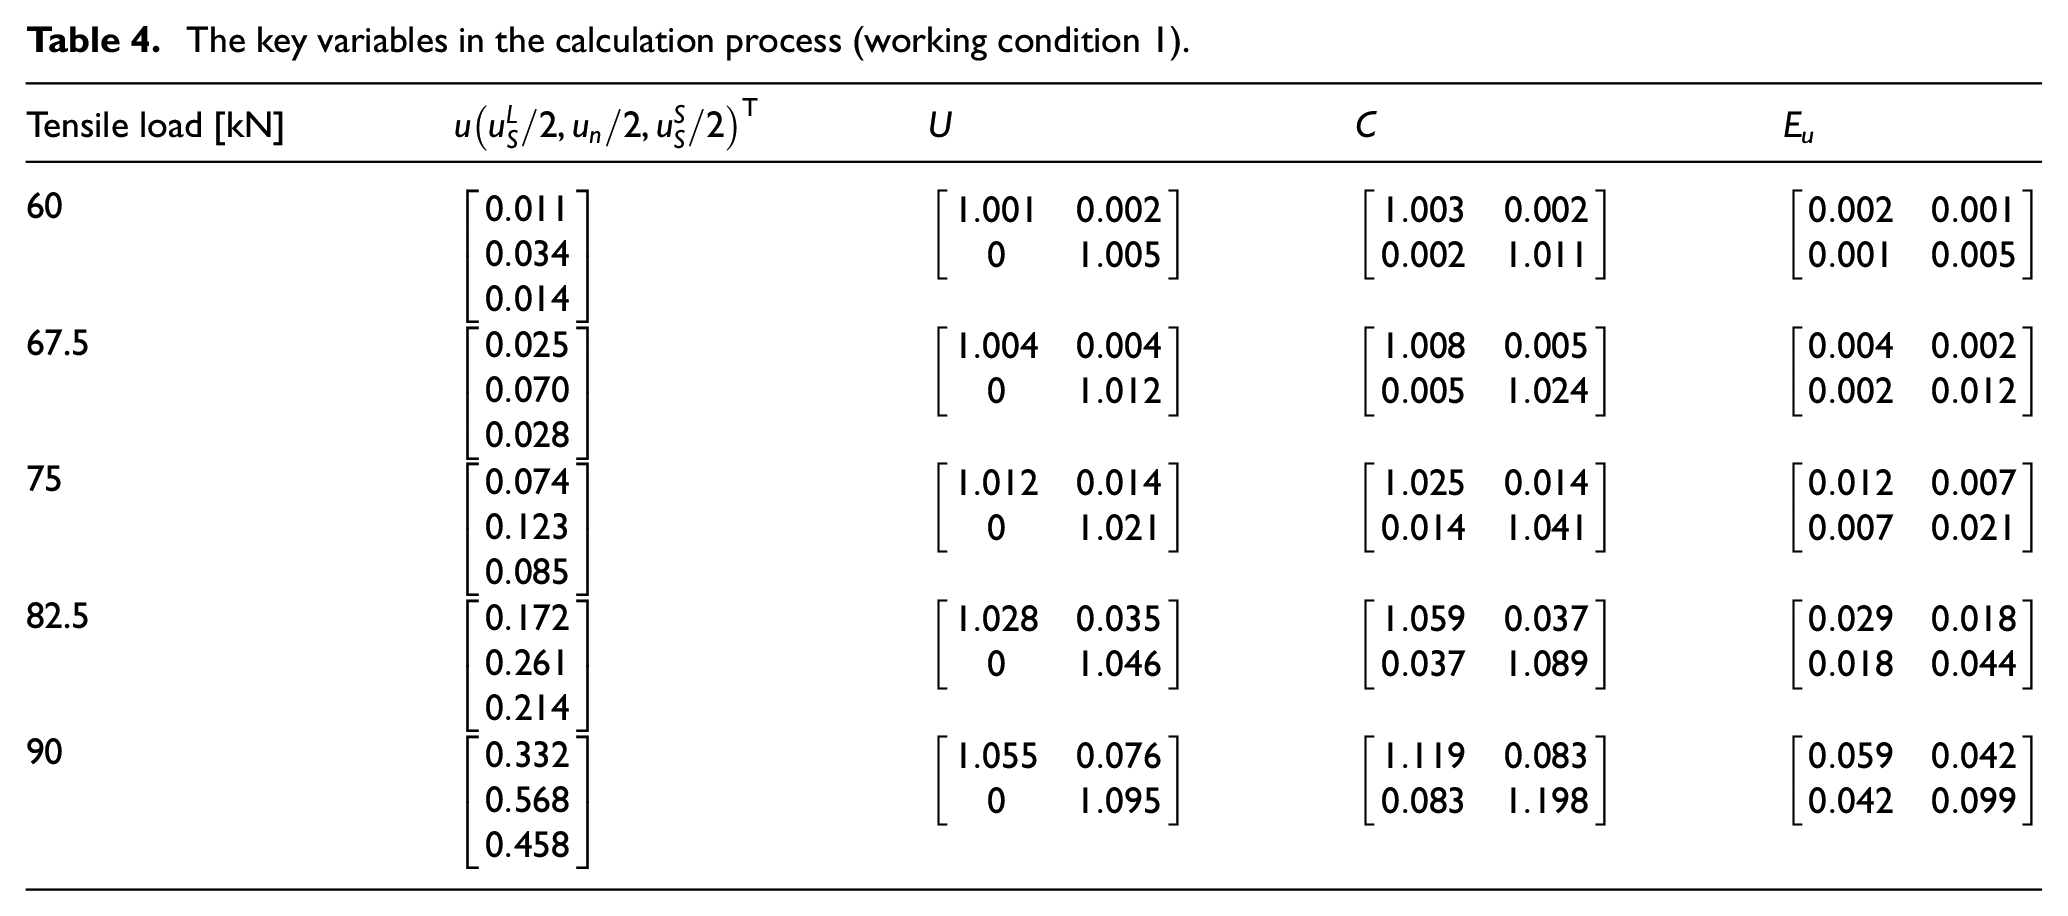
The predicted results show that even if the tensile load reaches the upper load limit (90 kN) in Table 3, the steering knuckle under condition 1 still does not fail.
Working condition 2: Vertical load at the tie rod
In working condition 2, the tension load is perpendicular to the X–Z plane. The load is increased gradually at the interval of 1 kN.
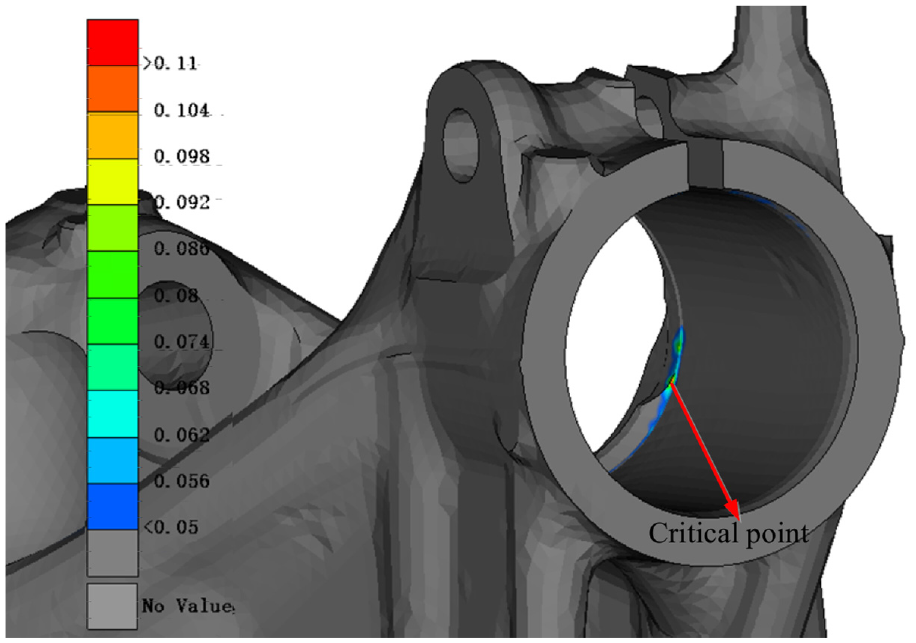
Figure 9 shows the strain distribution of the steering knuckle when the tensile load reaches 80 kN. The simulation results show that the critical point is located at the outer contact surface of the knuckle. Then, the load-displacement curve of the critical point for working condition 2 is output.
The strain distribution of the steering knuckle in working condition 2.
As shown in Figure 10, the obtained load-displacement curve at the critical point shows that the plastic deformation occurs when the tensile load reaches 40 kN. When unloading to 0 at this time, we found a residual displacement of 0.09 mm at the critical point.
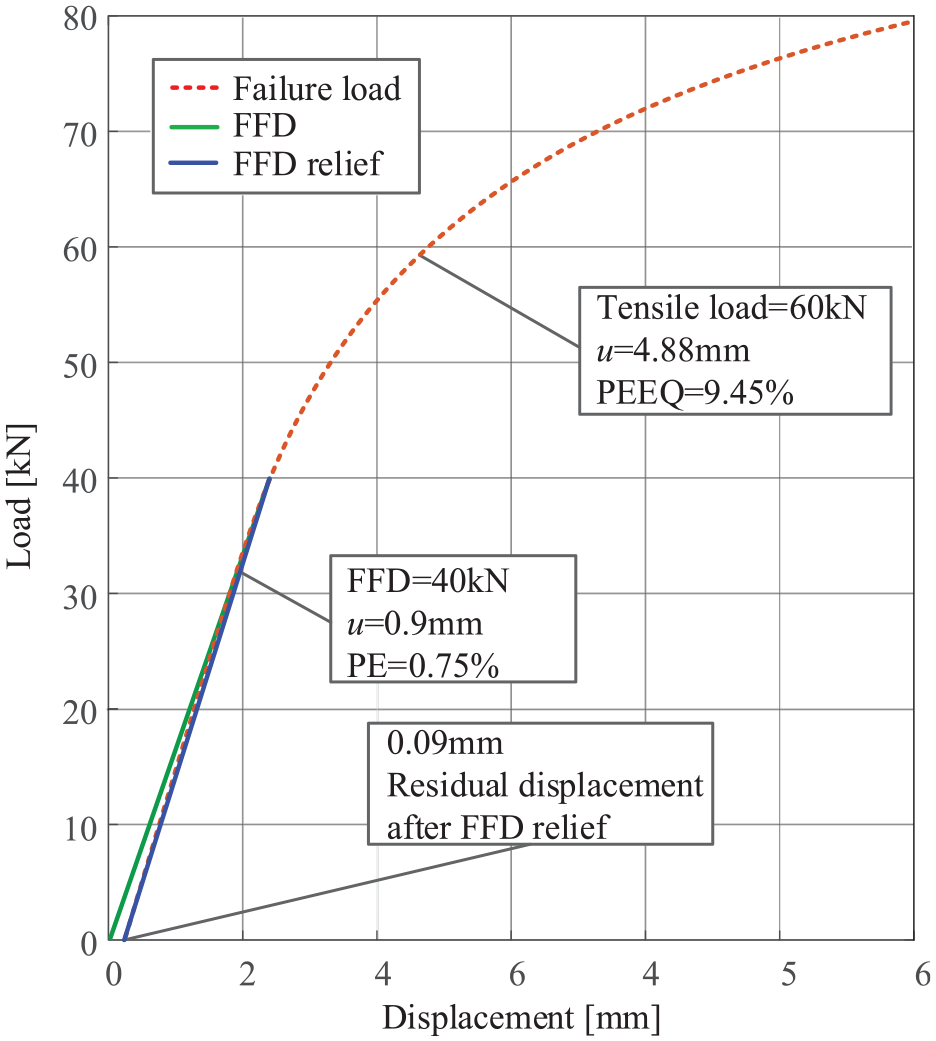
The load-displacement curve at the critical point (working condition 2).
Take the tensile load that is about to plastically deform as the FFD load, and then increase the tensile load at 12.5% intervals of the FFD load each time. The displacement components of the critical point under different tensile loads are recorded.
As shown in Table 5, the quasi-static failure prediction is carried out by the proposed method for working condition 2.
The key variables in the calculation process (working condition 2).
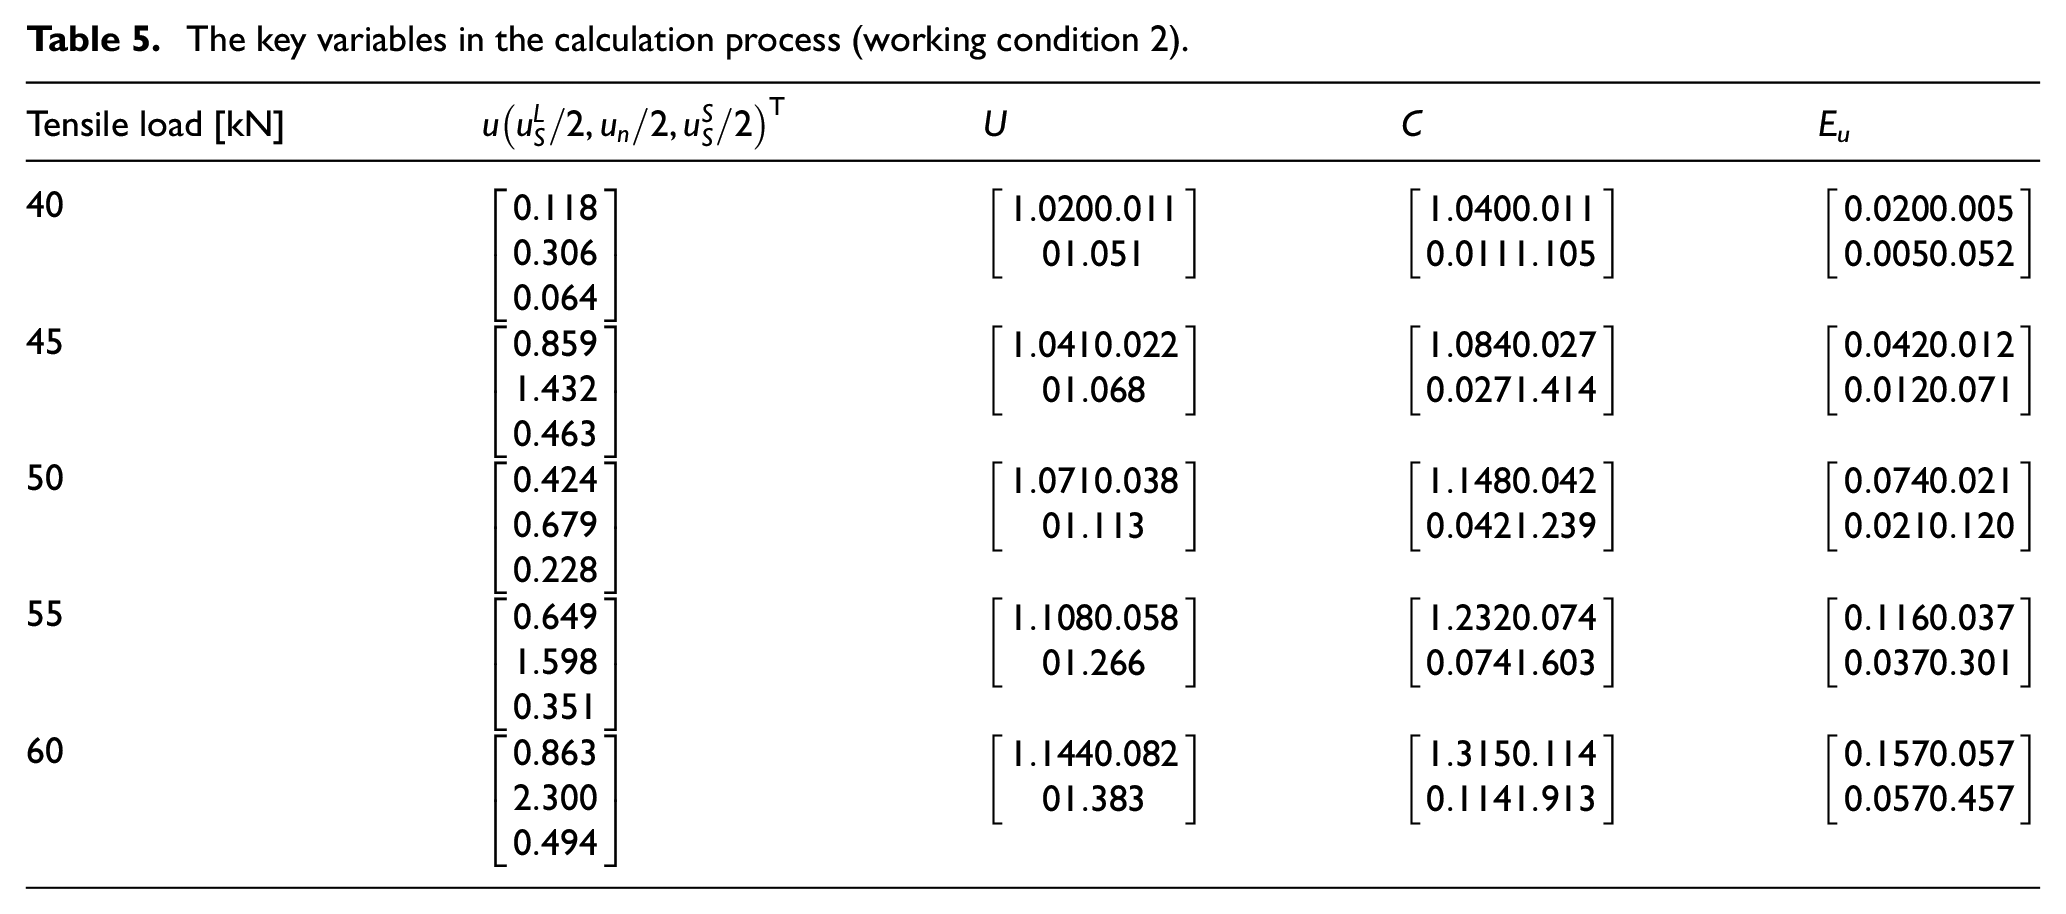
The predicted results show that quasi-static failure occurs when the tensile load reaches 60 kN, which does not meet the requirement of working condition 2.
Working condition 3: Longitudinal load at the shock absorber
In working condition 3, the tensile load is perpendicular to the X–Z plane. The load will be gradually increased at the interval of 1 kN.
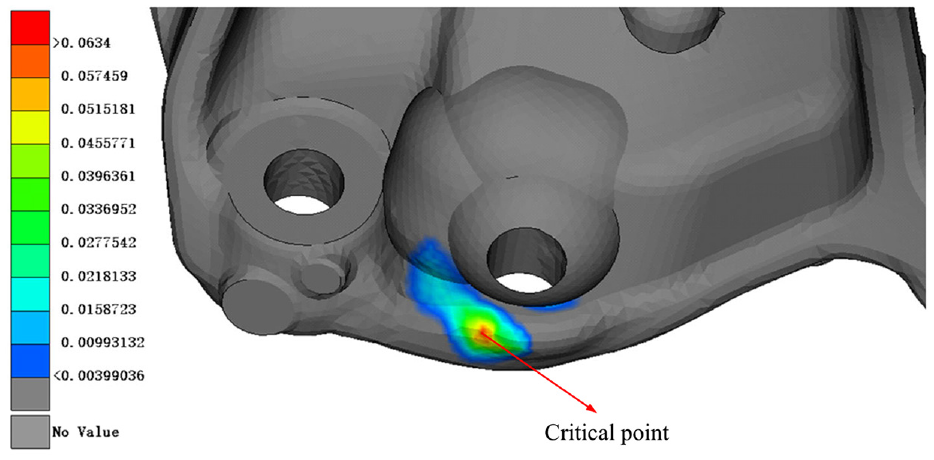
Figure 11 shows the strain distribution of the steering knuckle when the tensile load reaches 30 kN. The simulation results show that the critical point is located at the external outer edge of the knuckle. Then, the load-displacement curve of the critical point for working condition 3 is output as follows.
The strain distribution of the steering knuckle in working condition 3.
As shown in Figure 12, the obtained load-displacement curve at the critical point shows that the plastic deformation occurs when the tensile load reaches 18.5 kN. When unloading the FFD load to 0 at this time, we found a residual displacement of 0.31 mm at the critical point.
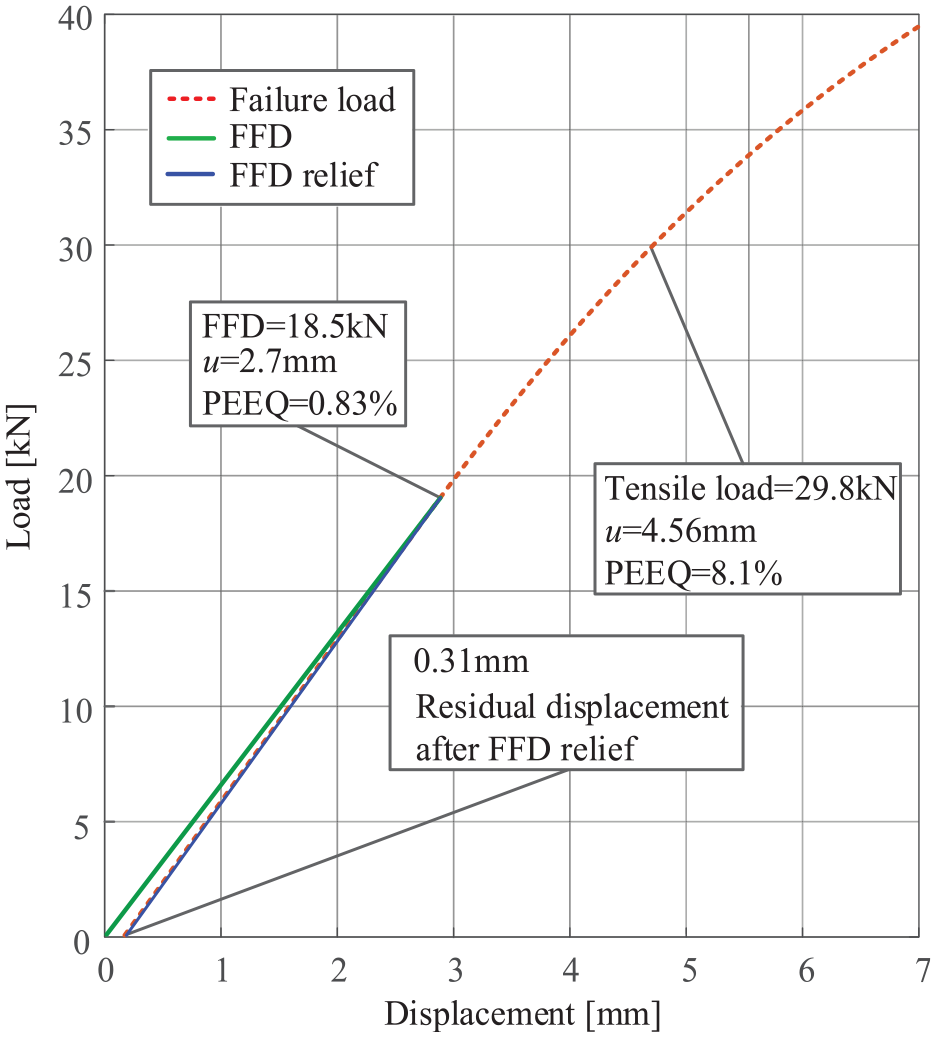
The load-displacement curve at the critical point (working condition 3).
Increase the tensile load in sequence as described above, and the displacement components of the critical point under different tension loads are recorded. At last, the quasi-static failure prediction is also carried out for working condition 3.
It can be seen from Table 6 that
The key variables in the calculation process (working condition 3).
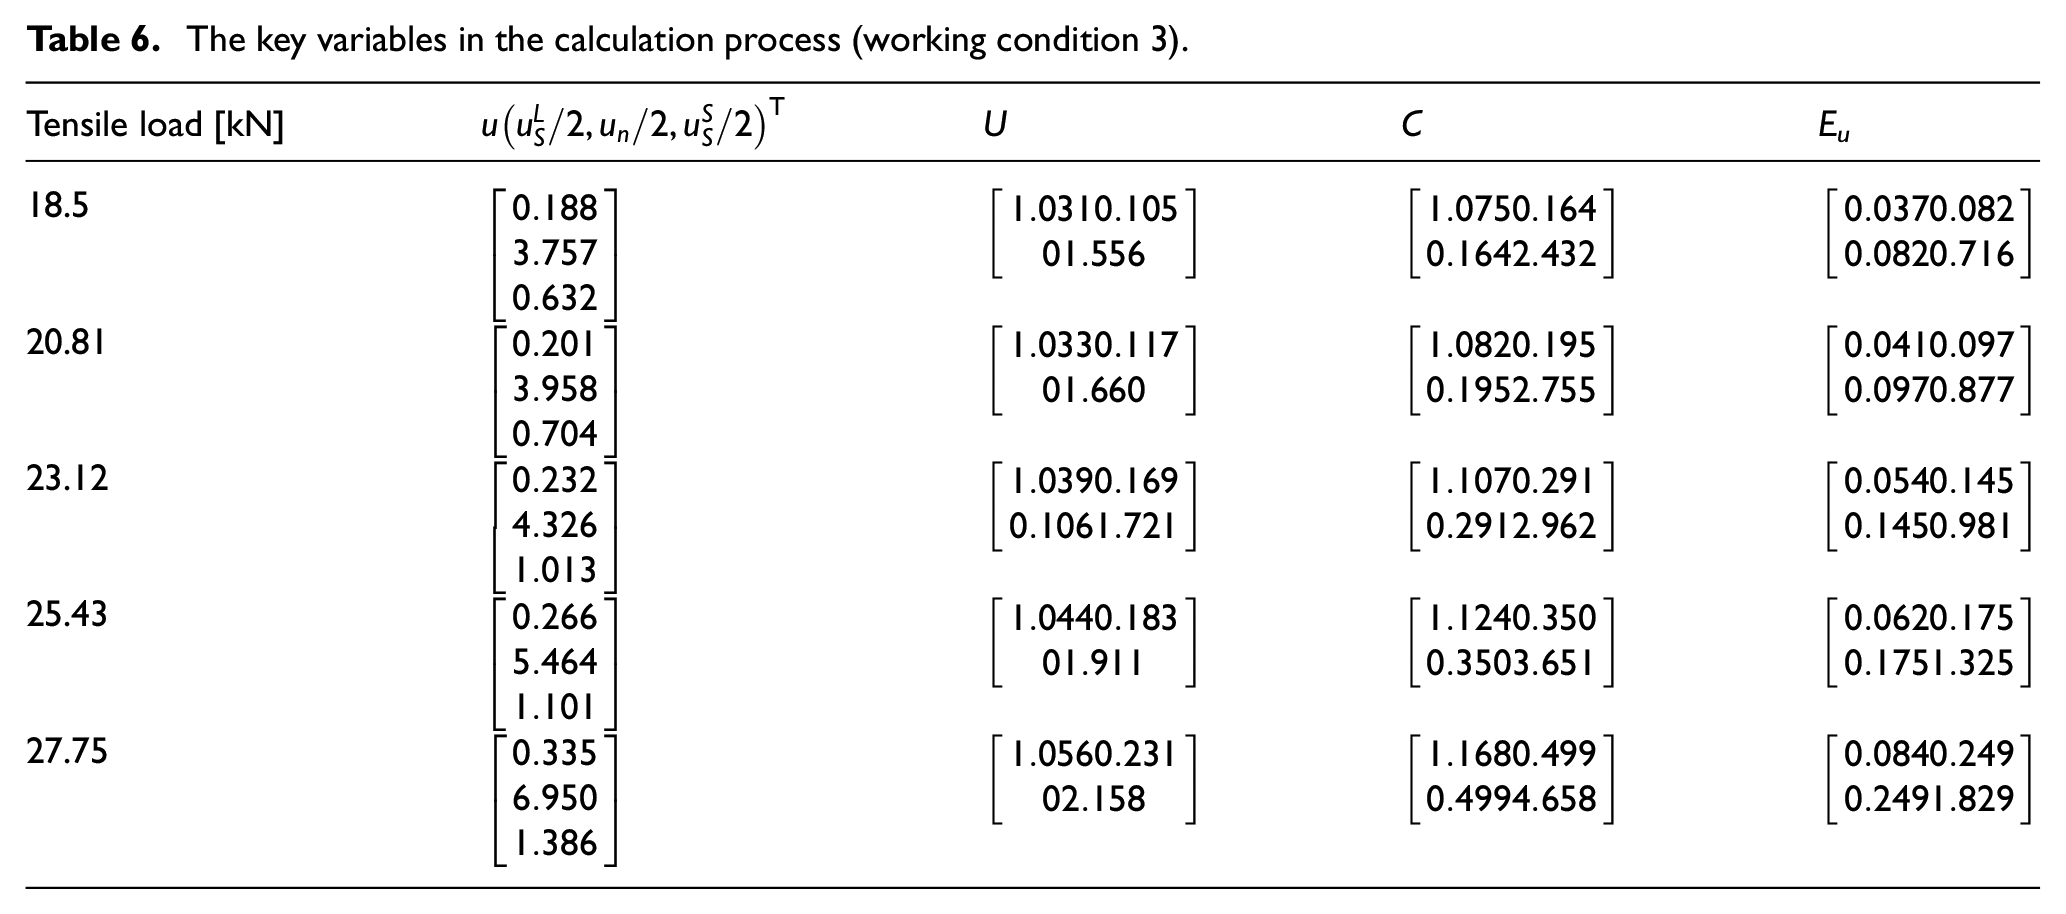
The predicted results show that quasi-static failure occurs when the tensile load reaches 27.75 kN, which does not meet the requirement of working condition 3.
Fatigue failure prediction of the steering knuckle
Due to the complexity of the geometry and stress state of the steering knuckle, it is not feasible to predict the fatigue failure by the nominal stress method. Therefore, in this section, the FS model and the improved subcritical plane model are used to predict the fatigue failure of the steering knuckle. At first, the S-N curve of the steering knuckle’s material is corrected in FEMFAT 5.3.1.
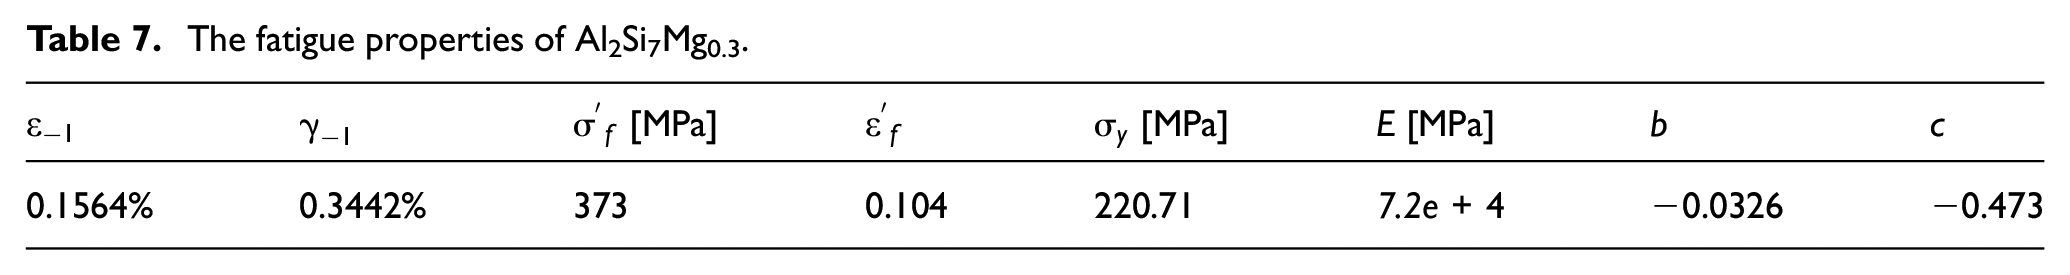
Figure 13 shows the corrected S-N curve of Al2Si7Mg0.3 due to the influence of the processing technology and the component structure. Where the endurance limit is 73 MPa, and the cycle limit is 1e + 7. Subsequently, the fatigue properties of Al2Si7Mg0.3 12 in the prediction models are shown in Table 7.
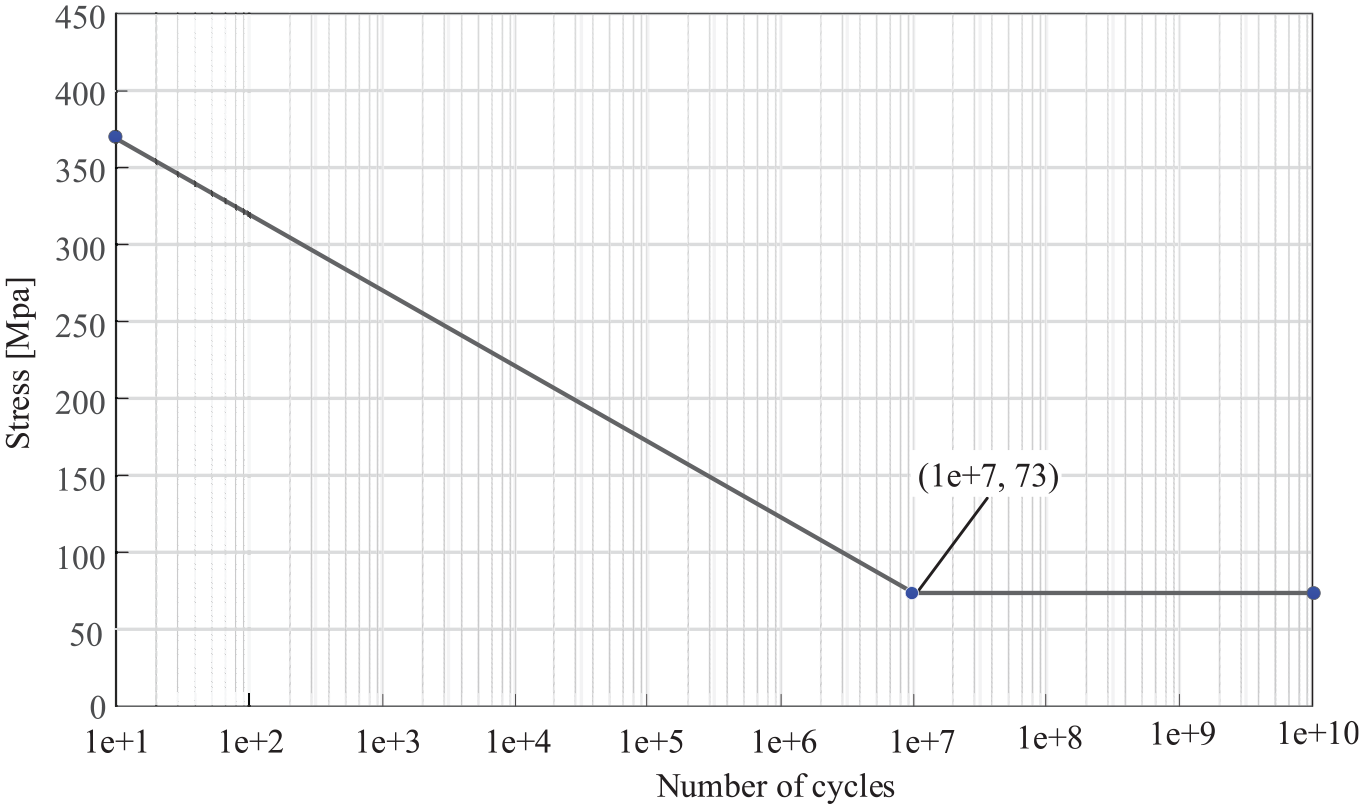
The corrected S-N curve of Al2Si7Mg0.3.
The fatigue properties of Al2Si7Mg0.3.
Subsequently, the load conditions and the initial number of cycles are inputted for simulation to determine critical elements. The cyclic load conditions in this study are based on actual vehicle measurements on different road conditions and formulated using the virtual equivalence simulation.
Table 8 shows the load conditions acting on the steering knuckle. The frequency of all load cases is 10 Hz, and the tensile direction is considered positive. The load points and directions are shown in Figure 5. Set the number of cycles to 500,000. The damage distributions are shown as follows.
The cyclic load conditions acting on the steering knuckle.
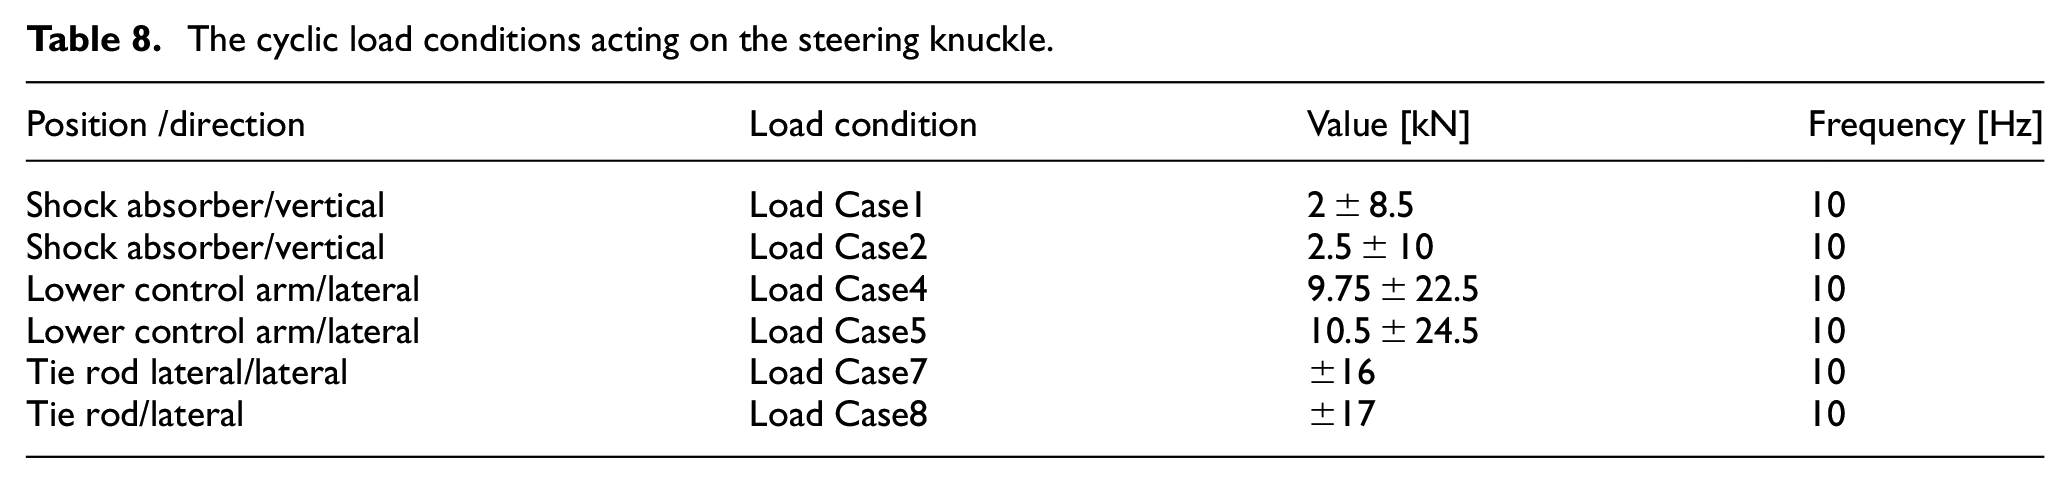
Figure 14 shows the damage distributions of steering knuckles under load cases 1, 4, and 7. According to the damage distributions, the critical elements of the steering knuckle under different working conditions are determined. For the load case1, the critical element is located at the root of the shock absorber connection. For load cases 4 and 7, the critical elements are located at the outer edge of the joint area with the lower control arm and the tie rod of the steering knuckle, respectively. Then, the key variables of the critical elements for the two fatigue failure prediction models are extracted (Table 9).
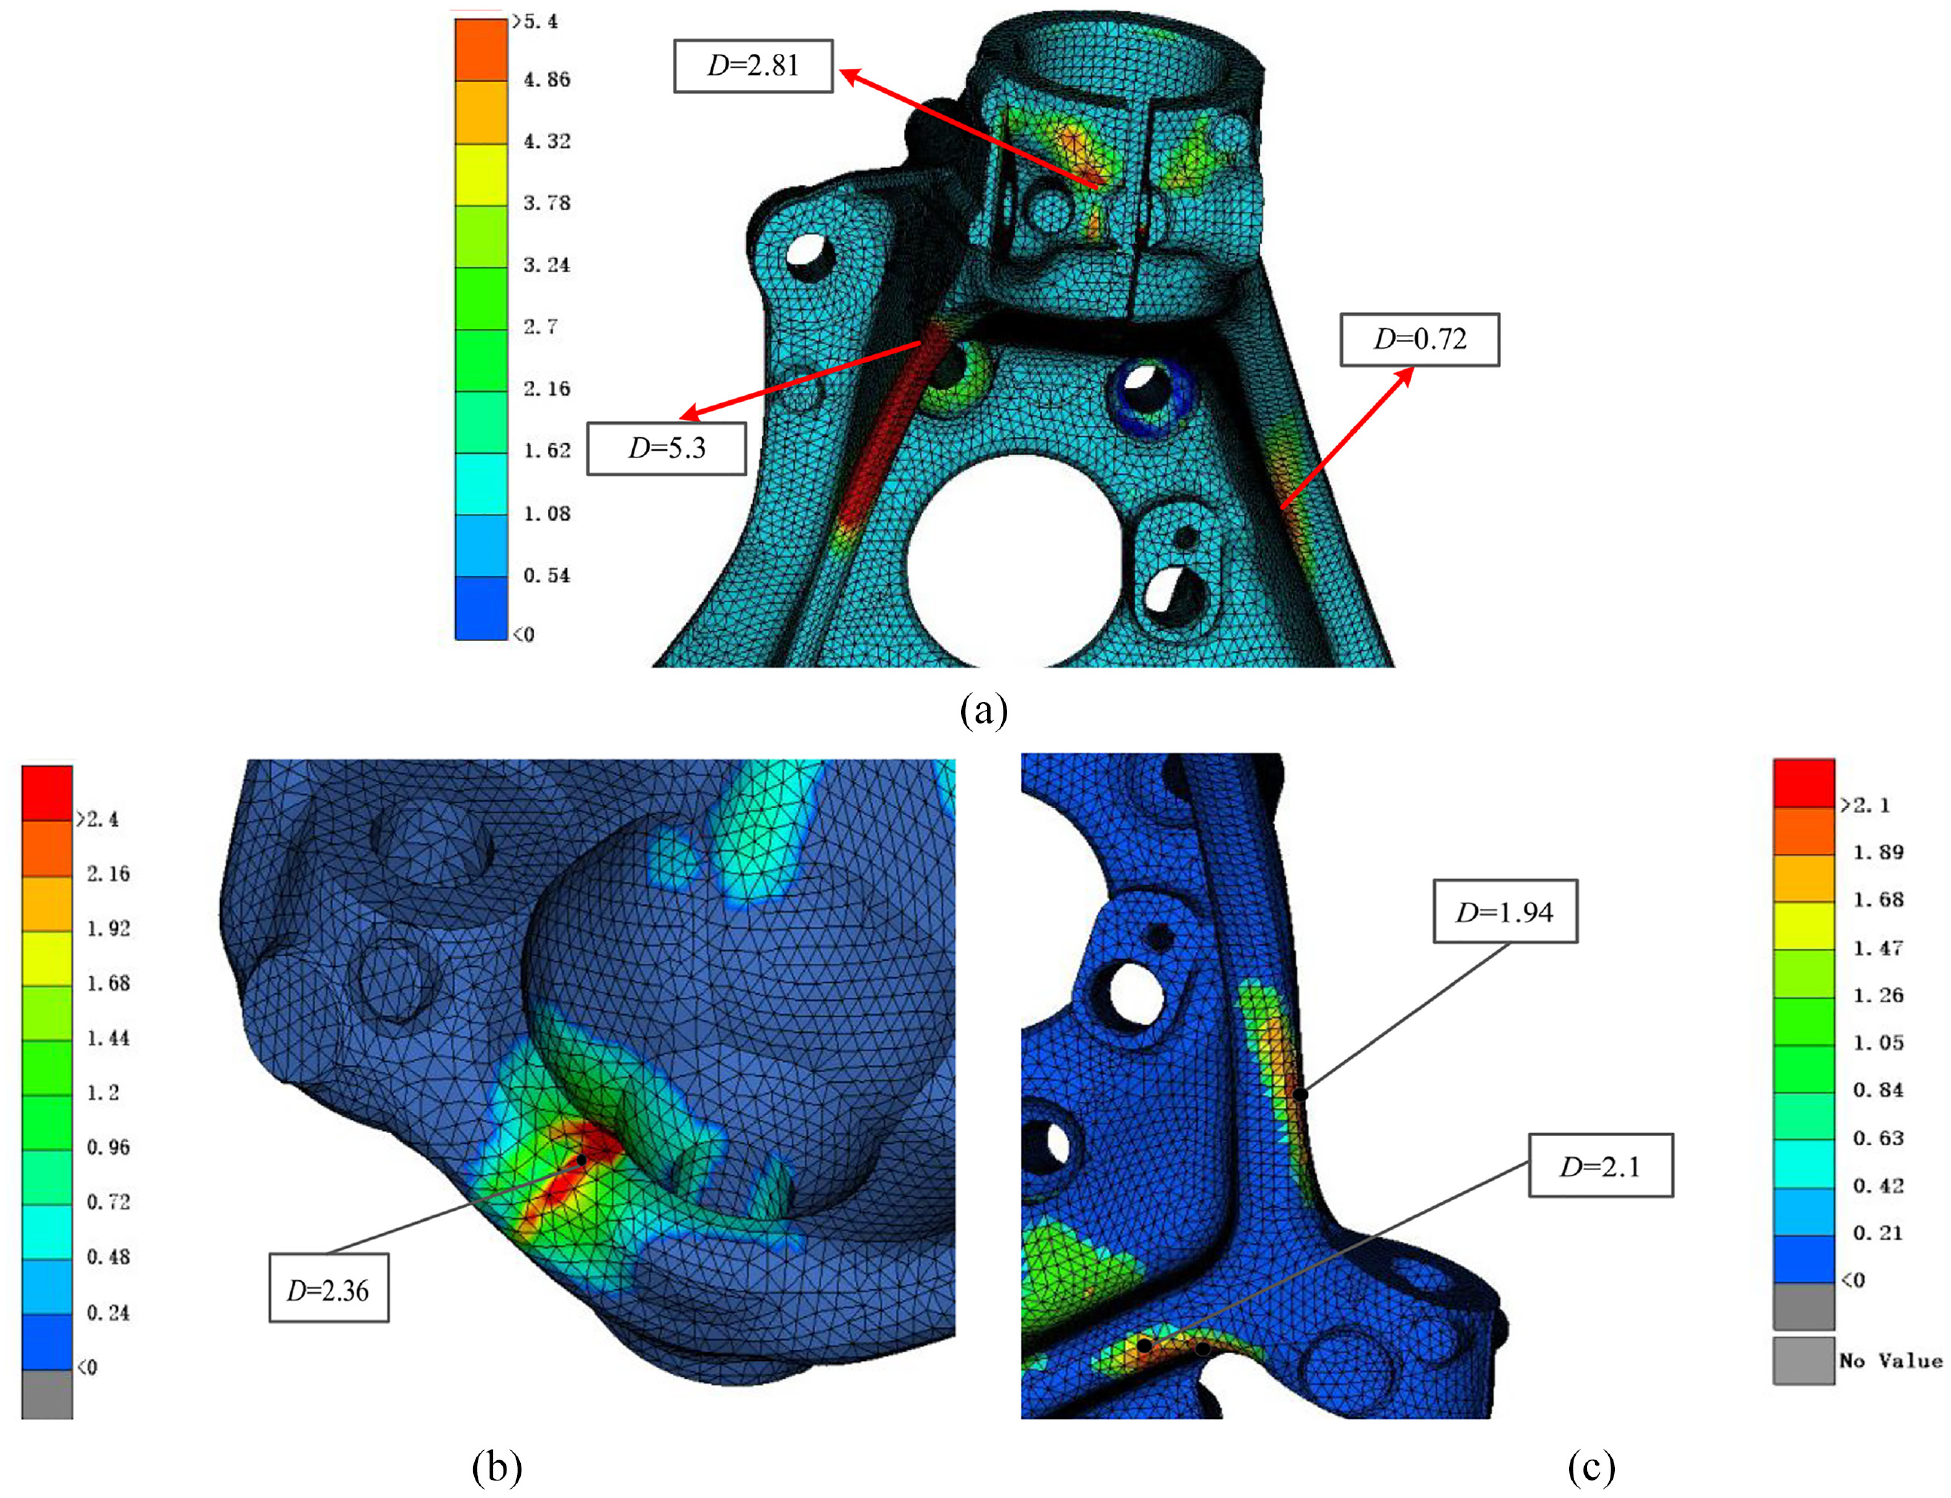
The damage distributions under load cases 1, 4, and 7: (a) load case 1, (b) load case 4, and (c) load case 7.
The key variables in the prediction models.
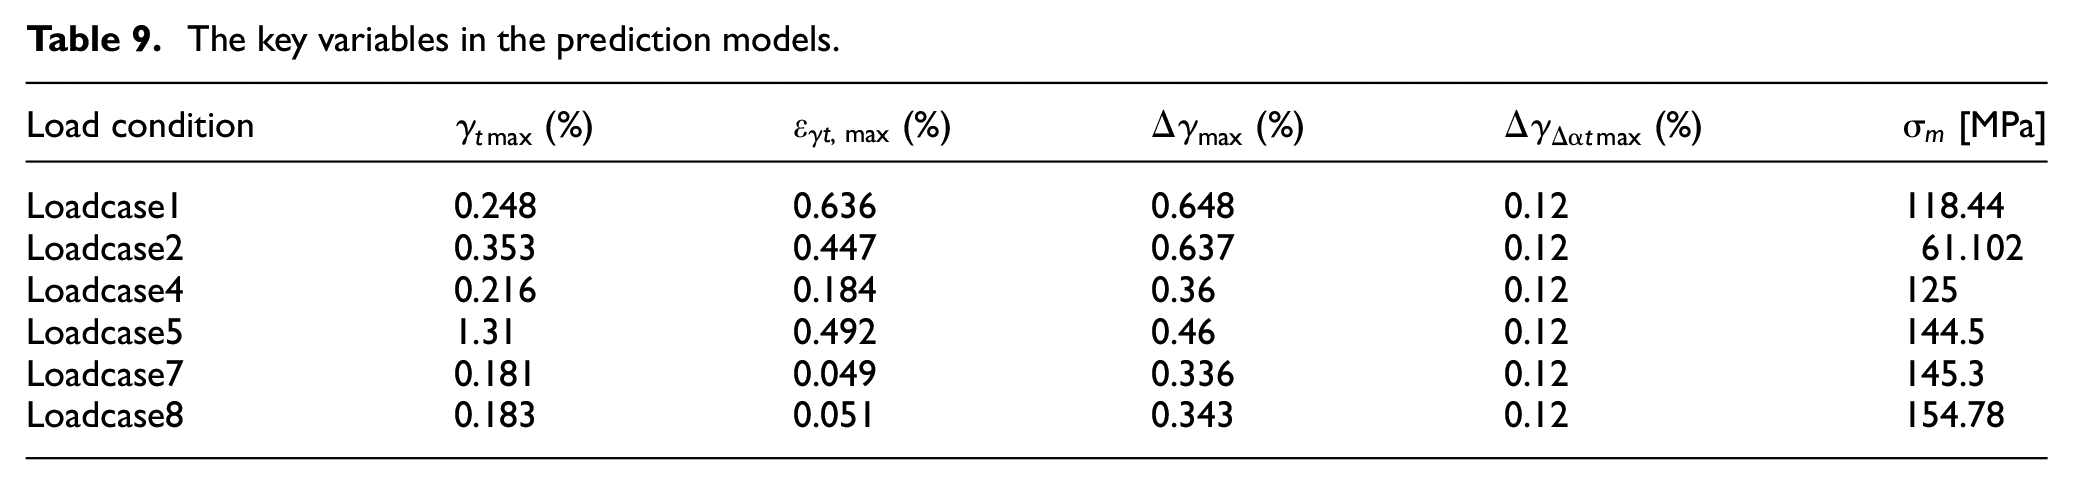
Finally, the extracted key variables and the material’s fatigue properties are substituted into the FS prediction model and the improved subcritical plane prediction model. The predicted results will be compared with the test results in the subsequent validation chapter.
Experimental validation
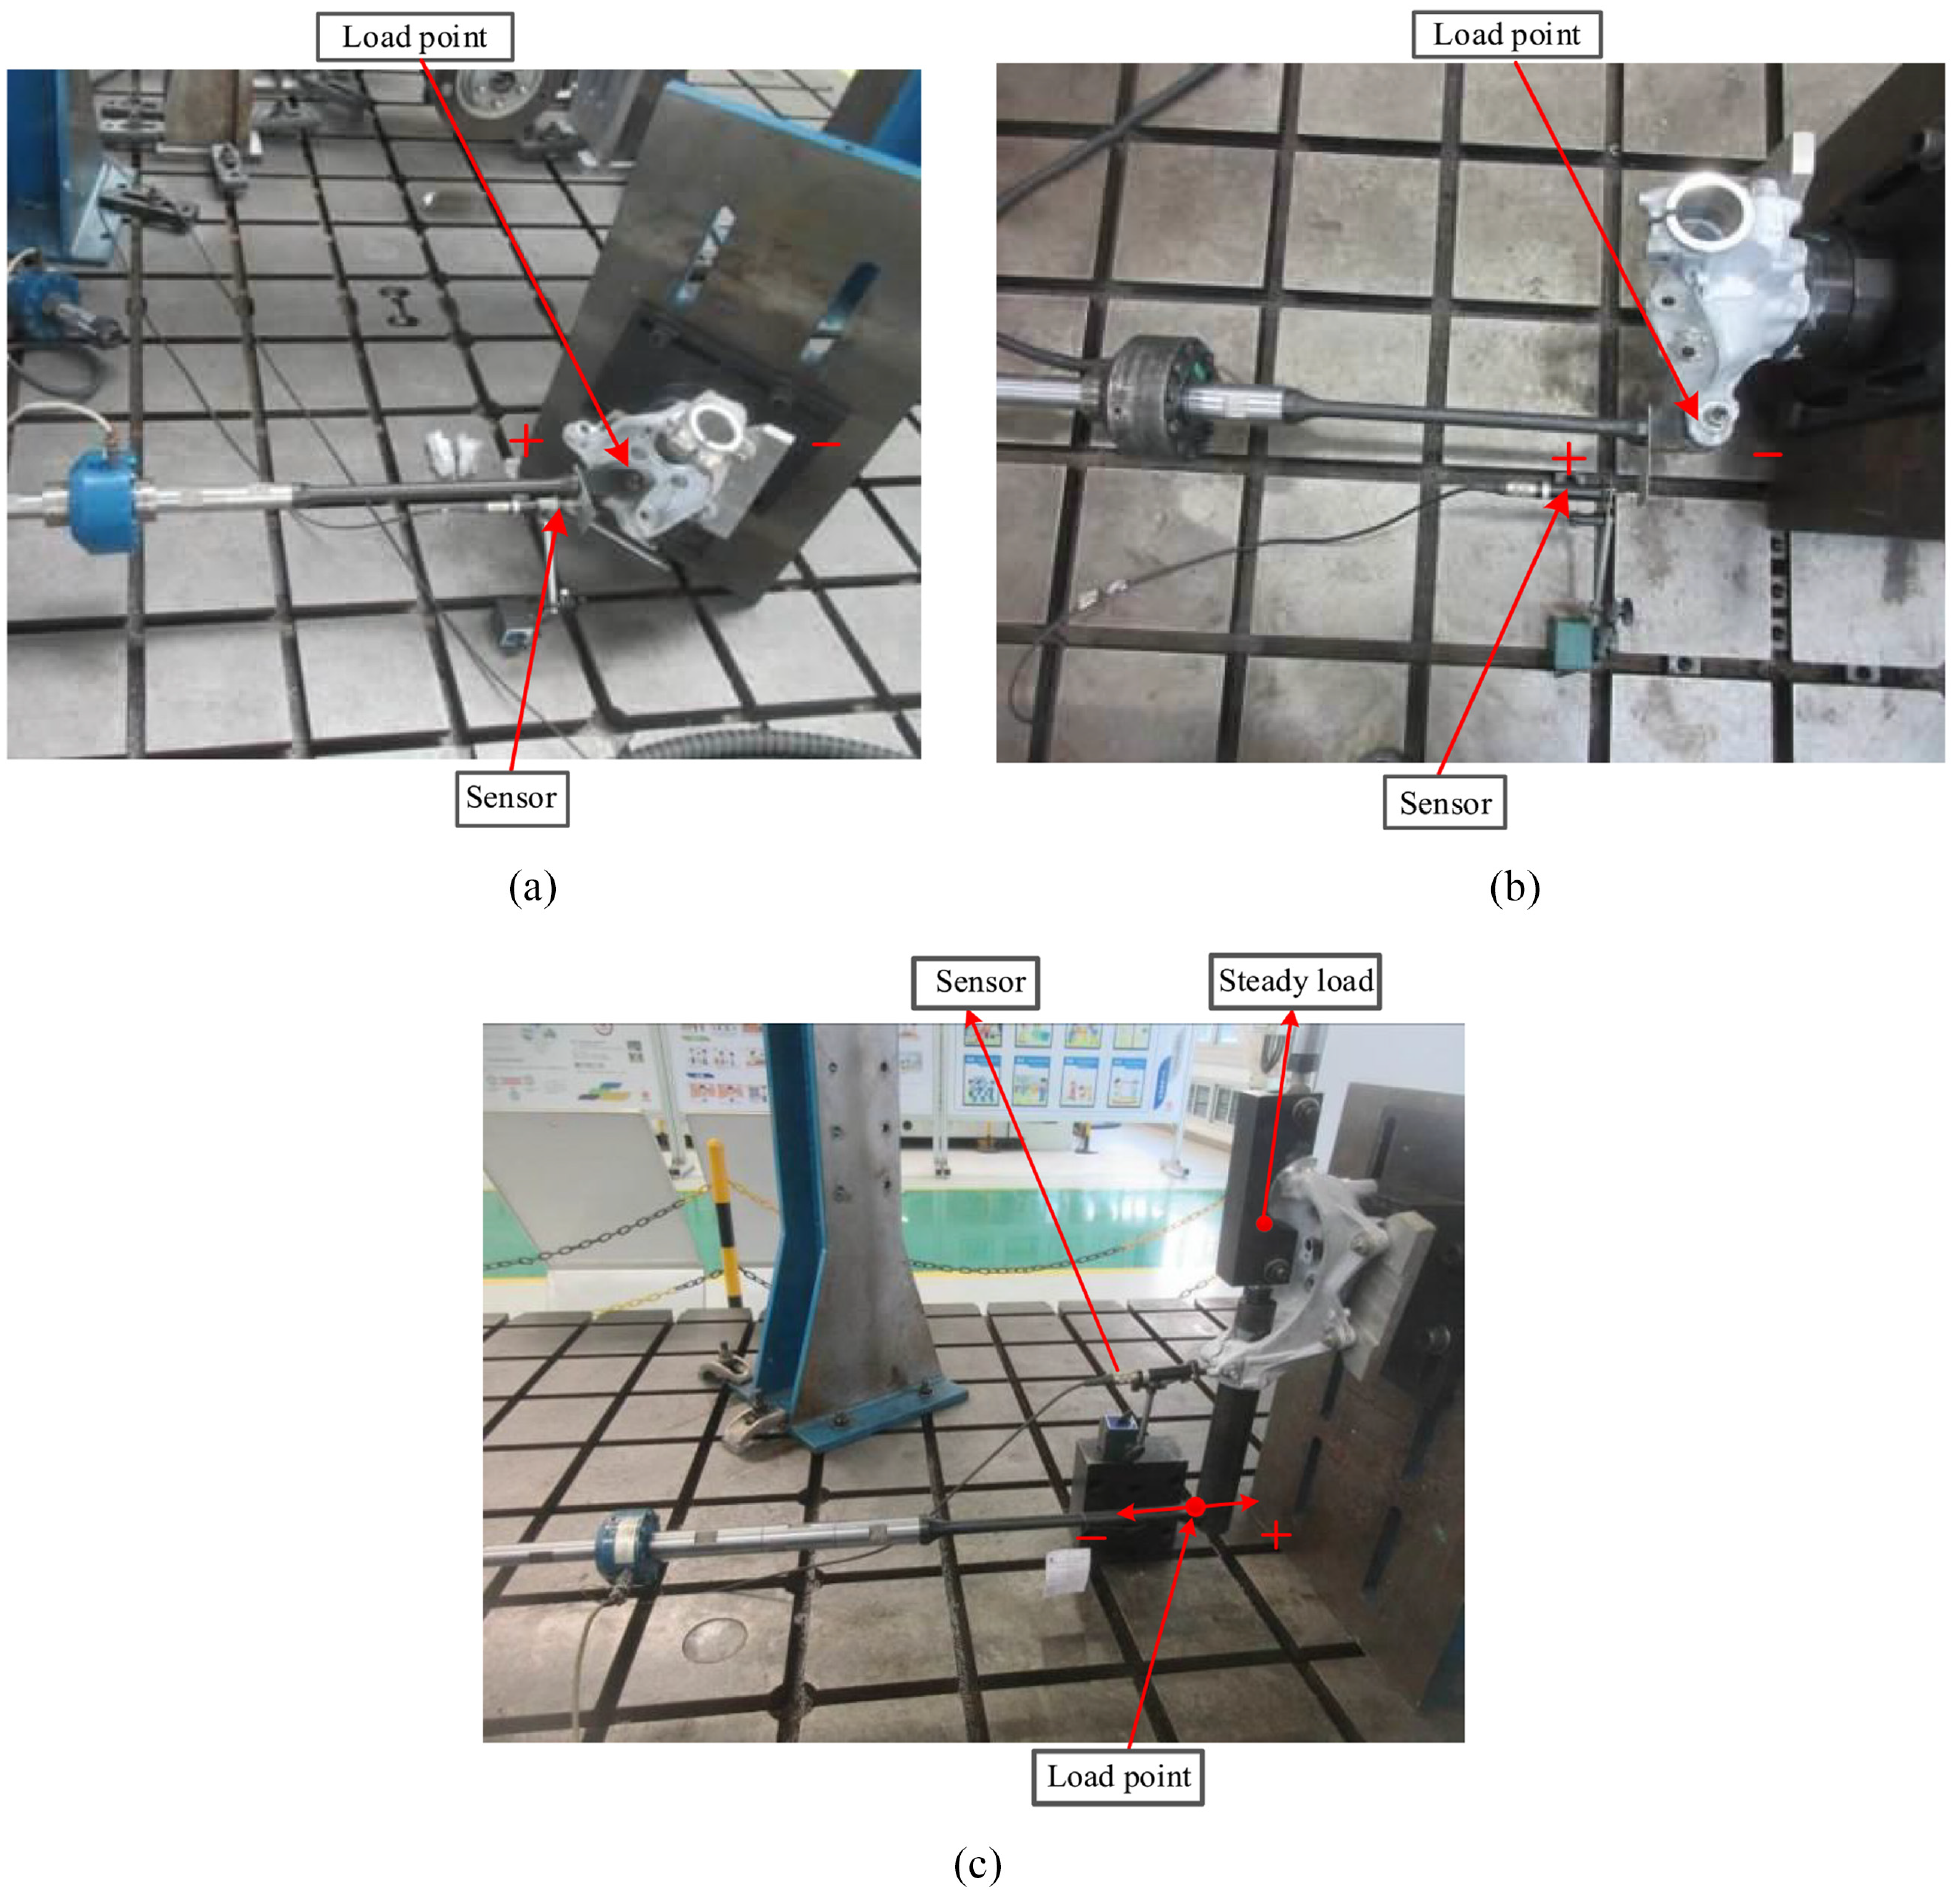
As shown in Figure 15, the validation test adopted the electro-hydraulic servo valve of MOOG company and the linear actuator produced by MTS company. The maximum dynamic test load is ±100 kN, and the maximum stroke range is ±150 mm. The hydraulic actuator was connected to the joints of the lower control arm, tie rod, and shock absorber of the steering knuckle with the ball studs, respectively. The loads were applied according to the BAB (German abbreviation for Bauteilauslegungsblatt) standard.
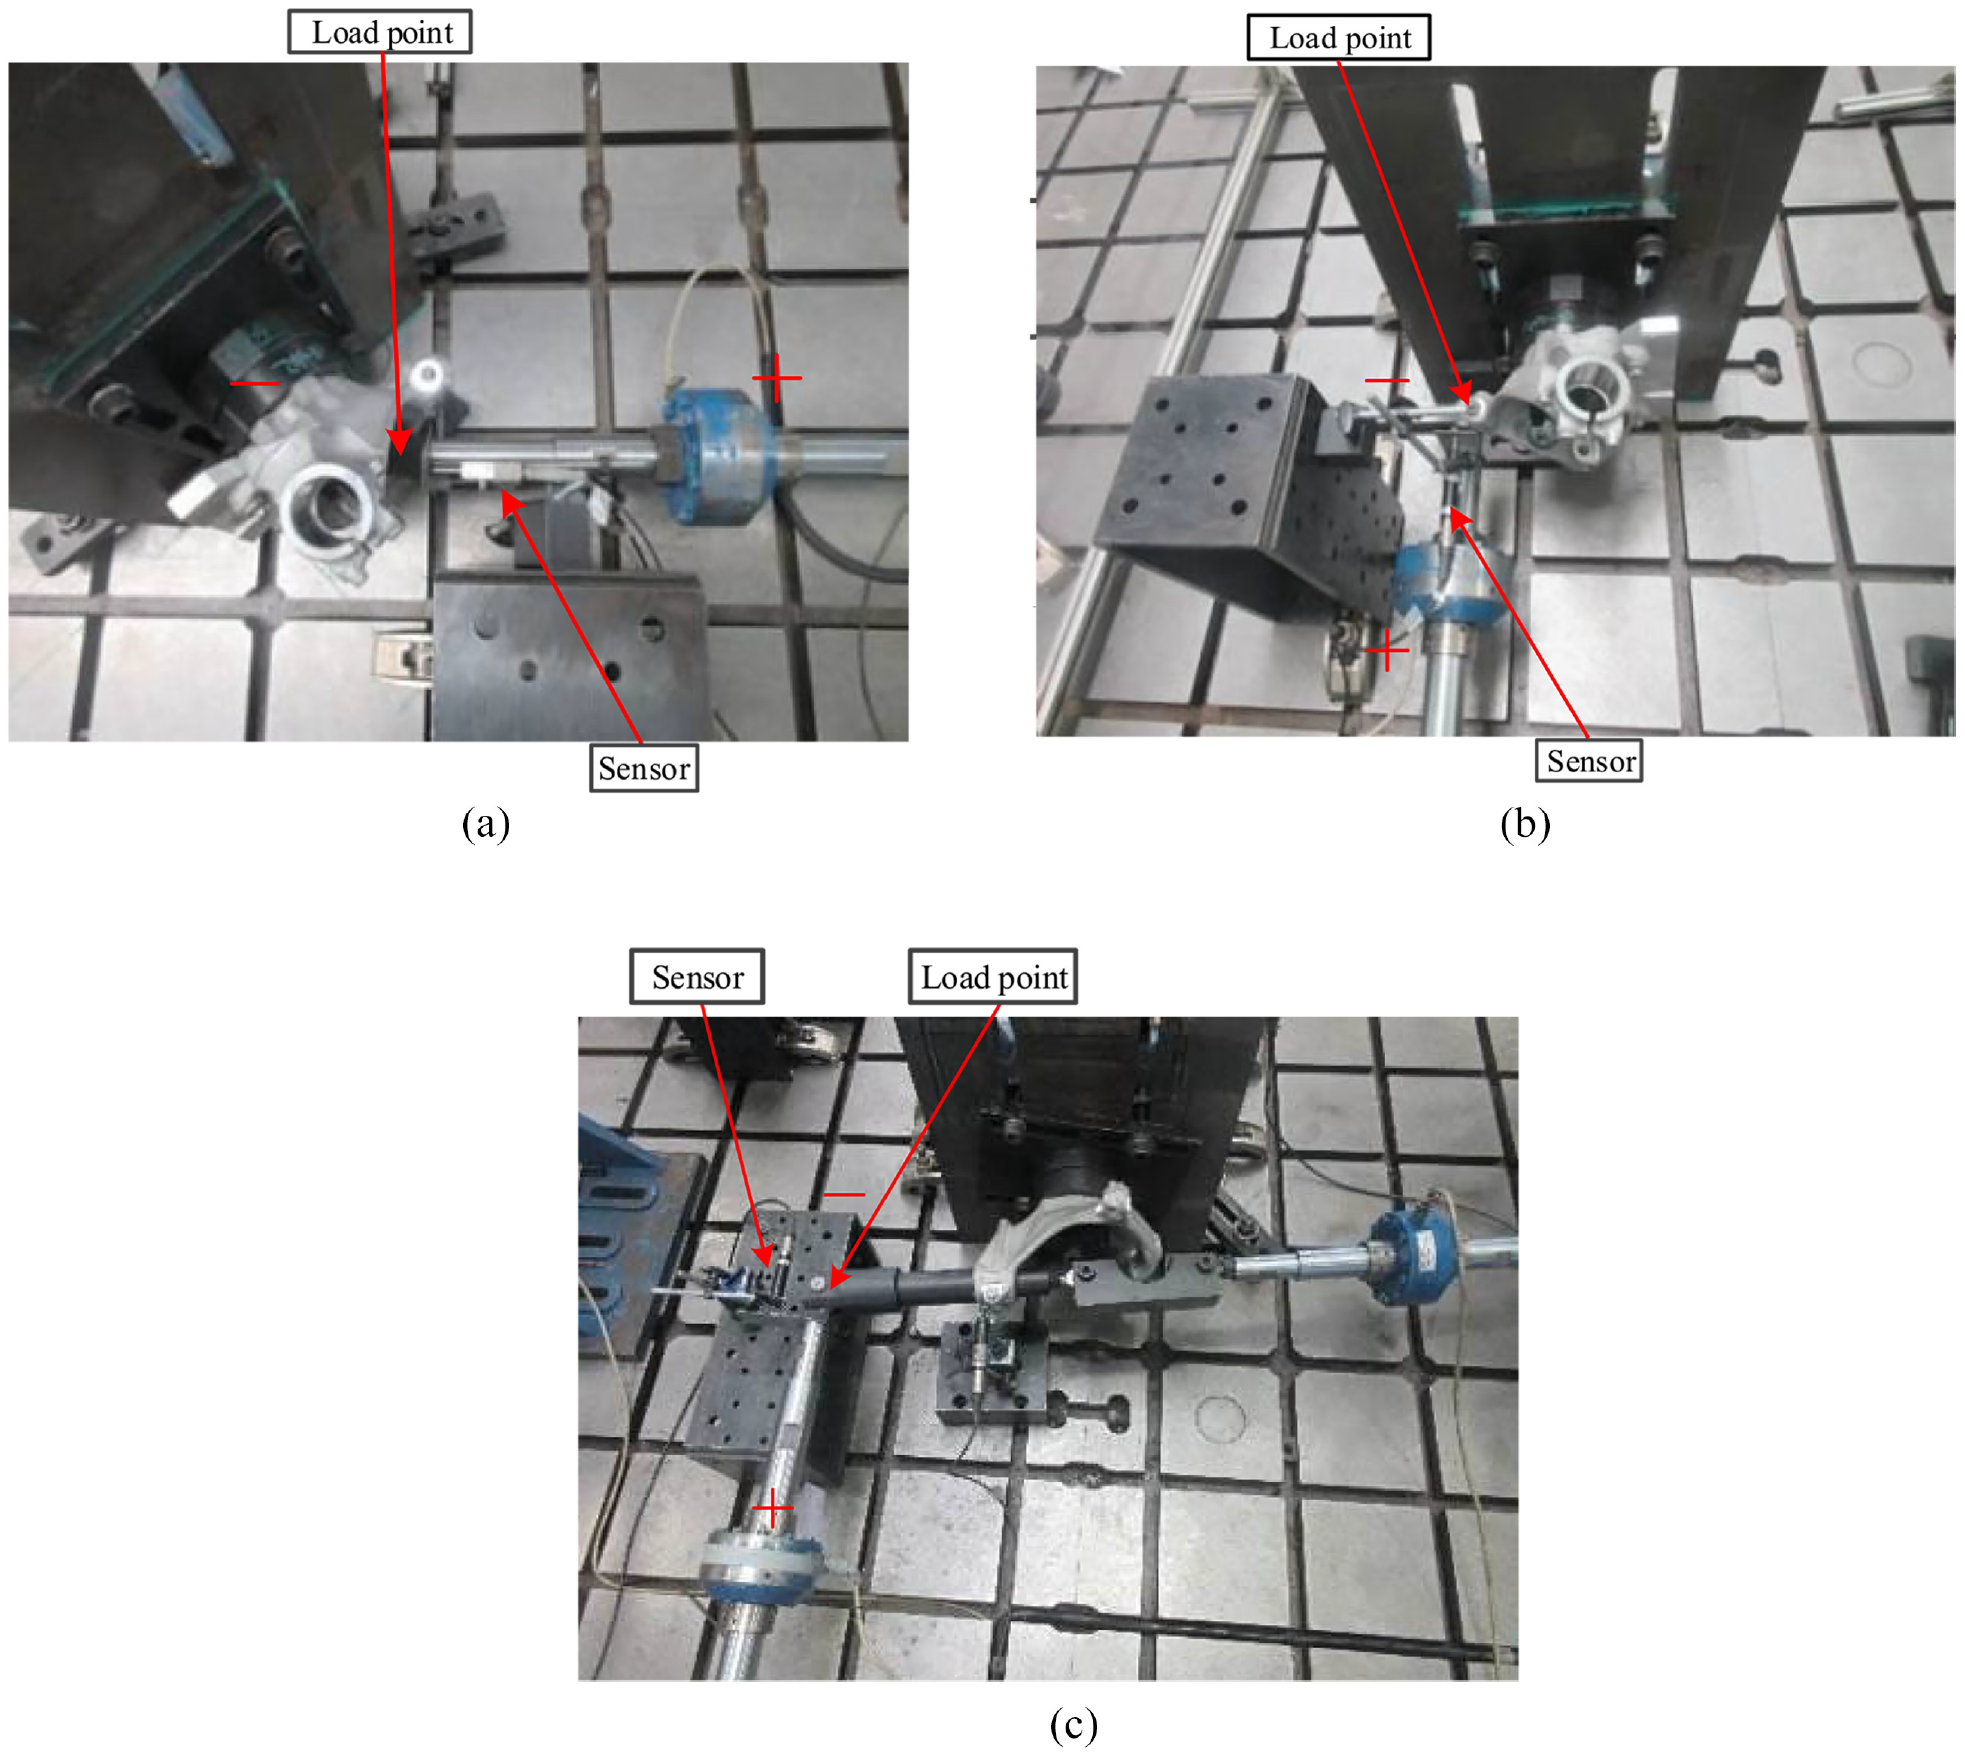
The quasi-static test bench: (a) working condition 1 (b) working condition 2, and (c) working condition 3.
Quasi-static validation
The quasi-static tests were carried out to verify the proposed quasi-static prediction method, as shown in Figure 15. The external displacement sensors were arranged on the load points, and the load conditions were consistent with Table 3.
The quasi-static test scheme in this paper is: First, increase the tensile load to the FFD load. Then, release the FFD load and increase the tensile load by 12.5% of the FFD load on the basis of the initial FFD load. This process is repeated until a quasi-static failure of the steering knuckle occurs. Furthermore, the test will also be terminated if no quasi-static failure occurs when the tensile load reaches the upper limit of Table 3.
Figure 16 shows the steering knuckles after the quasi-static tests. In Figure 16(a), we found no quasi-static failure of the steering knuckle in working condition 1, but residual deformation still existed. Figure 16(b) and (c) show that the steering knuckles under working conditions 2 and 3 had experienced quasi-static failures.
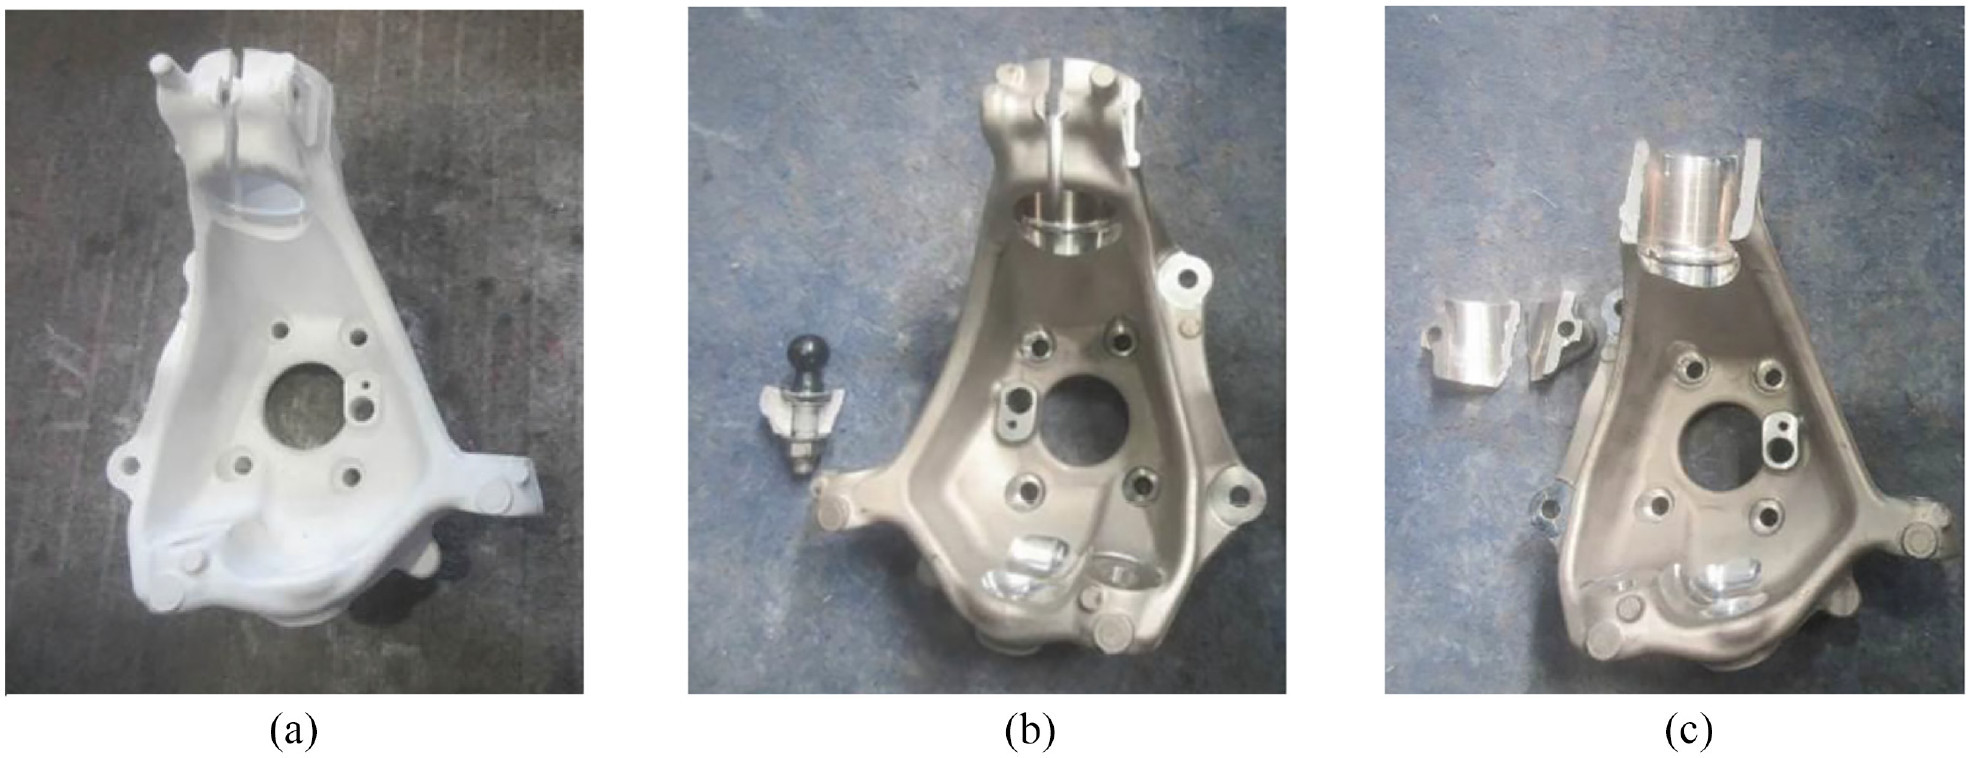
The steering knuckles after the quasi-static test: (a) working condition 1, (b) working condition 2, and (c) working condition 3.
Figure 17 shows the load-displacement curves of the critical points under the three quasi-static working conditions. It was found that when the FFD load was unloaded, the residual displacement existed at the load point of the steering knuckle. Moreover, the residual displacement gradually increased with the cycle’s number of tensile loads. Figure 17(a) shows that the steering knuckle still has no quasi-static failure when loaded to 90 kN for the fifth time. Besides, in the fifth loading-unloading cycle, the displacement of the load point increased from 2.85 to 6.23 mm, which means the increment was 3.38 mm. The test was terminated because the fifth loading value reached the upper limit.
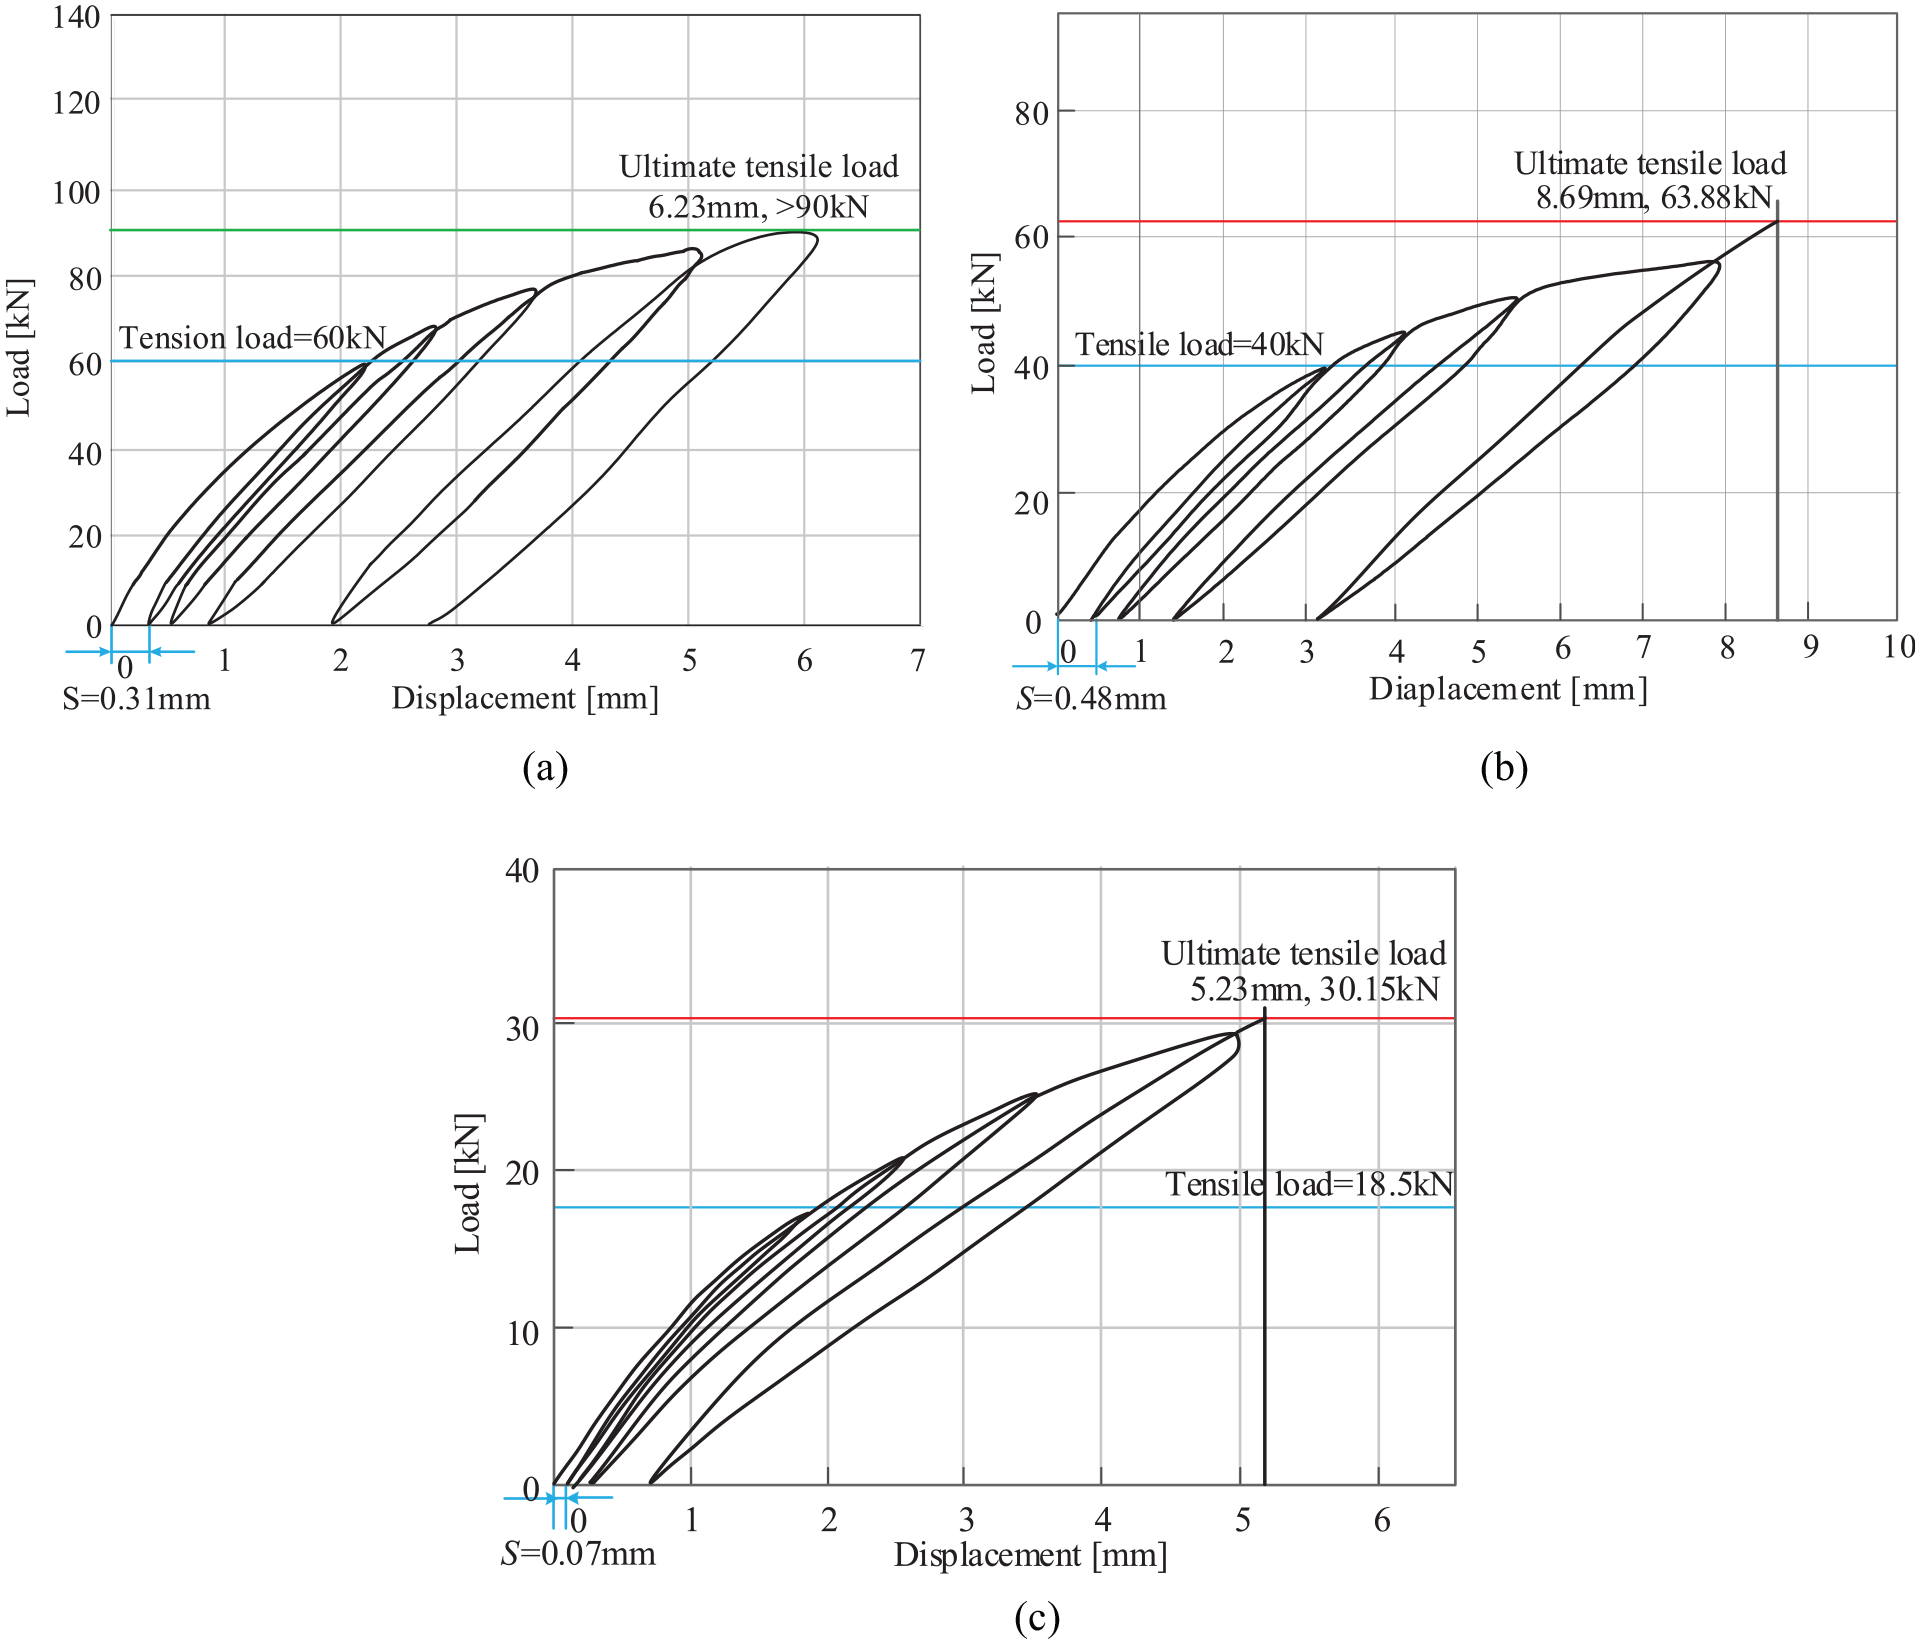
The load-displacement curves at the load points: (a) working condition 1, (b) working condition 2, and (c) working condition 3.
As shown in Figure 17(b), the steering knuckle appeared quasi-static failure when loaded to 63.88 kN for the fifth time. During the fifth loading process, the displacement value of the load point increased from 3.21 to 8.69 mm, which means the increment was 5.48 mm.
As shown in Figure 17(c), the steering knuckle appeared quasi-static failure when loaded to 30.15 kN for the fifth time. During the fifth loading process, the displacement value of the load point increased from 0.8 to 5.23 mm, which means the increment is 4.43 mm.
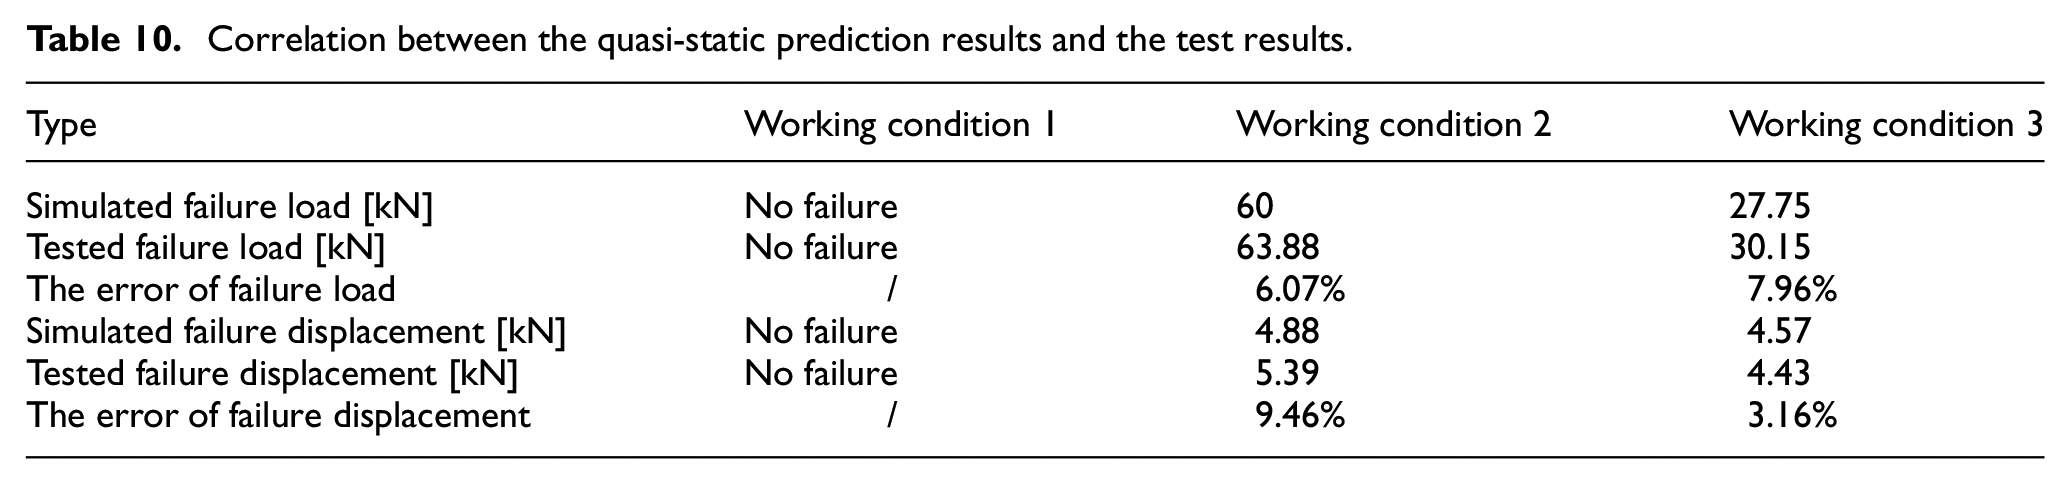
Table 10 summarizes the correlation between the predicted and test results under the quasi-static test conditions. From the comparison results, the error of failure load and the failure displacement of all cases are within a reasonable range according to the ISO standard. Therefore, the applicability and accuracy of the proposed quasi-static failure prediction method are confirmed.
Correlation between the quasi-static prediction results and the test results.
Fatigue failure validation
As shown in Figure 18, the fatigue tests were performed on the steering knuckles to validate the improved subcritical plane prediction model. The cyclic load conditions were consistent with those in Table 8. Moreover, all the load cases were in the form of sinusoidal reciprocation. The external displacement sensors were used to measure the axial displacement of the load points. In the automotive design process, the appearance of macro cracks is not allowed since the surface cracks will progress gradually in the depth of the component and eventually lead to fracture. 24 Therefore, the displacement of 0.2 mm was served as the shut-off criteria according to the enterprise test standard.
The fatigue test bench: (a) lower control arm, (b) tie rod, and (c) shock absorber.
The fatigue test scheme is to apply the cyclic loads to the steering knuckles according to Table 8. Terminates the test when the load points’ displacement reaches the shut-off criteria and then records the number of cycles. Moreover, the fatigue test will also be terminated if the steering knuckle does not fail after 340,000 cycles. Thus, the fatigue tests were carried out on seven steering knuckles under each load case in Table 8 to make the test results credible and facilitate subsequent statistics.
According to the test results, when the test reached the shut-off criteria, cracks appeared on the surface of the steering knuckles at the same position under each load case. Figure 19(a) shows the crack’s location at the outer edge of the joint area with the lower control arm. Figure 19(b) shows the crack’s location on both sides of the outer wall. From Figure 19(c), one is located at the outer wall, and the other is located at the contact part of the steering knuckle with the pin. It can be seen that the failure positions predicted by the CAE simulation are highly consistent with the test results.
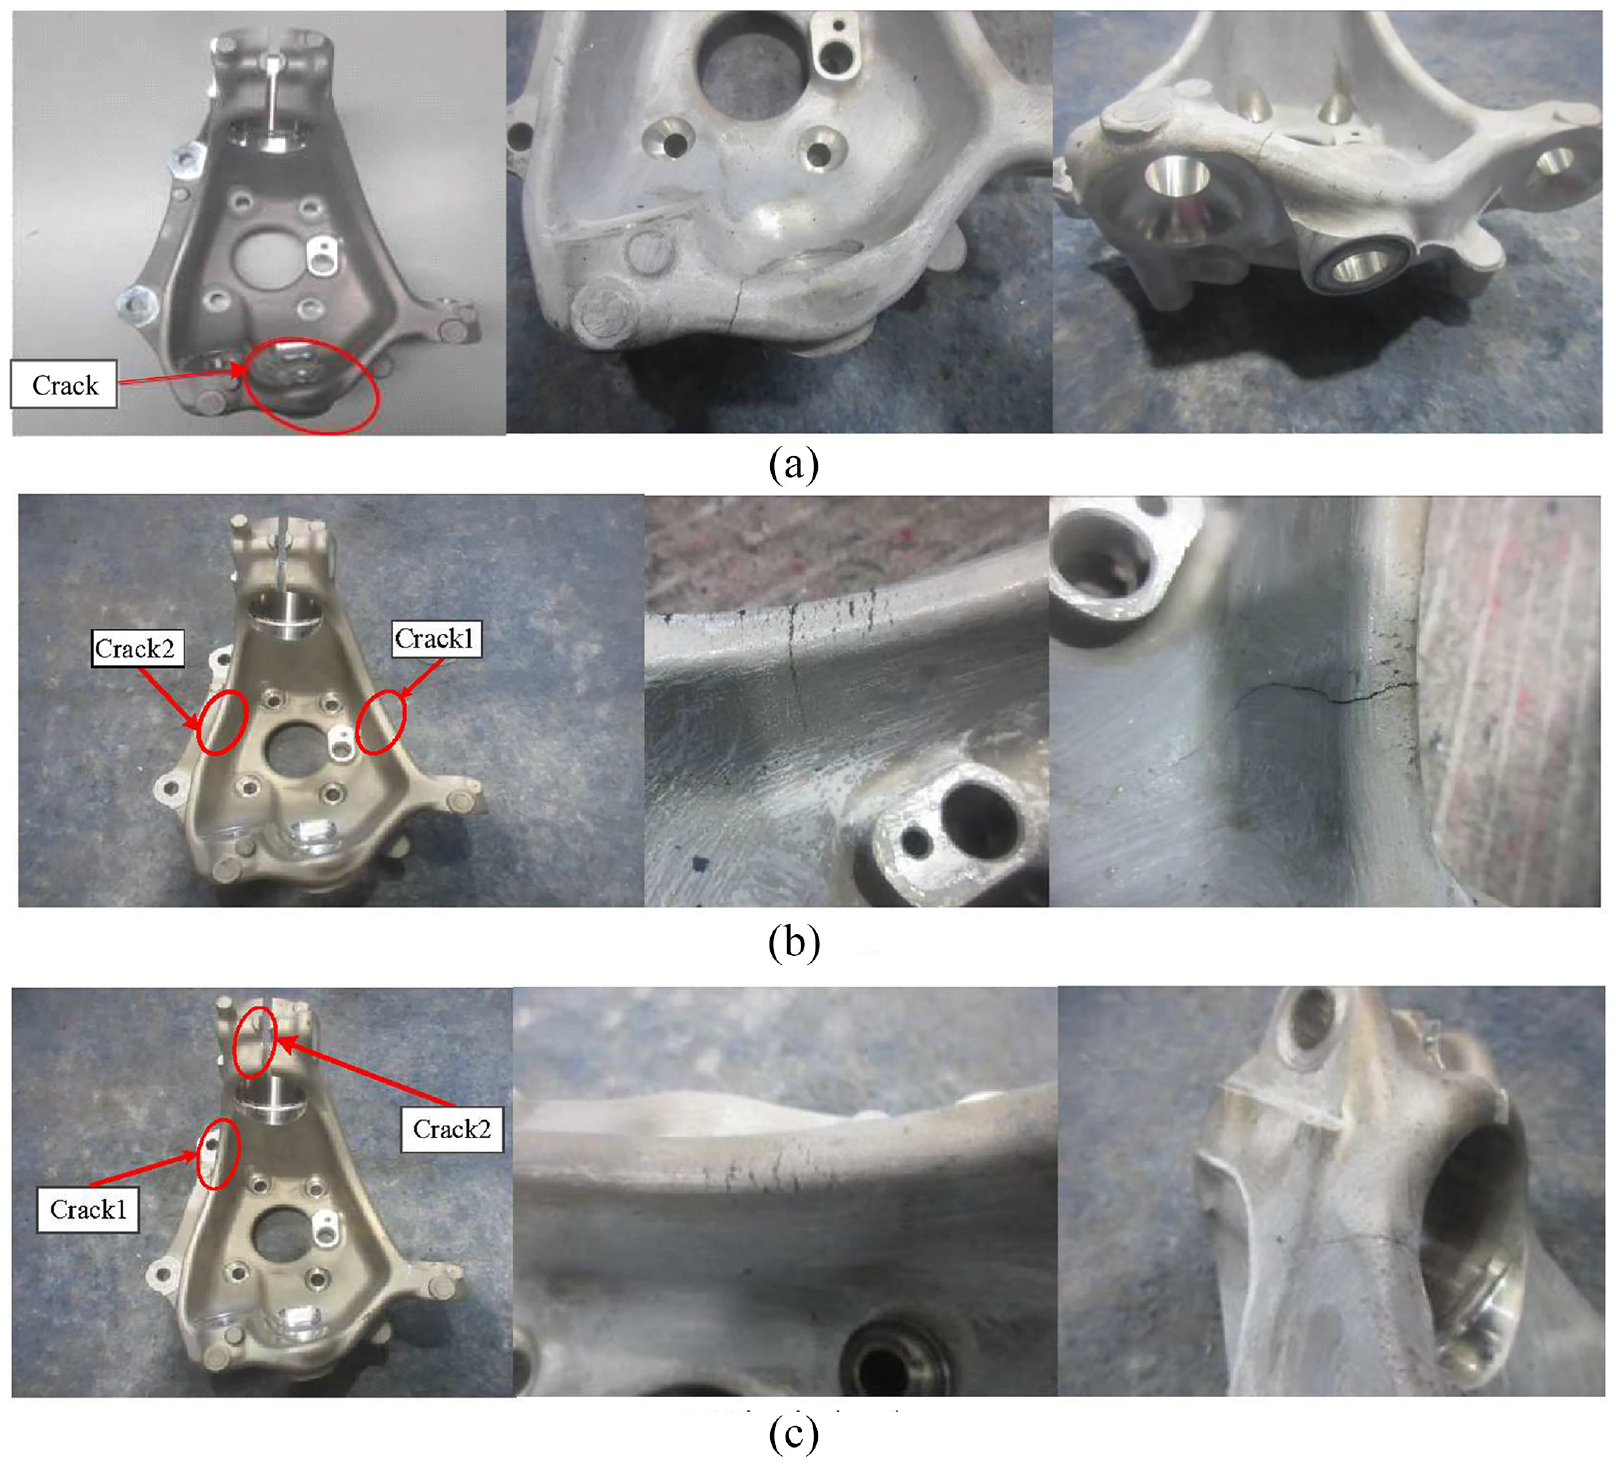
The fatigue test results: (a) lower control arm, (b) tie rod, and (c) shock absorber.
According to the BAB criterion, the lower limits of the cycle numbers corresponding to the 10% and the 50% failure reliability are 1000,000 and 1700,000, respectively. Moreover, the test results exceeding the corresponding lower limit are considered qualified. In general, we take 50% failure reliability as the design standard. The correlations between the fatigue life prediction results and the test results are shown in Figure 20. From the comparison results, all the test results can meet the 10% failure reliability and the 50% failure reliability. Besides, it can be seen that the fatigue life prediction results of the FS model deviate from the improved subcritical plane (S-P) model.
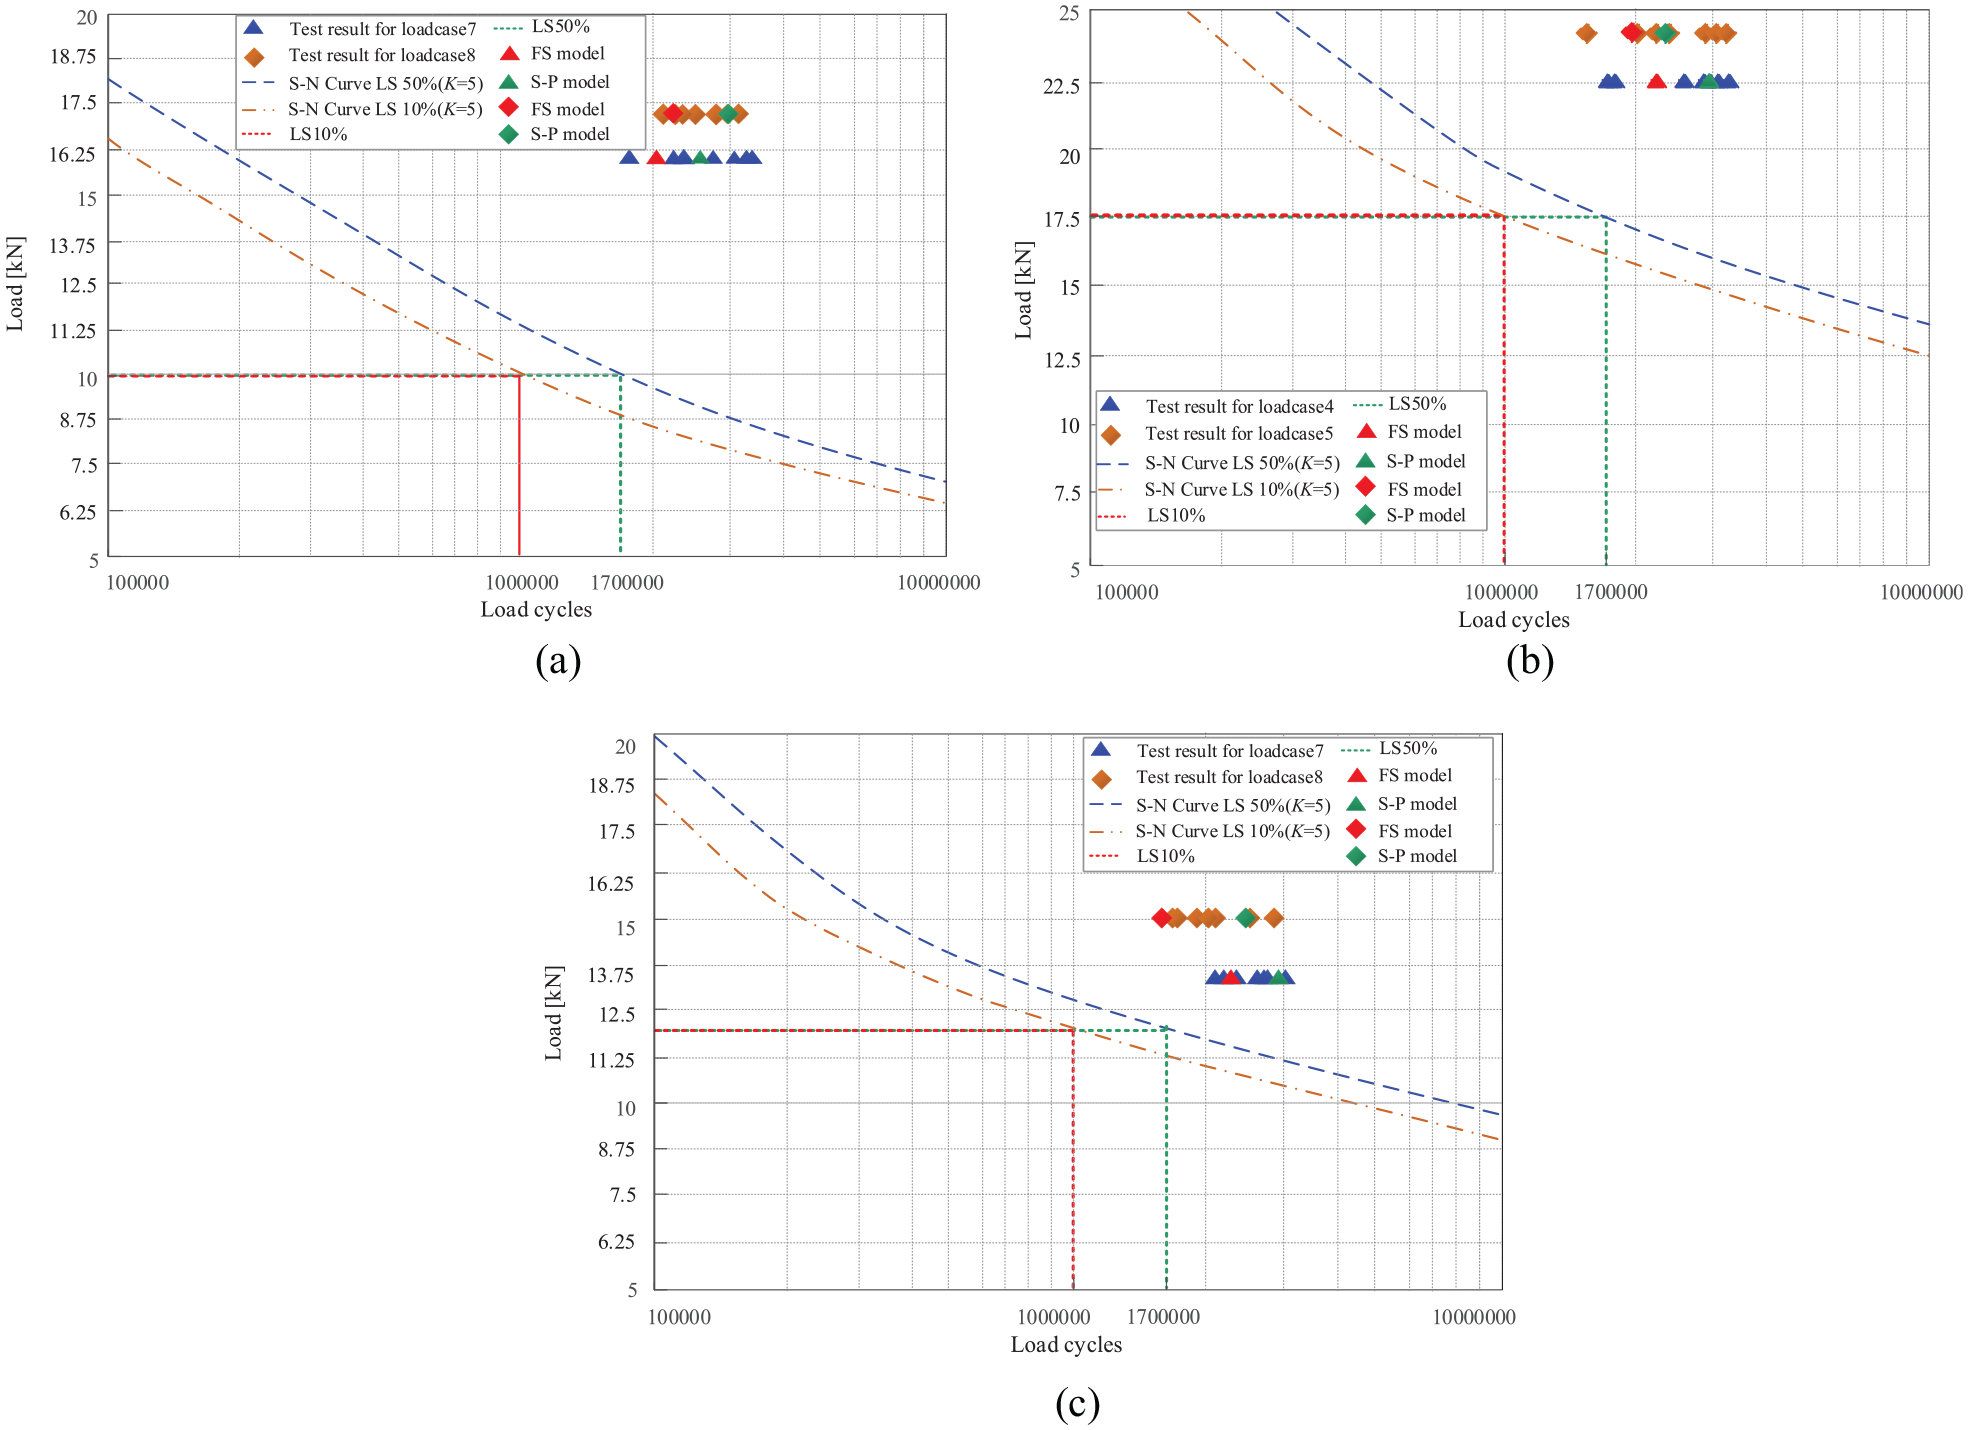
Correlation between the fatigue life prediction results and test results: (a) lower control arm, (b) tie rod, and (c) shock absorber.
The Weibull distribution model is widely used in the mechanical components’ fatigue life statistics. Specifically, this study will compare the accuracy of the two prediction models by this model. At first, the number of cycles for 50% failure reliability (N50%) of the test results is estimated by the linear least square method. The following equation determines the frequency of occurrence of each test result:
where n is the number of test samples; i = 1–n. Generally, the least square method of Weibull distribution adopts the inverse transformation method, and its cumulative distribution function has the following form 25 :
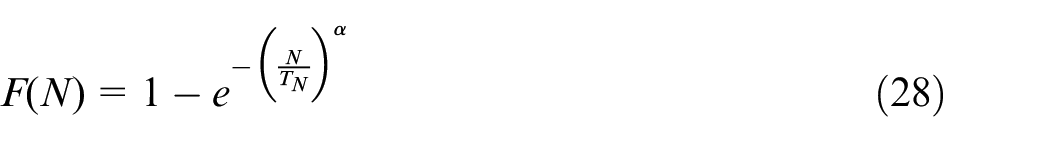
where TN is the characteristic number of the load cycles;
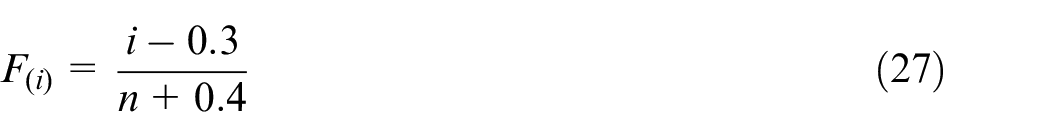
The data of failure cycles are sorted from smallest to largest, so the independent variables of the regression model, N1, N2…Nn are also sorted from smallest to largest. For the test samples with uncensored data, the approximate median rank formula can be used to estimate the failure probability of each failure cycle number:
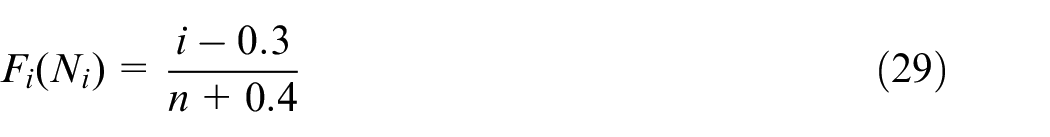
According to equation (29), we can obtain the dependent variables Y1, Y2…, Yn. Then the regression coefficients d and f are estimated by the least square method:
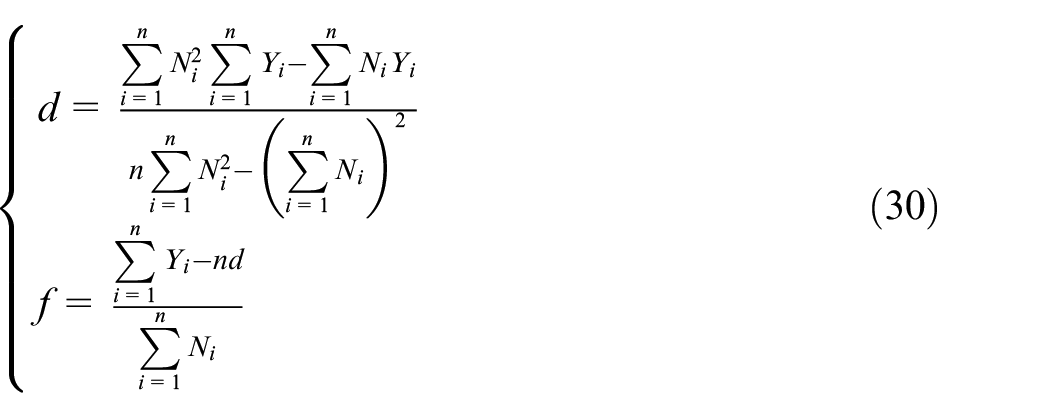
The estimated values of shape and size parameters are obtained by inverse transformation:

Based on the above, the number of cycles for 50% failure reliability of the test results is obtained:

Thus, the Weibull distributions for the fatigue test results are shown in Figure 21.
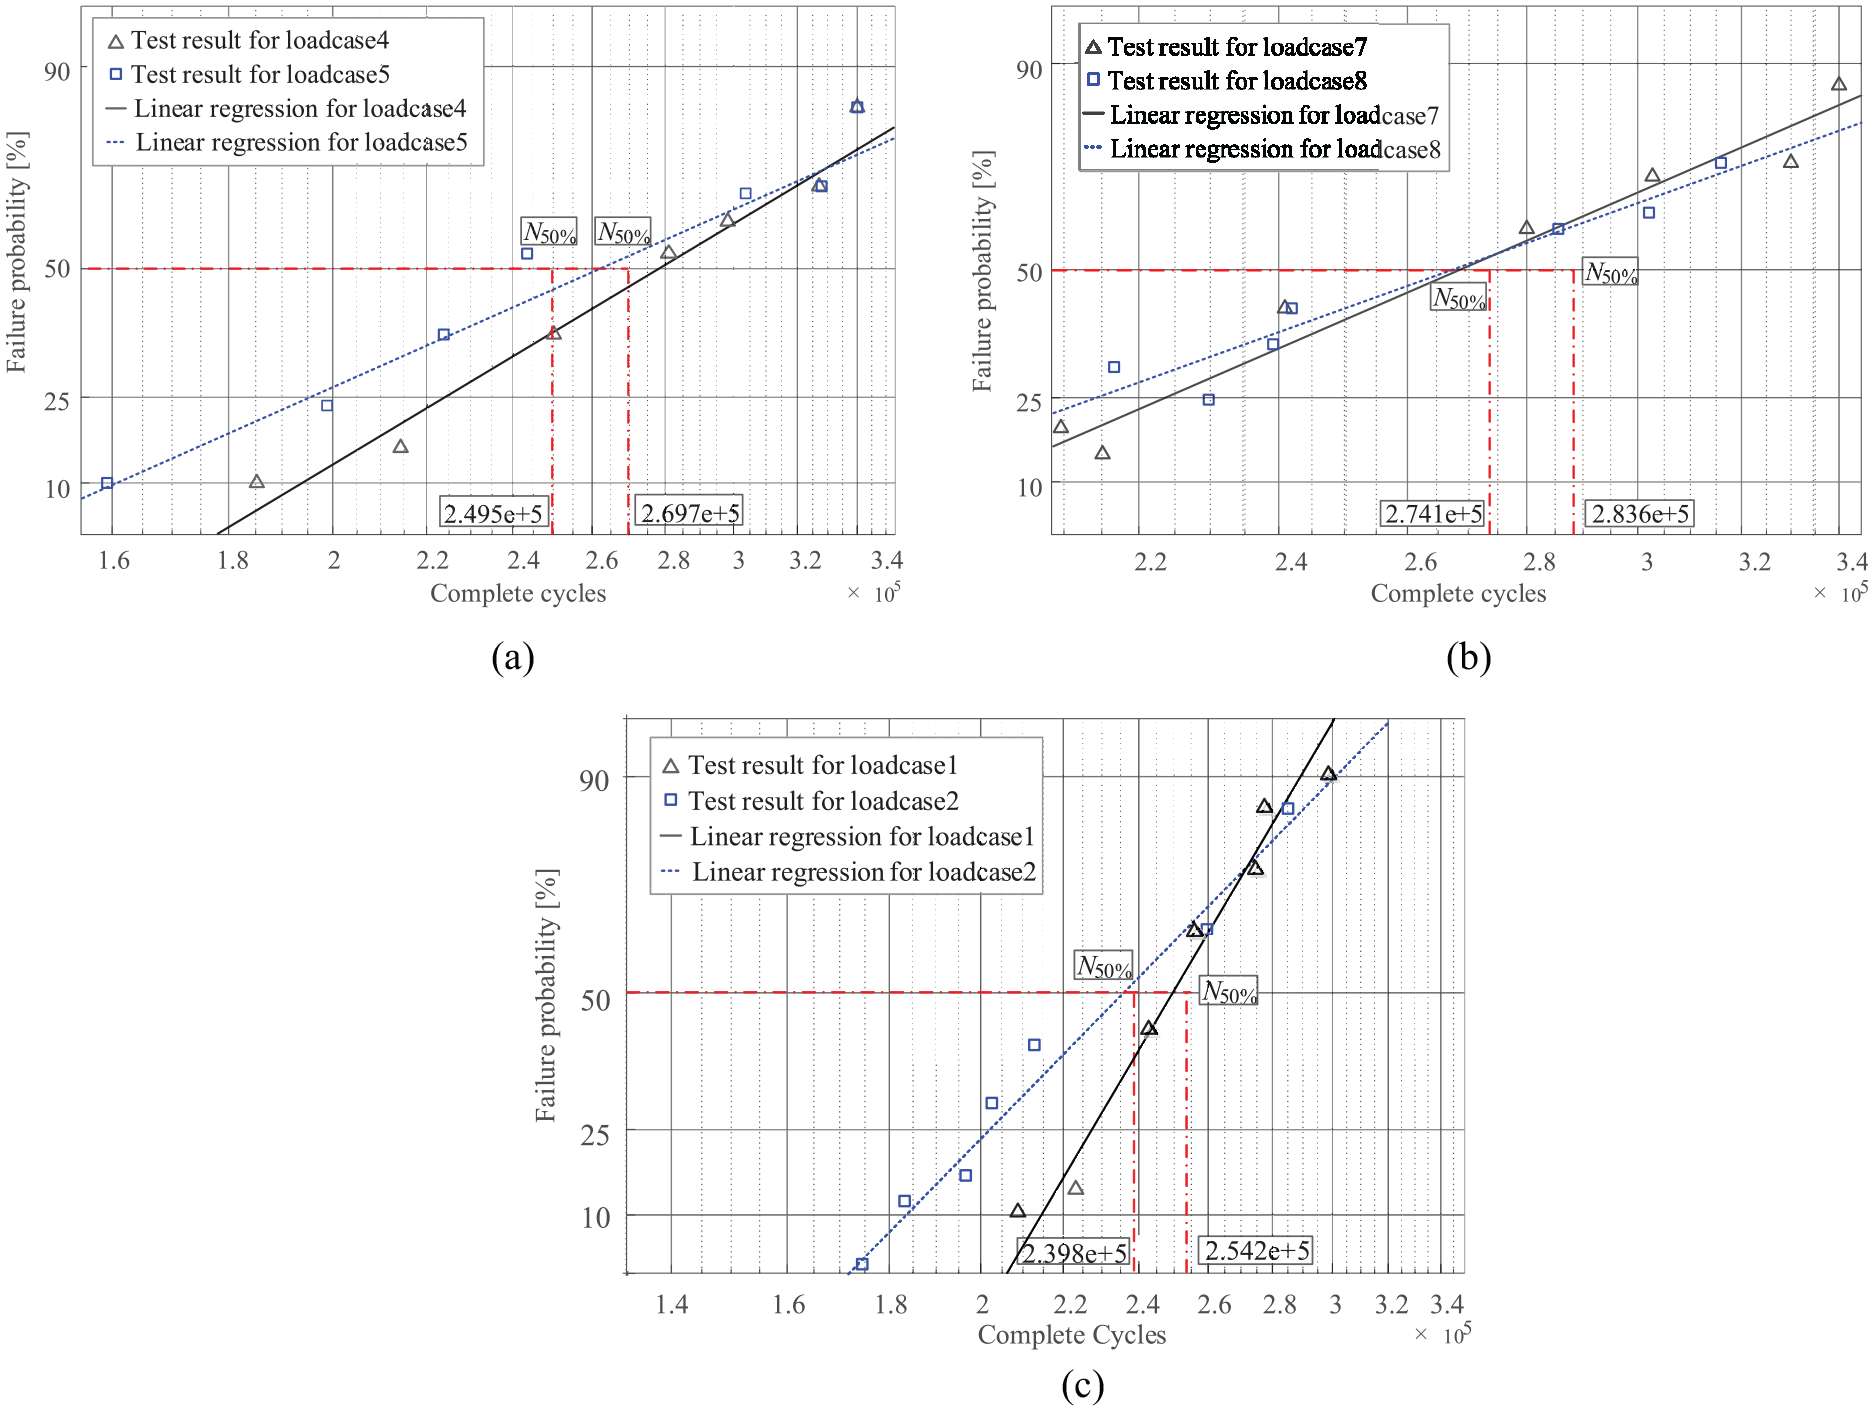
The Weibull distributions of the test results: (a) low control arm, (b) tie rod, and (c) shock absorber.
We summarized the N50% of the six load cases based on the test results in Figure 21. The statistics N50% and the predicted results of the two models are shown in Table 11.
Comparison between the statistics N50% and the predicted results.
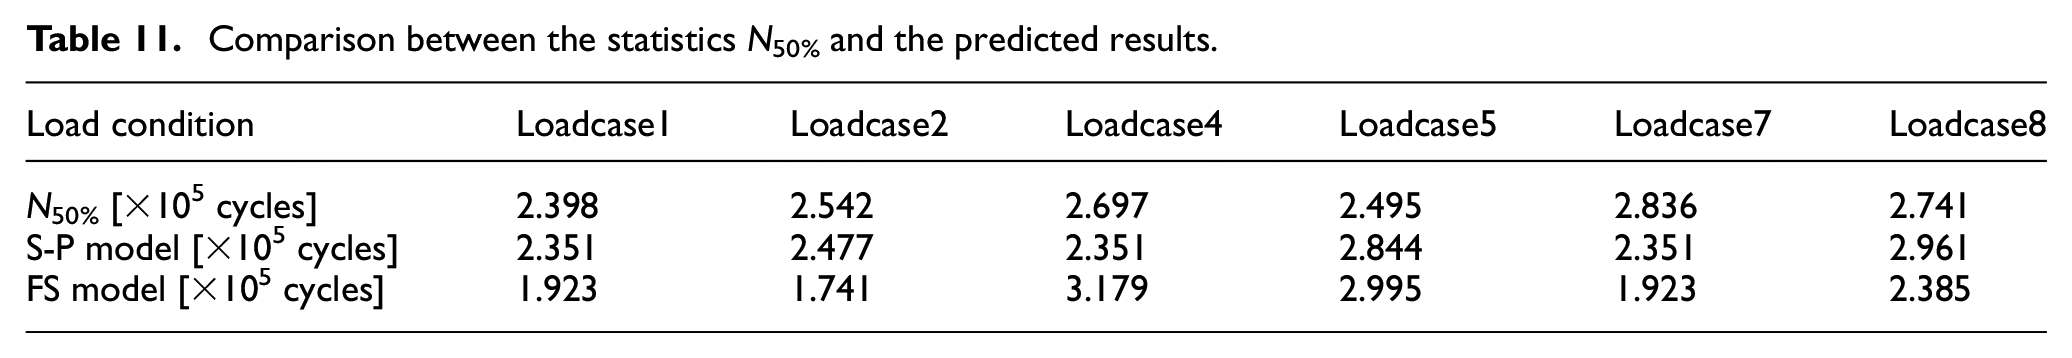
As shown in Table 11, the predicted results of the improved subcritical plane model are closer to N50% than the FS model. The lowest errors of the two predicted models are 2.12% and 8.7%, respectively, indicating that the predicted results of the improved subcritical plane model had a better correlation with the test results.
Conclusion
CAE technology has become the main development tool of the automotive industry for its intuitive and convenient advantages. However, current research still lacks a good combination of CAE technology and failure prediction models. This paper first proposes a quasi-static failure prediction method by introducing the deformation gradient concept. The method combines CAE simulation results and the J-C criterion, which is more suitable for predicting the quasi-static failure of components under large deformation conditions. Subsequently, the subcritical plane model is improved by taking the FS prediction model as a reference and considering the cyclic hardening effect of materials. The improved model can accurately predict the fatigue failure of components. Then, taking the steering knuckle in the McPherson front suspension system as the research object, the quasi-static failure and fatigue failure of the steering knuckle are predicted by the proposed method and improved model, respectively. Finally, the rig test results verify the applicability and accuracy of the failure prediction methods. The main conclusions are as follows:
(1) When the component is unloaded after applying the tension load to the material’s elastic limit, residual displacement exists at the critical point. Furthermore, the residual displacement becomes larger with the increasing tensile load.
(2) The applicability of the proposed quasi-static failure prediction method is validated by comparing the predicted results with the quasi-static uniaxial tensile test results. Among them, the maximum error of failure load is 6.47%. The maximum error of failure displacement is 9.46%, which are within the reasonable range of ISO standard in the automotive industry.
(3) The fatigue life prediction results of the improved subcritical plane method are different from those of the traditional FS method. Compared with the N50% of the Weibull distribution model obtained from the rig tests, their maximum errors are 2.12% and 8.7%, respectively. The comparison results indicate that the improved subcritical plane model obtains more accurate results due to the additional consideration of the cyclic hardening parameter.
Footnotes
Appendix
Declaration of conflicting interests
The author(s) declared no potential conflicts of interest with respect to the research, authorship, and/or publication of this article.
Funding
The author(s) disclosed receipt of the following financial support for the research, authorship, and/or publication of this article: This work was supported by the National Natural Science Foundation of China [granted numbers. 51675091]