
Abstract
Road transportations still play a dominant role in goods delivery, and driving behaviours significantly affect the fuel economy of heavy-duty trucks. Plenty of fossil fuel is wasted as a result of unreasonable driving behaviours even in the case of highly experienced drivers. The objective of this paper is to analyse drivers’ behaviours over two segments of motorways and estimate the potential benefits of fuel saving caused by a change in driving habits during national and international goods delivery. Drivers’ habits on motorways change depending on the road situations. In the acceleration process, the fuel consumption rates are huge even under low-speed conditions. The truck fuel consumption rates are exaggerated by positive road slopes, but still dominated by acceleration. Accelerations are generally in normal distributions, with the median value being approximately 0.5 m/s2. The speed ranges corresponding to each gear enlarge with the increase in gear number. The potentials of annual fuel saving for parts of European Union countries are nearly 2 × 10⁶ m3 by adopting proper driving behaviours.
Introduction
Large amounts of fossil fuel are consumed by heavy-duty trucks for goods delivery in European Union (EU) countries, which leads to greenhouse gas emissions and aggravates the dependency of fossil fuel imports. Meanwhile, hazardous emissions from vehicles are partly responsible for environmental pollution.1,2 All kinds of measures have been taken to decrease fuel consumption and exhaust emissions, such as homogeneous charge compression ignition (HCCI), 3 variable valve timing, 4 thermal management,5–7 high-efficiency aftertreatment,8–10 alternative fuel,11,12 model predictive control (MPC), 13 light materials 14 and low rolling resistance tyres. 15 These technologies are aimed at improving engine thermal efficiency, decreasing energy loss, dropping the formation of exhaust pollutants and enhancing catalyst efficiency, from technical points. Another important factor, driving behaviours which are not related to vehicle technique, is closely linked with all vehicle performances. The fuel consumption varies significantly for each driver even on the same road and traffic conditions. Key performance indicators of driving behaviours include average speed, acceleration frequency, gear shift timing, brake pedal utilization and lane changes. 16
The effects of vehicle speed, accelerations and gear shift on fuel economy are directly linked by engine speed and load, which are the basic parameters dominating fuel consumption rates. Berry 17 analysed the effects of driving styles on real-world fuel consumption of light-duty vehicles on motorway. It is demonstrated that average speed and acceleration show similar importance in fuel consumption. The fuel economy is 5.0–16.5 L/100 km for the speed range of 10–180 km/h, where gear 4 is switched on around 65 km/h. Under the given speed range during acceleration, more gear shifts cause higher engine efficiency, which results in earlier gear upshifts as one of the methods for saving fuel. This makes the engine to operate in the ranges of optimal economy zones. Gonder et al. 18 indicated that reasonable driving can cause significant fuel saving by eliminating unnecessary idle events, adjusting the acceleration rate and vehicle speed to an optimal level, by which the fuel consumption can decrease by 20% for aggressive driving and 5%–10% for moderate driving under real-world conditions. There is also potential for lower fuel consumption by changing driving behaviours (using optimal gear) even under the given operating conditions (vehicle speed).
As effective approaches for improving driving behaviours, pre-training 19 and eco-driving instructions 20 show an excellent performance of fuel saving without much impact on vehicle speed. As shown in the work by Rutty et al., 21 eco-training was performed within the city of Calgary, with the purpose of decreasing idle events in order to reduce greenhouse emissions. The daily idle time drops by 4–10% per day, accompanied by 1.7 kg less CO2 emission. Díaz-Ramirez et al. 22 identified acceleration, deceleration and speed as the most important factors impacting eco-driving using freight heavy-duty trucks. The results also indicated that the average fuel economy is ∼1.716 L/(100 km t), while the fuel consumption drops by 6.8% after the eco-driving campaigns. The effect of driver training and simple advice on eco-driving is also compared 23 such that simple advice can effectively reduce fuel consumption, although the performance can be further improved after the training course. Table 1 summarizes the effect of driving behaviours on fuel economy over different types of vehicles. Buses have the smallest potential of improving fuel economy by changing driving behaviours, which may be due to the limitations of real driving situations where buses normally run in urban area with lots of traffic lights and station stops.
The effect of driving behaviours on fuel economy.
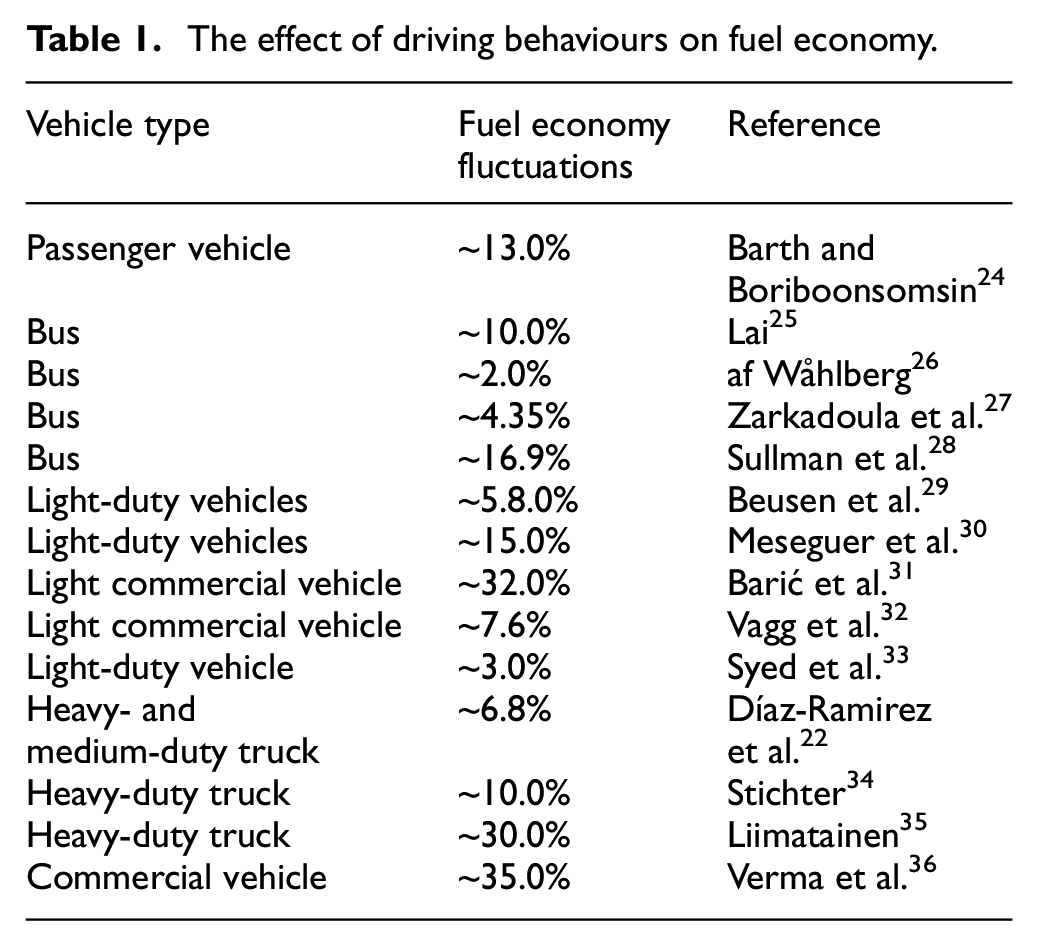
Summarizing the literature works, the potentials of fuel economy improvements caused by driving behaviours are in the range of 2.0–35.0%. To the authors’ knowledge, the literature is scarce to date and many questions regarding the influences of driving behaviours on the fuel economy of heavy-duty trucks over national and international motorways remain to be addressed, where large amounts of fuel are consumed annually. Especially, no test has been done on different drivers starting at the same time and location and driving on the same route to ensure the consistency of the test boundary conditions (road and traffic). In this work, heavy-duty truck tests under two motorway segments are conducted. The fuel consumption rates, driver operations, and truck movements (latitude, longitude and altitude) are recorded. The fuel consumptions of both the heavy-duty trucks under two motorway segments are investigated. The distributions of truck acceleration and fuel consumption, and gear shifts are analysed; furthermore, the fuel-saving potentials of freight transport in parts of EU countries are estimated when improving driver behaviours.
Experiment
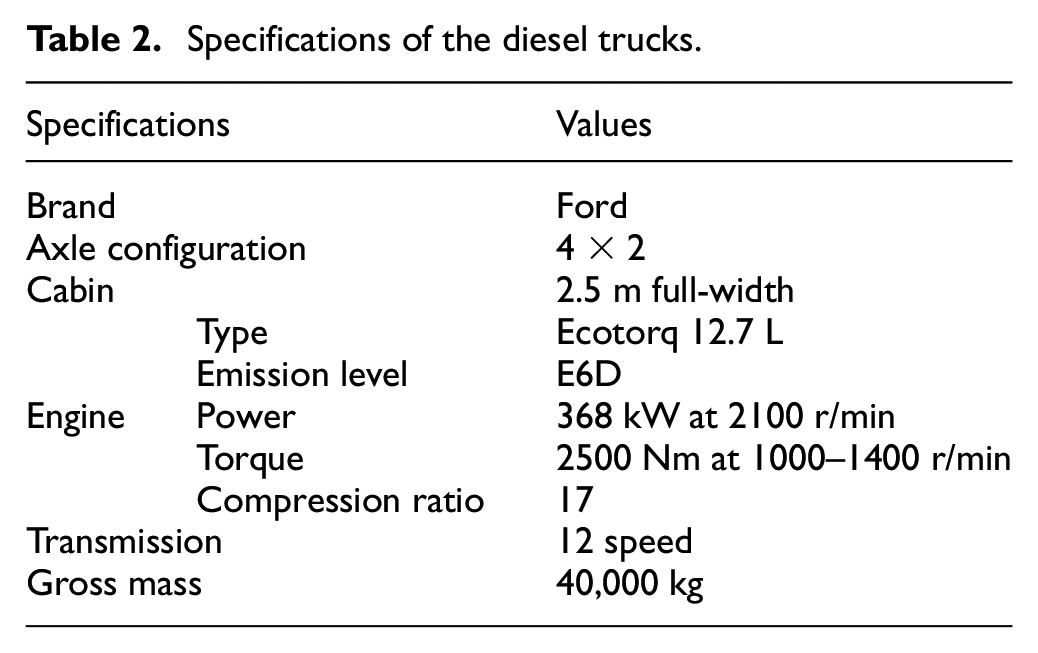
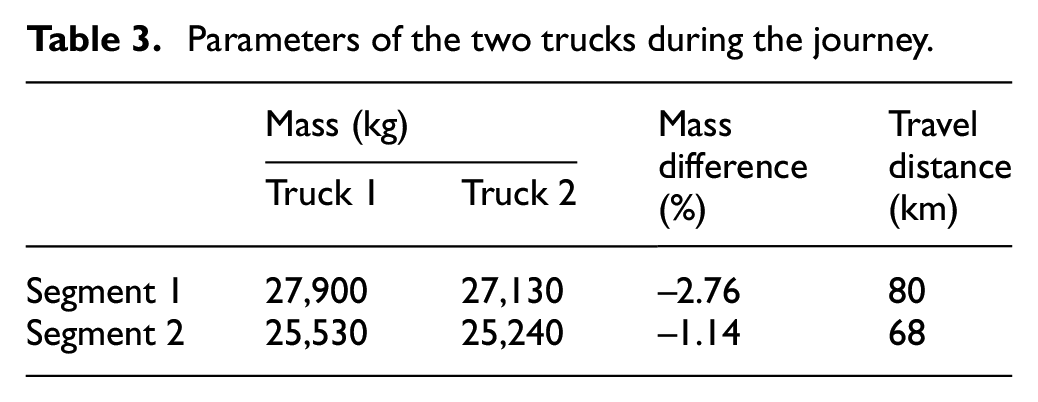
To investigate the driving behaviours and their effects on fuel economy over motorways, two partly loaded heavy-duty trucks are tested over two motorways of Italy. The specifications of the two trucks are the same, as shown in Table 2. The engine displacement of the trucks is 12.7 L, and their maximum power and torque outputs are 368 kW and 2500 N m, respectively. The emission level of the trucks is E6D. Both the heavy-duty trucks are used for regular freight delivery. The start and end positions of the two trucks are the same, and they depart at the same time, with the difference in arrival time being approximately 5 min. The mass (part loaded) of the two trucks during the journey are shown in Table 3, and the changes in the fuel mass are neglected. The two trucks are named as truck 1 and truck 2, respectively. Few differences in mass cause limited effect on the fuel economy, so it can be neglected. Both motorway segments on the Google Earth are shown in Figure 1. Onboard GPS devices were installed on the vehicles. During the journey, the trucks’ three-dimensional (3D) trajectories (latitude, longitude and elevation), fuel consumption rates and drivers’ behaviours (gear shift, brake and acceleration pedal positions) are recorded in CANBUS. The fuel consumption rate is calculated by instantaneous air mass rate and air/fuel ratio. The data collection frequency is 10 Hz. The traffic conditions are almost the same for the two drivers over both motorways. It ensures the same boundary conditions for the two driving tests.
Specifications of the diesel trucks.
Parameters of the two trucks during the journey.
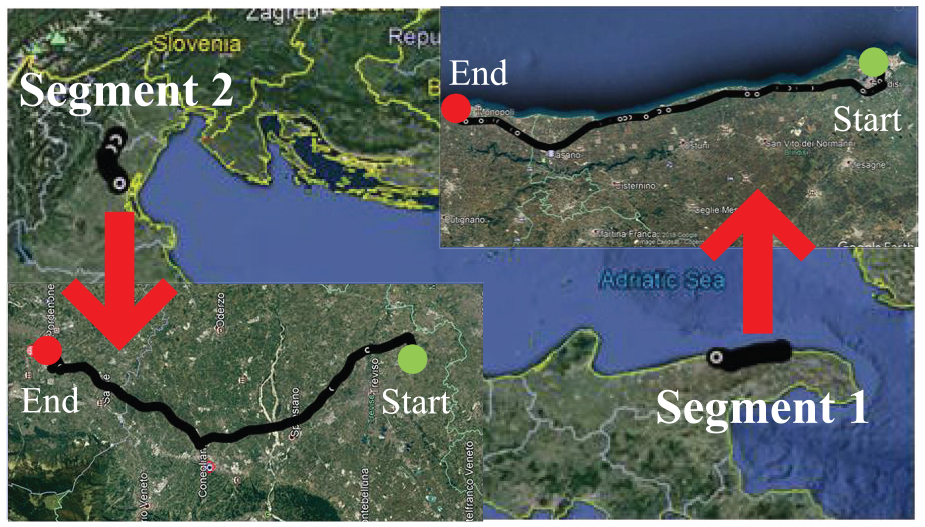
Two motorways in Italy.
Results and discussion
In the process of truck cruising, vehicle speed, fuel consumption rates and road elevations are recorded for the two heavy-duty trucks over both motorways, as shown in Figures 2 and 3. Both trucks start at the same time and location, which ensures similar traffic conditions which can trigger a huge impact on fuel economy. In terms of road segment 1, the road elevations change with frequent uphill and downhill in the first half section, followed by a long distance of uphill and downhill in the second half section. The two trucks started at a rather low speed, and the speed changed with huge fluctuations in the process of speed-up at the beginning, followed by a constant speed, except for some small undulations. The maximum speed for truck 2 is ∼10 km/h higher than truck 1, which causes higher overall level of fuel consumption rates in road segment 1 for truck 2. As indicated by Gao et al., 37 the fuel economy of the light-duty vehicle increased from 5.6 to 7.5 L/100 km when the vehicle average speed increased from 18.75 to 91.88 km/h, and the optimal speed for the fuel economy is around 60 km/h. In the process of acceleration, the trucks’ fuel consumption rate is even higher than high speed and uphill situations.
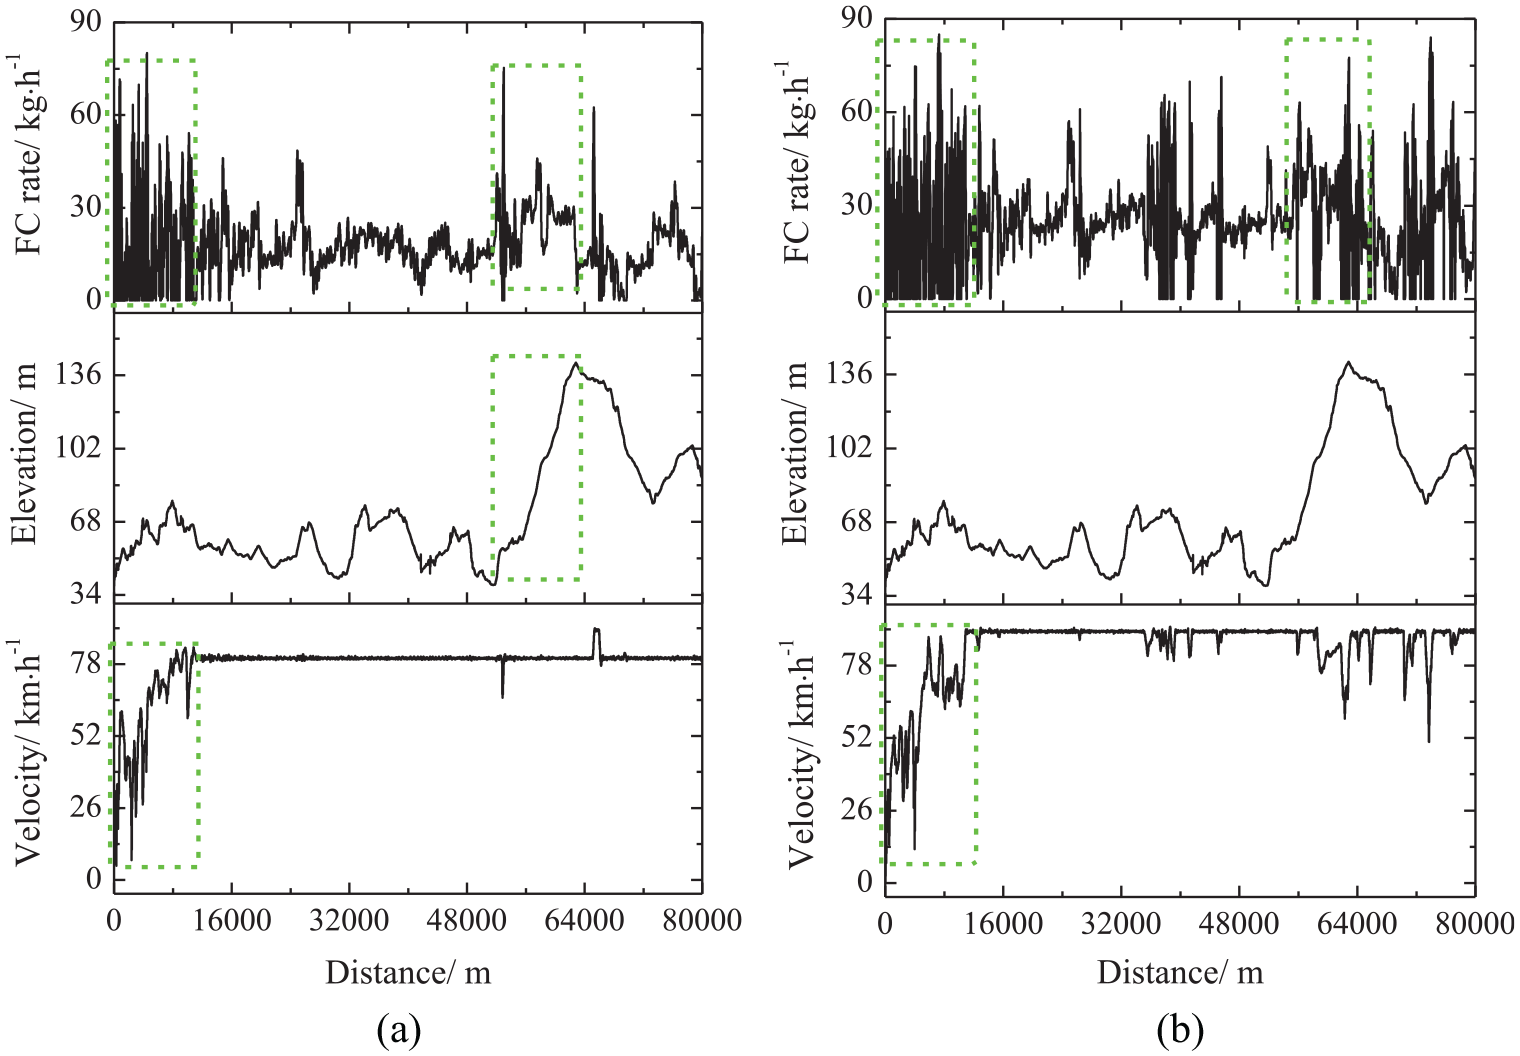
Fuel consumption rates, elevation and truck speed on road segment 1: (a) truck 1 and (b) truck 2.
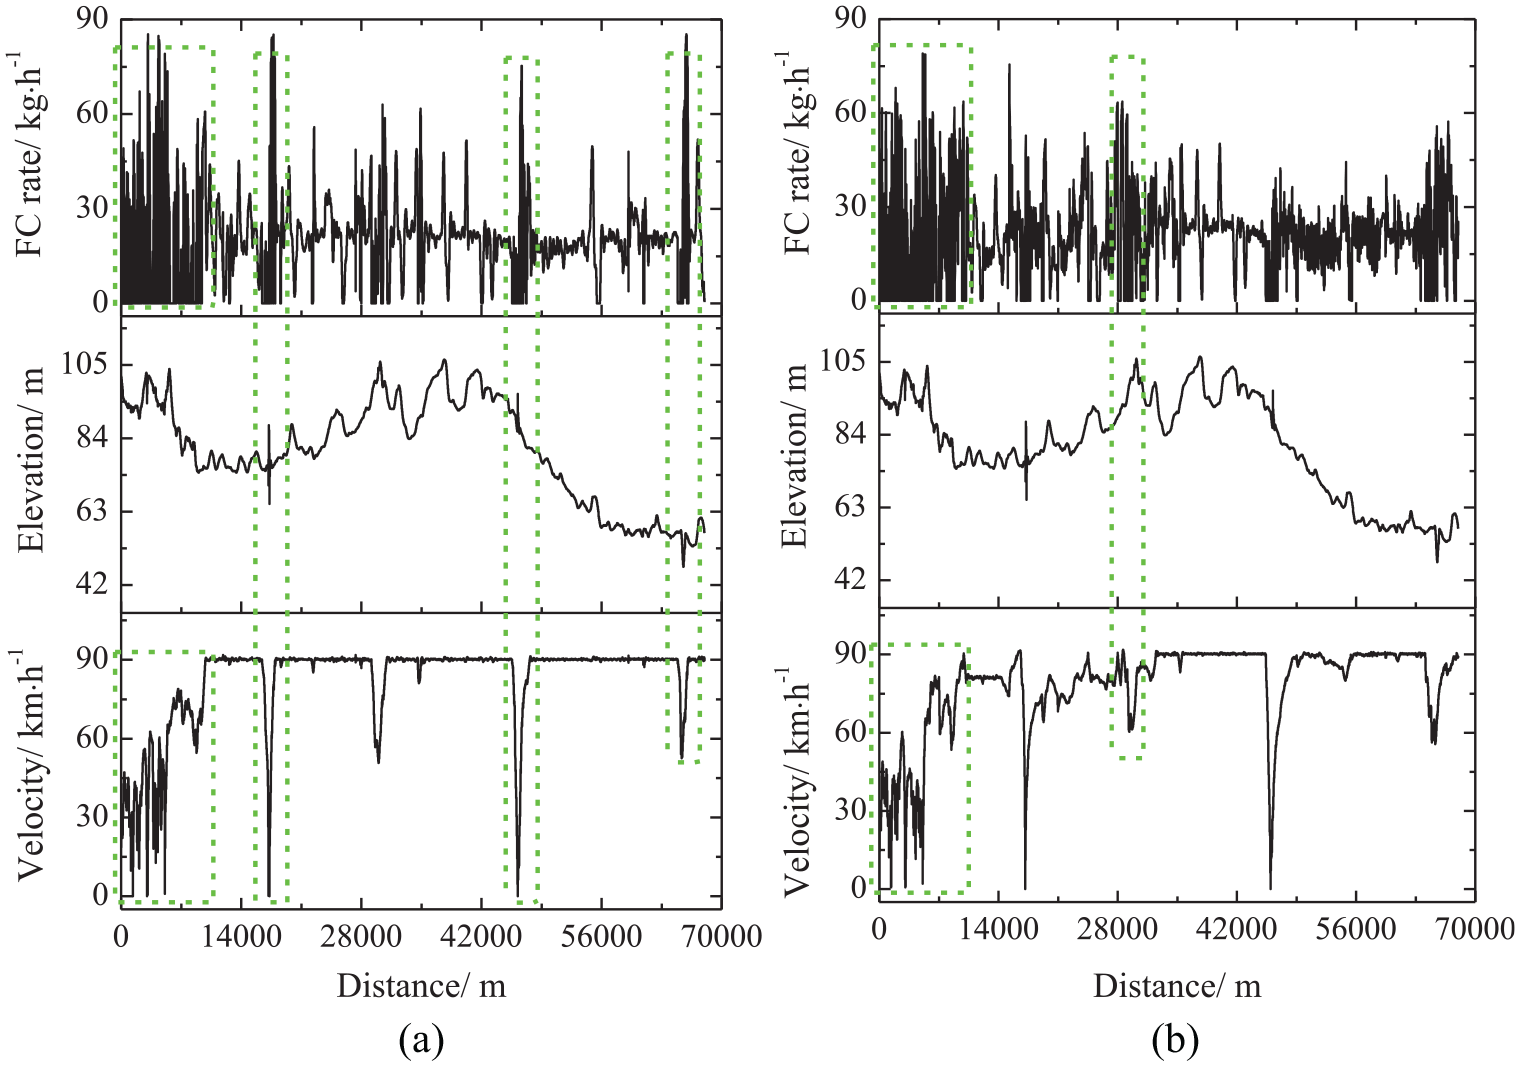
Fuel consumption rates, elevation and truck speed on road segment 2: (a) truck 1 and (b) truck 2.
The overall tendency of elevations in road segment 2 is downhill, uphill and then downhill. Levin et al. 38 showed that neglecting the road grade during route choice might increase the vehicle energy consumption, which reached ∼17% and ∼14%, respectively, for the given routes in Austin and Nicosia. As indicated by Boriboonsomsin and Barth, 39 in the real-world experiments, 15–20% more fuel is consumed in the case of light-duty vehicle over a hilly road than at a flat road, under the conditions of same start and end locations. Carrese et al. 40 demonstrated that bus fuel consumption was doubled by road slope for the city of Roma. Tavares et al. 41 also optimized the waste collection routes for minimum fuel consumption using 3D modelling, showing that the optimized route yields a 8% fuel reduction compared with the shortest route, which is caused by different slopes of the routes. The maximum speed for both drivers is approximately 90 km/h in road segment 2. Several aggressive decelerations are seen in the cruising process, where the speed drops almost to zero, which is followed by a sudden increase in the fuel consumption rate due to acceleration. For the downhill situations as well, much fuel is needed for acceleration purpose. Compared with road grade, truck acceleration contributes more to fuel consumption rates, which implies that truck fuel consumption rates are dominated by acceleration. Brake pedal is used for aggressive deceleration action, which causes much energy loss if there is not any energy recycling device. Thus, gentle driving is recommended to achieve less greenhouse emissions from this point.
The summary of the truck test results is shown in Table 4. The overall slope for segment 1 is positive, while it is negative for segment 2. In road segment 1, the fuel consumption saving of truck 1 reaches 22% compared with truck 2, even though their driving routes are the same. The fuel consumption of truck 1 in road segment 2 is higher than road segment 1 despite a lower road slope, which indicates that the benefits of different driver behaviours may change with traffic and road conditions.
Average truck speed and fuel economy.
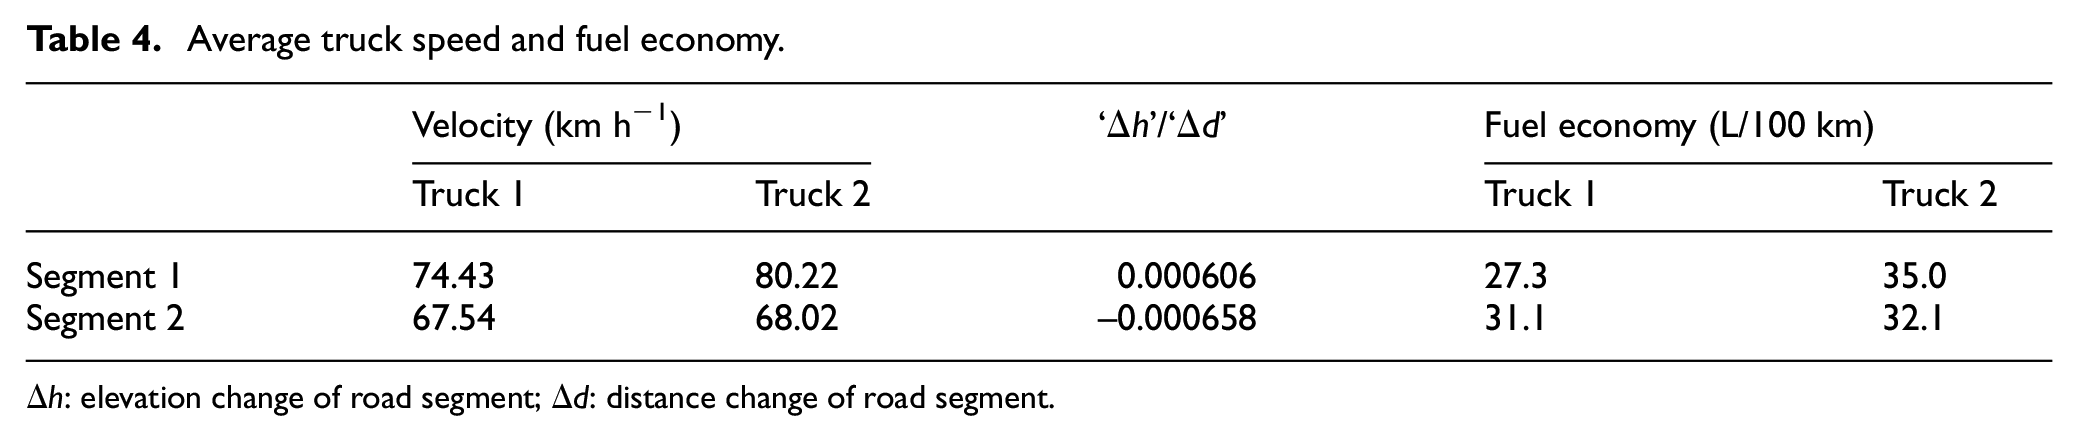
Δh: elevation change of road segment; Δd: distance change of road segment.
As mentioned above, the fuel consumption rates significantly depend on acceleration, which can reflect the drivers’ habits under given situations, to some extent. Figures 4 and 5 present the distributions of both trucks over the two road segments (‘Truck 1-Truck 2’ is the count difference with a data sampling frequency of 10 Hz). They almost show normal distributions with peaks being approximately 0.5 m/s2. In road segment 1, more acceleration events are in the range of –0.5 to 1.0 m/s 2 for truck 1, while more events are in the process of aggressive acceleration and deceleration for truck 2. For road segment 2, it is hard to distinguish the gentleness of both driving styles from the point of acceleration distribution. Because more truck operation events are also located in the aggressive acceleration and deceleration range, many events are in 0.5 m/s 2 position for truck 1. In the driving process, different driving patterns can be related to vehicle acceleration, as shown in the work by Ericsson, 42 where four different driving patterns are linked with vehicle acceleration, which show a huge influence on fuel consumption. The overall fuel reduction of 16% was achieved by providing driver instructions to accelerate/decelerate the vehicle. 43
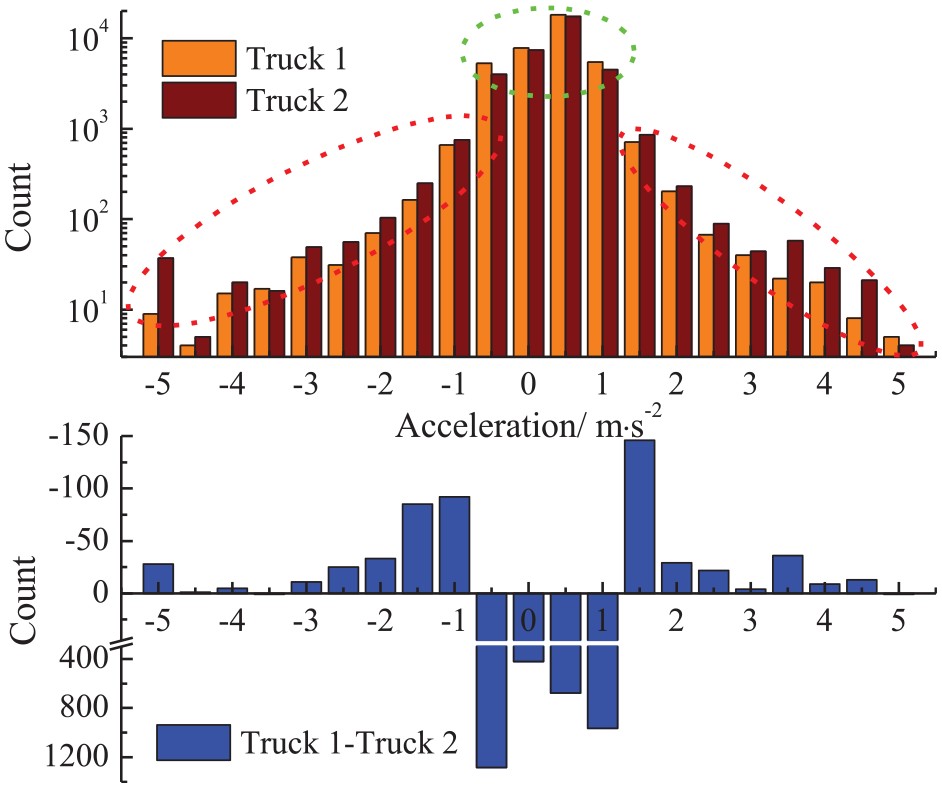
Acceleration distributions under road segment 1.
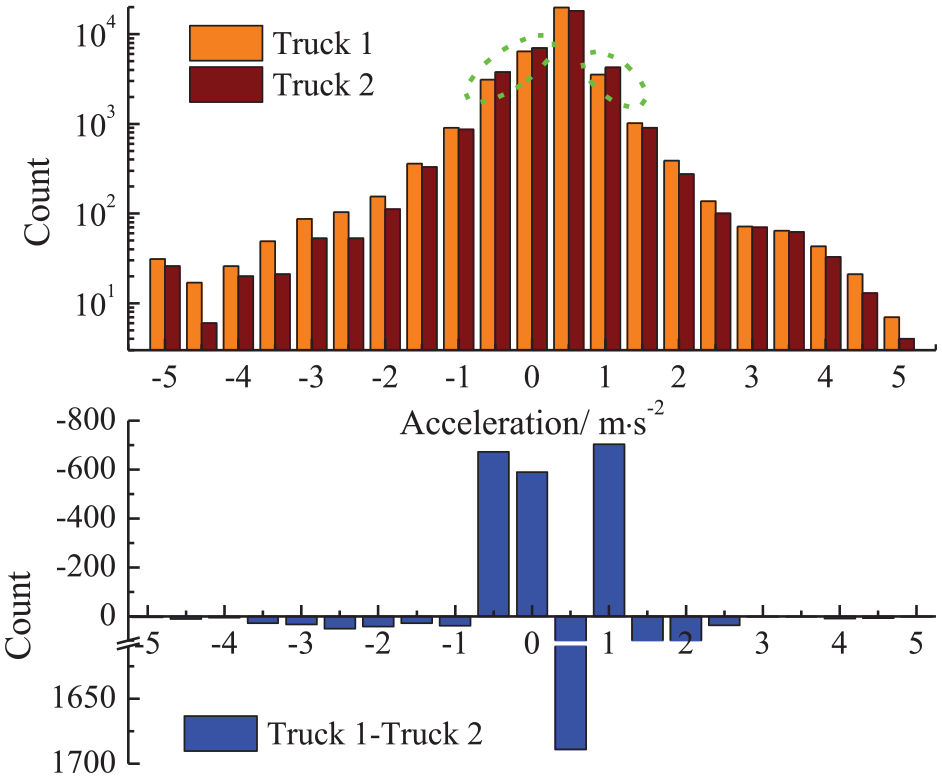
Acceleration distributions under road segment 2.
The gear shift histories over both routes are shown in Figures 6 and 7. In road segment 1, truck speed change is smaller than that of road segment 2 for both trucks, as long as truck speed reaches target values. Gear shift habits show a vital influence on the vehicle fuel economy, as shown in the work by Eckert et al. 44 where fuel saving reaches 20% by optimizing the gear shift strategy, with simultaneous improvements in the vehicle performance. The drivers’ rough gear shift habits are shown in Figure 8, while the distances of the two routes are too short to reflect the driving behaviours with high precision. Under different driving routes, drivers’ behaviours also change slightly. Generally, the gear upshift speed for truck 1 is higher than that of truck 2, and the highest speed for gear 8 is even lower than 40 km/h for truck 2. In road segment 2, the speed range of truck 1 is 0–50 and 0–65 km/h for gear 8 and gear 9, respectively. In the case of normal driving, vehicle speed will not decrease to such a low value for high gear numbers. In this work, it is caused by a sudden deceleration. The speed range of truck 2 is 0–35 and 0–38 km/h for gear 7 and gear 8 in road segment 2, respectively. The huge truck speed range causes significant variations in engine speeds, which may cause the engine to operate under low engine load conditions, further leading to the increase in fuel consumption rate. It was demonstrated by the test in Van der Voort et al. 43 that ∼16% fuel reduction can be achieved after providing suggestions of gear shift and accelerations to drivers. For the given truck conditions, the engine operation conditions can be changed by the gearbox; thus, the engine fuel consumption rates can be different. Under the given truck speed conditions, the most economic gear shift is that the engine operates in the range of medium engine speed and medium-high engine load conditions. Ekberg and Eriksson 45 adopted a method to find the optimal gear shift for accelerating to the given speed, with the purpose of optimizing fuel economy. A substantial improvement in fuel economy was also achieved by optimizing the gear shift strategy under a standard driving cycle. 46
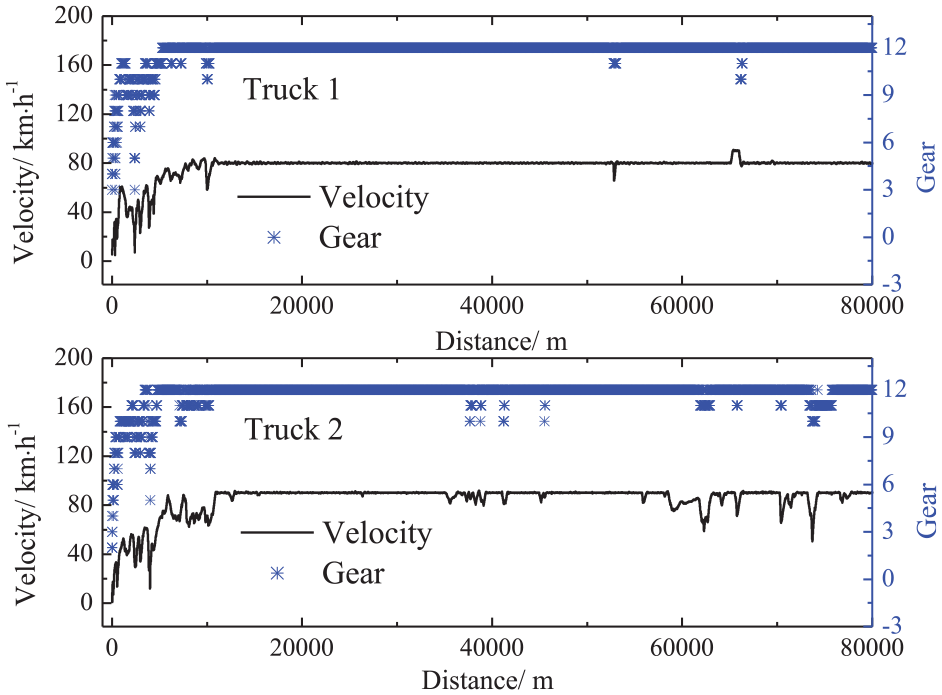
Truck speed and gear shift of trucks 1 and 2 over road segment 1.
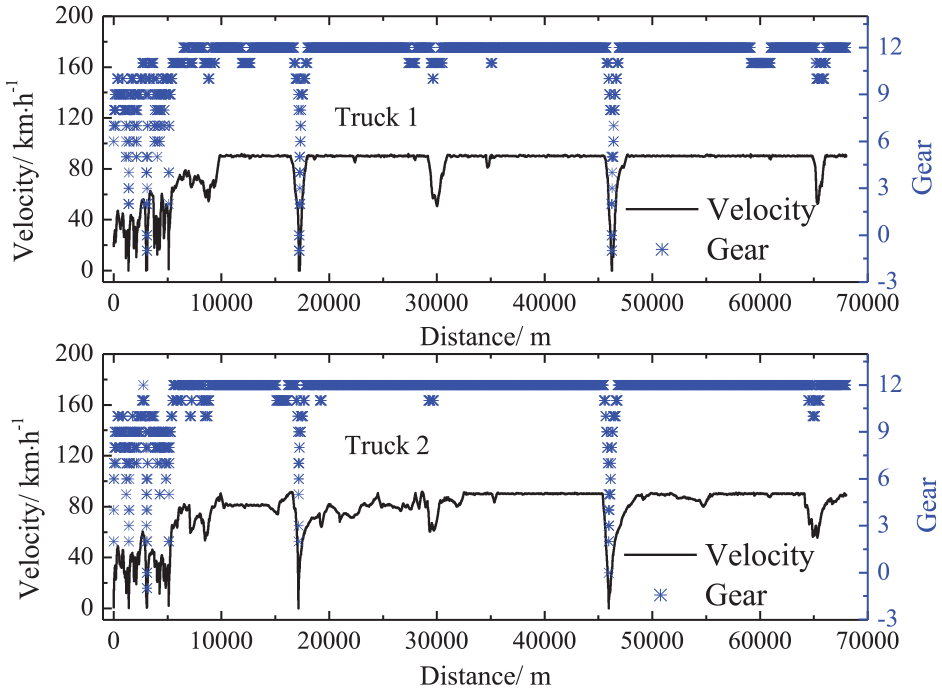
Truck speed and gear shift of trucks 1 and 2 over road segment 2.
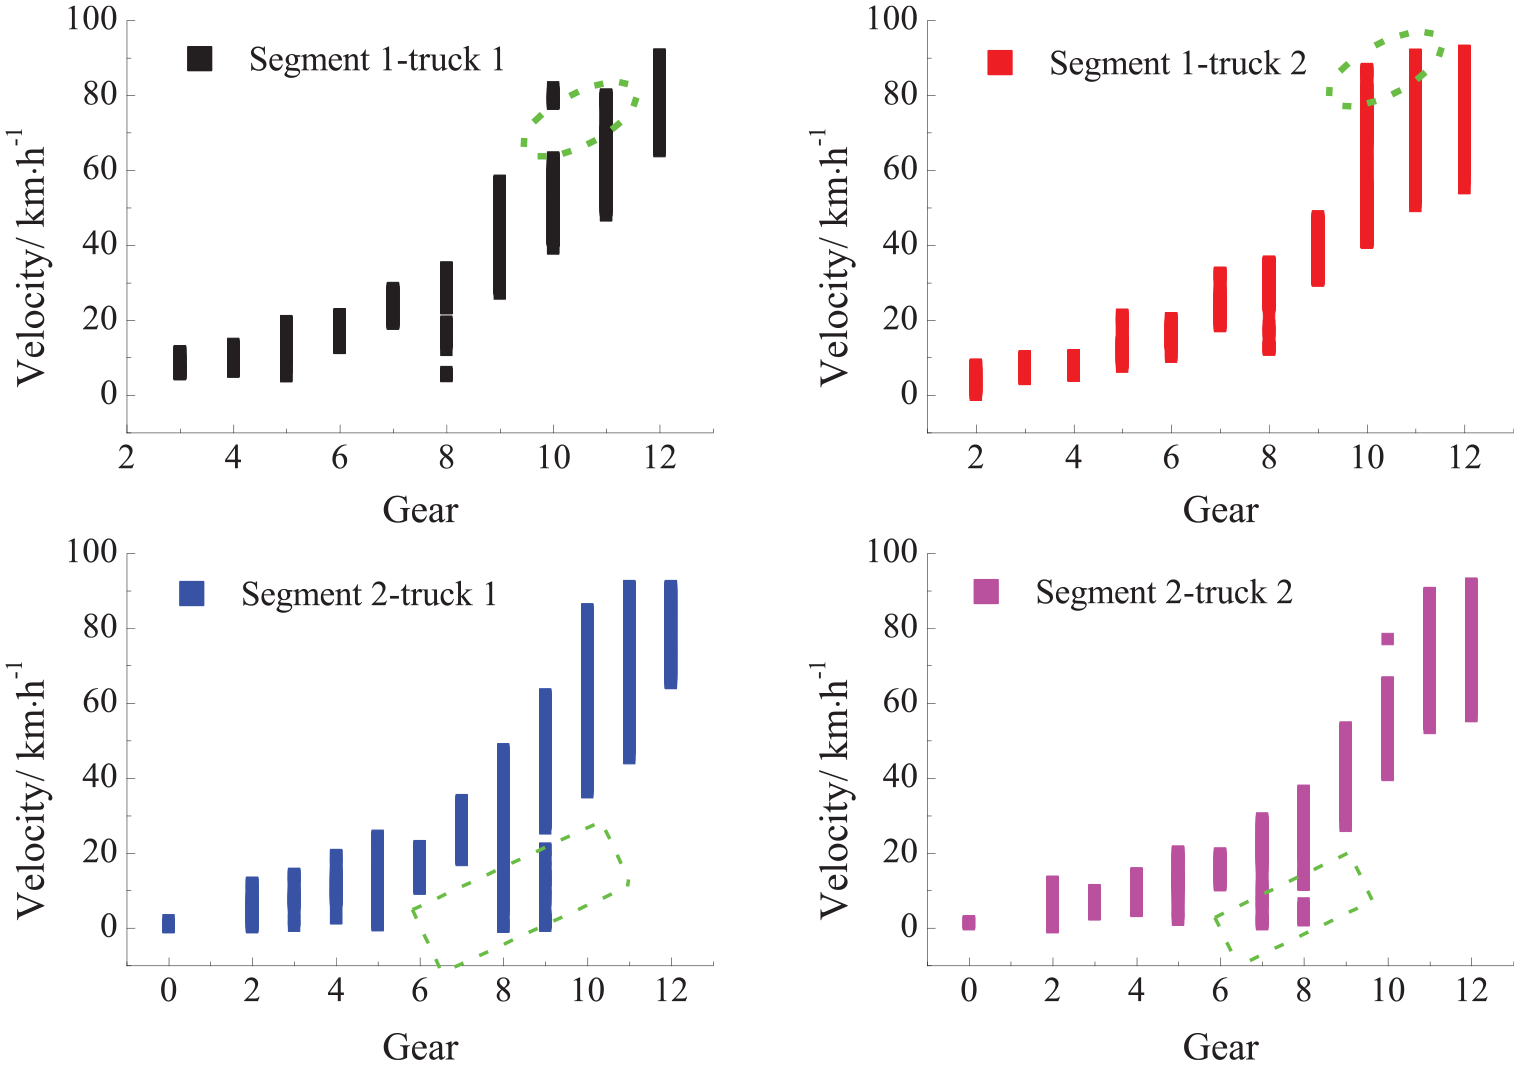
Gear distributions.
The fuel consumption rates for both the trucks under the two road segments are mainly concentrated on the values smaller than 40 kg/h. As for road segment 1, the mode value of fuel consumption rates of truck 1 is around 10 kg/h; however, it is 20 kg/h for truck 2 (Figure 9). This is caused by the general high truck speed of truck 2. There are parts of values located in the range of 60–80 kg/h, which is caused by the huge acceleration process. In addition, more operation events are around zero fuel consumption for truck 2 compared to truck 1. Both the points imply aggressive driving behaviours by truck 2 driver over road segment 1. For road segment 2, the fuel consumption rate distributions are similar, which may partly explain the similar fuel economy for the two trucks, combined with small differences in truck acceleration distributions (Figure 10).
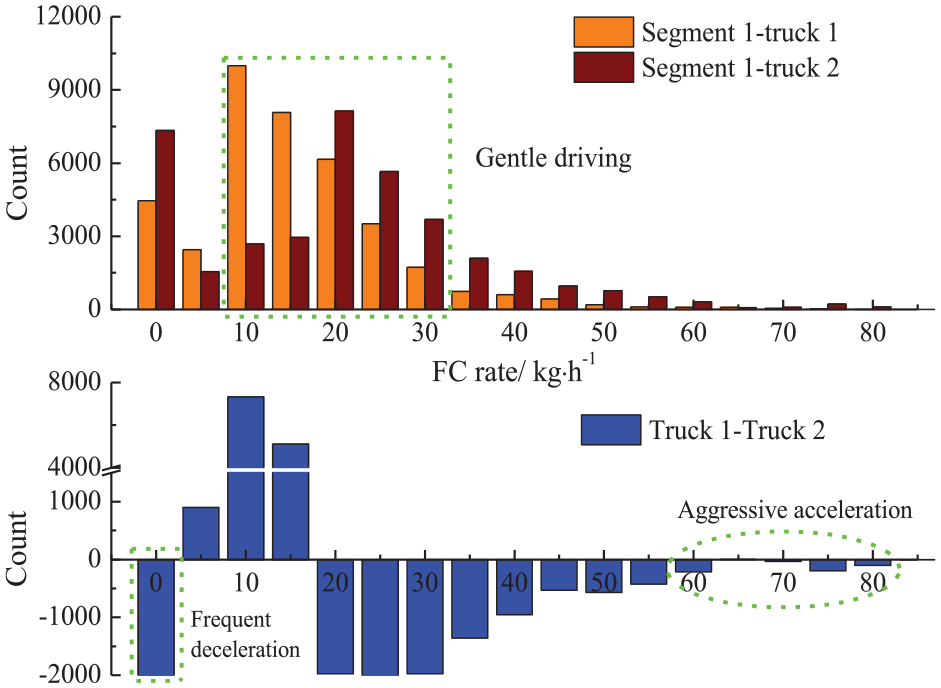
Distributions of truck fuel consumption rates under road segment 1.
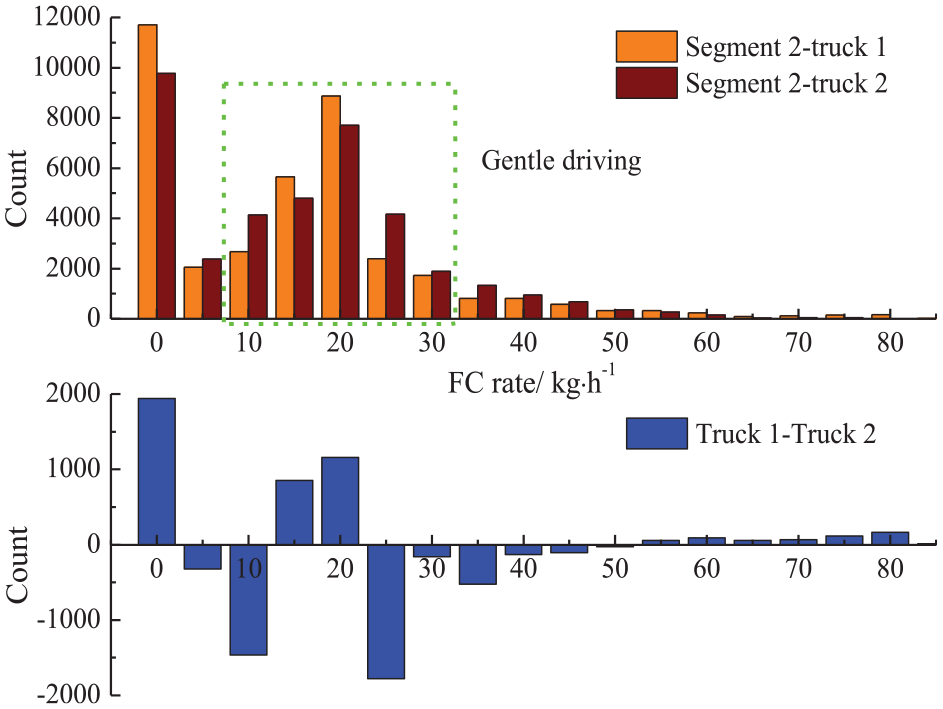
Distributions of truck fuel consumption rates under road segment 2.
Scaling up of the effect of driver behaviours on fuel consumption in EU countries
The data on international freight transport in EU countries are referred from Eurostat website. 47 Freight transport in this work refers to the import to a nation from other countries. Combined with the fuel economy of different driver behaviours in Table 4, the potential of annual fuel saving for national and international freight transport in parts of EU countries is estimated, as shown in Figure 11. The white colour in the map indicates that no data are available for these regions. As for the international freight transport, the minimum annual fuel saving is 81 m3 in Norway; however, the maximum value is 529,968 m3 in Poland due to huge amounts of freight transport. The potential of total fuel saving for these EU countries is approximately 1,852,687 m3 if driver training is well performed. It is indicated in Wang and Boggio-Marzet 48 that the average fuel saving is 6.3% after eco-driving training regardless of the fuel and road types. The improvement in fuel economy not only drops the cost of international freight transport, but also decreases greenhouse emissions, which alleviates global warming. The fuel saving of the international goods delivery is not dependent on the national territorial area, but on freight import, freight export and freight transport methods. In the national freight transport, the events of distance being shorter than 50 km are assumed as non-motorway delivery. Only the freight transport in motorway is considered in this section. The potentials of fuel saving for the national freight transport are in the range of 1333–759,560 m3.
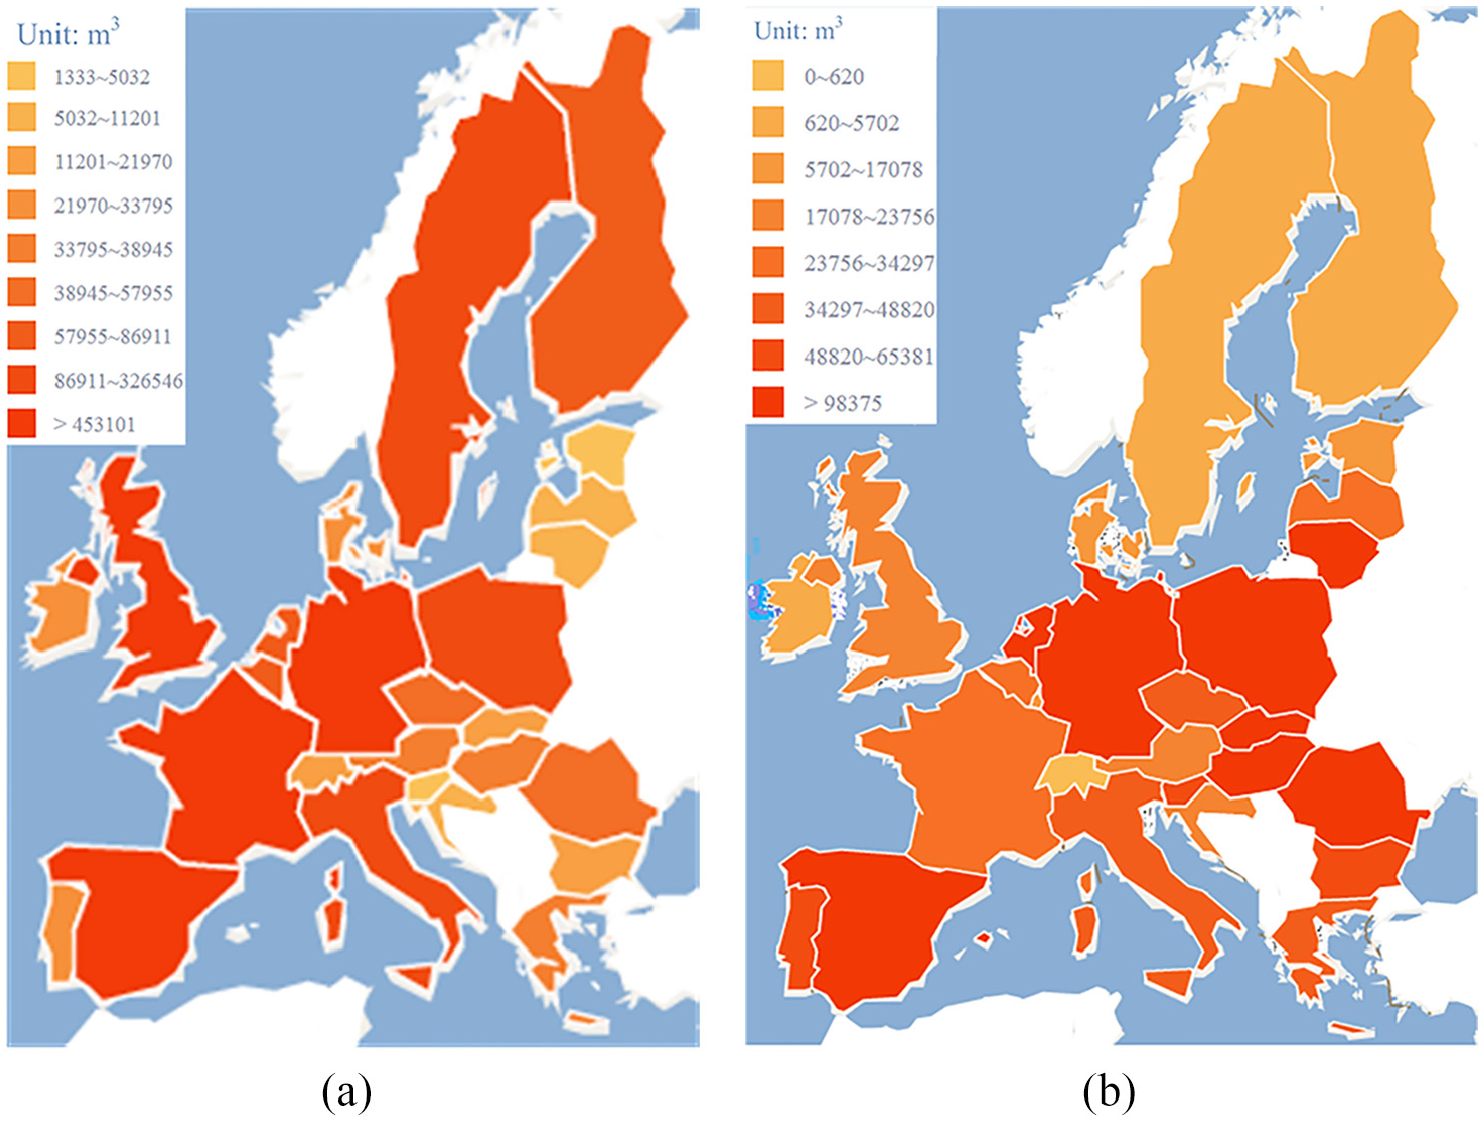
Potentials of annual fuel saving for parts of European Union countries in motorway freight transport: (a) national delivery and (b) international delivery.
In this section, fuel saving for parts of EU countries is estimated if optimal driving behaviours are adopted. This method can be applied for the estimation of emission reduction if the vehicle emissions are recorded for these tests. However, eco-driving and low emission driving may not be consistent such that it needs to be demonstrated by real-world tests.
Conclusion
In this study, driving behaviours over two motorways were tested based on the heavy-duty trucks. The relations of driving behaviours and fuel consumption were investigated; furthermore, the scaling up of the effect of driving behaviours on fuel saving was conducted. The conclusions are as follows:
Truck speed shows a negative effect on the fuel economy for the given situations; truck fuel consumption rate depends more on acceleration than on speed and road grade.
Accelerations are in normal distributions for both the trucks under two road segments. Aggressive acceleration partly leads to higher fuel consumption for truck 2 over road segment 1.
The speed ranges for low gear numbers are wider for truck 1 than those for truck 2. Aggressive deceleration causes huge speed ranges of gears (gear numbers 8 and 9 for truck 1 driver, gear numbers 7 and 8 for truck 2 driver) in road segment 2.
The potentials of fuel saving for the national freight transport are in the range of 1333–759, 560 m3 for parts of EU countries, and they are 81–529,968 m3 for international freight transport.
Footnotes
Declaration of conflicting interests
The author(s) declared no potential conflicts of interest with respect to the research, authorship, and/or publication of this article.
Funding
The author(s) disclosed receipt of the following financial support for the research, authorship, and/or publication of this article: The research reported in this paper was jointly supported by the EU-funded project MODALES (grant agreement no. 815189), DYNNOTEQ, Southeast University and Nanjing Sample Technology. The traffic model used in this work was extended from its previous version developed in the EU-funded project optiTruck (grant agreement no. 713788)