
Abstract
The tracking and behavior recognition of heavy-duty trucks on roadways are keys for the development of automated heavy-duty trucks and an advanced driver assistance system. The spatiotemporal information of trucks from trajectory tracking and motions learnt from behavior analysis can be employed to predict possible driving risks and generate safe motion to avoid roadway accidents. This article presents a unified tracking and behavior recognition algorithm that can model the mobility of heavy-duty trucks on long inclined roadways. Random noise within the sampled elevation data is addressed by time-based segmentation to extract time-continuous samples at geographical locations. A Kalman filter is first used to distinguish error offsets from random noise and to estimate the distribution of truck elevations for different time intervals. A Markov chain Monte Carlo model is then applied to classify truck behaviors based on the change in elevation between two geographical locations. A heavy-duty truck mobility (HVMove) model is constructed based on the map information to apply the roadway geometry to the tracking and behavior recognition algorithm. We develop an extended Metropolis–Hastings algorithm to tune the parameters of the HVMove model. The proposed model is verified and evaluated through extensive experiments based on a real-world trajectory dataset covering sections of an expressway and national and provincial highways. From the experimental results, we conclude that the HVMove model provides sufficient accuracy and efficiency for automated heavy-duty trucks and advanced driver assistance system applications. In addition, HVMove can generate maps with the elevation information marked automatically.
Introduction
Coasting and braking on long inclined roadways are one of the primary reasons for traffic accidents for heavy-duty trucks.1–3 To improve truck climbing, we have to track and accurately predict the trucks’ movements while driving uphill and downhill. Ensuring the safety of drivers, trucks, and goods on roadways as well as the development of automated heavy-duty trucks can be facilitated by detailed analyses of truck motion and behavior. Moreover, such analyses also represent a primary foundation for evaluating environmental impacts,4,5 detecting air quality,6,7 reducing fuel consumption, 8 and optimizing the transportation sector. 9 The specific motion of heavy-duty trucks depends on controllable tractive and braking forces as well as external forces arising from conditions such as road slope. 10 Analysis of the dynamic features of trucks on continuous long upgrades is of particular importance because this facilitates the modeling of their mobility, thereby establishing the safety margin for surrounding moving trucks, particularly for trucks following in the rear. 11 Tracking the trajectory of trucks and climbing behavior recognition are two important functions that facilitate the accurate modeling of truck mobility. 12 Here, trajectory tracking is employed to estimate the dynamic features of trucks based on filtering approaches, while behavior recognition is a machine learning approach employed to recognize the specific motions of trucks based on the tracking results.
Many previous studies have focused on the tracking of vehicle trajectories on roadways. These tracking systems normally adopt algorithms that depend solely on the use of on-board sensors, such as video cameras, LIDAR, and radar for vehicle detection. However, these algorithms possess performance constraints based on the limitations of the sensors due to various factors, such as environmental impacts, the timeliness of multiple vehicle detection, and vibration. 13 Tracking of heavy-duty trucks is further constrained when trucks travel through regions offering a narrow field of view and unexpected obstacles. However, these tracking constraints can be overcome by applying filters to constrain the detected motion of heavy-duty trucks.14–16 Therefore, it is possible to smooth the random noise introduced by motion-detection sensors and improve the accuracy of truck tracking and subsequent motion behavior recognition. In addition, trucks commonly travel along the same routes and make routine stops, such as for cargo loading and unloading, which leads to low-sampling-rate trajectories where the average time interval between consecutive sample points is greater than 10 s. As a result, the raw trajectories of trucks following highly structured routes in urban areas have fewer sample points than those of other vehicles such as taxies. Moreover, the quality of these truck trajectories cannot be substantially improved by the simple segmentation of each sample based on the spatial proximity between them.
Machine learning algorithms, such as the Bayes classifier, decision tree, and support vector machine, are used to infer the motion behavior of heavy-duty trucks on roadways. A truck motion model based on a deep neural network was developed by Wang et al. 17 Although the deep learning approach enhanced the accuracy of the resulting truck mobility modeling, the model suffered from a lack of generality. 18 For example, the complete driving operations of trucks could not be predicted when the trajectory data were incomplete. Thus, the application of deep learning to truck behavior recognition has been restricted by data sparsity. In addition, the precision of the deep learning approach depends on the number of kilometers traveled by a truck, which makes it difficult to recognize the long-distance mobility of trucks. An improved multi-mode hybrid automaton (MOHA) model was developed by Lin et al. 19 for truck tracking purposes. The MOHA model extracts and clusters common state sequences from the temporal information of actual trajectory data based on a discrete event model and thereby identifies different truck behaviors. However, the MOHA model performs more poorly than the existing methods20–22 due to high time complexity. In addition, a previous study 23 introduced a unified framework for the tracking and behavior recognition of heavy-duty trucks under highway or constrained roadway driving conditions, but the algorithm did not consider the upgrade and downgrade motions of heavy-duty trucks. Furthermore, many previous studies have failed to consider the characteristics of heavy-duty trucks explicitly, such as long and fixed transportation routes and restricted traveling speeds and regions. 24 These characteristics of heavy-duty trucks are distinct from, for example, the characteristics of taxies.
To address these issues, this article presents an algorithm for conducting the tracking and behavior recognition of moving heavy-duty trucks along long inclined roadways. A large-scale spatiotemporal trajectory dataset is used for measurements in the algorithm. The elevation information is extracted from the sampled trajectories. Based on the elevation information, a model, denoted as the HVMove model, is constructed, which adopts a logistic regression approach and produces the probability of truck motion based on the Markov chain Monte Carlo (MCMC) simulation. Tracking filters and behavior classification provide many benefits for conducting behavior recognition. Therefore, a Kalman-based filter serves as the basis of the HVMove model for generating the probability distribution of the elevation for different time intervals. The performance of the HVMove model is evaluated using real-world data.
The main contributions of this study are described as follows:
The proposed algorithm provides unified tracking and climbing behavior recognition of moving heavy-duty trucks;
The probability distribution of the climbing motions of heavy-duty trucks is modeled using a logistic distribution;
Maps with the elevation information are generated automatically from large-scale real-world trajectories.
The remainder of this article is organized as follows. Section “Data” presents the heavy-duty truck trajectory data used by the proposed method. Section “Labeling elevations in truck trajectories” presents the spatiotemporal trajectory model based on the Kalman filter, and section “MCMC-based truck motion model” describes the HVMove model based on two elevation features. Section “Performance analysis” presents the verification results, and section “Conclusion” concludes the article.
Data
The dataset employed in this work specifically includes sections of the Beijing–Kunming Expressway, G108 National Highway, and S311 Provincial Highway in the area of Shaanxi, and for Shanxi Province, China. General information regarding the time-stamped global navigation satellite system (GNSS) data within the 9-day period is summarized in Table 1. In our study, the data acquisition and positioning system are GPS and Beidou dual-mode navigation. The number of connected satellites is not less than four. The positioning error is 2.5 m that enables to fulfill the requirements for the high-sampling-rate trajectory. Each record of this dataset contains geographical location in the form of latitude and longitude, elevation, velocity, and time at each instance of heavy-duty truck activity, which includes traveling both up and down the slopes.
Summary of the GNSS data and geographic information of the areas analyzed in this study.

GNSS: global navigation satellite system. The total number of data records during the time period was 57,698.
Truck coordinates are estimated from the records by on-board equipment based on a standard triangulation algorithm that provides an average coordinate error of 10 m. The spatiotemporal truck coordinate data represent the motions of heavy-duty trucks in connection with time and roadway. For example, a record from 10:25 a.m. to 11:47 a.m. on 1 April indicates a heavy-duty truck moving at low speed (<60 km/h) on a roadway with an inclined slope (elevation increasing from 344 to 542 m) for a long period of time (82 min). The data are intrinsically heterogeneous because the discrete approximate representations of geographical locations and elevations are derived using different sampling rates (e.g. every 500 m or 20 s). This work aims to provide a model that can support both the generation of origin-destination trips related to elevation and the identification of probability distributions for the motions of a heavy-duty truck for a particular period of a day based on the passive data employed.
Labeling elevations in truck trajectories
This section explains how the time-stamped GNSS records can be converted into individual trajectories with labeled elevations, which are then used to generate trip types for each heavy-duty truck. Due to the distinct sampling rates and poor data quality of the trajectories, 25 we first perform the following data filtering: (1) data records with the same receiving times and geographic coordinates are removed; (2) a median filter is applied to adjust data records with similar coordinates, but with significantly different elevations; (3) lost elevation data points (56 records of all 57,698 records) are estimated using linear interpolation between consecutive spatiotemporal trajectory samplings; and (4) records that did not follow a strict time sequence due to factors such as variations in the geographical environment or signal quality were reordered into their proper sequences according to their sampling times.
Although the pretreated data records can describe the routes of heavy-duty trucks on an actual map, the random noise in the elevation data based on the GNSS trajectory segments should be reduced, which is discussed as follows.
Spatiotemporal trajectory segmentation and analysis
Trajectory segmentation is a significant step prior to engaging in further trajectory filtering. Here, segmentation can be conducted using the following three methods 26 : (1) trajectory segmentation based on time intervals 27 —here, if the time interval between two consecutive sampling points is greater than a given threshold, the trajectory is divided into two segments between the two points; (2) trajectory segmentation based on the spatial shape of the trajectory 11 —in this method, the trajectory is segmented at the key points that maintain the trajectory shape; and (3) trajectory segmentation based on the semantics of a trajectory point 10 —with this method, the trajectory is divided according to points such as a stationary or transitory point.
We combine the time-interval-based and semantics-based segmentation methods, where the semantics of the points are defined according to changes in the elevation of each truck (i.e. a truck traveling on an inclined roadway or on a declined roadway). Figure 1 presents a schematic diagram illustrating the conversion of daily trajectory records to daily changes in elevation. Here, we first partition the trajectories according to every 24-h interval, detect locations where the truck is stationary (i.e. where the truck speed is 0 m/s), and then detect trips that occur between these stationary locations. Truck motions are generated over a specific time interval by first labeling all locations according to the relative changes in the elevation. These changes in elevation can be counted to determine the probabilities with which trips in each time interval involve increasing or decreasing elevation.

Schematic diagram illustrating the conversion of trajectory records of a heavy-duty truck to daily changes in elevation and trip types. The changes in elevation are observed based on stationary locations, and daily trips are measured according to the time of day between these stationary locations: (a)–(d) the probabilities of driving uphill or downhill over a specified period of time.
For example, a single truck in Figure 1(a) and (b) generates trips over the 2 single-day periods of observation, and these include 60 trips with an increase in elevation (indicated in blue), 76 trips with a decrease in elevation (marked in orange), while the remaining trips occur at a constant elevation (in white). These trips would be distributed across a single-day period based on the observation time of the stationary locations and the corresponding elevations, as shown in Figure 1(c) and (d). For example, the orange circle in Figure 1(c) indicates that 13% and 19% of all trips generated by heavy-duty trucks, respectively, exhibited an increase and decrease in elevations over the period of 6:00 a.m. to approximately 10:00 a.m. on a Saturday. Based on these visualizations from the prepared digital map, we can observe that the trips of heavy-duty trucks within the suburban and mountainous areas are more concentrated during the peak hours (6:00 to 8:00 a.m.) on Saturday and the late night hours (8:00 to 12:00 p.m.) on Monday due to their larger trip distances and less traffic. This procedure aims to generate a representative sample of trips to account for the travel choices of heavy-duty trucks within the suburban and mountainous areas of the region, as well as to label the elevation information on an actual map. Then, the elevation data noise was analyzed by detecting the short-term stationary points (SSPs) of trucks as follows.
Definition 1 (SSP)
The SSP represents a segment of geographic data where a heavy-duty truck traveled at a speed of 0 m/s over a specified time interval. The extraction of an SSP depends on two scale parameters denoted as the time threshold
Example SSPs extracted from pretreated trajectory data are shown in Figure 2. The distribution of random noise in the elevation data is more clearly observable from the expanded data presented in the inset of Figure 2. Therefore, a Kalman filter is applied to smooth out short-term fluctuations in the time series data and thereby highlight the long-term trends of truck motions.
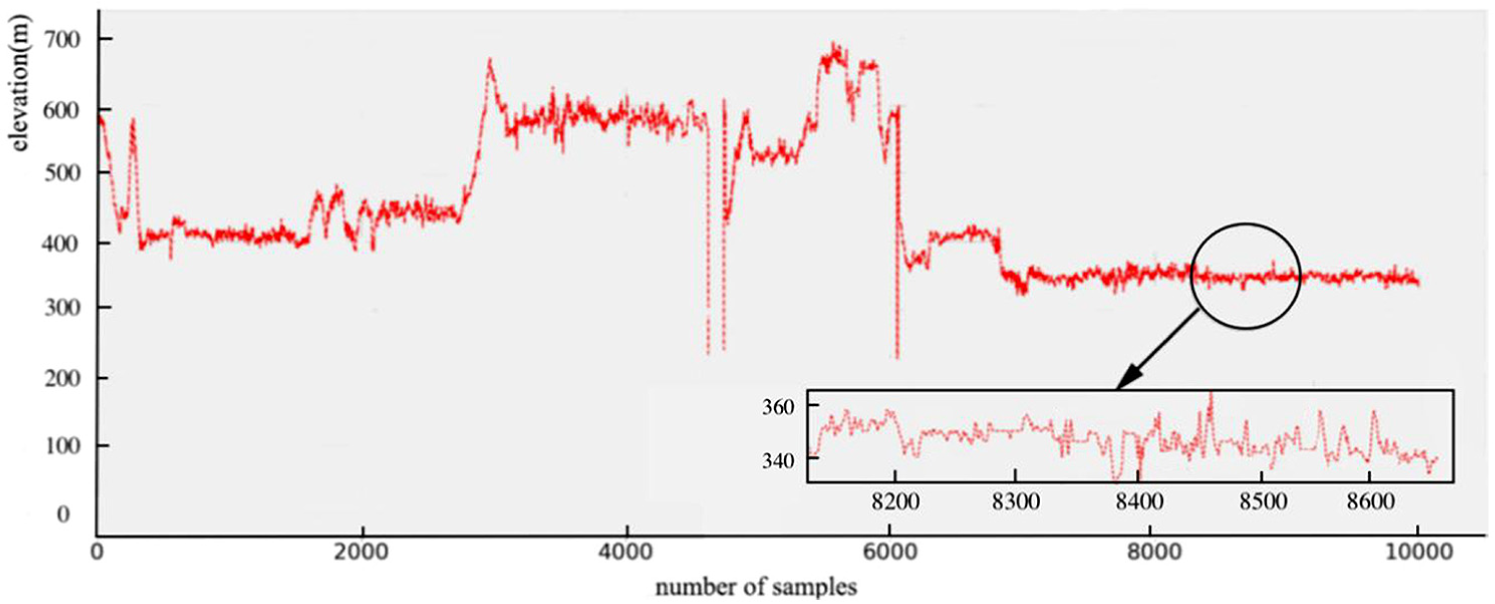
Illustration of short-term stationary points (SSPs) with random noise.
Denoising by Kalman filter
A Kalman filter is particularly advantageous for processing continuous noisy data points compared with median or mean filtering. 28 With a Kalman filter, we define the state model for predicting the elevation of trucks as

where for the kth state at a single point in time,

where

where the parameters are determined using the Kalman filtering, and

where

where
Elevation-labeled trajectory generation
We define the trajectory model labeled by the elevation data of a heavy-duty truck in the present work as follows.
Definition 2 (elevation-labeled trajectory)
An E-Tra is a sequence of time-stamped points
The E-Tra of heavy-duty trucks on an actual map is illustrated in Figure 3, in which each trajectory point is marked by the obtained elevation. The transport routes of the trucks and road conditions (such as gradient and length of slope) can be extracted from the map using the E-Tra model.

Trajectories marked by elevation on an actual map.
MCMC-based truck motion model
The elevation data optimized by Kalman filtering form the basis for extracting the features and for modeling the probability distribution of heavy-duty trucks moving along long inclined roadways. The MCMC simulation was used in conjunction with the E-Tra model to determine the distribution of the features.
Feature extraction
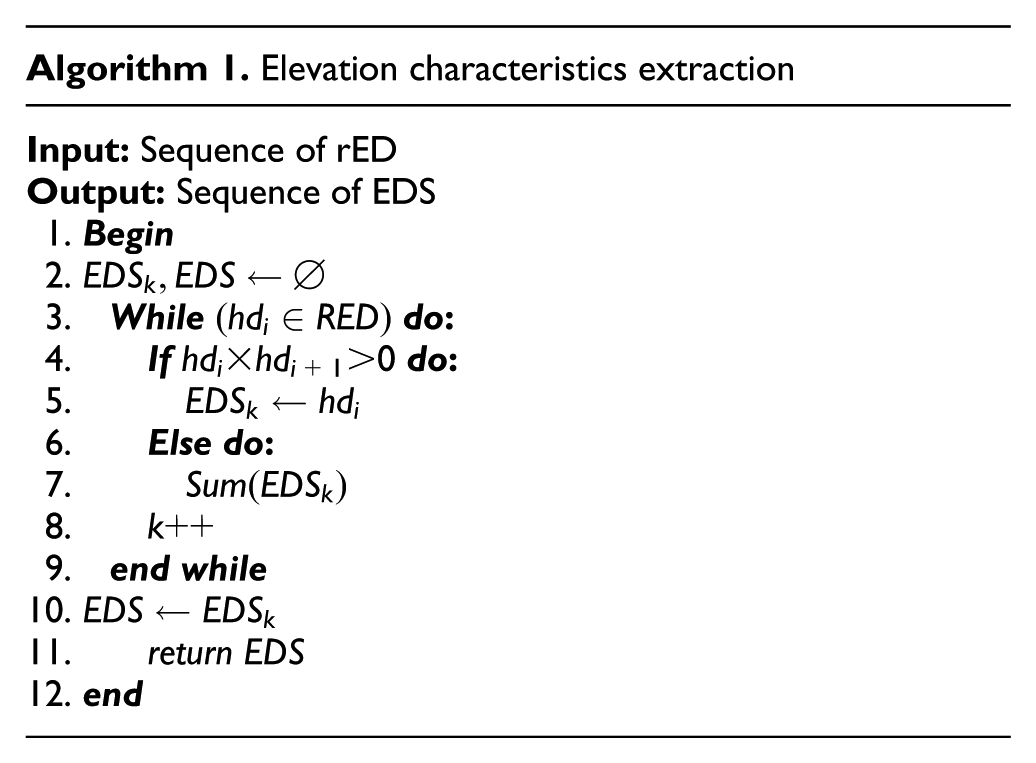
Both the relative elevation difference (rED) and the sum of continuous elevation differences (i.e. the elevation difference summation—EDS) are used to track heavy-duty truck motions along an inclined slope. Therefore, they can be used as representations of truck behaviors. To extract the rED and EDS, we first model changes in the elevation between two consecutive trajectory points and obtain the duration for which a truck travels with the same type of motion, such as where the truck is continuously ascending or descending over a given time interval. Algorithm 1 was developed for extracting these features from the trajectories. Here, if the ith and (i + 1)th rED values are both positive or both negative, the ith rED value is accumulated in the EDS.
HVMove model
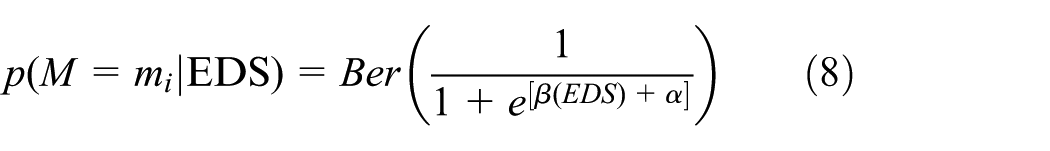
We considered the climbing behavior of heavy-duty trucks as a movement from a level roadway to an inclined roadway. The distribution is consistent with the shape of a logistic distribution. The aim of our proposed method is to model the probability distribution of truck climbing behavior denoted by M under a given rED. To achieve this goal, we utilize logistic regression to express the probability of M
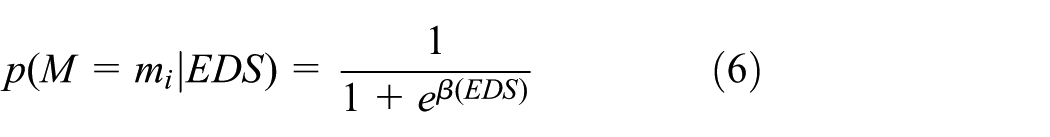
where

The parameter

Influences of parameters
Parameter tuning
To find an appropriate model for describing the joint distribution of parameters

Coefficient space with a Gaussian distribution taken as the a priori probability distribution.
We then vary the values of
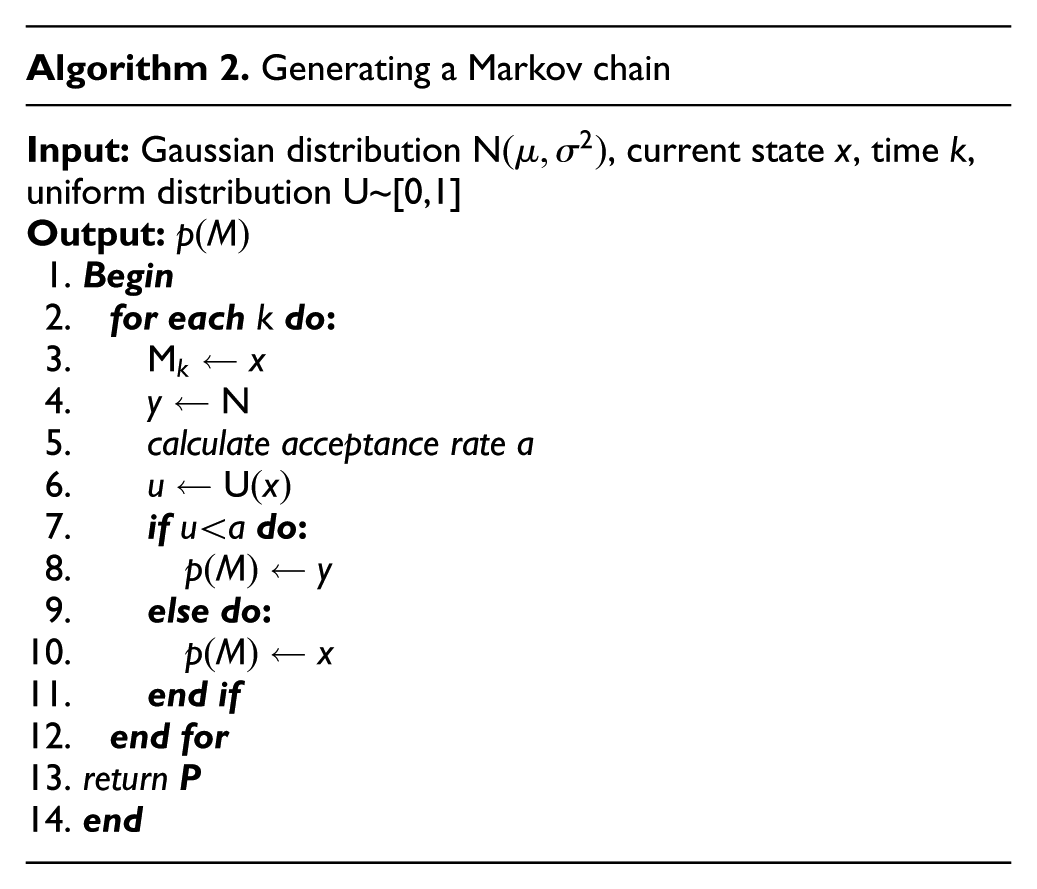
We next show how to tune the parameters in the HVMove model step by step. We first use the Metropolis–Hastings algorithm to produce sample states of truck motion and evaluate the associated transition probabilities between two states with a generated Markov chain. The Markov chain structure of the HVMove model using the MCMC simulation is illustrated in Figure 6. Algorithm 2 describes the parameter tuning process, where an a priori Gaussian distribution
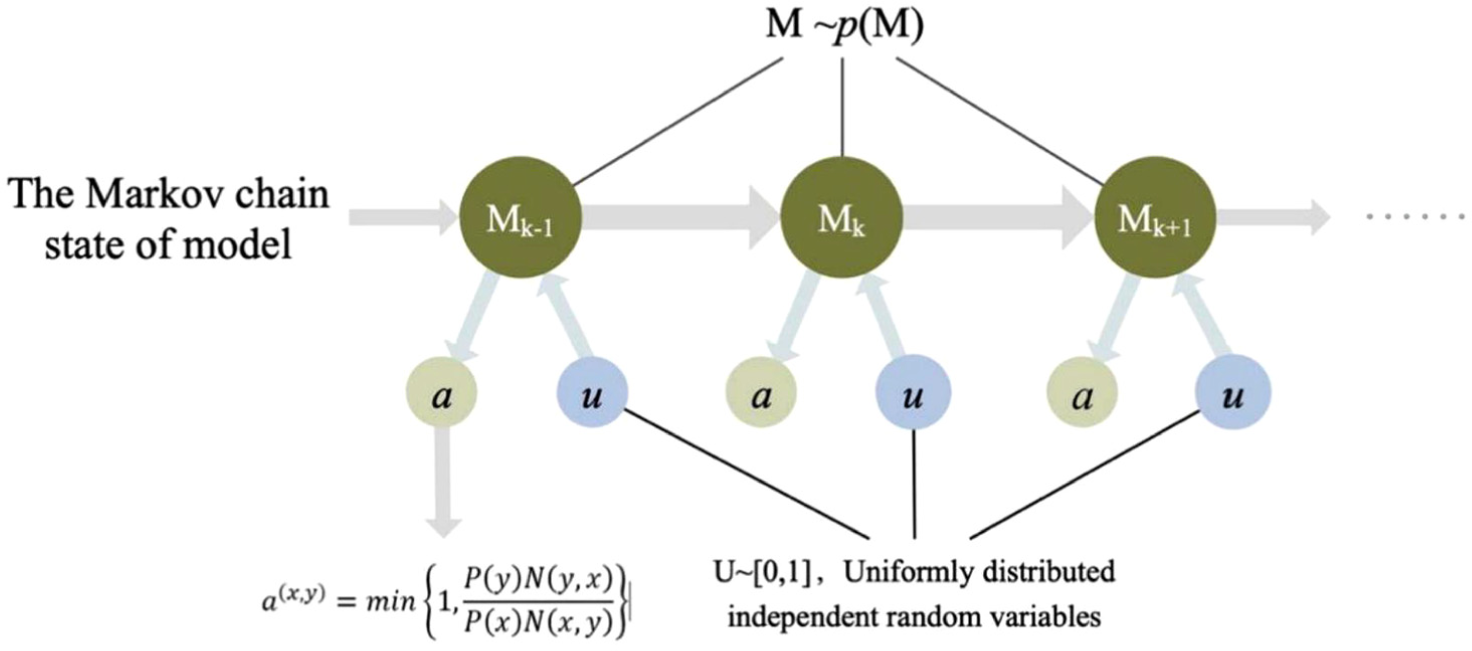
A Markov chain according to the distribution
After identifying the transition probability, we then apply the MCMC simulation to estimate
Behavior recognition
The proposed behavior recognition algorithm is given in Algorithm 3. First, SSPs are extracted. The elevation data are optimized by Kalman filtering. Then, the EDS is obtained using Algorithm 1. The Markov chain of the distribution is established using Algorithm 2. Parameters

Performance analysis
Experimental setup
We used the GNSS trace dataset of heavy-duty trucks presented in section “Data.” A total number of 70 trajectory sequences were obtained. The sequences that included fewer than 100 trajectory points were removed, and 48 sequences remained for fitting. Of these, the longest and shortest sequences comprised 2526 and 100 points, respectively. We then performed operations such as data cleansing and normalization to obtain the required elevation trajectories. Figure 7 investigates the effect of data processing. It compares the original SSP data of heavy-duty trucks with the processed data. It can be seen that the short-term fluctuations in the data segment declined significantly after Kalman filtering.
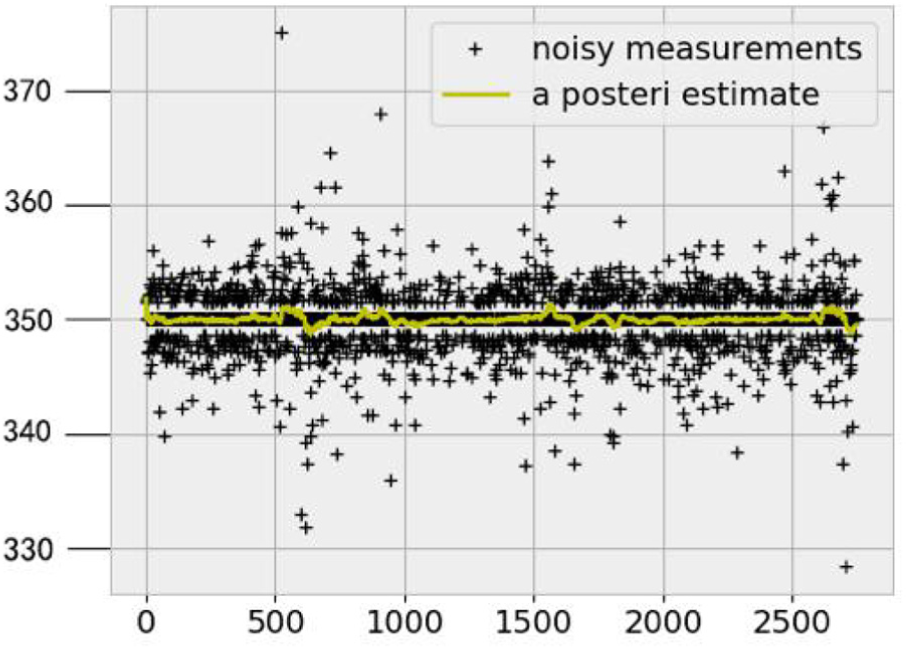
Elevation trajectories preprocessed using a Kalman filter.
We randomly split the above 48 sequences into training and test sequences according to the ratio 7:3, that is, 70% of the data were used for training and the remaining 30% were used for testing. Measurement errors were identified using two different models. In the first model, we analyzed the joint distribution of the time and the elevation for each truck. To find an appropriate model to describe this two-dimensional joint distribution, we can assume that a linear relationship exists between the time sample

In the second model, the joint distribution of time and elevation was modeled based on a polynomial, as follows

The testing set was used to evaluate the tracking performance of the two models by comparing the estimation error with the measurement error. Figure 8(a) presents the residuals of the two models, demonstrating that these models are suitable for defining the joint distribution of the elevation and time. Figure 8(b) illustrates the differences between the observations and predictions produced by the two models. The differences are generated using the mean absolute error (MAE) function. Because a straight line is applied to fit the data points, the slopes of the two lines represent the elevation estimation errors, where the larger the slopes, the smaller the errors. Figure 9 illustrates the uncertainties of the two models for four segments of SSPs based on the following expression
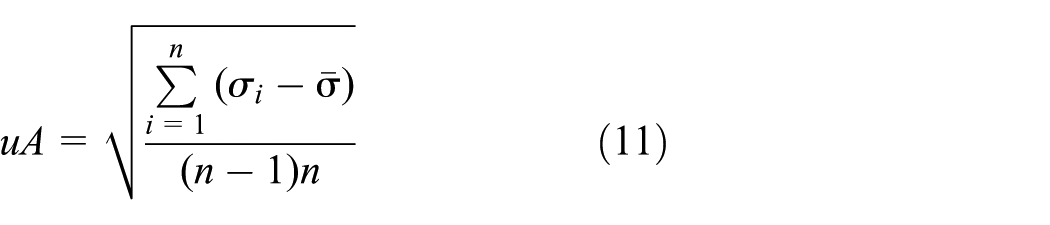
where n is the segment length. We can observe that the uncertainty of the linear model is less than that of the polynomial model when considering each segment with a given elevation range. Thus, we analyzed the errors of all data points from the trajectories using the linear regression method.

Estimation errors of the elevation for heavy-duty trucks using two models: (a) illustrates the residuals of the two models when modeling the the joint distribution of the time and the elevation and (b) shows the differences between the observations and predictions by plotting the straight lines.

Uncertainties for four segments of SSPs with elevation ranges of 300–390, 400–460, 570–600, and 650–700 m.
After calibration of the trajectory by offsetting the error using linear regression, we can label the ground-truth data in the dataset. If the elevation data were greater than or equal to a threshold, it was treated as positive samples (i.e. an increasing elevation), while the remaining data were treated as negative samples. To optimize the thresholds for ground truth labels, we performed 10-fold cross validation and identified the optimal threshold as 6.06 by minimizing the MAE of each sequence in all 48 sequences. We obtained 7119 sequences without SSPs. We consider these as our dataset and label their ground truth, that is,
Parameter study
Figure 10(a) presents the distributions of
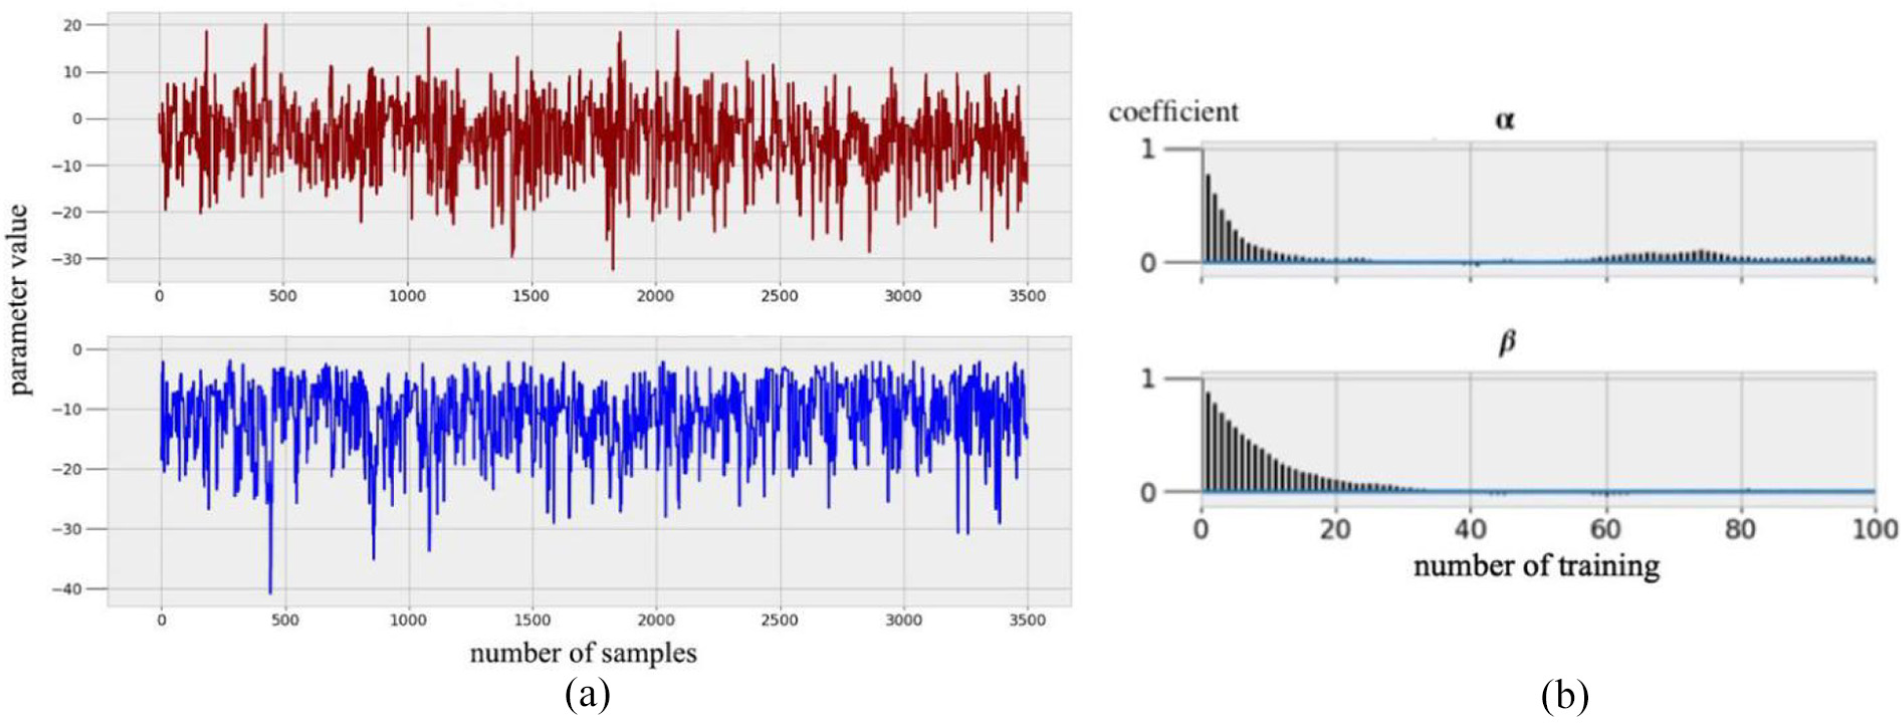
(a) Distribution of
The recognition uncertainty would increase as the parameters become more widely distributed, and the overlapping between the sampled trajectories of heavy-duty trucks traveling on level and on inclined roadways has been investigated. Therefore,
Performance of truck motion identification
The motion behavior recognition results for trucks moving on level and inclined roadways are shown in Figure 11. The behavior recognition algorithm based on the HVMove model classifies motion behavior as climbing (CL) and flat road (FR) motion. However, we note from the figure that the HVMove model classifies the truck behavior in some regions as both CL and FR. This is because the elevation variance is very small and the target truck changes its speed continuously. Therefore, FR behavior probabilities are dominant compared to CL behavior. The behavior recognition algorithm mostly classifies the scenarios as CL for the elevation changing scenario.

Behavior reasoning results for the CL scenario.
Conclusion
This study developed the HVMove model using spatiotemporal characteristics and pattern learning extracted from large-scale GNSS trajectory data for effectively modeling and predicting the ramp-climbing behavior of heavy-duty commercial trucks. First, an elevation-labeled trajectory, called as E-Tra model was established based on sampled trajectory data on a real map. The model provides positioning, time, altitude, and instantaneous speed of the truck, followed by the temporal segmentation of the trajectory data and optimization using Kalman filtering. The characteristics of the processed data were extracted and represented by logistic regression, for instance, the state transition, and the characteristic distribution of the ED was established using the MCMC simulation, which thereby determined the traveling mode characteristics of heavy-duty trucks. The HVMove model was finally established after determining the model parameters using the Metropolis–Hastings algorithm. In addition, the influence of the volume of sampled trajectory data on the predicted probability of ramp-climbing behavior was analyzed. The HVMove model can be integrated with a commercial in-car sensor system to track and identify the truck’s movements in time and to further predict and adapt the behaviors to minimize security risk while driving.
The model proposed herein was created primarily using the characteristics of elevation and time, whereas the influences of other characteristics such as truck speed, positioning marks, and fuel consumption on truck ramp-climbing behavior were not considered. In addition, only a single sampling method was used. Therefore, it is advisable to model and predict additional mobility features of heavy-duty trucks using different sampling methods and the characteristics of multi-source data in the future.
Footnotes
Handling Editor: Rodolfo Meneguette
Declaration of conflicting interests
The author(s) declared no potential conflicts of interest with respect to the research, authorship, and/or publication of this article.
Funding
The author(s) disclosed receipt of the following financial support for the research, authorship, and/or publication of this article: This work was funded by the Key Science and Technological Innovation Team of Shanxi Province, China (Grant No. 2017KCT-29) and the Key Research and Development Plan Project of the Shaanxi Province, China (Grant Nos 2019ZDLGY17-08 and 2019ZDLGY03-0901).