
Abstract
This study investigates the high-temperature tensile properties of laser-welded AA5052-H36 and AA6061-T6 aluminum alloys, utilizing experimental and statistical analysis. Tensile tests were conducted at temperatures ranging from 25°C to 300°C at corresponding strain rates of 0.01 and 0.1 s−1. The results indicate that AA5052-H36 exhibits superior mechanical strength compared to AA6061-T6, with a near-linear decrease in ultimate tensile strength, showing a reduction of approximately 60% from 273 MPa at 100°C to 108 MPa at 300°C. AA5052-H36 also shows consistent increases in fracture strain across the tested conditions, with fracture strain rising from 0.14 at 100°C to 0.37 at 300°C. In contrast, AA6061-T6 displays a non-linear decline in UTS, dropping by 51%, from 220 MPa at 100°C to 110 MPa at 300°C, and an increase in fracture strain from 0.05 at 100°C to 0.07 at 300°C. This non-linear behavior is linked to the dissolution of
Introduction
Aluminum alloys AA5052 and AA6061 are extensively utilized in the automotive industry, particularly in the fabrication of tailor-welded blanks.1–3 AA6061-T6 aluminum alloy has an ultimate-to-yield strength ratio of 1.2, offering a balance of high strength, good ductility, and work-hardening capability. AA6061 is a heat-treatable alloy that benefits from precipitation hardening, significantly improving its strength and hardness.
4
The precipitation sequence in AA6061 aluminum alloy begins with the formation of Guinier-Preston (GP) zones, which are small, coherent clusters of magnesium and silicon atoms within the aluminum matrix. As the alloy undergoes aging, these GP zones evolve into the metastable
AA5052-H36 is renowned for its exceptional corrosion resistance, high fatigue strength, and excellent weldability, making it a preferred choice in marine and industrial applications. The alloy exhibits moderate ductility, allowing for some degree of plastic deformation before failure. 4 AA5052 is a non-heat-treatable aluminum alloy, with mechanical properties primarily derived from solid solution strengthening due to its magnesium content (2.2%–2.8%). Magnesium atoms dissolve in the aluminum matrix, creating lattice distortions that enhance yield and tensile strength while maintaining ductility. This gives AA5052 a good balance of strength and formability. The magnesium content is kept below the solubility limit, ensuring stability across a range of temperatures without the need for heat treatment.8,9 Unlike precipitation-hardened alloys like AA6061, AA5052 remains stable under typical service conditions, making it a reliable choice for applications requiring consistent mechanical properties in varying environments. 6
Laser welding is an efficient and precise method for joining materials, particularly in the context of tailor-welded blanks within the automotive sector. The process offers several advantages, including high welding speeds, deep penetration, and minimal thermal distortion, making it an ideal technique for producing high-quality joints in components with varying thicknesses.
10
Previous studies have extensively investigated the laser welding of aluminum alloys such as AA5052 and AA6061, with a primary focus on their behavior at room temperature. For AA6061, it has been observed that the microstructure in the welding zone typically consists of a dendritic structure due to the rapid solidification of the molten metal during the welding process. The HAZ often experiences notable microstructural changes, including the dissolution of strengthening precipitates like and
Previous studies successfully optimized the processing parameters for welding, achieving maximum mechanical strength comparable to the base material while also reducing weld defects. However, in the production of tailor-welded blanks, post-welding hot deformation processes are often required, necessitating a comprehensive understanding of the mechanical properties of the welded materials at elevated temperatures. Despite the critical importance of this knowledge, there is a lack of extensive studies on the mechanical behavior of laser-welded AA5052 and AA6061 under high temperatures and tensile loads. This study aims to investigate the effects of temperature and strain rate on the tensile properties of these two aluminum alloys post-laser welding. By comparing the mechanical performance of the welded materials to their respective base metals, this research seeks to determine which alloy demonstrates superior mechanical properties, such as strength and ductility, under hot forming conditions. This comparative analysis will provide valuable insights for selecting the most suitable welded material for high-temperature applications, such as welded engine components and exhaust systems, in the automotive industry.
Materials and method
In this study, 1.5 mm thick sheets of AA5052-H36 and AA6061-T6 aluminum alloys were used. The elemental composition of these alloys were provided based on standard compositional data for these alloys, which was confirmed by datasheet from supplier and EDS analysis; presented in Figure 1(a). Laser welding was performed as depicted in Figure 1(b), using a Nd: YAG laser machine with an IPG Photonics YLS3000 laser source and a FANUC robotic arm with 0.07 mm precision. The process employed a 100 µm continuous wave (CW) Nd: YAG optical fiber with an oscillation frequency of 300 Hz. The laser welding parameters, optimized in previous research of the authors, 9 were 2500 W laser power, 5 m/min travel speed, 6.0 mm focal position, and 1.5 mm oscillation amplitude.
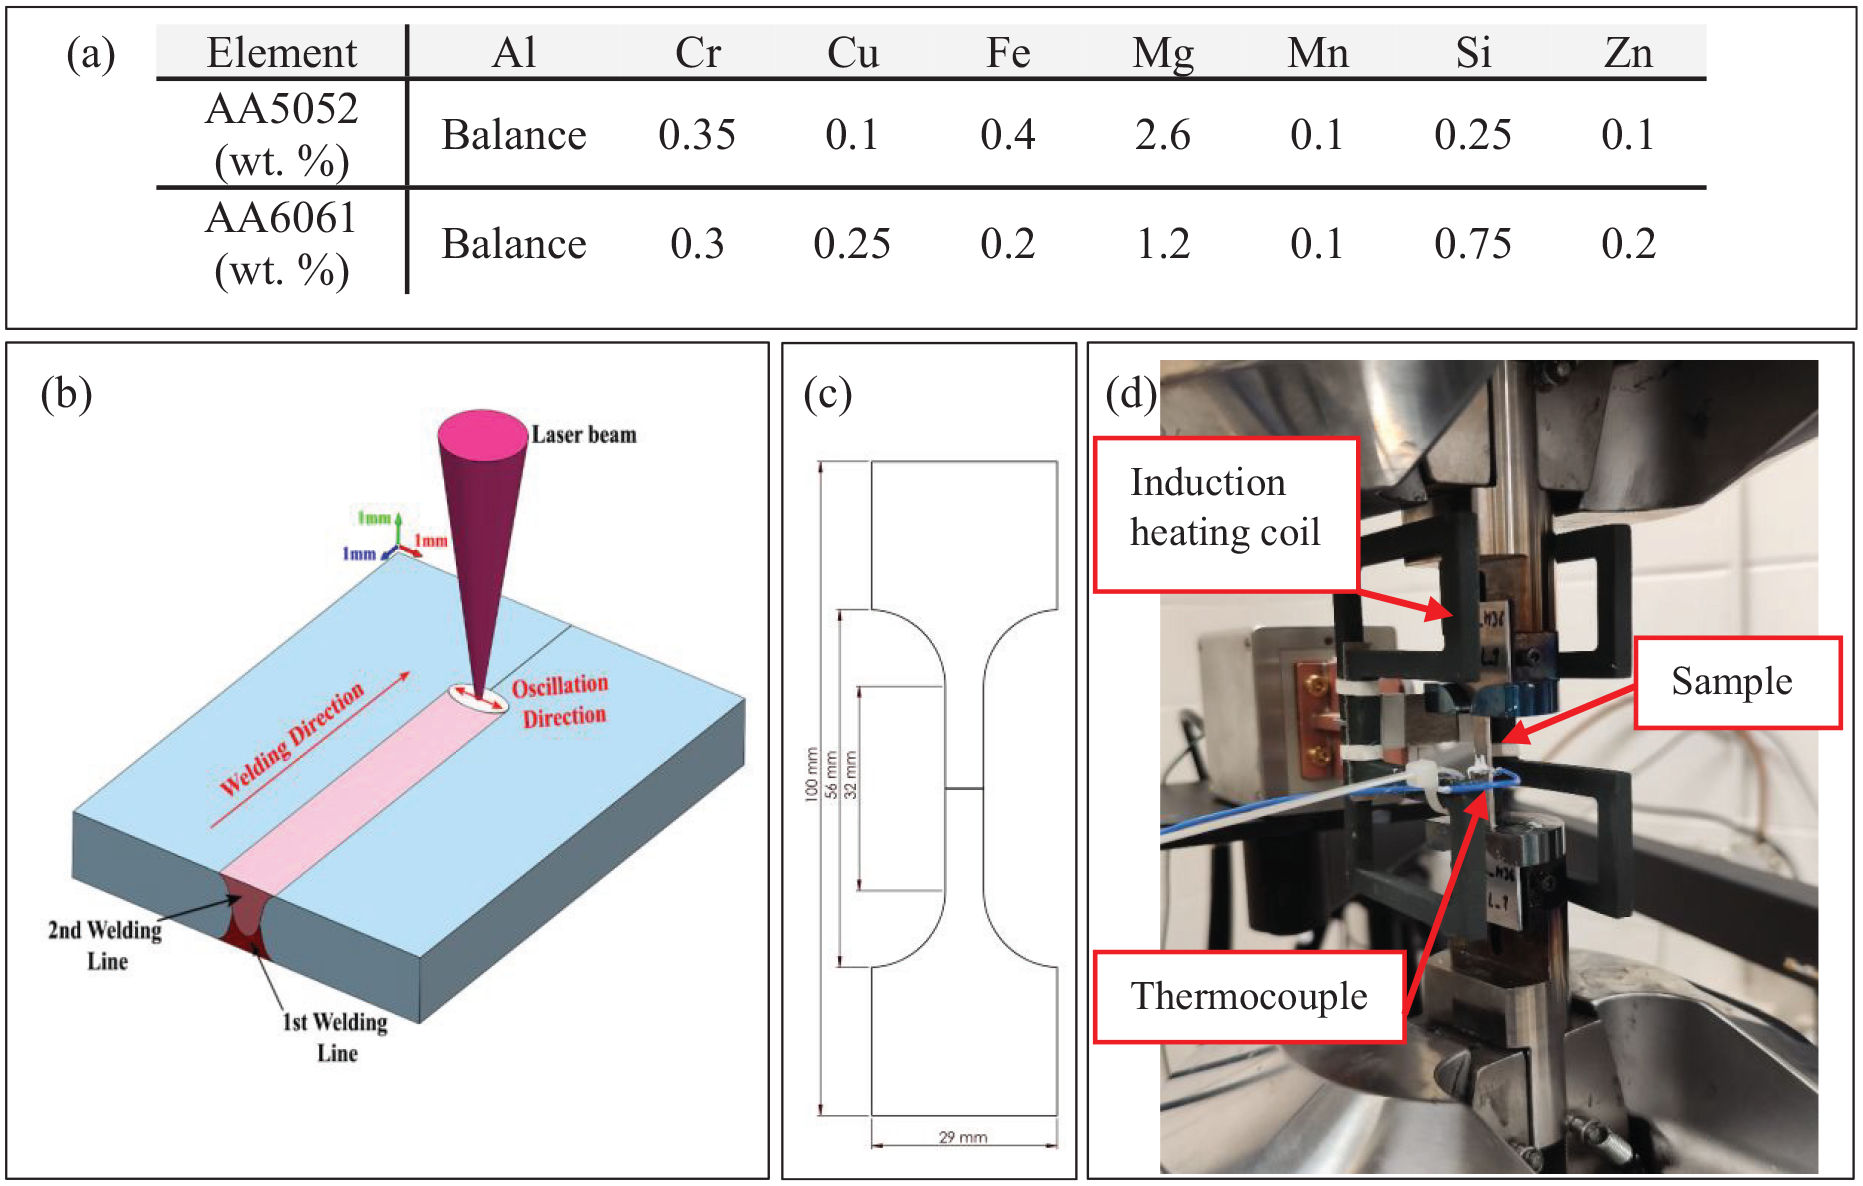
Experimental setup of the study: (a) chemical composition of the materials, (b) weld configuration, (c) tensile test sample’s dimension, and (d) high temperature tensile test setup.
Tensile test specimens were prepared according to the ASTM B557 standard 18 (Figure 1(c)) and tested at various temperatures (25°C, 100°C, 150°C, 200°C, 250°C, and 300°C) and strain rates (0.01 and 0.1 s−1), with 3 repetition at each condition. The tests were conducted using an MTS 809 tensile test machine, which has a maximum load capacity of 100 kN. An induction heating machine was employed to achieve and maintain the desired test temperatures. The temperature of the specimens was monitored and controlled using thermocouples attached to the specimens. Microstructural observation was conducted using an optical microscopy, and fractography was performed using an SNE-4500M electron microscope. The Vickers microhardness profile of the welded area was measured using a Clemex MMT-X7B microhardness tester, applying a 100 g force indentation with a holding time of 10 s.
All DSC analyses were performed using a Mettler Toledo DSC instrument equipped with an HSS8 sensor. Samples analyzed consisted of 4 mm diameter disks punched directly from the heat-treated sheet samples. Standard 40 µl pure aluminum crucibles, in a semi-autogenic atmosphere, were used to contain the sample, while an empty pan (i.e. air) was used as a reference material. The temperature interval from −30°C to 500°C was considered at a 10°C/min heating rate. Nitrogen was allowed to circulate around the furnace area to prevent ice buildup while the instrument operated at temperatures below 0°C. The DSC curves obtained were normalized to the sample mass and a spline baseline was subtracted to eliminate any drift caused by the variation of the specific heat with the temperature.
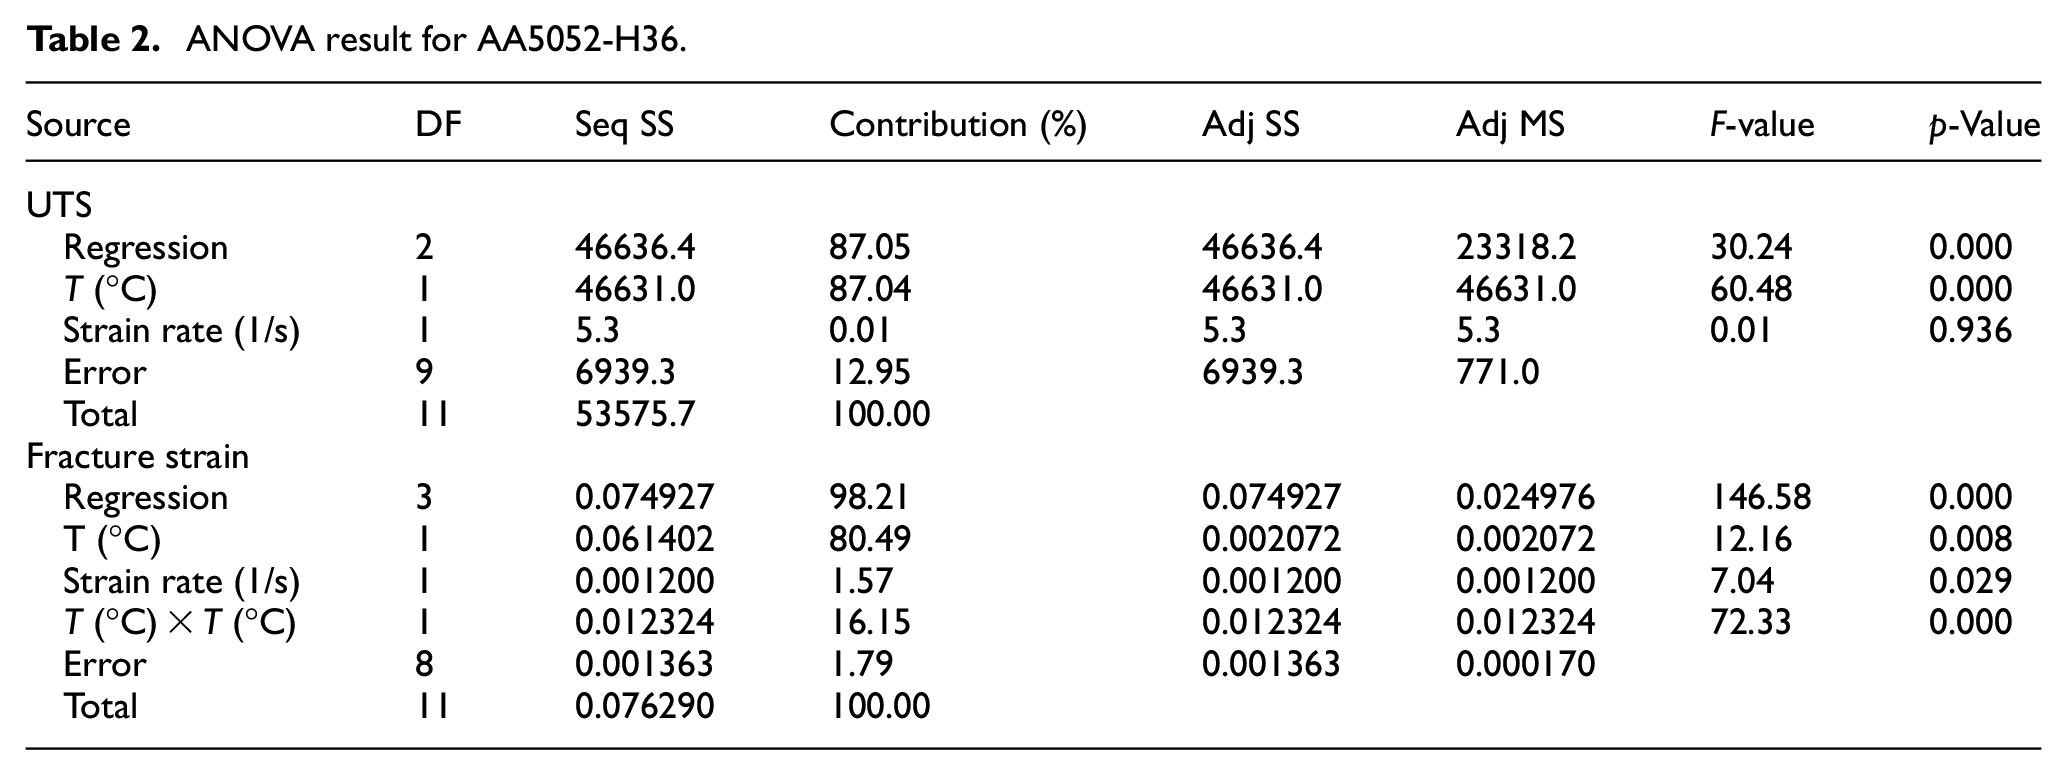
Finally, the statistical analysis was used to validate and further analyze the experimental results, ensuring the reliability and robustness of the conclusions drawn from the data. statistical analysis using Analysis of Variance (ANOVA) was conducted to assess the influence of temperature and strain rate on the UTS and fracture strain of welded AA5052-H36 and AA6061-T6. The ANOVA table includes key terms such as DF (Degrees of Freedom), which represents the number of independent values that can vary; Seq SS (Sequential Sum of Squares), quantifying the variation attributed to each factor; and Contribution, indicating the percentage of total variation explained by each factor. Adj SS (Adjusted Sum of Squares) accounts for the influence of other factors, while Adj MS (Adjusted Mean Square) provides a measure of variance for each factor. The F-value compares the variation due to the factor with the error, and the p-value determines the statistical relevance of each factor, with values typically less than 0.05 indicating a substantial effect.
Result and discussion
Tensile test
Figure 2 shows the tensile test curves of the materials under different tensile condition. Figure 2(a)–(c) present the tensile test results for AA6061-T6, while Figure 2(d)–(f) show the results for AA5052-H36.
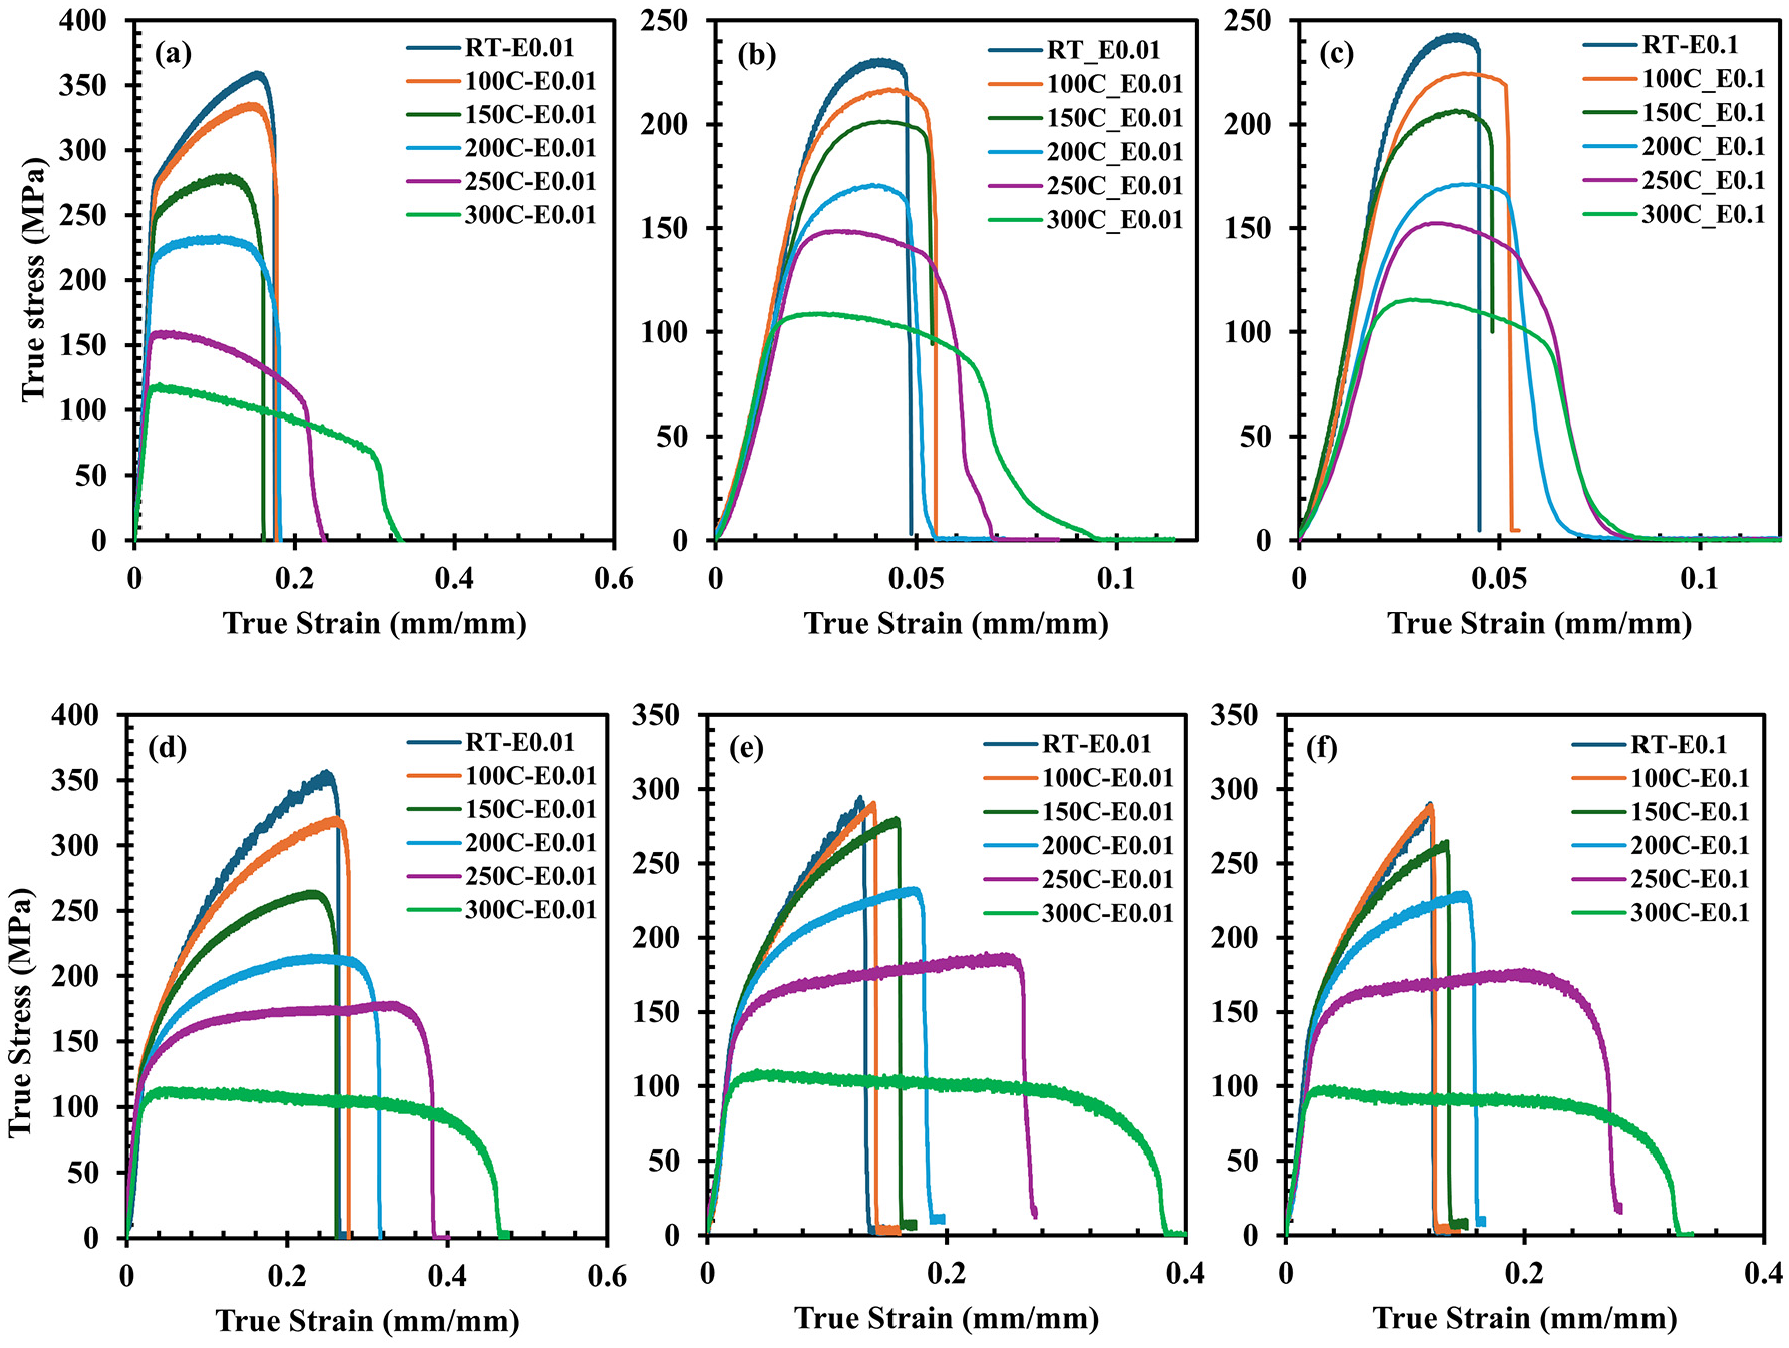
(a) Base material AA6061-T6 at strain rate 0.01 s−1, (b) butt joint welded AA6061-T6 at strain rate 0.01 s−1, (c) butt joint welded AA6061-T6 at strain rate 0.1 s−1, (d) base material AA5052-H36 at strain rate 0.01 s−1, (e) butt joint welded AA5052-H36 at strain rate 0.01 s−1, and (f) butt joint welded AA5052-H36 at strain rate 0.1 s−1.
A comparison between the welded material and the base material clearly shows that the base material possesses better mechanical properties than the welded material across different temperatures. This difference is mainly attributed to the presence of weld defects, which leads to a reduction in mechanical properties. Additionally, the welding process introduces changes in the temper of the material and can lead to the evaporation of certain elements, depending on the specific grade of the material. This is evident in the case of AA6061, where Figure 2(a) illustrates the mechanical properties of the base material, and Figure 2(b) depicts those of the welded material, at various temperatures. The UTS and fracture strain are consistently lower in the welded material compared to the base material across this temperature range. For example, at 100°C, the UTS of the base material is 340 MPa, while it drops to 220 MPa in the welded material. At 300°C, the UTS of the base material is 120 MPa, whereas the welded material shows a slightly lower UTS of 110 MPa. Similarly, welding has a noticeable impact on fracture strain, with fracture strain increasing as the temperature rises. At 100°C, the fracture strain for the base material is 0.18, while it decreases to 0.05 for the welded material. At 300°C, the fracture strain for the base material is 0.32, compared to just 0.07 for the welded material. Notably, as the temperature increases from 100°C to 300°C, the difference in mechanical properties between the base and welded materials becomes smaller. This indicates that at higher temperatures, the mechanical properties of the base and welded materials converge, with the values getting closer to each other. This trend, as shown in Figure 3, suggests that the detrimental effects of welding on AA6061-T6 become less pronounced as the temperature increases.
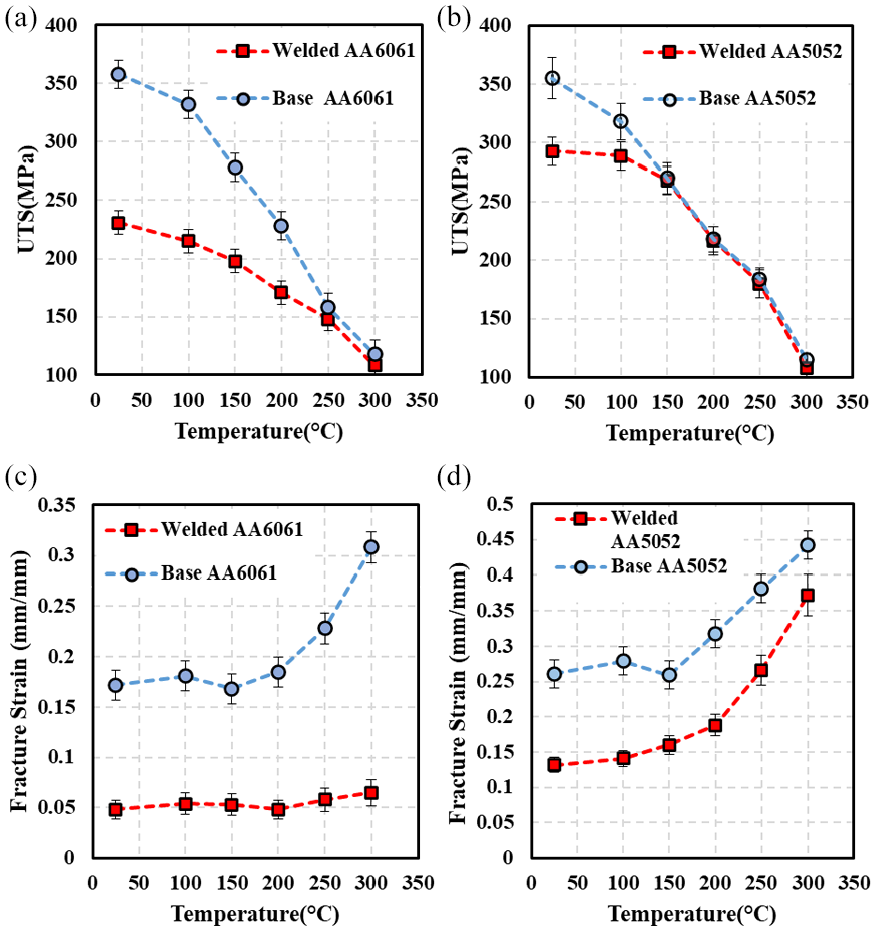
(a and b) UTS and (c and d) fracture strain changes as a function of temperature and at a strain rate of 0.01 s−1.
Similarly, for AA5052-H36, a comparison between Figure 2(d) (base material) and Figure 2(e) (welded material) reveals a similar trend, though the reduction in mechanical properties due to welding is less severe. The UTS of the welded AA5052-H36 decreases slightly across the temperature range. For instance, at 100°C, the UTS of the base material is 330 MPa, while it drops to 273 MPa for the welded material. At 300°C, the UTS of the base material further decreases to 115 MPa, with the welded material showing a slightly lower UTS of 108 MPa. Similarly, the fracture strain is also affected by welding, though the differences become less pronounced at higher temperatures. At 100°C, the fracture strain of the base material is 0.22, while it decreases to 0.14 for the welded material. At 300°C, the fracture strain for the base material is 0.44, compared to 0.37 for the welded material. This indicates that, although the base material generally exhibits higher fracture strain than the welded material, the gap between them narrows as the temperature increases (Figure 3).
The effects of increasing the strain rate from 0.01 to 0.1 s−1 on the mechanical properties and tensile behavior of the materials are negligible. Both AA6061-T6 and AA5052-H36 consistently show similar behavior at higher strain rates as they do at lower strain rates. Figure 2(c) shows the effect of a higher strain rate on the welded AA6061-T6 material. When we compare this with Figure 2(b), which represents a lower strain rate for the same material, we observe that increasing the strain rate from 0.01 to 0.1 s−1 has a negligible impact on the mechanical properties. The material’s behavior remains almost unchanged, indicating that AA6061-T6 is not significantly affected by variations in strain rate. Similarly, Figure 2(f) illustrates the effect of a higher strain rate on the welded AA5052-H36 material. When compared to Figure 2(e), which represents a lower strain rate for AA5052-H36, the results show a minimal change in mechanical properties with the increased strain rate. This consistency across different strain rates suggests that AA5052-H36, like AA6061-T6, maintains stable mechanical performance within the range of strain rates tested. This minimal variation can be attributed to the materials’ relatively stable microstructure and the fact that the strain rate range tested is within the regime where strain rate sensitivity is minimal for these alloys. Such a finding is also reported in the literature.19,20
Figure 3 illustrates the reduction trend in the UTS for all materials at a strain rate of 0.01 s−1. Figure 3(a) shows the UTS reduction for both the welded and base AA6061-T6. This figure indicates an approximately linear reduction in UTS with increasing tensile temperature. It is also evident that as the temperature increases, the UTS values for the welded and base materials converge, indicating that the strength difference between the welded and base AA6061-T6 decreases at higher temperatures. Similarly, Figure 3(b) depicts the UTS reduction for both the welded and base AA5052-H36. This figure also demonstrates a linear reduction in UTS with increasing temperature. However, when comparing the trends for AA5052-H36 and AA6061-T6, it is clear that the UTS for the welded AA5052-H36 remains much closer to that of the base material across the temperature range. This indicates that AA5052-H36 retains more of its original strength after welding compared to AA6061-T6. The comparison between these two figures highlights that AA5052-H36 is a superior candidate for applications requiring high-temperature performance and post-welding strength retention. The smaller reduction in UTS and the closer alignment between the welded and base material strengths at elevated temperatures make AA5052-H36 more suitable than AA6061-T6 for such applications.
Figure 3(c) and (d) illustrate the fracture strain behavior of AA6061 and AA5052 alloys across varying temperatures. In Figure 3(c), which displays the fracture strain trends for AA6061, the base material shows a marked increase in fracture strain with rising temperature, reflecting enhanced ductility at elevated temperatures. In contrast, the welded AA6061 material consistently exhibits low fracture strain values, remaining below 0.1 across all temperatures. The reduction in fracture strain for the welded material is likely due to the evaporation of magnesium during the welding process, which has been shown to lead to the formation of porosities within the microstructure. Figure 3(d) shows the fracture strain behavior for AA5052. Unlike AA6061, the welded AA5052 material exhibits a significant increase in fracture strain at higher temperatures. As temperature rises, the fracture strain of the welded AA5052 material increases exponentially, approaching the values of the base material. This trend suggests that the welded AA5052 alloy retains and even improves its ductility at elevated temperatures, eventually displaying mechanical behavior similar to that of the base material.
Statistical analysis
In this study, a comprehensive statistical analysis was conducted to understand the influence of temperature and strain rate on the UTS and fracture strain of welded AA5052-H36 and AA6061-T6. Given the experimental observations that temperature exerts the most significant effect on mechanical properties, it was crucial to quantify the contribution of both temperature and strain rate to the variations in UTS and fracture strain. To achieve this, ANOVA was employed to determine the percentage contribution of each factor, providing a clear understanding of their relative impact. Additionally, regression models were developed to explore the relationship between temperature, strain rate, and mechanical properties. The nature of these relationships, whether linear, exponential, or otherwise, was characterized, and the effects of changes in temperature and strain rate on UTS and fracture strain were quantified using these models.
Table 1 presents the ANOVA results for AA6061-T6. The analysis reveals that temperature is the predominant factor influencing UTS, accounting for 95.09% of the variability, with a highly significant p-value of 0.000. This linear relationship between UTS and temperature suggests that the mechanical strength of AA6061-T6 is closely tied to microstructural changes, particularly the dissolution of strengthening precipitates as temperature increases. Strain rate, on the other hand, contributes a negligible 0.34% to UTS variability, indicating that UTS is largely unaffected by changes in strain rate. For fracture strain, temperature continues to play a major role, contributing 65.16% to the variability, but with additional significant contributions from higher-order temperature terms (quadratic and cubic), which account for a combined 20.92% of the variability. This indicates a more complex, non-linear relationship between temperature and fracture strain, likely due to the sensitivity of fracture strain to microstructural defects and localized weaknesses in the material. The strain rate’s impact on fracture strain is minor and statistically insignificant.
ANOVA result for AA6061-T6.
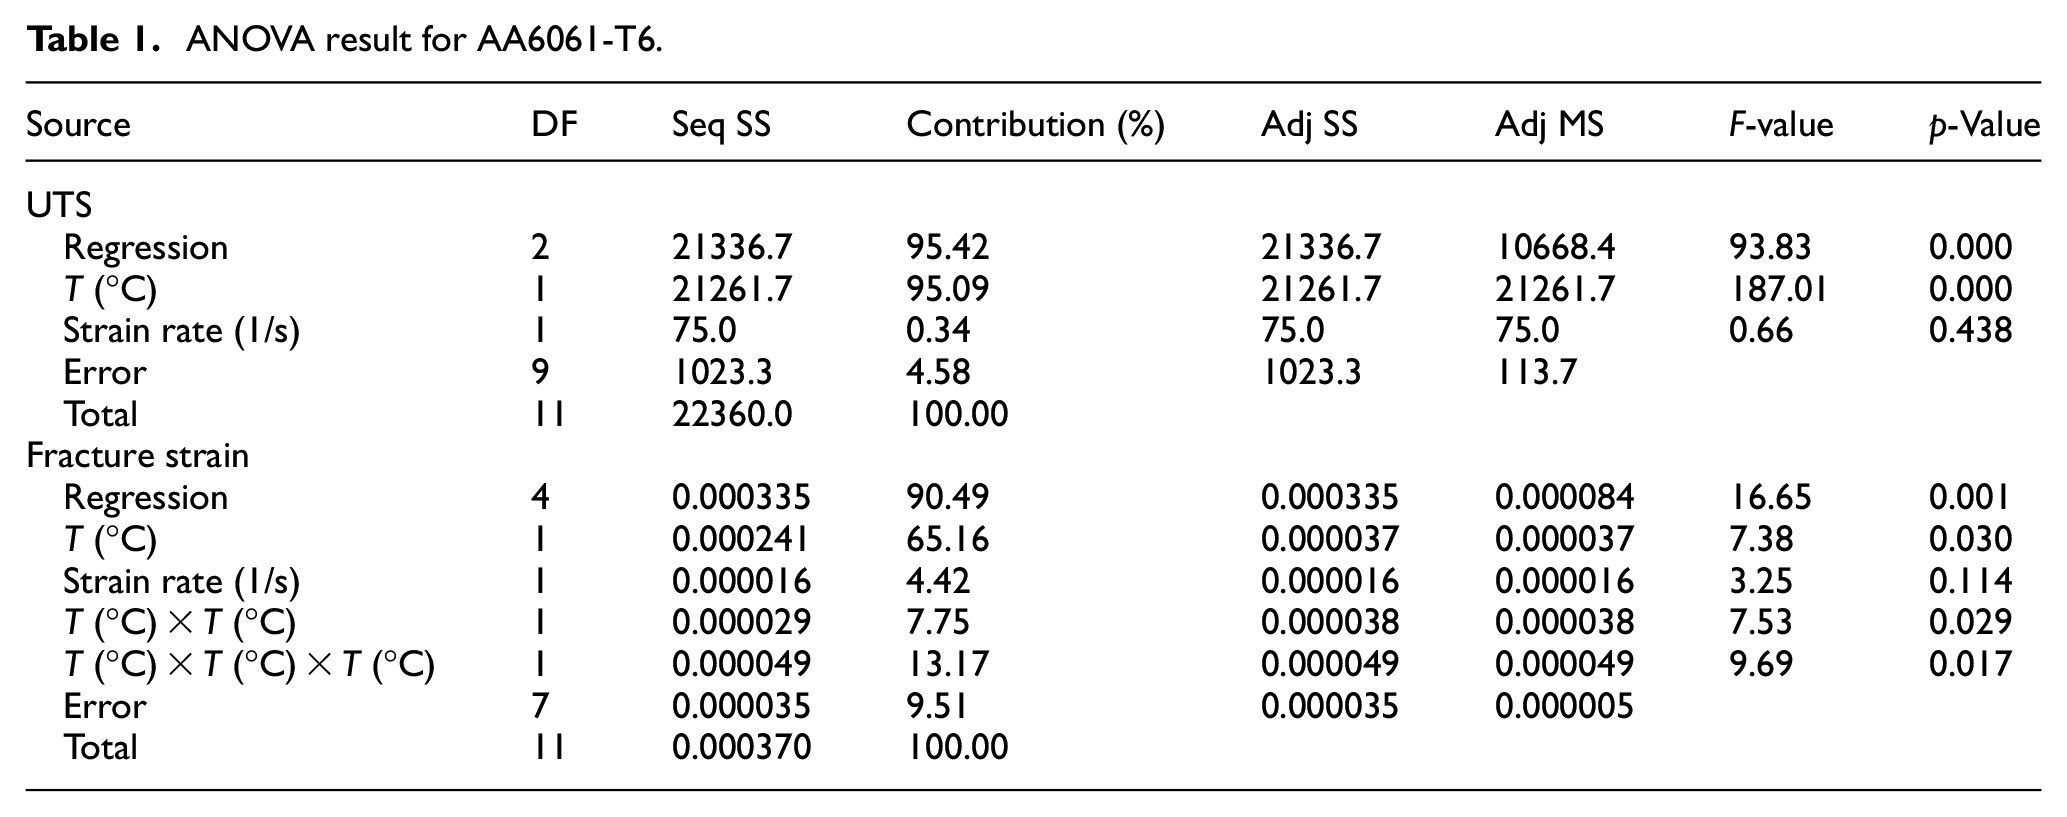
Table 2 presents the ANOVA results for AA5052-H36. Similar to AA6061-T6, temperature is the most influential factor affecting UTS in AA5052-H36, contributing 87.04% of the variability, with a p-value of 0.000, indicating a strong linear relationship. However, the error term is slightly higher in this alloy, accounting for 12.95% of the variability, suggesting the presence of other influencing factors not captured in the model. For fracture strain, temperature is again the dominant factor, contributing 80.49% of the variability. However, unlike AA6061-T6, the strain rate in AA5052-H36 has a statistically notable, though small, effect on fracture strain, contributing 1.57% with a p-value of 0.029. The quadratic temperature term is also highly relevant, contributing 16.15% to the variability, indicating a strong non-linear relationship between temperature and fracture strain in this alloy.
ANOVA result for AA5052-H36.
When comparing the ANOVA results for AA6061-T6 and AA5052-H36, several key differences emerge. While temperature is the dominant factor influencing UTS in both alloys, its impact is more pronounced in AA6061-T6, with a higher percentage contribution and lower error term, suggesting a more direct relationship. For fracture strain also, both alloys show significant non-linear relationships with temperature.
The main effect plots presented in Figure 4 provide a comprehensive view of the impact of temperature and strain rate on the UTS and fracture strain of AA6061-T6 and AA5052-H36.
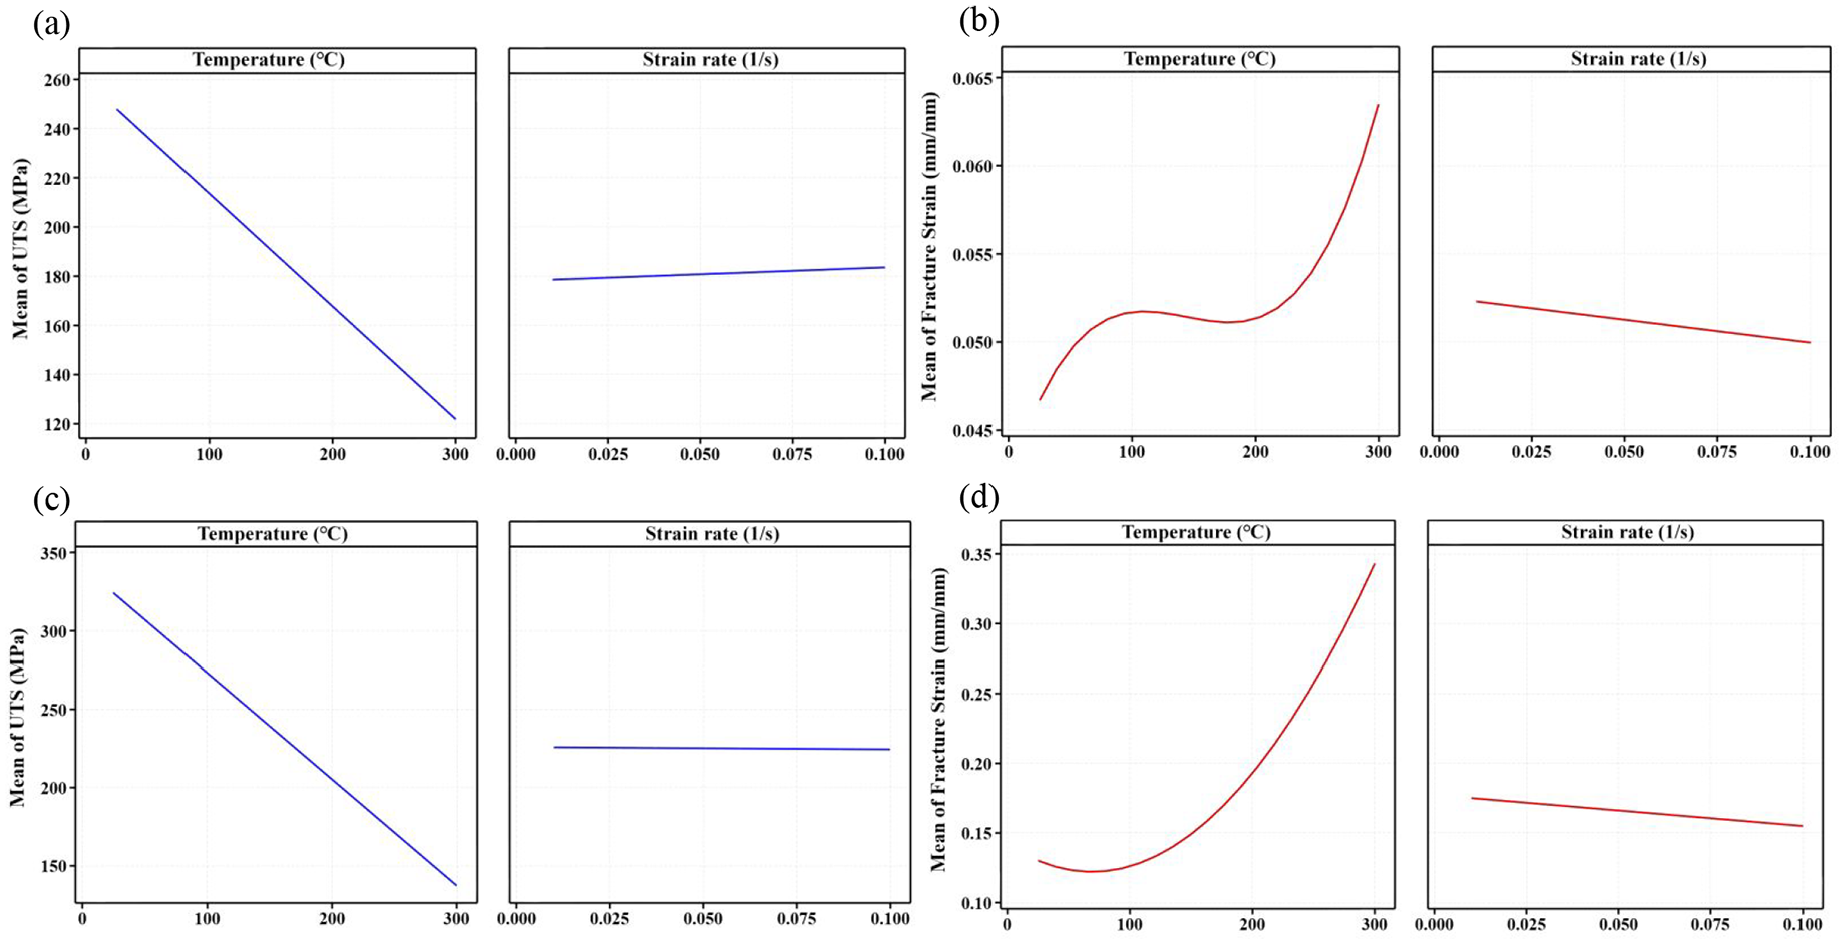
Main effect plots for: (a) UTS of AA 6061-T6, (b) fracture strain of AA 6061-T6, (c) UTS of AA 5052-H36, and (d) fracture strain of AA 5052-H36.
For AA6061-T6 (Figure 4(a)), the sharp decrease in UTS from approximately 250 MPa at 25°C to about 125 MPa at 300°C reflects the crucial role of temperature as identified in the ANOVA analysis. The steep slope of the temperature effect curve underscores the high contribution of temperature to the variability in UTS, accounting for over 95% of the total variation, as highlighted in the ANOVA results. This statistical representation quantifies the impact of temperature, making it clear that the reduction in UTS is not just observable but statistically relevant. The flat line representing strain rate, with UTS remaining around 170 MPa, confirms that strain rate contributes minimally to UTS, reinforcing its negligible effect in the model. For AA5052-H36 (Figure 4(c)), UTS decreases from approximately 350 MPa at 25°C to around 250 MPa at 300°C. The less steep decline, compared to AA6061-T6, suggests a lower sensitivity to temperature, which is statistically validated by a lower contribution of temperature to the UTS variability in the ANOVA results. The near-horizontal line for strain rate indicates its negligible effect on UTS, statistically supporting the observation that strain rate does not materially influence UTS in AA5052-H36.
For AA6061-T6 (Figure 4(b)), the fracture strain exhibits a complex, non-linear response to temperature. Initially, fracture strain decreases slightly as the temperature rises to around 150°C, but beyond this point, there is a significant increase, with fracture strain reaching approximately 0.065 mm/mm at 300°C. This non-linear trend reflects the material’s transition from a more brittle to a more ductile failure mode as temperature increases. The ANOVA analysis supports this observation, revealing noteworthy quadratic and cubic terms that statistically validate the temperature’s complex effect on fracture strain. The plot’s curvature highlights the pronounced non-linear relationship, which might not be as evident from initial tensile data alone. The slight negative impact of strain rate, with fracture strain decreasing from 0.053 to 0.05 mm/mm as strain rate increases, is also confirmed by the ANOVA results, though its contribution is relatively minor compared to the overwhelming influence of temperature. In contrast, AA5052-H36 (Figure 4(d)) shows a robust, non-linear increase in fracture strain as temperature rises. The fracture strain increases markedly from approximately 0.12 mm/mm at lower temperatures to around 0.35 mm/mm at 300°C, indicating a significant enhancement in ductility with increasing thermal exposure. This strong non-linear behavior is statistically captured by the ANOVA model, where the quadratic term for temperature contributes substantially to the variability in fracture strain. This suggests that AA5052-H36 not only maintains but also improves its ductility at elevated temperatures, making it a more resilient option under thermal stress compared to AA6061-T6. The minimal impact of strain rate, with fracture strain slightly decreasing from 0.17 to 0.1 mm/mm as strain rate increases, further emphasizes that temperature is the primary driver of ductility changes in AA5052-H36, a conclusion reinforced by the statistical insignificance of strain rate effects in the ANOVA results.
The non-linear behavior observed in the ANOVA analysis for AA5052-H36 and AA6061-T6 can be directly related to the differences in their microstructural evolution, as evidenced by the DSC curves. The ANOVA table for AA5052-H36, combined with DSC data from the literature,
21
shows that this alloy does not undergo significant phase changes at the temperatures tested, primarily because AA5052-H36 is a non-heat-treatable alloy. The phases present in this material remain stable up to much higher temperatures, typically above 592°C,
21
which is above the temperature in this study. In contrast, the higher sensitivity of AA6061-T6 to both quadratic and cubic temperature terms in the ANOVA results highlights the more complex and non-linear relationship between temperature and mechanical properties. This non-linear behavior is justified by the DSC curve of AA6061-T6, which shows distinct peaks corresponding to various precipitation phases. The DSC curve, shown in Figure 5, indicates that the first peak is related to the formation of Guinier-Preston (GP) zones, which contribute to the initial hardening of the material. As the temperature increases to around 206°C, the
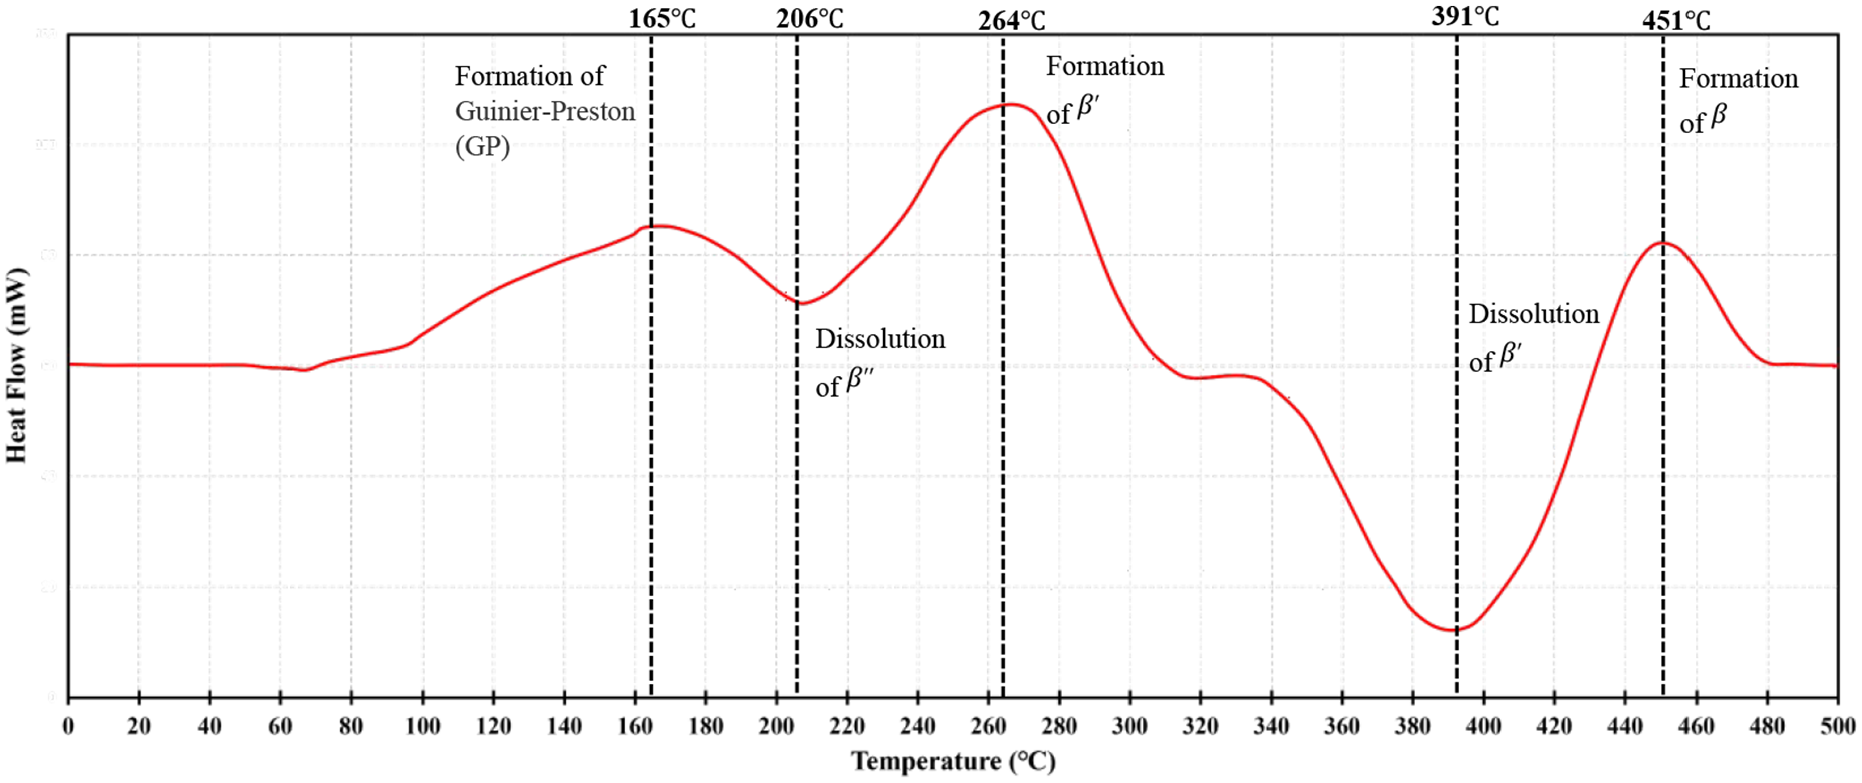
DSC thermal analysis of alloy AA 6061-T6 for heating.
The tensile stress temperatures in this study are categorized in relation to significant phase transformation points, providing insight into the mechanical behavior of AA6061-T6 at each stage. From room temperature to 150°C, the material remains below the critical temperature of 165°C, where GP zones reach their peak formation. In this temperature range, the GP zones, which are small coherent precipitates, play a crucial role in strengthening the material by impeding dislocation movement, thereby enhancing hardness and tensile strength. However, because this range is below the dissolution temperature of the
The regression models for UTS and fracture strain have been developed and are presented in equations (1)–(4).
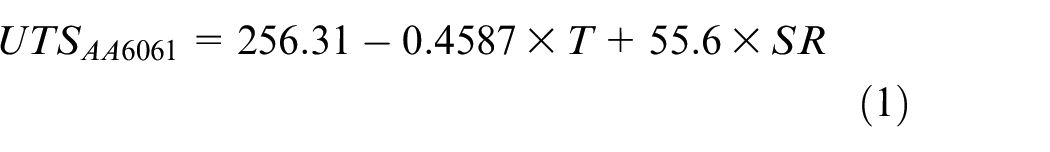

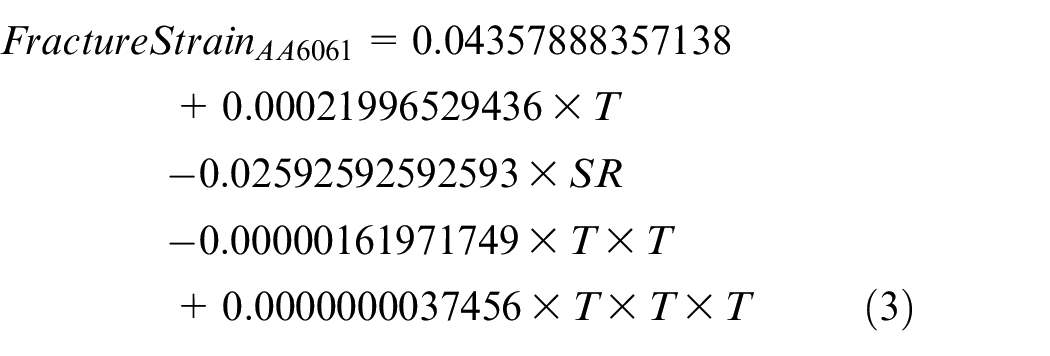
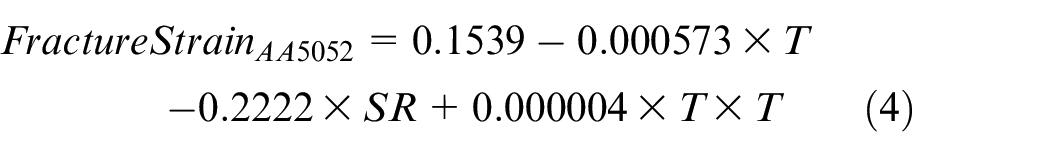
Figure 6 shows the predicted values versus the actual values for UTS and fracture strain. Figure 6(a) displays the predicted versus actual values for UTS for both alloys, while Figure 6(b) presents the corresponding plot for fracture strain. The diagrams indicate a very high correlation between the actual and predicted values, demonstrating the precision of the regression model. The error line reflects a low level of errors, consistently less than 10%, in alignment with the ANOVA calculations. These accurate regression models were subsequently used for the extraction of the contour plots.
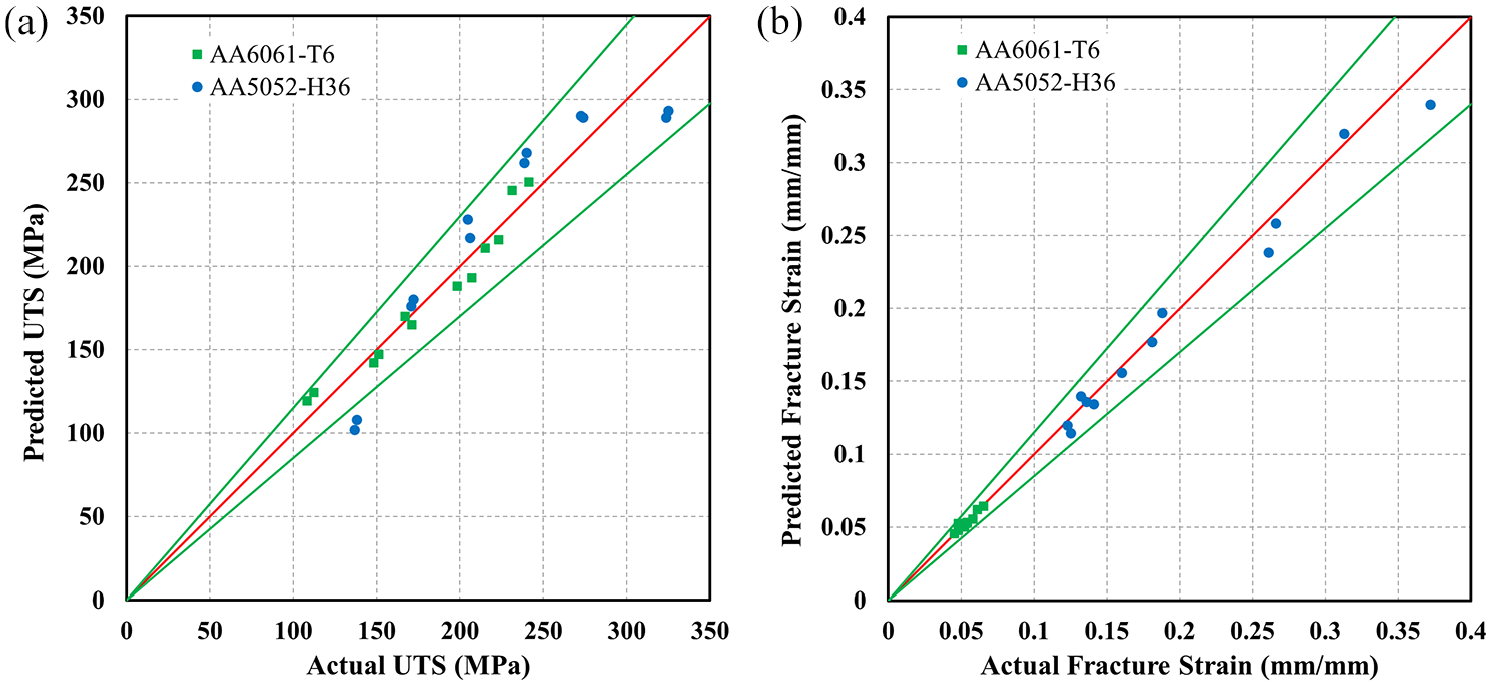
Predicted versus actual values for: (a) UTS and (b) fracture strain of AA 6061-T6 and AA 5052-H36.
While the regression models used to predict ultimate tensile strength UTS and fracture strain provide a good fit within the tested temperature and strain rate conditions, it is important to discuss their limitations, particularly with respect to extrapolation beyond the tested conditions. These models are based on the assumption that the relationship between the input variables (temperature, strain rate) and the output properties (UTS, fracture strain) is consistent across the tested range. However, this assumption may not hold true when applying the models to conditions outside of the experimental data range. Extrapolation beyond the tested conditions can lead to inaccuracies, as the relationship captured by the model may not reflect the material’s true behavior under different conditions. The tested conditions in this study were limited to a specific temperature range (25°C to 300°C) and strain rates (0.01 and 0.1 s−1), so predictions outside of these conditions should be made with caution. Additionally, the model assumes that the relationship between temperature, strain rate, and mechanical properties is linear. While this assumption holds within the tested ranges, it may not be valid if applied to a broader range of conditions. Non-linear behaviors, interactions between variables, or phase changes at different temperatures could affect the accuracy of predictions made using this model. There are also potential sources of error, such as measurement uncertainties and overfitting. Measurement uncertainties in the experimental data, including temperature and strain rate variations, can introduce minor errors in the model predictions. Overfitting, where the model captures noise or random fluctuations in the data rather than generalizable trends, can lead to less accurate predictions when the model is applied outside the tested conditions.
Figure 7(a)–(d) present the contour plots extracted from the predicted model discussed in the previous sections. The unique advantage of these contour plots lies in their ability to elucidate the relationships between temperature, strain rate, and fracture strain. Figure 7(a) shows the relationship between UTS and temperature, clearly illustrating the consistent linear decrease in UTS with increasing temperature across all strain rates; a relationship that has been thoroughly discussed in the previous sections. Figure 7(b) illustrates the fracture strain of AA6061-T6 as a function of temperature and strain rate. The contour lines on the plot provide detailed insights into the relationships between strain rate, temperature, and fracture strain. When examining fracture strains below 0.048 mm/mm, the relationship between temperature, strain rate, and fracture strain appears linear, with temperature having a gradual, predictable effect on fracture strain. Similarly, at fracture strains above 0.054 mm/mm, the relationship once again becomes linear, but with a more pronounced influence of temperature on fracture strain. However, within the range between these two fracture strain values, specifically around 0.051 mm/mm, the relationship becomes notably complex. Here, the contour lines are curved, indicating that fracture strain is highly sensitive to both temperature and strain rate, unlike the linear behavior observed outside this range. This sensitivity suggests that within this range, small variations in temperature and strain rate can lead to significant and non-linear changes in fracture strain. This behavior is likely connected to the material transitions observed in the DSC curve, indicating that phase changes occurring within this temperature range contribute to the complexity of the relationship between fracture strain, temperature, and strain rate. The alignment of this complex relationship with the thermal transitions observed in the DSC analysis reinforces the model’s accuracy in capturing the intricate effects of these factors on the material’s fracture behavior. Similarly, the contour plots for AA5052-H36, shown in Figure 7(c) and (d), reveal patterns akin to those observed for AA6061-T6. In Figure 7(c), the linear relationship between UTS and temperature is evident across different strain rates, confirming the predictable decrease in UTS with increasing temperature. Figure 7(d) focuses on fracture strain, showing that for values below 0.15 mm/mm, the relationship between strain rate, temperature, and fracture strain is non-linear, as indicated by the curved contour lines. However, above 0.15 mm/mm, the contour lines become linear, suggesting that temperature and strain rate have a more straightforward and predictable influence on fracture strain in this range.
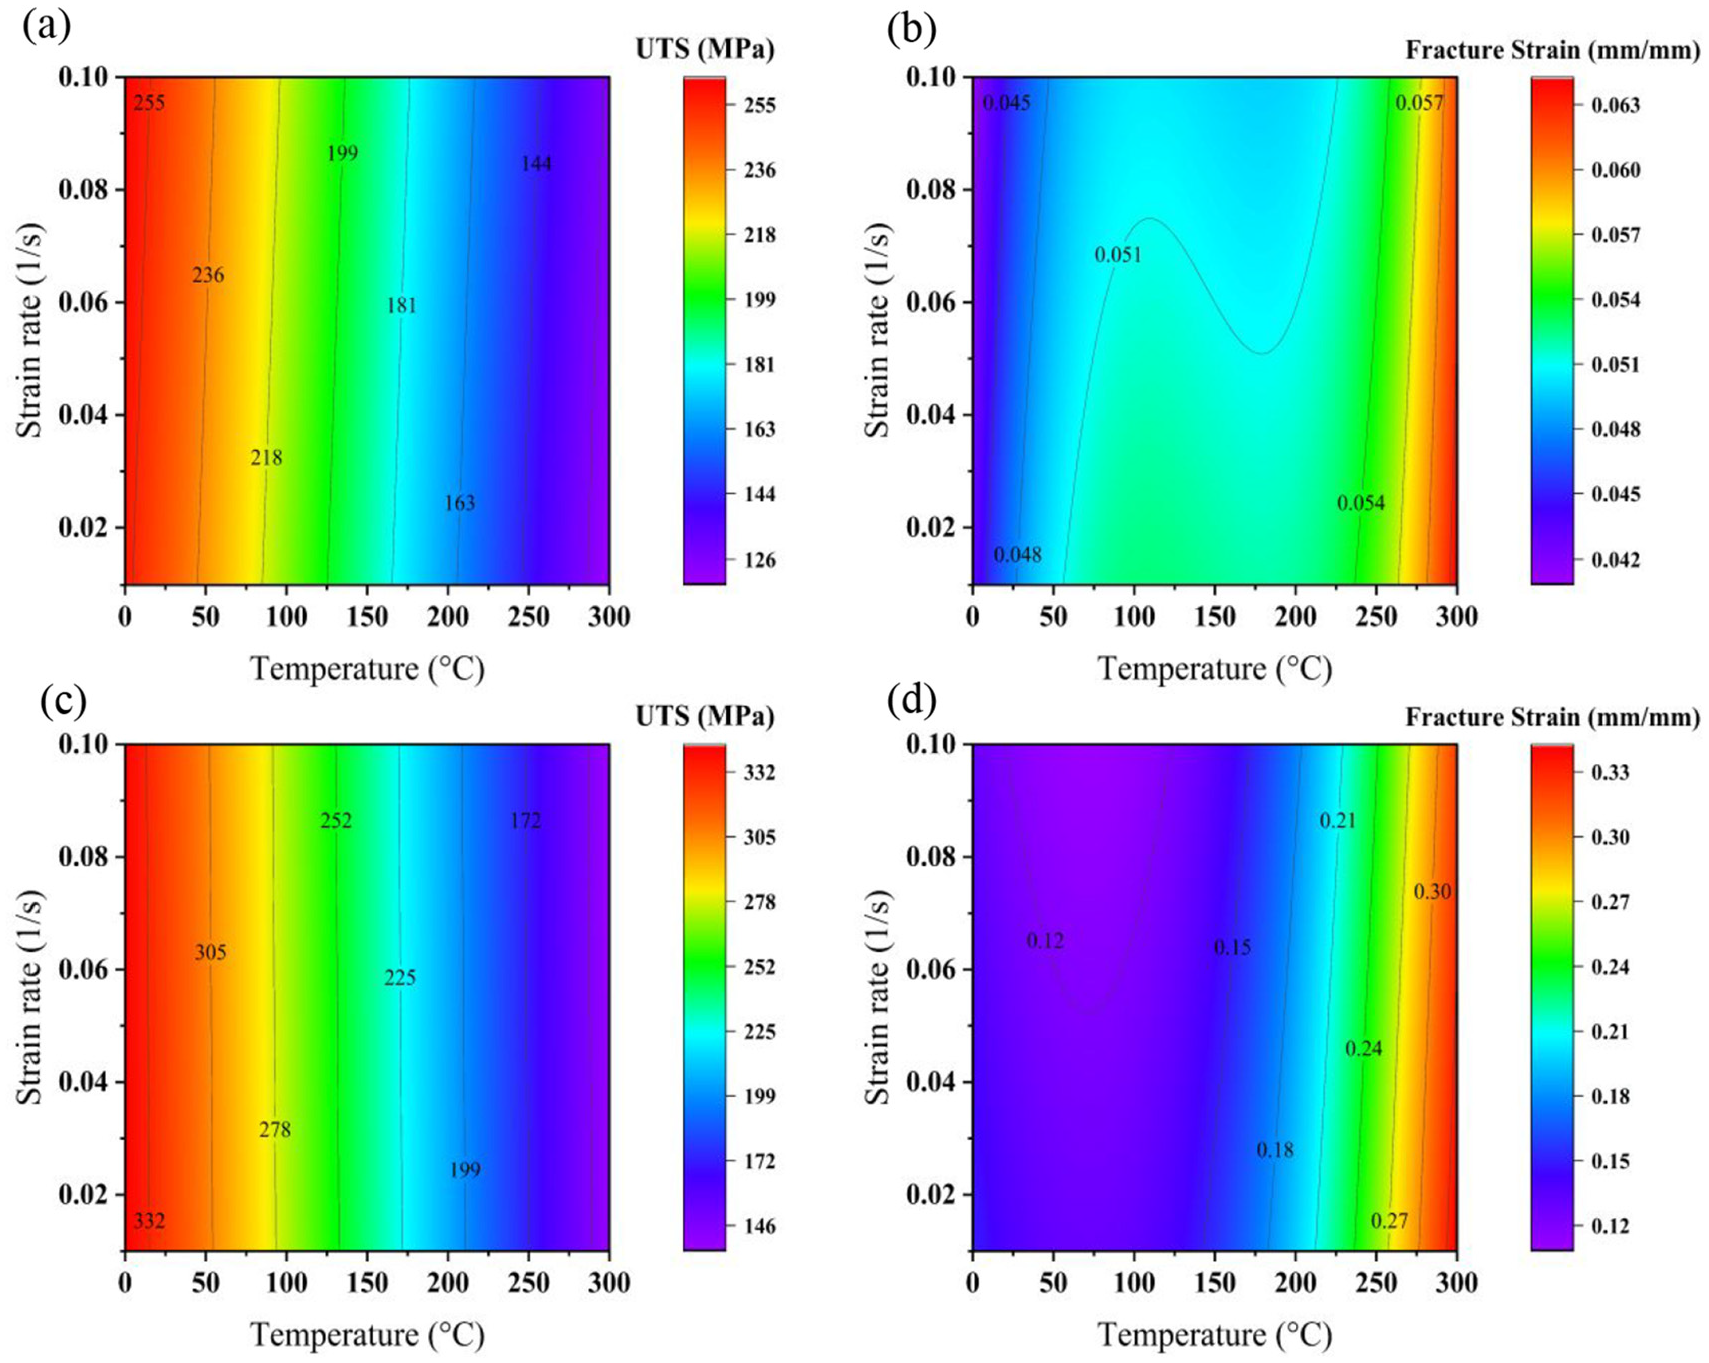
Contour plots of regression model: (a) UTS of AA 6061-T6, (b) fracture strain of AA 6061-T6, (c) UTS of AA 5052-H36, and (d) fracture strain of AA 5052-H36.
Microstructure and fractography
Figure 8 illustrates the fractography and microstructure of the welded AA6061-T6 at room temperature and 300°C. Figure 8(a) shows the macrostructure of the welded material. At room temperature the fracture occurs in the HAZ, which is commonly reported in the literature as the weakened part of the aluminum laser welded materials due to the residual stresses, grain growth, and the potential for defects like porosity and cracking.22,23 When the temperature is increased to 300°C, the fracture location shifts from the HAZ to the FZ. This shift could be attributed to the changes in material properties and microstructural evolution with increasing temperature. Figure 8(b) depicts the microstructure of the material after fracture in the welded area. The microstructure of the HAZ at both room temperature and 300°C shows similar features, revealing an increase in oriented elongated grains in the welded area, aligning toward the heat flux direction, indicating significant thermal influence during welding.
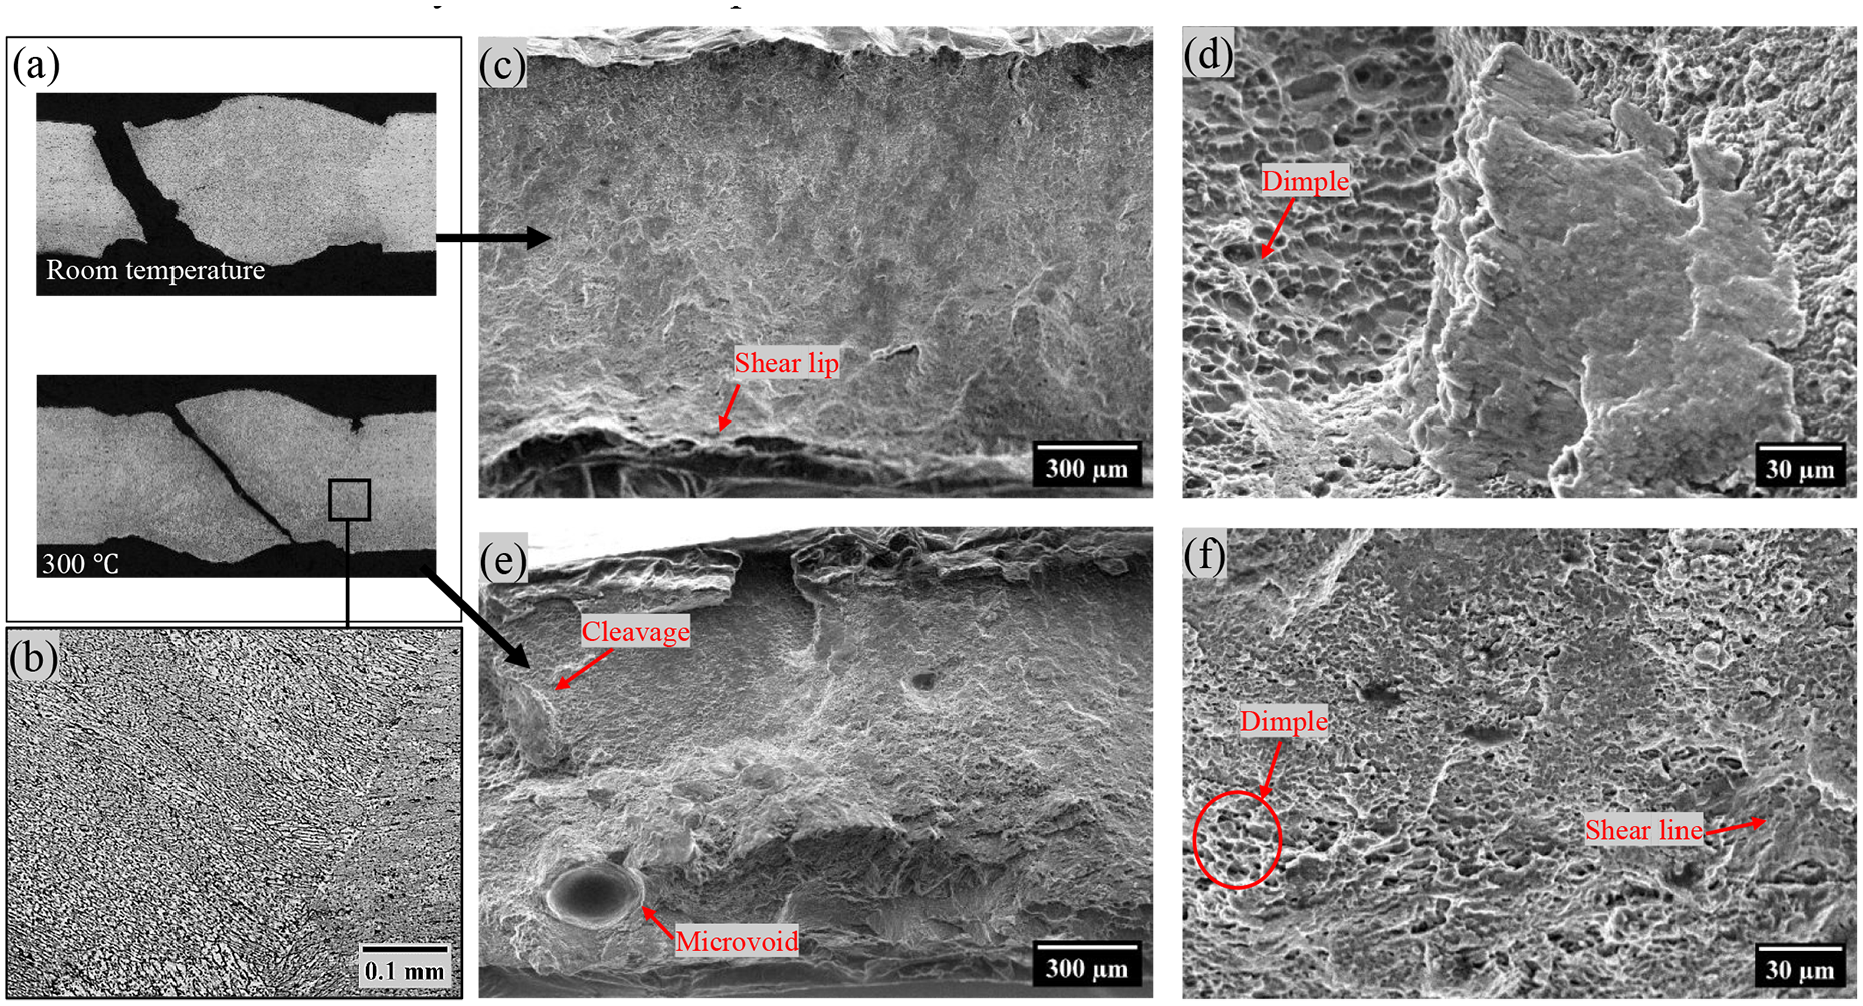
Optical microscopy image of AA6061-T6: (a) macrostructure, (b) microstructure, and SEM fractographic image at (c) low magnification at room temperature, (d) high magnification at room temperature, (e) low magnification at 300°C, and (f) high magnification at 300°C.
Figure 8(c) and (d) show the fracture surfaces at room temperature. At low magnification (Figure 8(c)), the fracture surface exhibits a relatively flat and brittle fracture with shear lips at the edges. The SEM image in Figure 8(d) shows that the welded AA6061-T6 alloy at room temperature exhibits a complex fracture surface with both brittle and ductile features. The cleavage facets represent regions of brittle fracture where the material failed along specific crystallographic planes. In contrast, the microvoid coalescence and dimple formation indicate areas where the material underwent plastic deformation, leading to more ductile features of fracture. The coexistence of these fracture modes suggests that the material’s response to tensile loading at room temperature involves both brittle and ductile mechanisms. This mixed-mode fracture behavior is significant because it indicates that while the material can absorb some energy through plastic deformation, it is also prone to abrupt brittle failure.
With an increase in temperature to 300°C, the fracture surface characteristics change significantly. Figure 8(e) (low magnification) at high temperature shows a more ductile fracture pattern, with two distinct fracture types. flat surfaces with cleavage facets indicating abrupt fractures and areas with severe plastic deformation alongside improved coarsening. The SEM image in Figure 8(e) demonstrates that the welded AA6061-T6 alloy at 300°C predominantly shows ductile fracture (compared to brittle fractures features) with significant plastic deformation. The presence of large dimples and coalesced microvoids indicates that the material absorbed considerable energy during deformation, resulting in a more ductile fracture mode. The mixed fracture modes, with some cleavage facets and shear lips, suggest that while ductile mechanisms dominate, brittle components are still present, albeit less pronounced than at lower temperatures. The thermal influence at 300°C enhances the material’s ductility, allowing for more extensive plastic deformation before failure. This change in fracture behavior from brittle at room temperature to more ductile at elevated temperatures is crucial for understanding the material’s performance in high-temperature applications. Figure 8(f) (high magnification) reveals very soft fracture features, including fine dimples and shear lines, indicative of severe plastic deformation and enhanced ductility at elevated temperatures.
Figure 9 illustrates the fractography and microstructure of the welded AA5052-H36 at room temperature and 300°C. The observed features are like those of AA6061-T6, with some distinct differences. Figure 9(a) shows the macrostructure of the welded material after fracture at room temperature and 300°C. Unlike AA6061-T6, the fracture for AA5052-H36 occurs consistently at HAZ. The microstructure in Figure 9(b) reveals finer grains in the welded area compared to the base material, indicating considerable grain refinement due to the welding process. Figure 9(c) and (d) show the low and high magnification images of the fractured surface at room temperature. The SEM image in Figure 9(c) demonstrates that the welded AA5052-H36 alloy at room temperature predominantly undergoes ductile fracture with significant plastic deformation. The presence of extensive dimples and microvoid coalescence indicates that the material can absorb considerable energy before fracturing, which is a hallmark of ductile behavior. The porous coarsening regions further support the observation of considerable plastic deformation. The mixed-mode fracture features, with both ductile dimples and flat, cleavage-like regions, suggest a complex fracture mechanism where the material initially deforms plastically but also experiences brittle failure in certain areas. This combination of fracture modes indicates that while the material is generally ductile (with slight brittle fracture features), there are localized regions where brittleness can occur, potentially due to microstructural heterogeneities or stress concentrators. The microstructural stability observed in the fracture surface implies that the welding process has not substantially compromised the material’s integrity. The finer grain structures in the welded area help maintain the material’s ductility and toughness, making AA5052-H36 a suitable candidate for applications requiring both high strength and ductility at ambient temperatures. The SEM image in Figure 9(d) shows that the welded AA5052-H36 alloy at room temperature exhibits a highly ductile fracture mode. The fine dimple structure and coarse, porous areas indicate that the material absorbed considerable energy during deformation. The presence of shear lips further supports the observation of ductile shear failure. The SEM images in Figure 9(e) and (f) demonstrate that the welded AA5052-H36 alloy at 300°C exhibits a predominantly ductile fracture mode (in the mixed mode fracture). The low magnification image (Figure 9(e)) highlights porous coarsening and cleavage facets, indicating a mixed-mode fracture with both ductile and brittle features. The high magnification image (Figure 9(f)) reveals a fine dimpled structure and shear lips, confirming the material’s enhanced ductility at elevated temperatures.
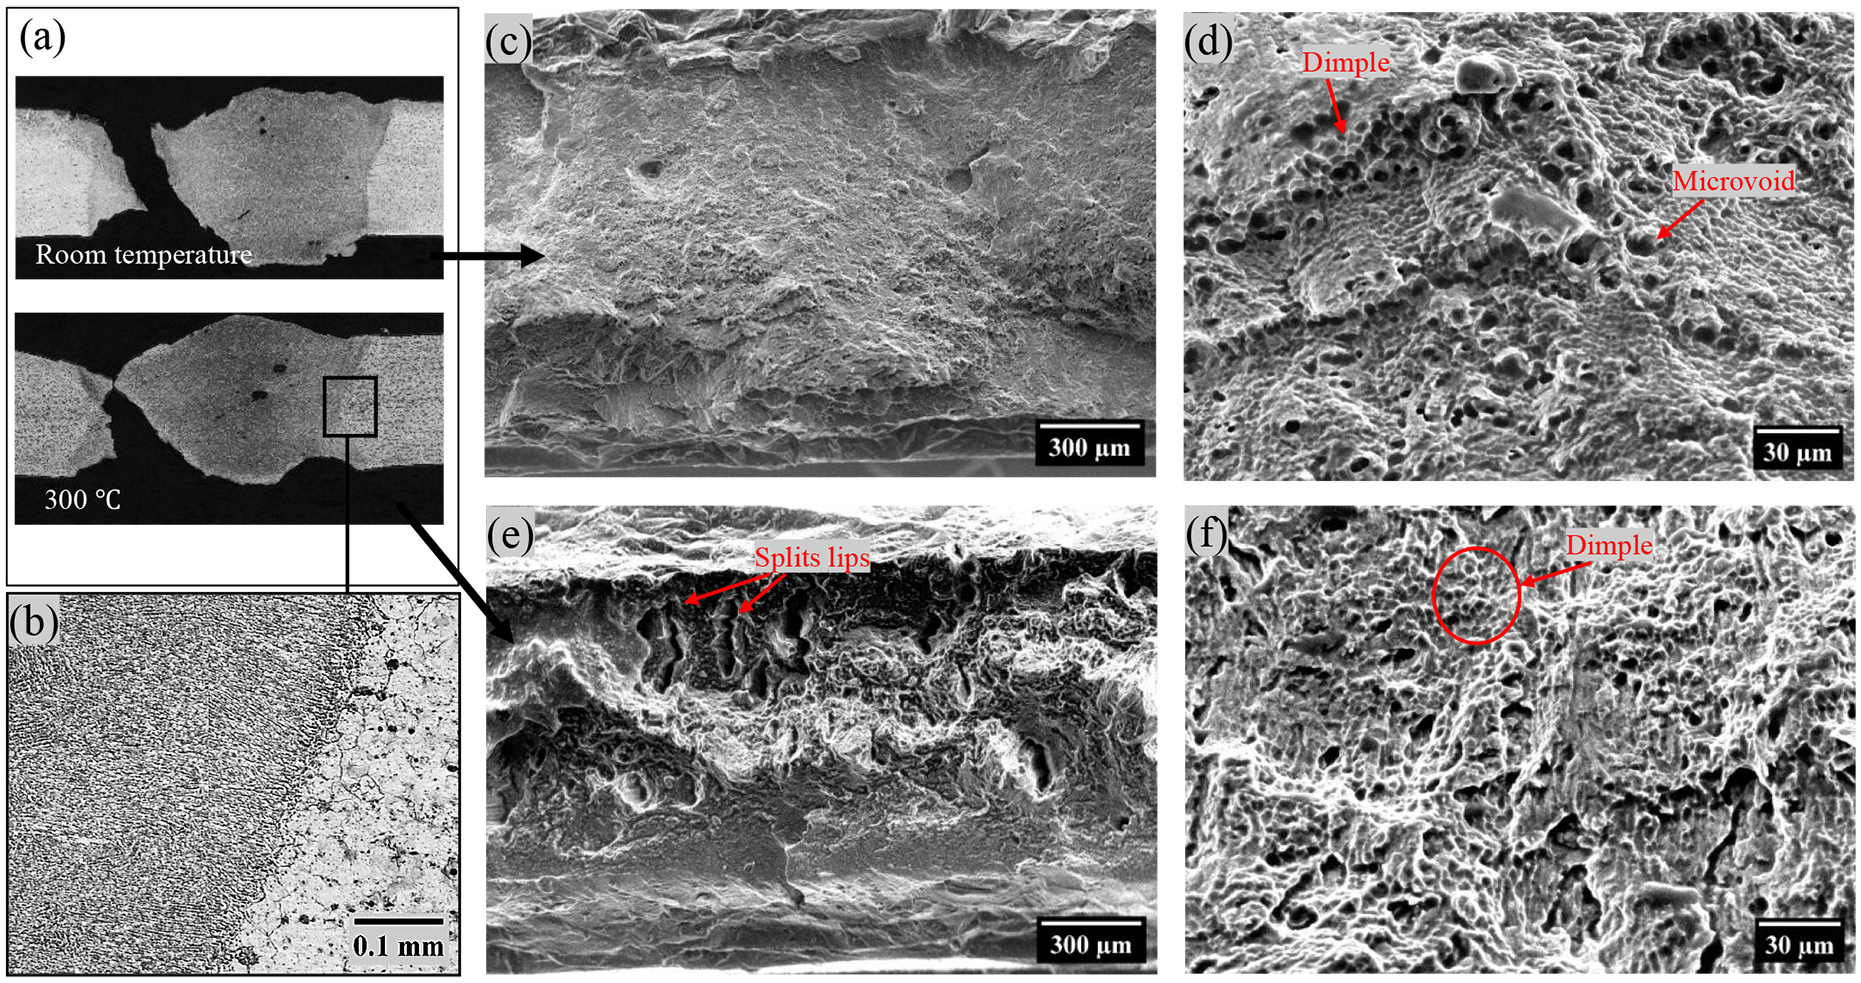
Optical microscopy image of AA5052-H36: (a) macrostructure, (b) microstructure, and SEM fractographic image at (c) low magnification at room temperature, (d) high magnification at room temperature, (e) low magnification at 300°C, and (f) high magnification at 300°C.
The comparison between the AA5052-H36 and AA6061-T6 alloys shows that, for AA5052-H36, the fracture consistently occurs in the HAZ and the welded area exhibits finer grain structures. Additionally, the ductile fracture features at both room temperature and 300°C indicate that AA5052-H36 maintains its ductility under varying thermal conditions, making it a robust candidate for applications requiring thermal and mechanical resilience.
Figure 10 compares the energy absorption behavior of two welded aluminum alloys. The graph clearly indicates that AA5052-H36 demonstrates superior energy absorption capabilities, ranging from approximately 9 to 13 J at 0.01 s−1 and 7–11 J at 0.1 s−1. In contrast, AA6061-T6 shows significantly lower energy absorption, approximately 2.5–3 J across the tested strain rates, which is roughly 3–4 times less than that of AA5052-H36. The higher energy absorption in AA5052-H36 is evident in the fracture surface analysis (Figure 9(d)), where the material at room temperature exhibits large, deep dimples averaging around 12 µm in size. These deep dimples are indicative of significant plastic deformation and contribute to higher energy absorption by dissipating the applied strain over a larger area. Conversely, in AA6061-T6, as seen in Figure 8(d), the fracture surface at room temperature shows a mix of smaller dimples and flat, shiny areas (indicative of clustered shear). The smaller dimples and flat areas in AA6061-T6 suggest a less efficient energy absorption mechanism, where localized deformation occurs without extensive plastic flow, leading to lower overall energy dissipation.
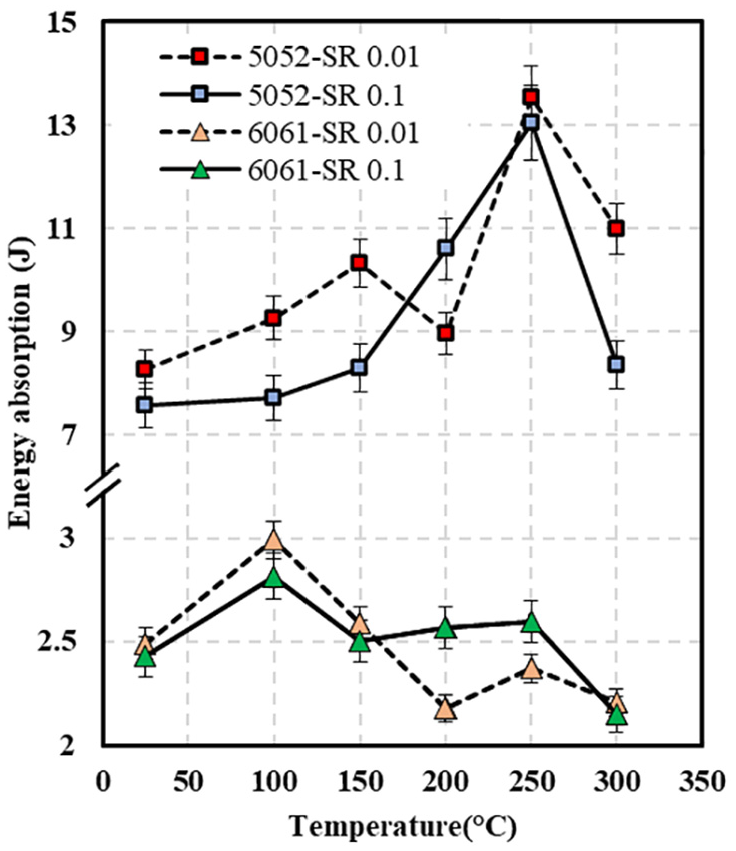
Energy absorbed before fracture in AA 5052-H36 and AA 6061-T6 at different strain rates and temperatures.
Both materials exhibit peaks in energy absorption at specific temperatures AA5052-H36 at 250°C and AA6061-T6 at both 100°C and 250°C. For AA6061-T6, the initial peak at 100°C is followed by a reduction in energy absorption due to the dissolution of
Microhardness
Figure 11 shows the microhardness profile of the welded materials. The microhardness of the base material is calculated at a single point and shown as a reference with the dashed line.
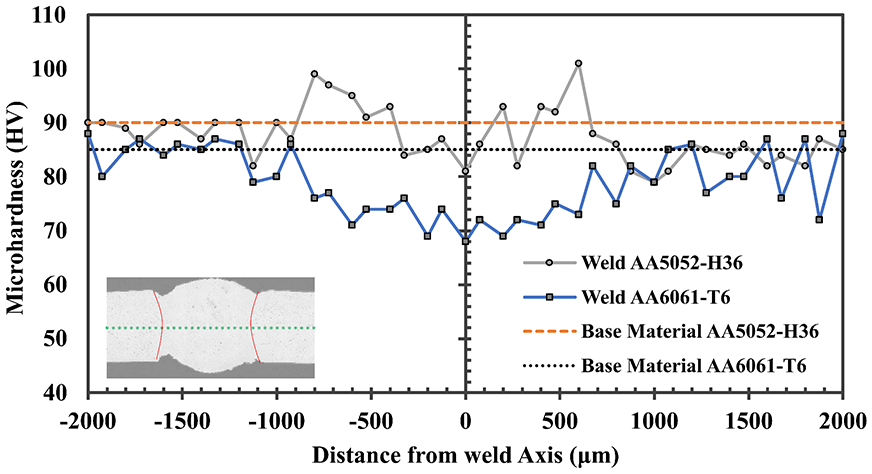
Microhardness profile of the welded materials.
For the welded AA6061-T6, the microhardness profile shows a notable reduction compared to the base material. Specifically, the microhardness of the base AA6061-T6 is 85 HV, whereas the microhardness in the welded area drops to 68 HV, representing a reduction of approximately 20%. This reduction is primarily attributed to magnesium evaporation in the weld zone, a phenomenon extensively reported in the literature and corroborated by the authors’ previous work.25–29 The loss of magnesium leads to a decrease in the volume fraction of Mg2Si precipitates, which are crucial for the precipitation hardening of AA6061-T6. Additionally, grain coarsening during welding further contributes to the decrease in hardness which could be observed in Figure 8(c).
In contrast, AA5052-H36, a non-heat-treatable alloy, does not rely on precipitation hardening for its strength. The microhardness profile of the welded AA5052-H36 shows an increase in microhardness value in FZ up to 102 HV, compared to 90 HV for the base material, which represents approximately a 13% increase. The observed increase in microhardness can be attributed to grain size reduction, as seen in Figure 9(b). The finer grain structure in the welded area enhances the material’s hardness through the Hall-Petch effect, where smaller grains result in higher strength. 30 However, the increase in microhardness is not consistent across the weld. In the HAZ, there is a noticeable reduction in hardness. This localized decrease is likely due to thermal effects that partially soften the material. Conversely, in the middle of the weld, the microhardness reaches values comparable to the base material, indicating effective grain refinement and retention of mechanical properties.
Conclusion
This study analyzed the mechanical properties of AA5052-H36 and AA6061-T6 aluminum alloys, which are widely used in the automotive industry, under high-temperature tensile tests to evaluate their behavior and compare them to their respective base materials. The mechanical properties of AA5052-H36 demonstrated superior UTS, fracture strain and absorbed energy before fracture compared to AA6061-T6.
The effects of strain rate on the mechanical properties were found to be minimal, with variations remaining within the error range of the testing. In contrast, temperature was observed to have a significant influence on material behavior, highlighting its importance as the primary factor in industrial applications. Therefore, temperature is considered the key parameter, with strain rate variations not being of major concern.
Under high-temperature tensile testing, ranging from 150°C to 300°C, AA5052-H36 consistently exhibited similar UTS and elongation to those of the base material. The UTS for both the base and welded material decreased to around 108 MPa, and the elongation increased to 0.37 mm/mm at 300°C. Conversely, AA6061-T6 exhibited lower UTS and elongation at lower temperatures, ranging from 25°C to 150°C, compared to the base material. As the temperature increased to 250°C–300°C, the UTS of AA6061-T6 approached that of the base material. However, the elongation remained significantly lower, around 0.07 mm/mm, compared to 0.32 mm/mm for the base material.
The microhardness profile further elucidated the differences between the two alloys. For AA5052-H36, the microhardness increased by around 13% in the FZ, suggesting enhanced grain refinement and stability post-welding. In contrast, AA6061-T6 showed a reduction in microhardness around 20%, primarily due to magnesium evaporation and the consequent reduction in precipitation hardening, which is crucial for its strength. This reduction in microhardness correlated with the observed decrease in mechanical performance at higher temperatures.
Fracture analysis revealed that both materials exhibited more ductile fracture characteristics, especially at temperatures above 250°C, where there was a significant reduction in energy absorption. This was accompanied by evidence of creep-induced fracture, indicating that temperatures above 250°C should be avoided in high-temperature tensile tests.
While the regression models provide valuable insights within the tested temperature and strain rate ranges, their applicability outside these conditions is limited. Future studies may explore a wider range of conditions or incorporate more complex models to account for non-linearities and variable interactions that might be present under different testing scenarios.
In summary, for high-temperature applications and forming processes, AA5052-H36 demonstrates better mechanical properties compared to AA6061-T6. The consistent performance of AA5052-H36 under thermal and mechanical stress, reflected in both its tensile behavior and microhardness profile, makes it a more reliable choice for high-temperature and welding-intensive applications. These findings provide essential insights for selecting suitable materials in the automotive industry, ensuring better performance and durability under demanding conditions.
Footnotes
Abbreviations
AA Aluminum alloy
Al Aluminum
ANOVA Analysis of variance
Cr Chromium
Cu Copper
CW Continuous wave
DSC Differential scanning calorimetry
EDS Energy dispersive spectroscopy
Fe Iron
FZ Fusion zone
GP Guinier-preston
HAZ Heat-affected Zone
Mg Magnesium
Mn Manganese
SEM Scanning electron microscopy
Si Silicon
SR Strain rate
UTS Ultimate tensile strength
Zn Zinc
Declaration of conflicting interests
The author(s) declared no potential conflicts of interest with respect to the research, authorship, and/or publication of this article.
Funding
The author(s) received no financial support for the research, authorship, and/or publication of this article.