
Abstract
In recent years, the demand for force feedback with high precision, size miniaturization and operation simplicity in many fields, such as surgical robot, unmanned aerial vehicle, flexible manipulator, and etc., has become increasingly prominent. In this paper, a miniature columnar six-dimensional force/moment sensor is proposed for the suggestion of a method of miniature sensor design and analysis. A novel design scheme for the column module is proposed for the elastomer structure of the sensor, and the external size of the sensor is greatly reduced on the basis of existing researches, which can effectively make it an important part of the final integrated system of some small equipment that require force feedback. Besides, the sensor with the concave hexagonal structured columns breaks through the limitations of layered sensors, and has self-decoupling performance, which avoids cumbersome decoupling algorithms and improves the system response speed. In addition, based on finite element modeling and simulation, the performance study and design optimization of the elastomer are carried out to improve the sensitivity of the sensor. By experimental verification, the sensor designed in this study can achieve the force feedback range of ±5N, the moment feedback range of ±10Nmm, and the coupling output error is less than 0.9%.
Introduction
In recent years, various engineering industries have been pursuing smaller device sizes, and the matching sensor size needs to be correspondingly miniaturized. At present, the smallest size six-dimensional force/torque sensor that has been industrialized is the Nano 17 sensor of ATI® in the United States, which can be applied to six-dimensional force measurement in a small space, while the external size is only 17 (height) × 15 (outer diameter) mm, but for flexible robot manipulators with diameters less than 10 mm, 1 the sensor size is still difficult to meet the integration requirements. The cylindrical pressure sensor developed by the German company HELM™ can reach minimum size of 3.77 (height) × 2.54 (outer diameter) mm, but it can only measure the pressure in one dimension, and the user cannot obtain the information about force and moment in other dimensions. At present, the common means for the force feedback function required by the continuum robot manipulator are: integrating sensors at the end of the continuum,2,3 designing feedback devices at the operation platform, 4 remote multi-parameter estimation, 5 etc. For the existing flexible robots applied in complex and narrow spaces, their outer diameter size is often less than 10 mm, and it is difficult for existing sensors to meet the dual requirements of compact size and multi-dimensional measurement at the same time. 6
At present, the multi-dimensional force/moment sensor that is commonly used in the field of intelligent robots has been widely studied by the academe because of its characteristics of diverse configurations,7,8 compact structure,9–11 and easy operation.12–14 In recent years, the research on multi-dimensional force sensors has mainly focused on the design of elastomer configuration, optimization of perceptual force principle, and multi-dimensional force feedback decoupling algorithms. For layered-structure sensors, Wu and Cai 15 proposed a self-decoupling two-layer six-dimensional force/moment sensor for measuring the interaction force between surgical tools and soft tissues. Li et al. 16 proposed a surface acoustic torque sensor based on multilayer structure, which has the advantages of fast response speed and high characteristic frequency compared with traditional quartz piezoelectric sensor. Besides, Hu et al. 17 designed a flexible six-dimensional force sensor with tenon-and-mortise interlocking structures. In order to solve the problem of high cost and manufacture difficulty of traditional multi-dimensional sensor, Pérez Ubeda et al. 18 proposed a low-cost torque sensor, which is mainly developed according to the measurement principle of the strain gauge. In addition to the low manufacturing price, the design principle is also very simple. Khan et al. 19 designed a square tangent torque sensor characterized by high linearity, symmetry, and high scalability over size and measurement range. In addition, Noh et al. 20 proposed a multi-dimensional torque sensor based on a simple beam, which has the advantages of low power consumption, low noise, ability to embed different mechanical structures, miniaturization, and can be integrated at the end of MIS robots to realize the applications of force feedback. For the cylindrical miniature force sensor, the existing researches are mainly based on the Bragg grating principle. Lai et al. 21 proposed a three-dimensional force sensor for surgical robots based on fiber Bragg grating (FBG), which can be seamlessly integrated and has high accuracy, but the manufacture cost is high and the manufacture process is complicated. Puangmali et al. 22 proposed a miniature triaxial force sensor for MIS palpation, which also has the disadvantages of manufacturing difficulties and complex principles. In addition, Lee et al. 23 proposed a kind of multidirectional cylindrical force sensor based on the piezoelectric effect, but it is difficult to meet size requirements. It is worth mentioning that as for the field of robot tactile perception, though flexible multidimensional-force sensor is not very mature yet, it is a very promising research area. For example, Qiu et al. 24 used flexible tactile, strain, and piezoelectric multimodal sensors in a biomimetic drosera capensis.
Based on researches above, it can be seen that the outer sizes of sensors are inevitably large, and the strain sensor’s elastomer configuration is mainly related to a cross beam and a multi-layer structure, which is mostly composed of a mass block in the geometric center and a beam connected to the outer ring. Inspired by the structure of mechanical metamaterials, 25 “structuring” the columns of columnar sensors to improve their mechanical properties is considered. At the same time, the outer diameter of the sensor is minimized to only 8mm to adapt to the limited integration space. Compared to conventional sensors, the sensor proposed has a pleasant micro size, which exceeds almost all existing commercial high-dimensional force sensors’ size. Besides, it can improve measurement accuracy of force/moment in tangential directions while ensuring accurate measurement of axial forces. In addition, it is difficult to achieve decoupling via hardware solutions. The sensor proposed in this paper has the function of self-decoupling, avoiding the time redundancy of subsequent data processing, greatly improving the efficiency of data processing.
Design and mechanical modeling
Elastomer structure and working Principle
Generally, the sensitivity of the sensor decreases as sensor miniaturizing, 21 but the force/moment sensor for minimally invasive surgical (MIS) robot, for example, has requirements of high accuracy and high measuring sensitivity, and its force/moment range needs to be determined by the standard of MIS procedure. 26 Because the multi-dimensional force/moment sensor involved in this study is ultimately integrated into the small equipment, and the content in this paper is mainly to offer a method to design a mini-sensor, so for convenience, the parameter requirements are referring to MIS process:
the maximum diameter of the sensor should be less than 10 mm1;
the force/moment measuring range should be greater than ±3 N 22 ;
the resolution should be less than 0.5 N. 27
The parameters of the sensor elastomer developed in this study are listed in Table 1.
Sensor elastomer parameters.
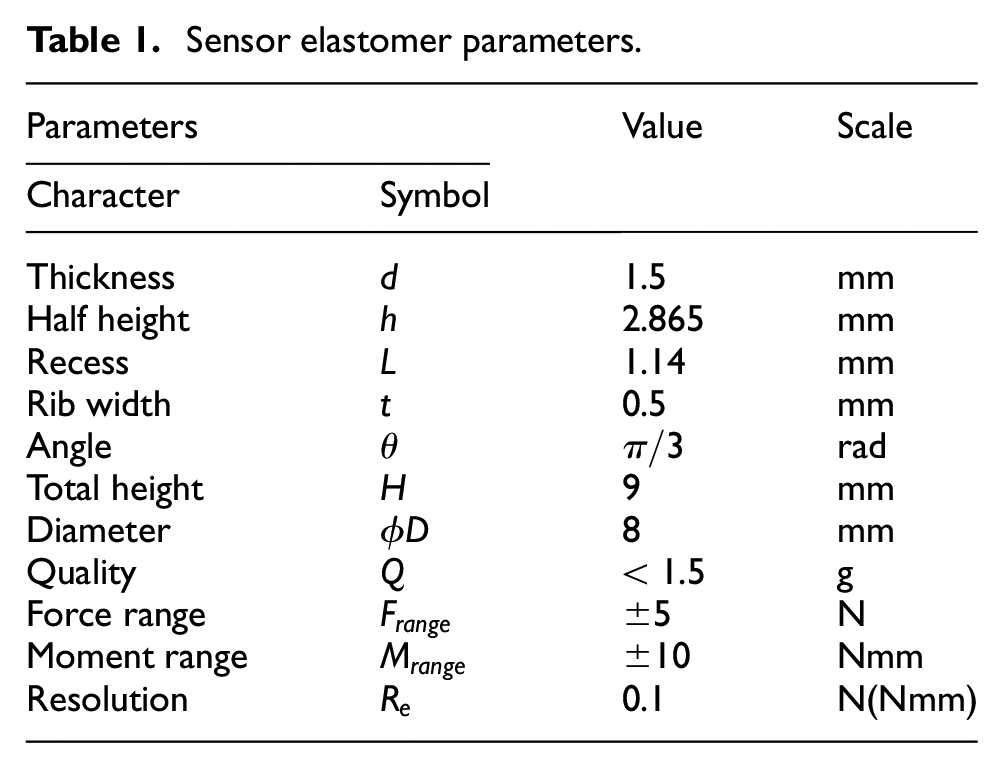
Figure 1 shows the design of the sensor elastomer structure and the local magnifications of the elastomer structure on the right. The elastomer has support columns with a concave hexagonal structure, and a rectangular area is hollowed out in the middle of the top and bottom flanges, mainly in order to pass through the traction line or others when actually applied in the intelligent equipment.
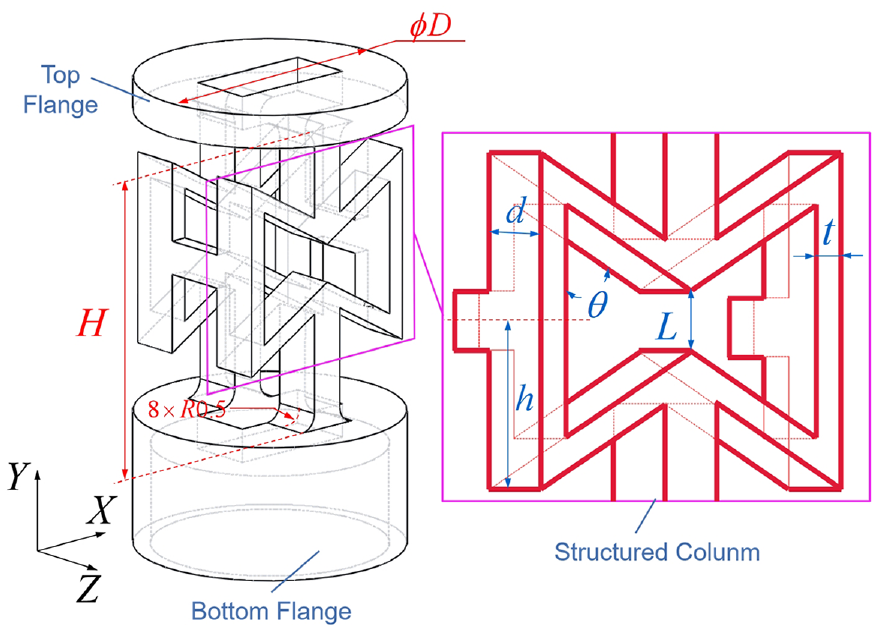
Concave hexagonal structured columnar six-dimensional force/moment sensor.
When the top flange of the elastomer is subjected to external force/moment, part of the structure will therefore be bent, twisted or other deformed, and the resistance of the strain gauge, which is effectively arranged and pasted on the structure, will change accordingly, resulting in a change in output voltage.
Axial principal strain analysis
Since the designed sensor elastomer has certain structural symmetry, it is easy to infer that when the sensor is subjected to the pressure of Y-axis direction shown in Figure 1, the deformation of the two columns is consistent, and the role of the beam between two columns can be ignored, so the theoretical analysis of a single column can be performed as follows.
In conjunction with the relevant literature,
25
it can be assumed that when the concave hexagonal structure of the column is only subjected to the uniform load
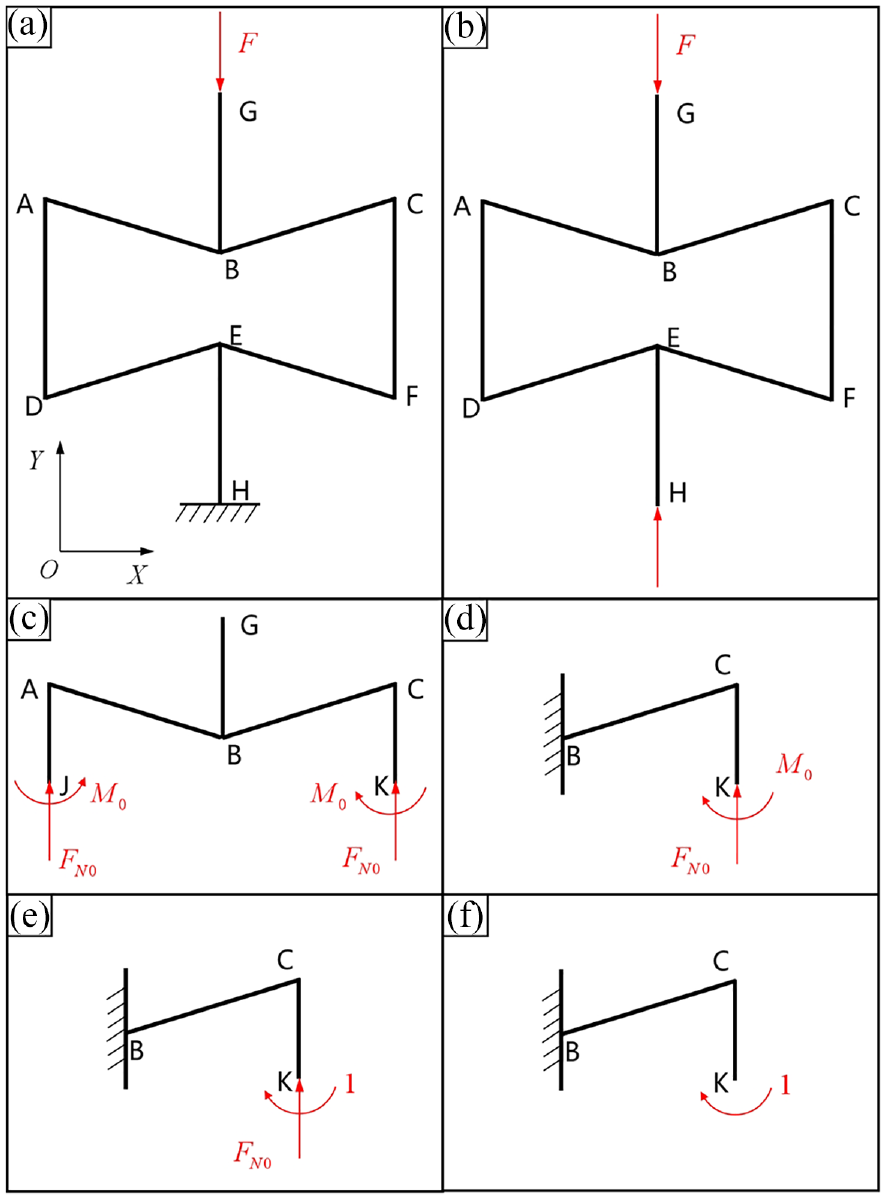
Schematic view of a concave hexagonal “structured” column with the applied axial force: (a) Simplified mechanical model, (b) stress of overall structure, (c) truncated model, (d) symmetrical one-sided force, (e) subject to force and unit moment, and (f) Subject only to unit moment.
Depending on the symmetry of the load, the shear forces on the sections of the J and K are zero, and only the ribs are subjected to axial forces

In (1),
In Figure 2(d), when only the load
where
Therefore, it can be obtained that
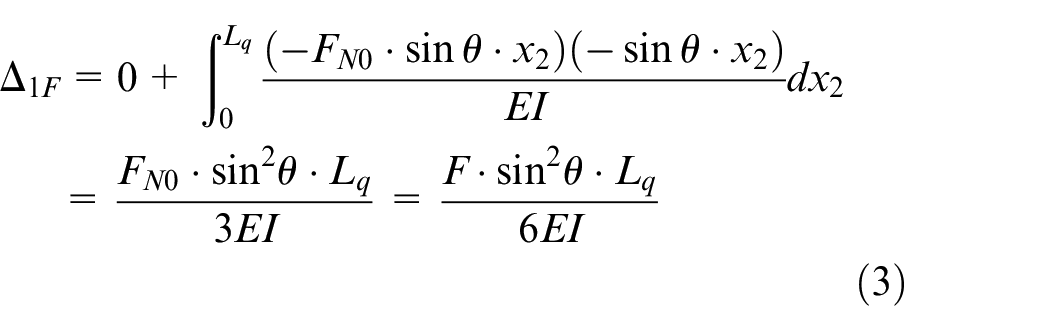
In (3),
Similarly, in Figure 2(f), when only the unit bending moment
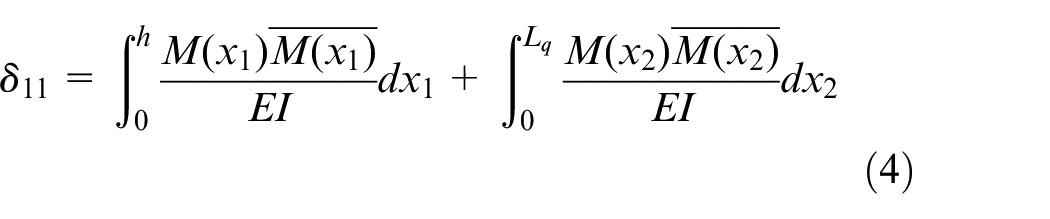
where
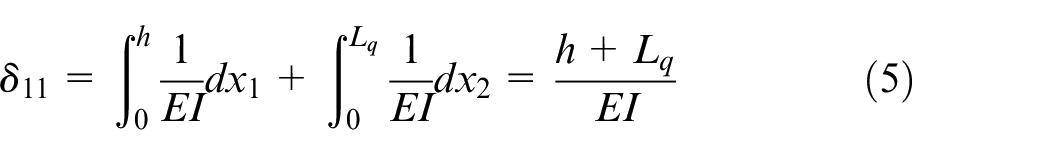
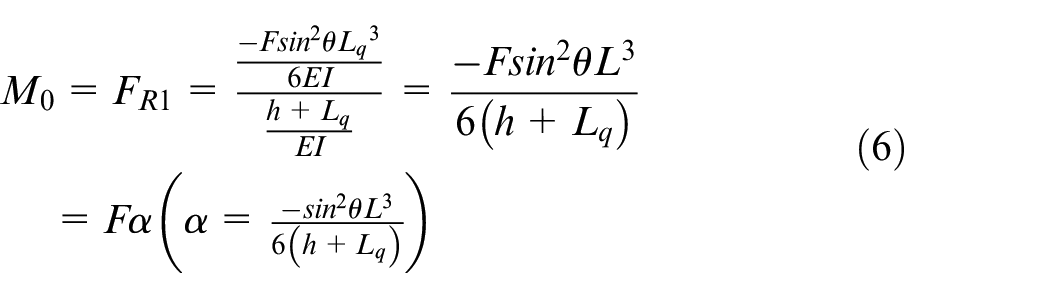
Substituting (3) and (5) into (1), so
The negative sign indicates that the direction is opposite to the assumed direction.
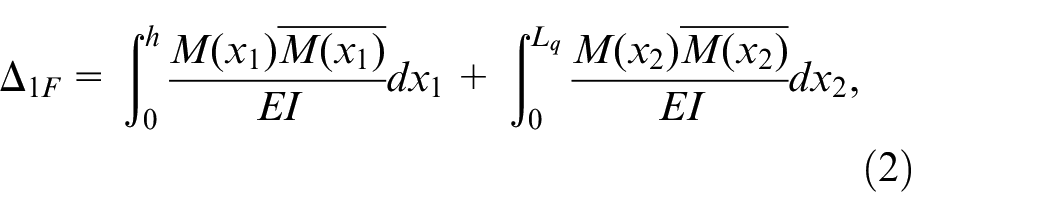
According to Karl’s theorem, it can be found that under the action of external loads in Y direction of the structure, the displacement deformation of the structure in the direction of Y axis is as follows:
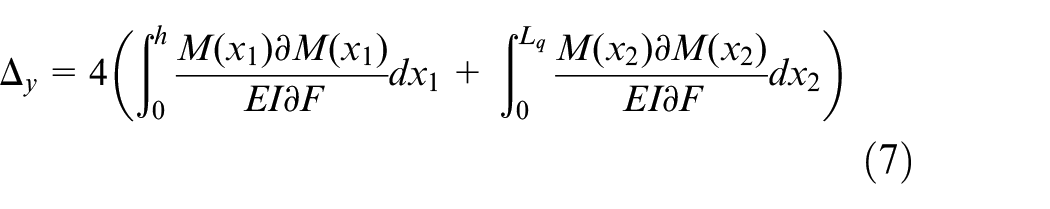
where
Substituting (6) into (7), obtained
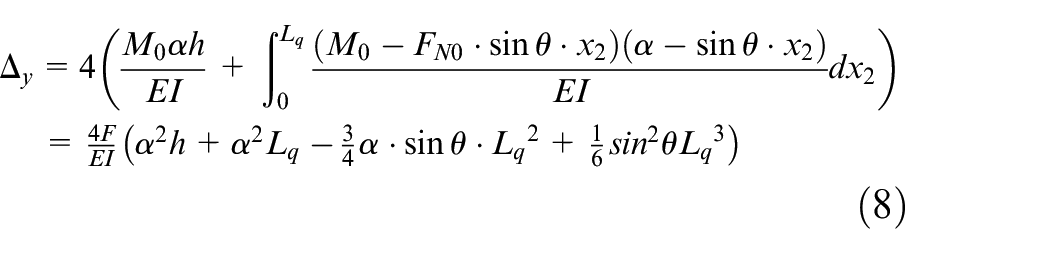
According to (8), the axial strain can be obtained as
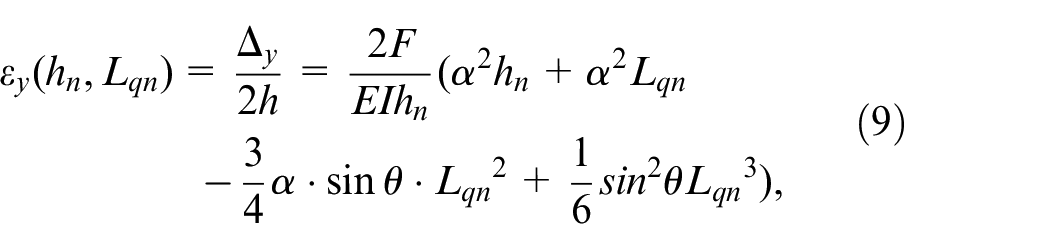
where
Tangential force and moment analysis
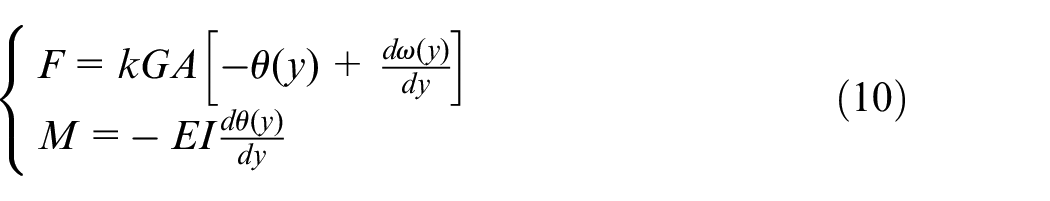
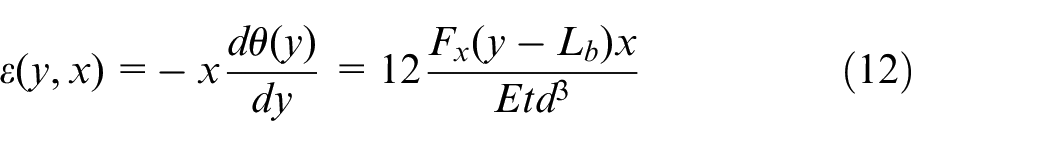
Considering the structural symmetry, when the sensor is subjected to the tangential forces of X axis and Z axis (Figure 1) separately (or when the moment applied around X axis and Z axis), the maximum stress and main deformation are concentrated on the short beam connected to the top and bottom flanges of internal recess of the structure. Because the vertical beam height span ratio is in the range of 1/3 to 3/4, the Timoshenko beam theory was used for analysis. Taking the beam MN (Figure 3(a)) as an example, the end M can be simplified to a fixed hinge support and the end N can be regarded as the cantilever end, and the mechanical model and simplified schematic can be obtained as Figure 3(b) and (c). Establish a coordinate xoy on the beam parallel to the reference coordinate. When the beam is bent in the xoy plane, the relationship between the shear force
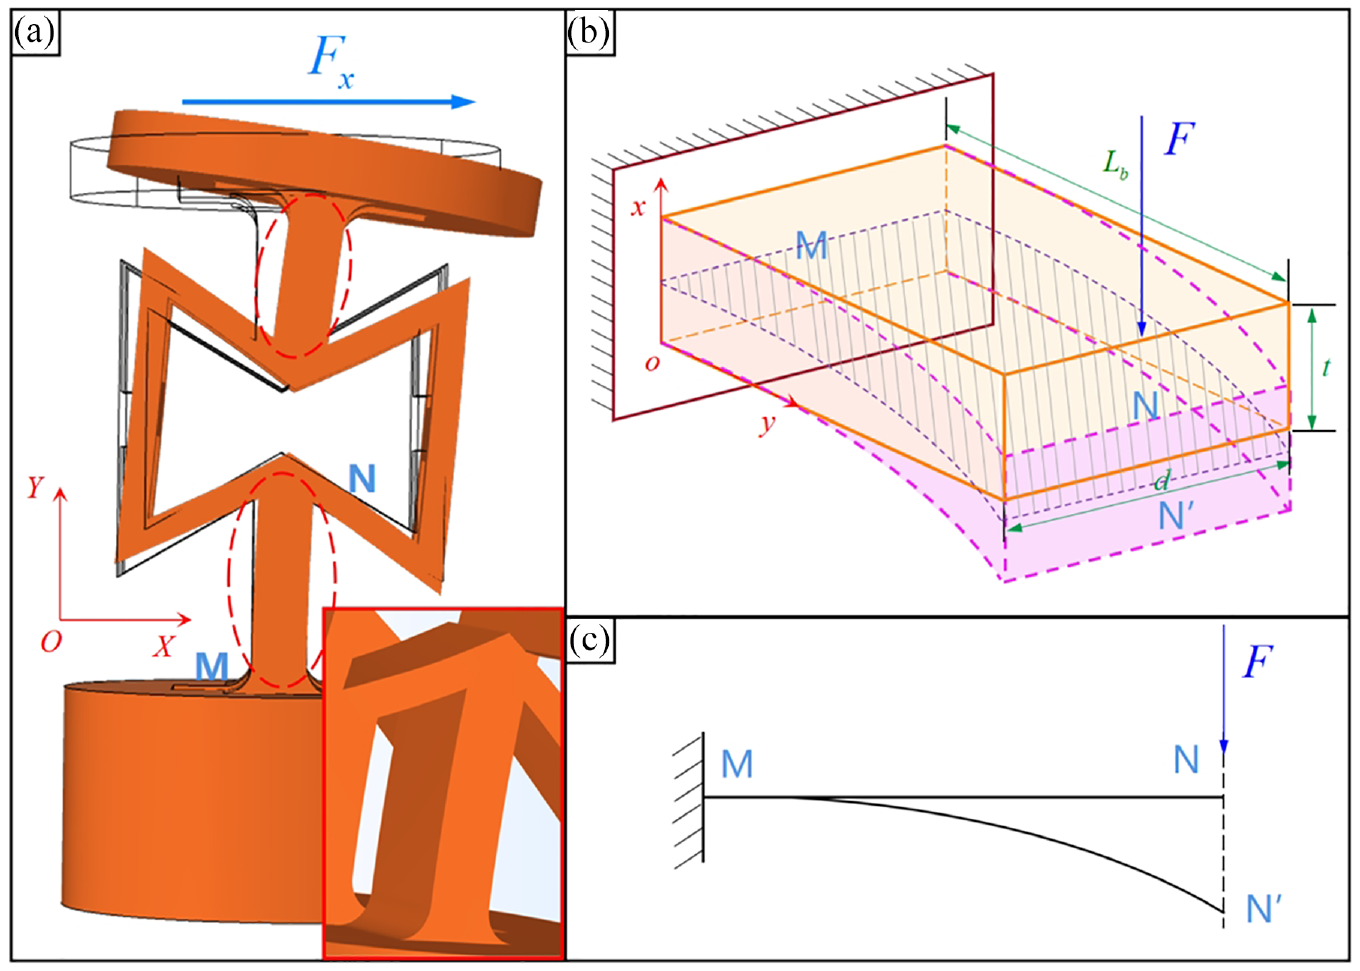
Tangential force diagram of a concave hexagonal “structured” column: (a) overall deformation, (b) bending of vertical beams, and (c) simplified diagram of beam bending.
According to the equilibrium equation (regardless of the transversely distributed loads on the beam), the controlling equation for the static bending is
where,
When the sensor is subjected to
Finite element simulation analysis
COMSOL was selected to analyze the characteristics of the model. The force/moment sensor elastomer model established in SOLIDWORKS is imported into the COMSOL platform and meshed, the relevant properties of the elastomer material are set in COMSOL according to Table 1, and the structure material is aluminum alloy. Suppose that when the sensor is subjected to external force/moment, the external force/moment is evenly distributed load acting on the top flange.
Stress distribution analysis
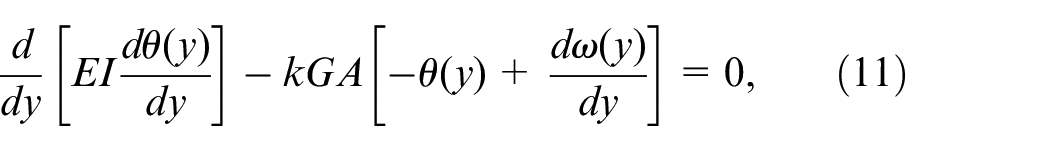
Figure 4 shows the deformation plot of the sensor elastomer designed in this paper when it is subjected to a six-dimensional force/moment (the deformation scale factor is relatively enlarged), the applied external force is 5 N, and the moment is 10 Nmm. The black outline represents the initial position of the elastomer before deformation. Different parts of the body are subjected to different values of stress and are distinguished by color, referring to the right color bar. It can be seen from the deformation plot that the foregoing theoretical analysis has a certain rationality for the boundary conditions of the elastomer under different loads. The simplification of the model structure is reasonable. And the maximum stress value can be seen to be far less than the yield strength of the material, so the sensor proposed meets the safety requirements when used.
Stress distribution subjected to force/moment: (a)
Strain distribution analysis
In order to maximize the sensitivity of the sensor, the strain gauge should theoretically be pasted at the boundary where the difference in line strain values is greatest. Therefore, the finite element simulation was done to find the positions out, and the maximum strain value has been marked on Figure 5.
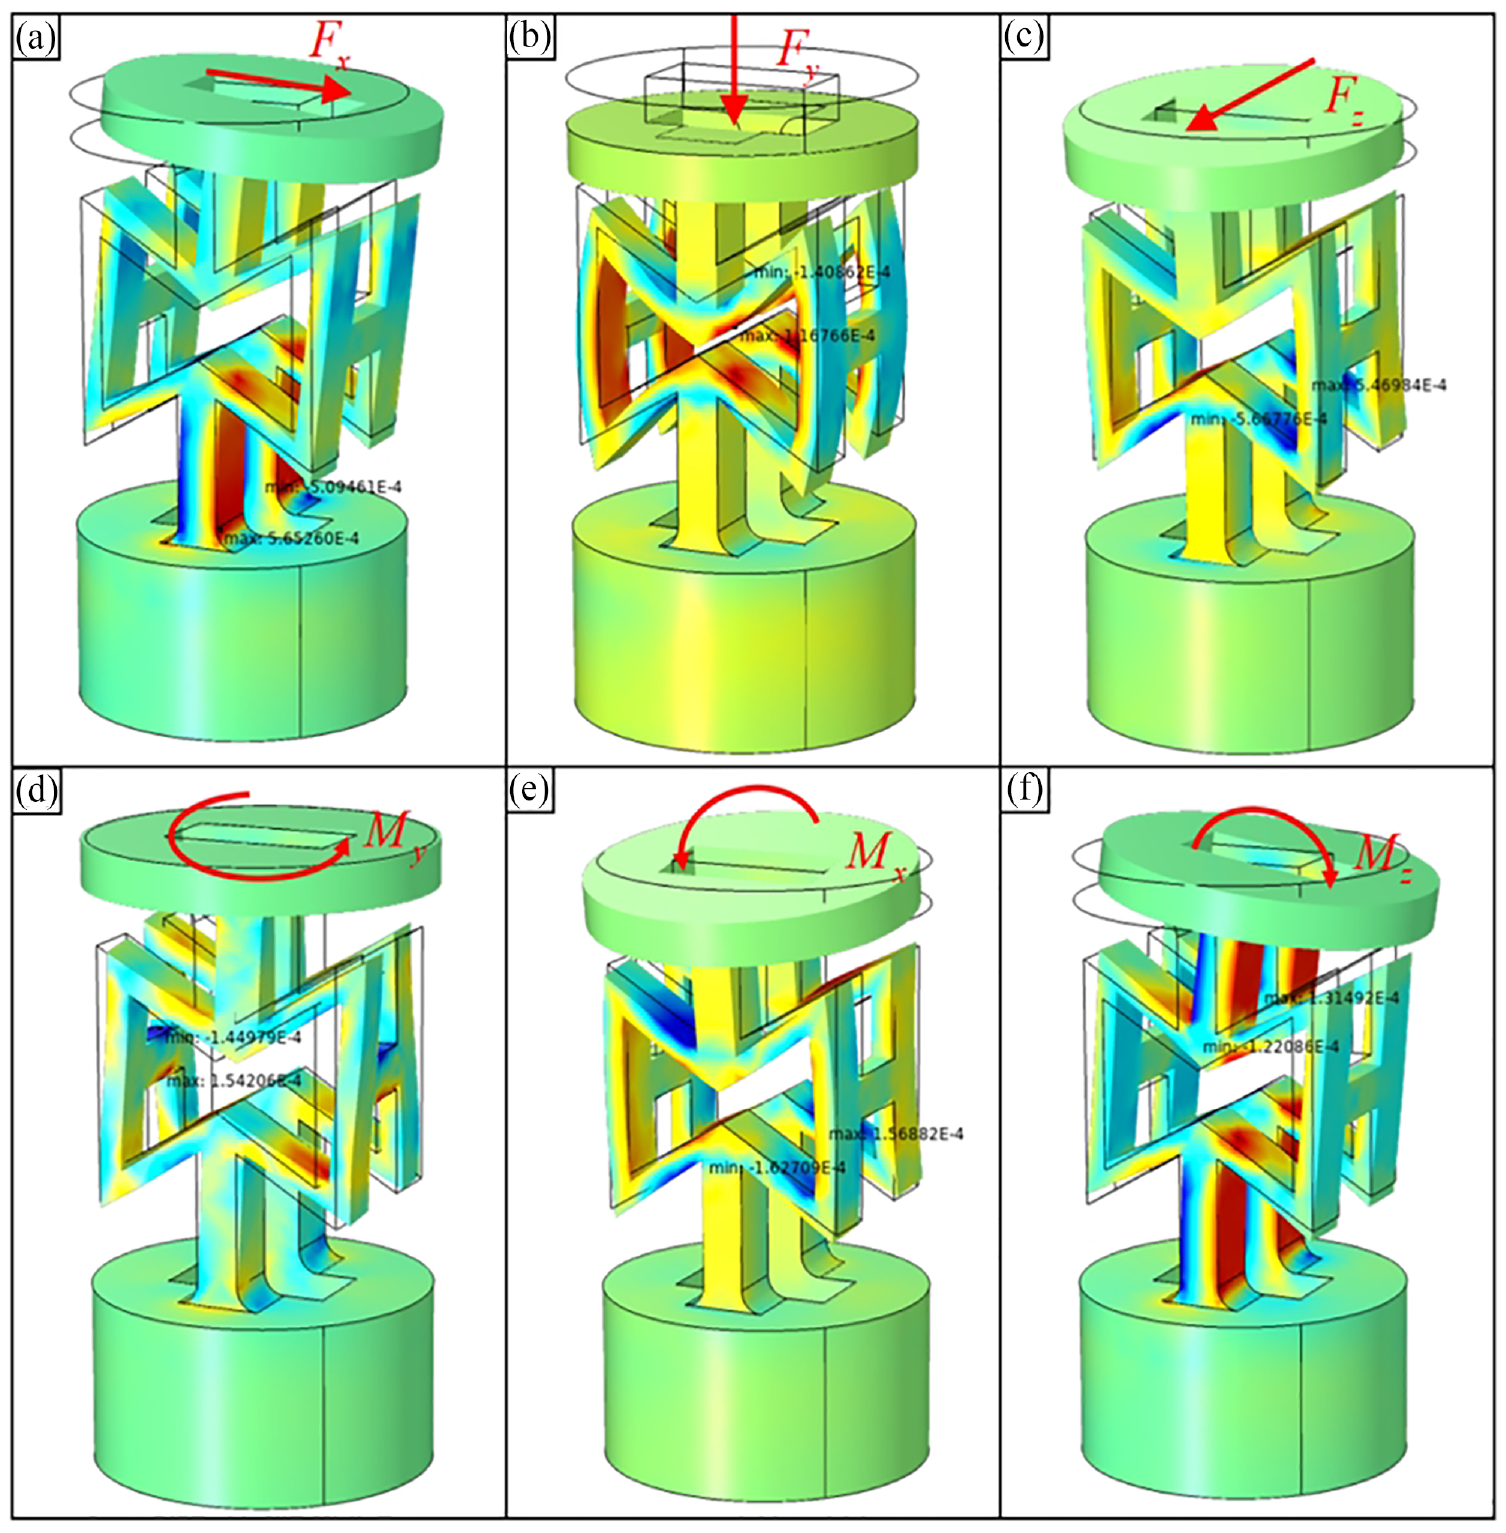
Strain distribution and the maximum strain subjected to: (a)
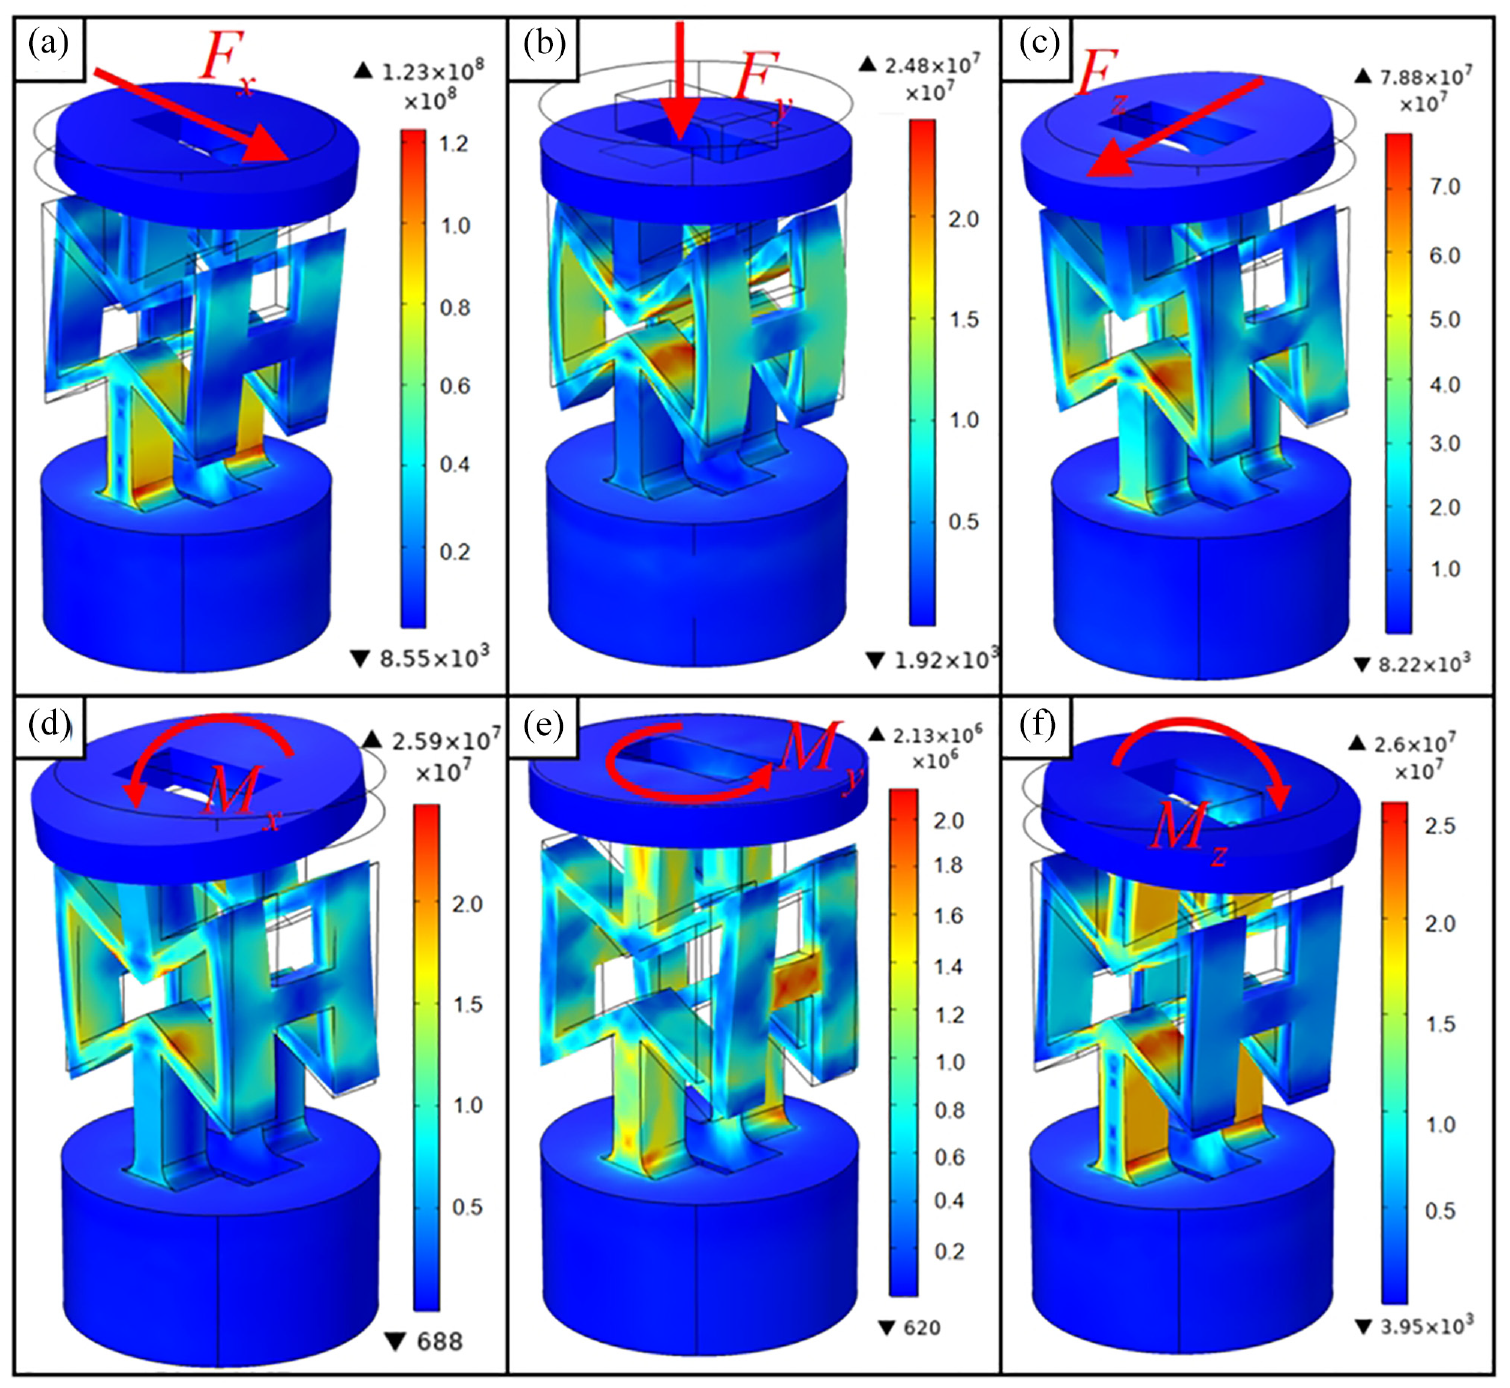
Taking the axial force and tangential force as examples, refer to (9) and (12), comparing the theoretical results in the last chapter with the simulation results, so the strain distribution curve can be obtained as Figure 6. According to Figure 6, it can be seen that the trend of the theoretical analysis and simulation results are basically consistent, so it can be proved that the analysis and implementation methods described in this paper are feasible and effective.
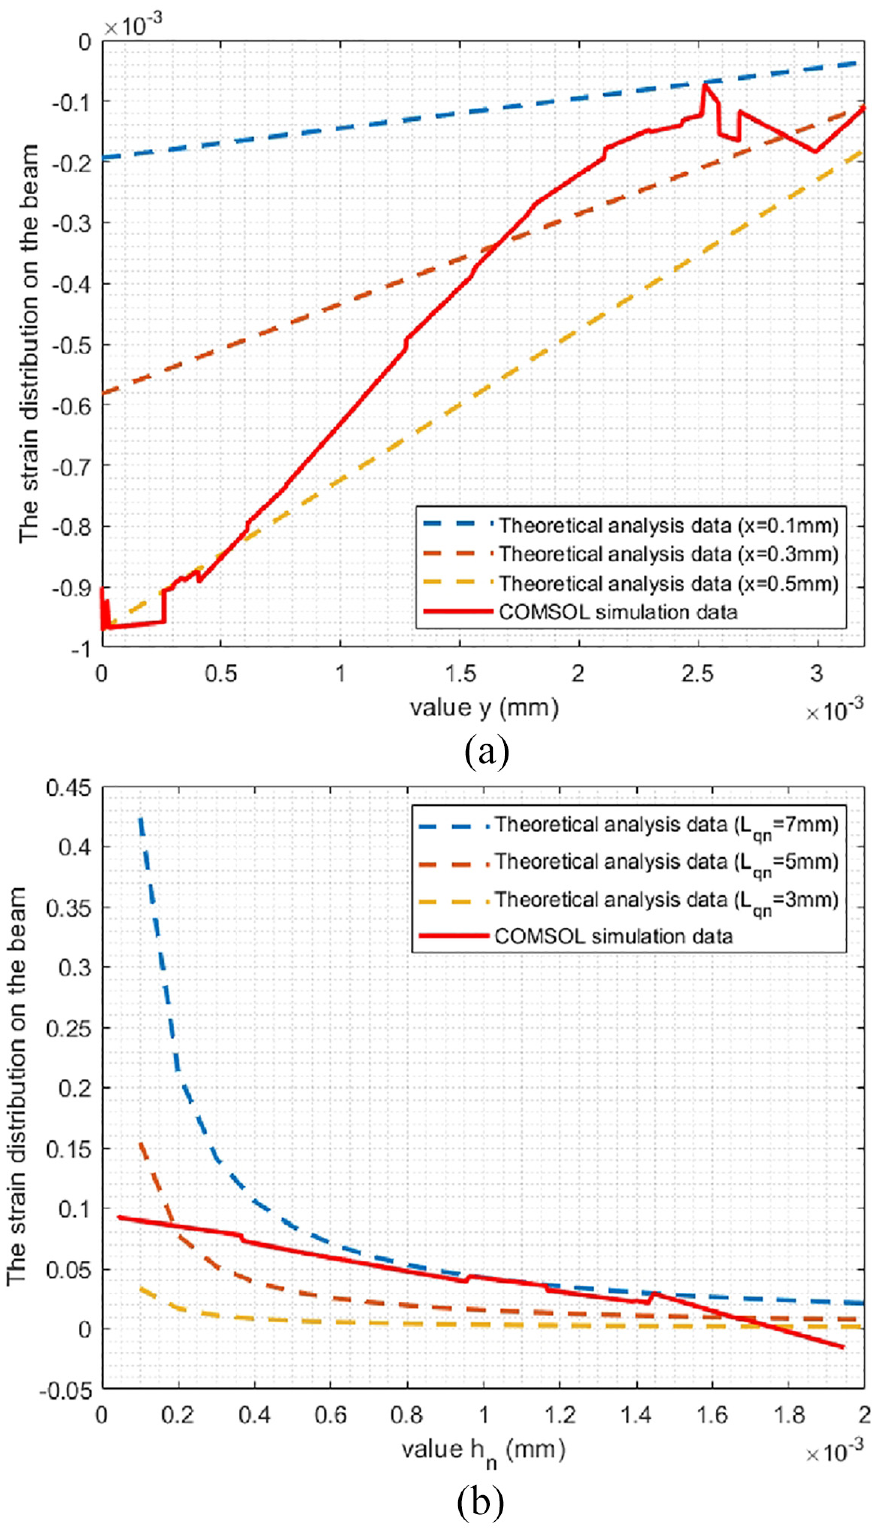
Comparison curve between theoretical data and simulation data of surface strain distribution of elastomer: (a) subjected to tangential force and (b) subjected to axial force.
Experimental validation and analysis
Strain gauge arrangement
According to Figure 5, the two columns of the sensor elastomer almost have the same strain distribution in each one under different loads, so the resistance strain gauges should be pasted at the positions with the most pronounced color transition of the strain spectra of the column (the analysis is based on the first principal strain). A total of 24 strain gauges are used, and each column is pasted with 12 strain gauges, and the placement position is shown in Figure 7(a), where the letters with subscripts in parentheses indicates that a strain gauge is also pasted on the back of a single column structure under that view. To obtain the exact strain value of the sensor, this study was conducted using the connection method of the Wheatstone full bridge, as shown in Figure 7(b).
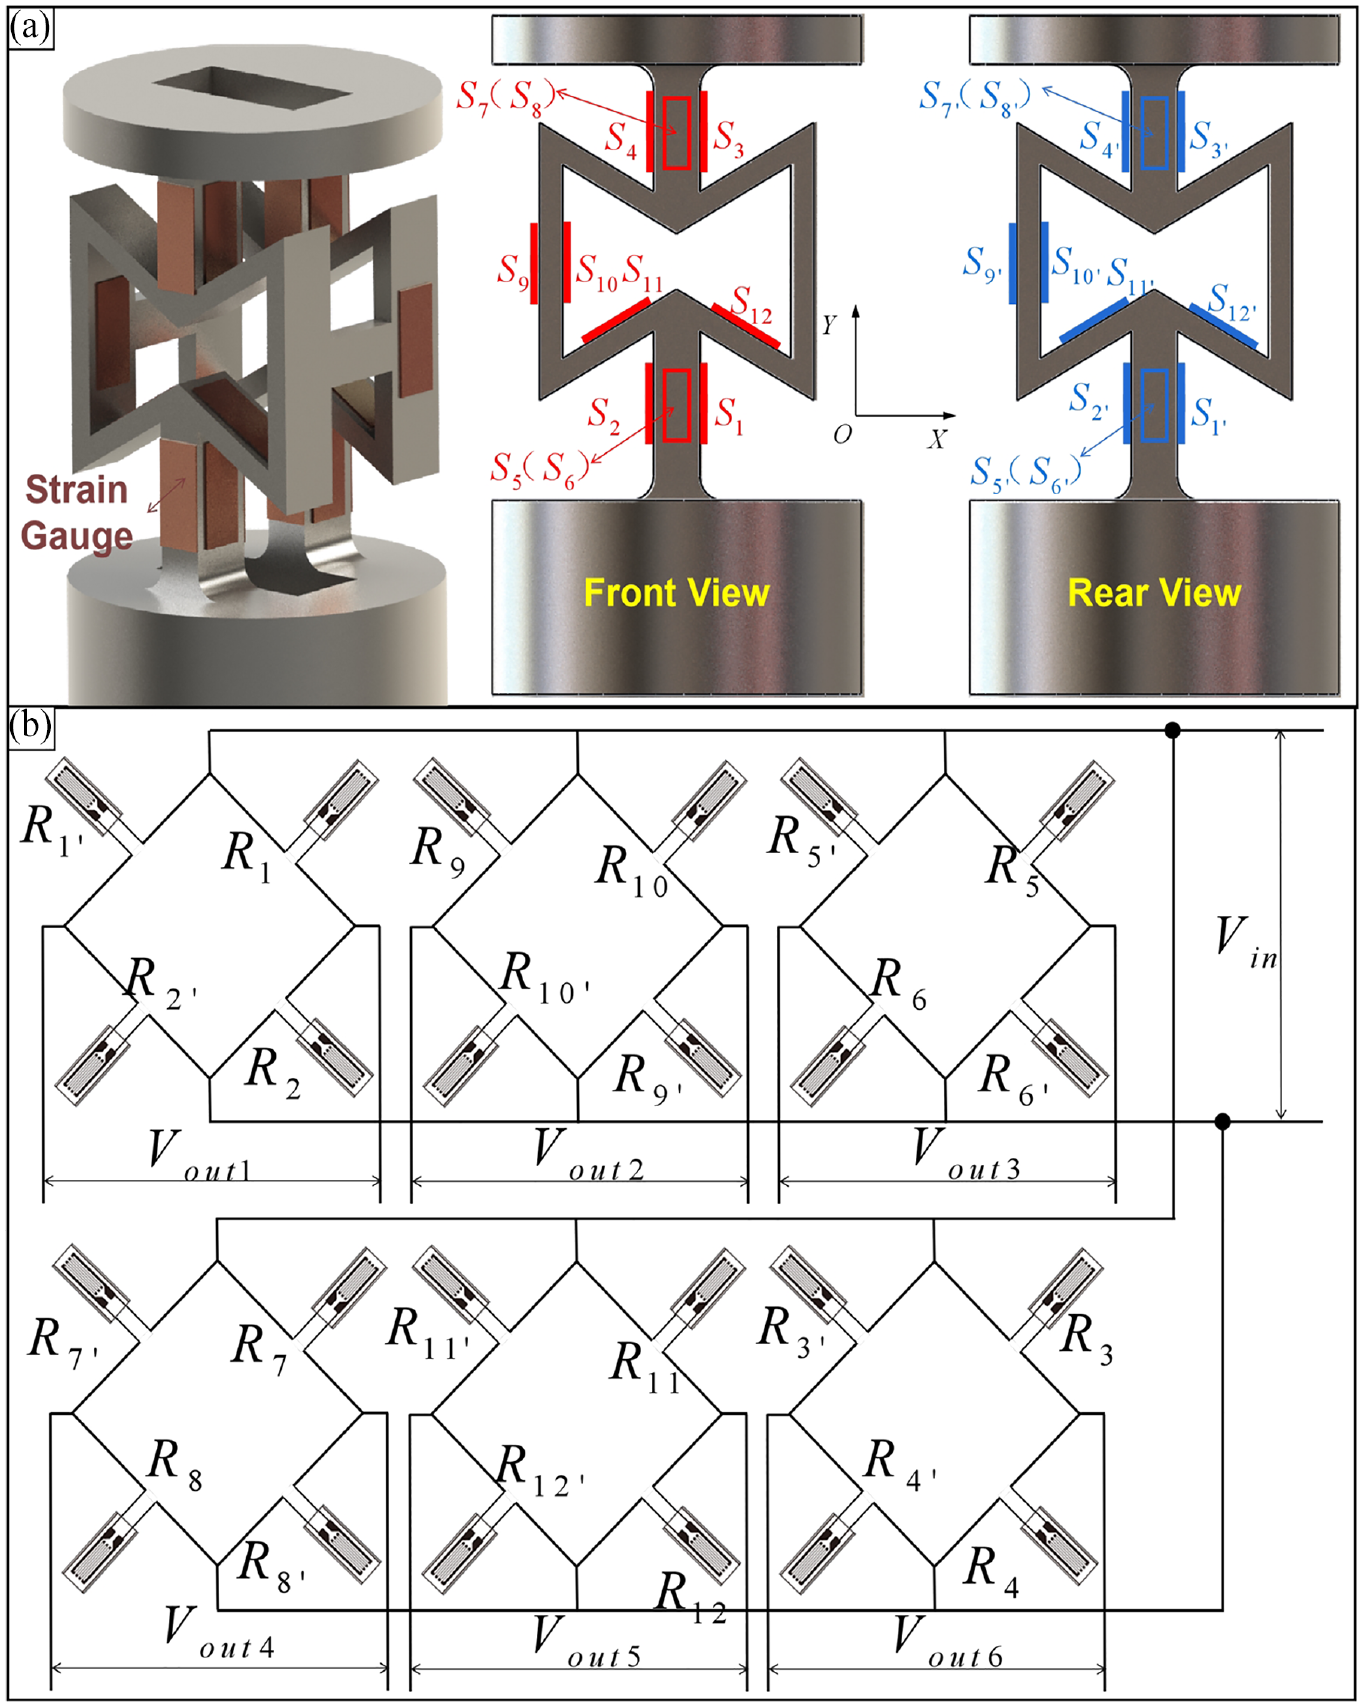
Strain gauge positions and circuit wiring: (a) the positions of gauges and (b) full bridge connection.
The strain gauges are connected by a Wheatstone full-bridge circuit, and every four strain gauges in Figure 7(a) form a full-bridge circuit for a total of six full-bridges. Since the resistance value of all strain gauges are equal, the output voltage can be expressed as
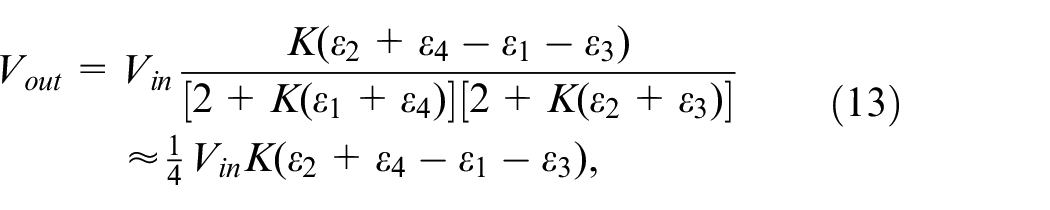
where
Calibration
Assuming that the forces/moments applied to the six-dimensional sensor proposed are defined as a matrix

Calibration is the process of applying a given load to measure the output voltage of the sensor and form the matrix

In the actual measuring process, the load matrix
In this study, the gauge arrangement refers to Figure 7(a).
During the simulation calibration process, according to the actual situation, the input voltage and sensitivity coefficient are set respectively as
The calibration process of the sensor is implemented by individual types of loads in different directions applying to the sensor, and calculating the calibration matrix
Using the COMSOL platform for simulation calibration, the load is added 10% each test at the 1/5 of full range, Table 2 lists some of these data of strain gauge 1 (1′)–12 (12′) for X axis direction loads
Simulation of the strain value under the action of a single external force
Similarly, the data under the action of other dimensional external forces/moments can be obtained by the same process above. Due to the paper space limitations, other tables will not be listed.
According to the data obtained from simulation calibration process, the curve diagram of six-dimensional force/moment and output voltage value of each bridge is shown in Figure 8. As can be seen from Figure 8, each output voltage is linearly related to the corresponding applied external load, and the slope of the output voltage fitting curve of the other bridges is small enough compared with the main one, so the sensor can be preliminarily self-decoupled. Because the results obtained from the simulation calibration are ideal linear, the ideal calibration matrix
Relationship between force/moment and output voltage of each bridge: (a)
It is worth pointing out that when the external moment
Based on the foregoing, we need to eliminate the dual-bridge output case when
Prototyping test of the sensor
Considering the small size and high accuracy requirements of the sensor designed in this study, it is difficult to obtain a high-precision model by 3D printing technology, so the manufacture process of machining combined with wire cutting is selected, and the actual elastomer is shown in Figure 9(b). Figure 9(a) is the size comparison of the elastomer and a normal-sized nib, which fully shows that the sensor is actively small.
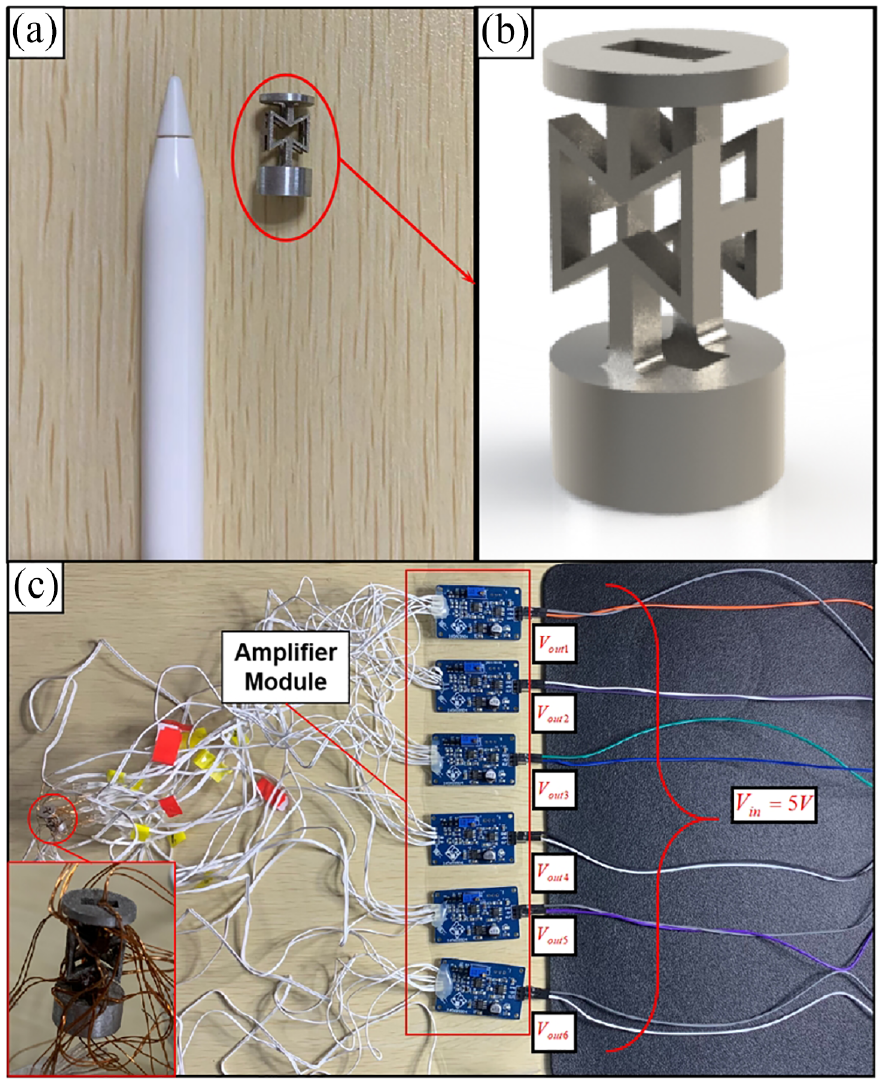
The prototyping of the elastomer and the actual connection circuit: (a) size of the elastomer (in red circle), (b) the enlarged view of the elastomer, and (c) the actual connection circuit.
To match the elastomer size, the strain gauge ZE120-05AA-A-Q30P1K was selected. Connect the strain gauge Wheatstone full-bridge circuit according to Figure 7(b) and connect a voltage amplification module at each bridge output to make the output value easier to observe and record. The actual connection circuit is shown in Figure 9(c).
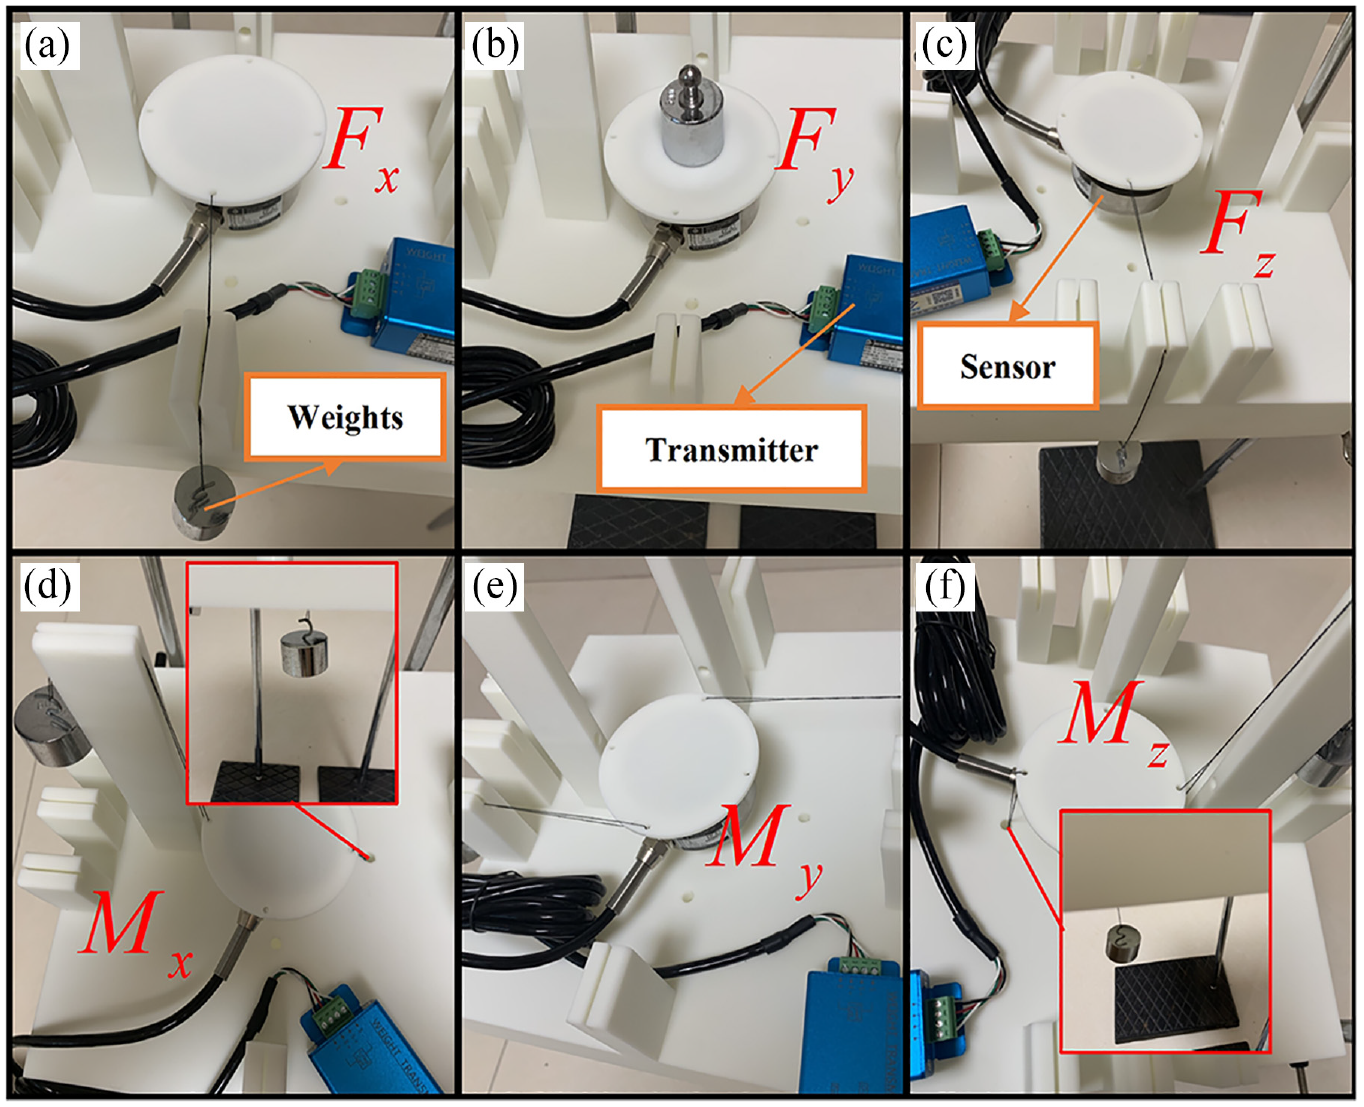
In the actual experimental test, in order to ensure the accuracy of the applied external force/moment value, the 3D printing resin technology is selected in this test to establish a six-dimensional force/moment sensor calibration platform for the measurement of the actual applied force/moment and output voltage. In addition, standard weights were selected as the calibration force source, and a wire rope was used to hang the weight. The scheme of the static force/moment calibration of each dimension of this experiment is shown in Figure 10(a) to (f). As an example, Figure 11(a) shows the operation diagram of the actual test with
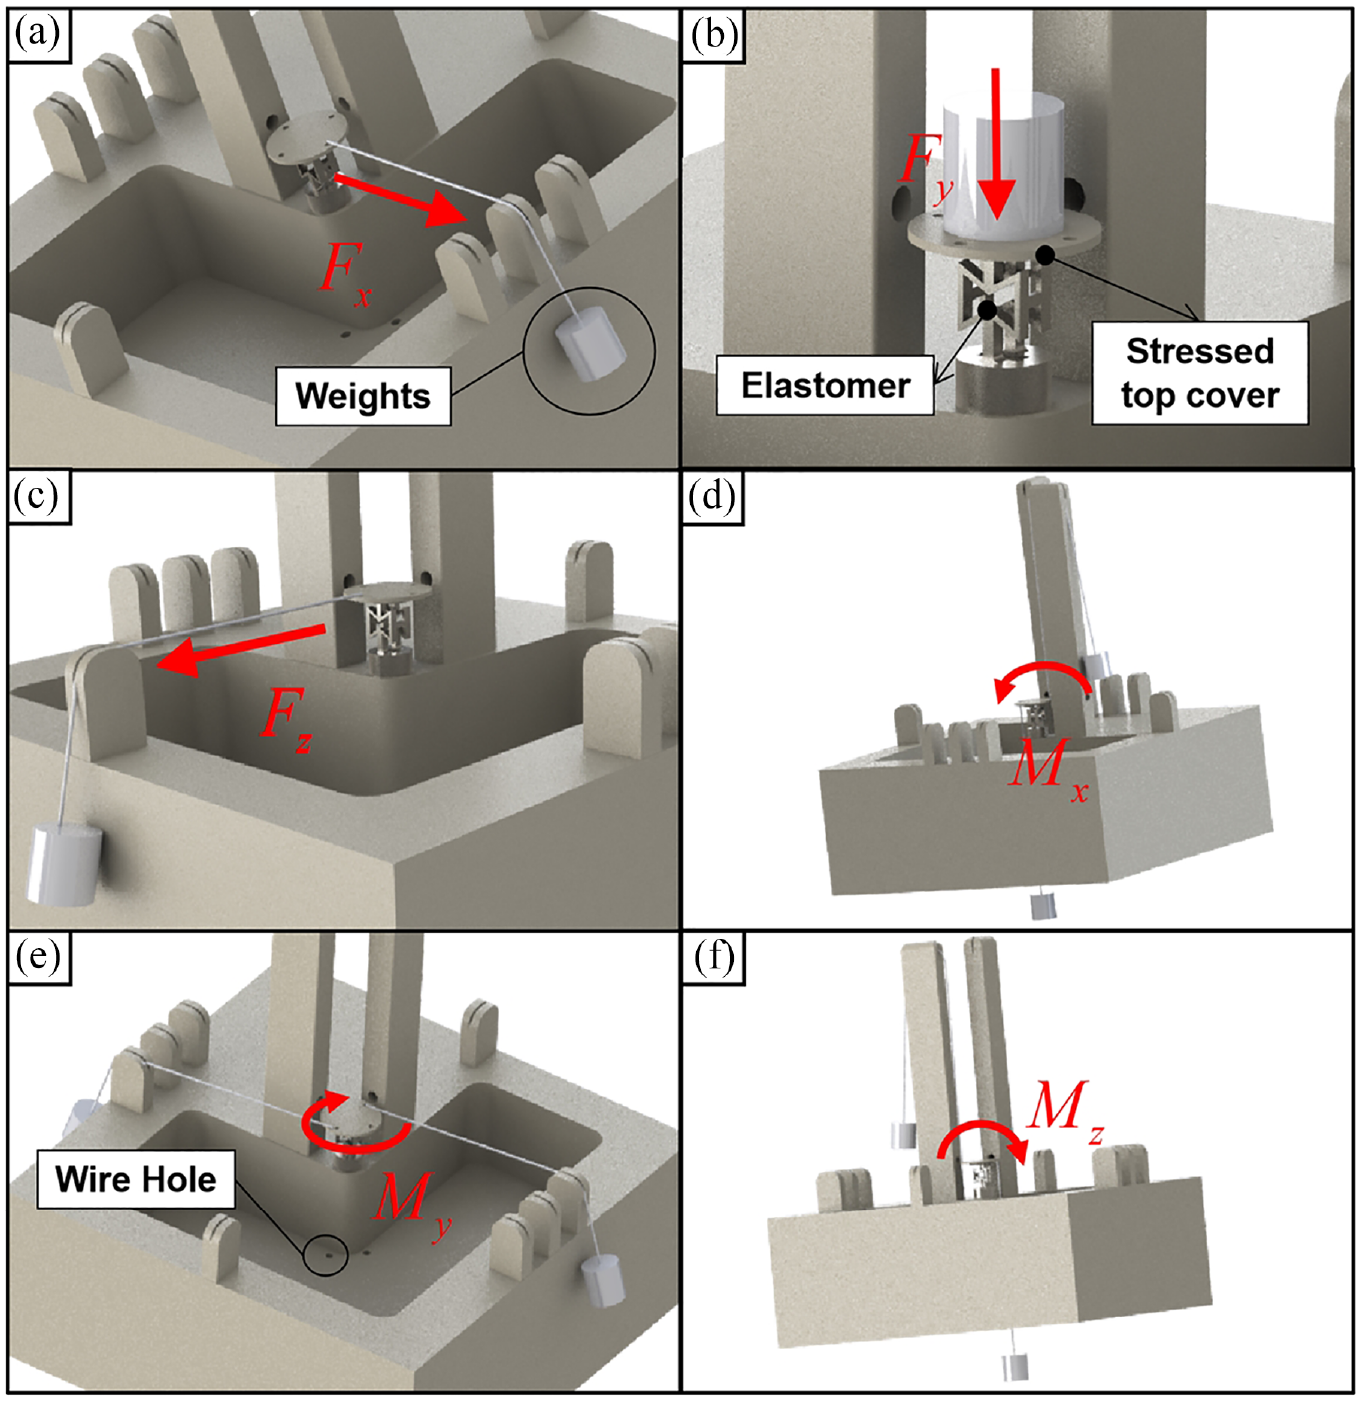
The scheme of the static force/moment calibration of: (a)
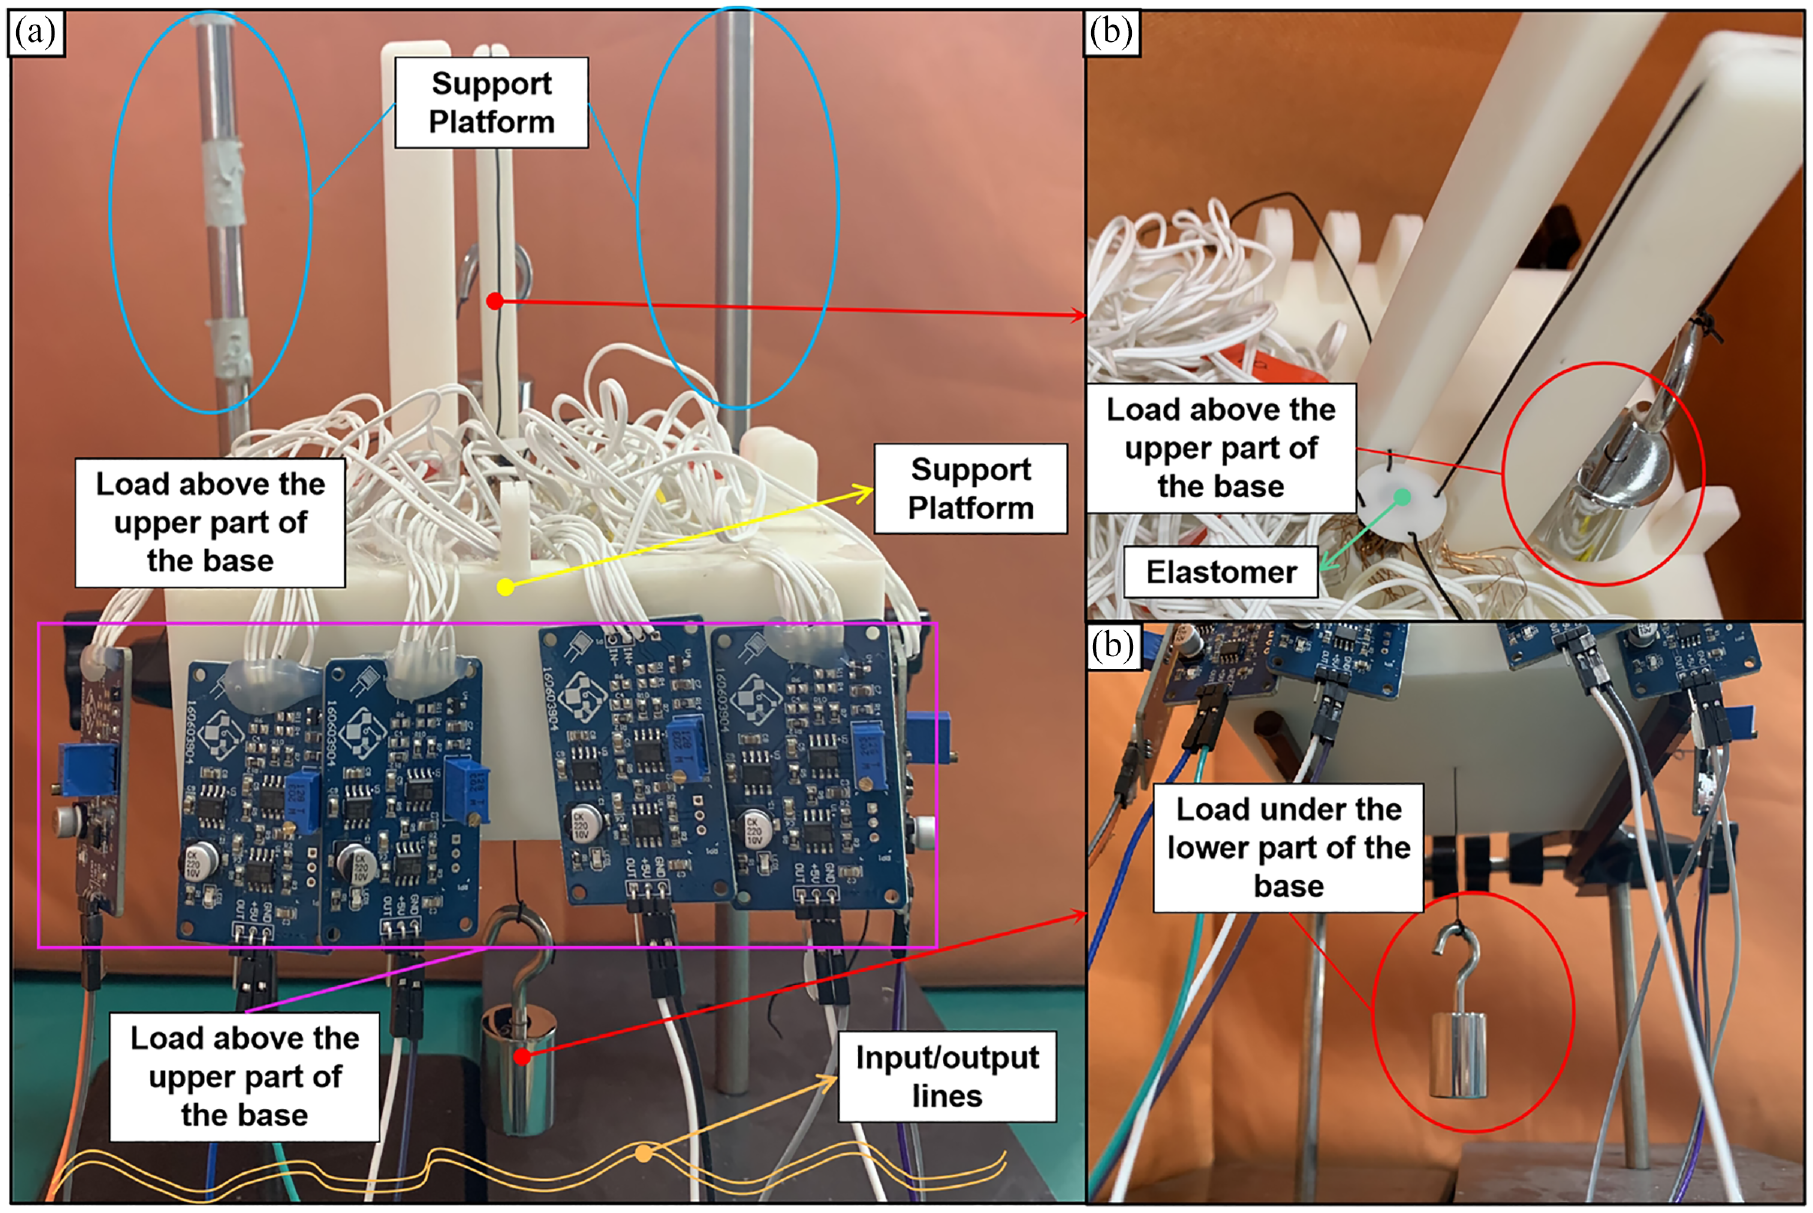
The operation diagram of the actual test: (a) the operation diagram of the actual test with
Considering the output range limitation of the amplifier module selected for the experiment and the accuracy requirement of the sensor, for the actual output voltage value, the multimeter with selectable 200 mV, 2 V, and 200 V ranges is used for measurement.
In order to fully illustrate the self-decoupling performance of the sensor designed in this paper, it is verified in the form of multi-dimensional force/moment applied to the sensor at the same time. During the experiment, the applied external force is based on 1 N in increments of 0.1 N to a maximum of 5N, and the applied external moment is based on 5 Nmm in increments of 0.1 Nmm to a maximum of 10 Nmm. In order to facilitate the experimental operation, different coupling situations are set under different force/moment values, and the number of coupling types is

Fifty-seven coupling situations were verified separately, and the real force/moment values were randomly selected within above range. Five groups of verification experiments with different applied force/moment were carried out for each coupling situation, and a total of 285 sets of experiments were performed. The average coupling error of each dimension’s force/moment under the experiments is shown in Figure 12.
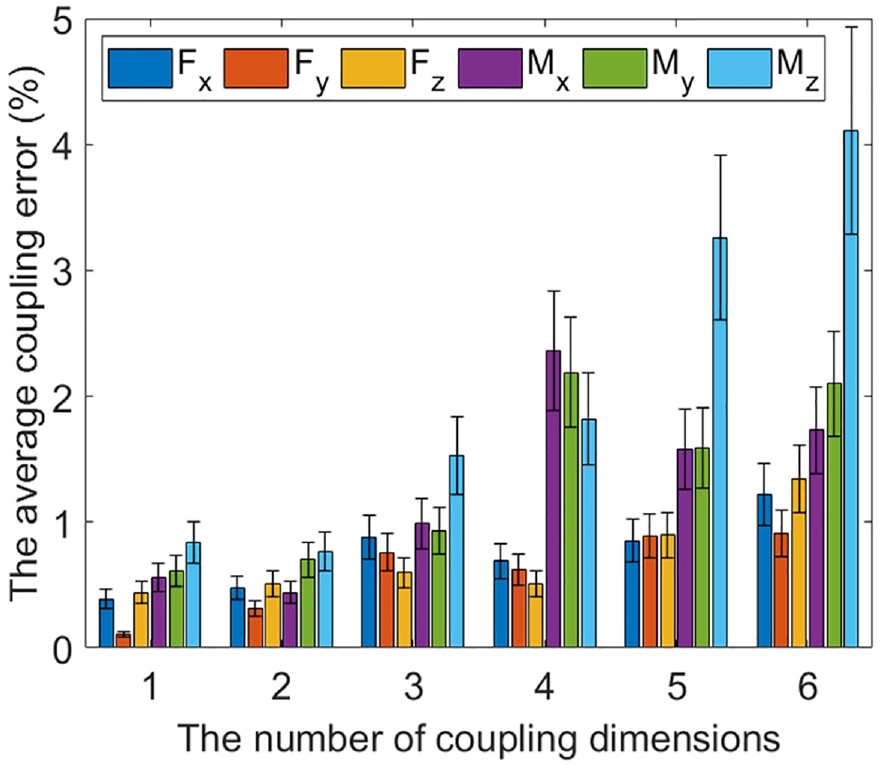
The average coupling error of each dimension’s force/moment under the experiments.
Comparative Experiments of the Sensor
In view of the high accuracy of the commercial six-dimensional force sensor, it is necessary to put it on the same mechanical test platform and load the same force as the proposed sensor, so as to have a convincing comparison of the performance of sensors. In order to compare the performance of the proposed sensor with the existing sensor, we use EPIC® commercial six-dimensional sensor for the same experimental platform testing. Because the main innovation of this paper is the small size of the sensor (the outer diameter is 8mm), the previous mechanical test platform needed to be tailored to the size of the sensor, which was difficult to adapt to existing commercial sensors. In order to meet the requirements of comparative experiments, we designed a new mechanical test platform for EPIC® commercial six-dimensional sensors (the outer diameter is 60 mm), and also performed six-dimensional force/torque tests, and the status of the test is shown in the Figure 13.
The force/moment tests of the commercial sensor: (a)
According to the test platform above, we recorded a total of 18 sets of data when applying external force/moment, which were compiled in Table 3.
Comparison between the data from the proposed sensor and the commercial sensor.
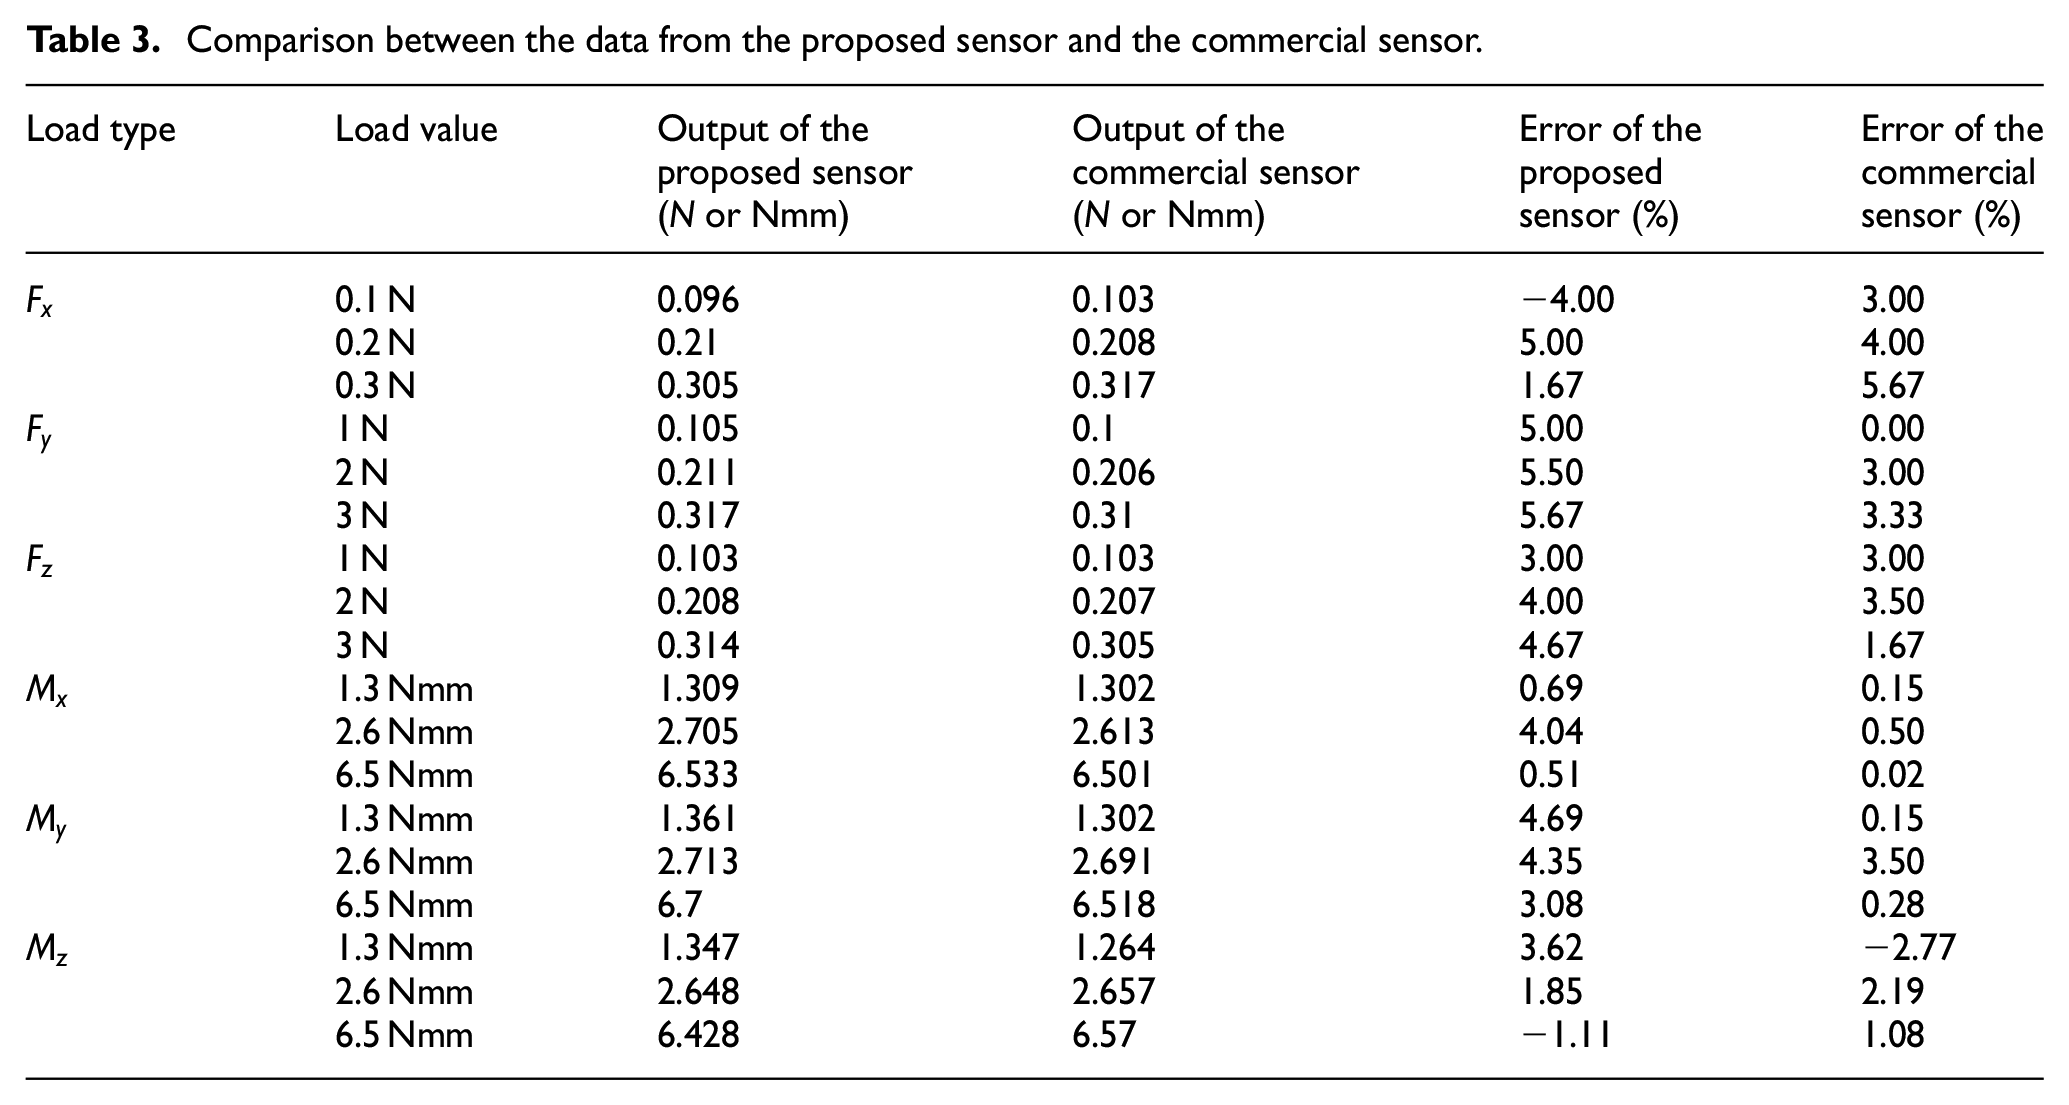
According to the data in Table 3, it can be known that when measuring six-dimensional force/moment, the average error of the proposed sensor is slightly larger than that of the commercial sensor, but the errors of the proposed sensor are less than 5%, which meets the requirements for applications. And because the size of the commercial sensor is large, it is reasonable for its measurement accuracy being greater than that of the proposed sensor. As can be seen from Table 3, the error of commercial sensor is not all zero, mainly caused by the systematic error of the platform. Therefore, the system bias can not be ignored.
Results and discussion
The experimental platform shown in Figure 10 was used to record the output voltage under the action of six-dimensional force/moment with different values, and the theoretical value was compared with the actual value. The calibration matrix obtained by the simulation data is corrected again using the actual data. The main error sources of the final output are including the scale factor error matrix
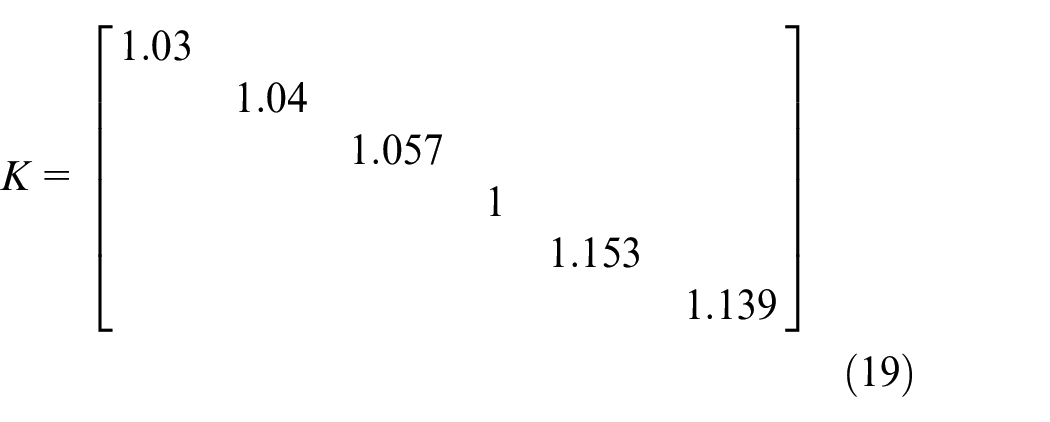
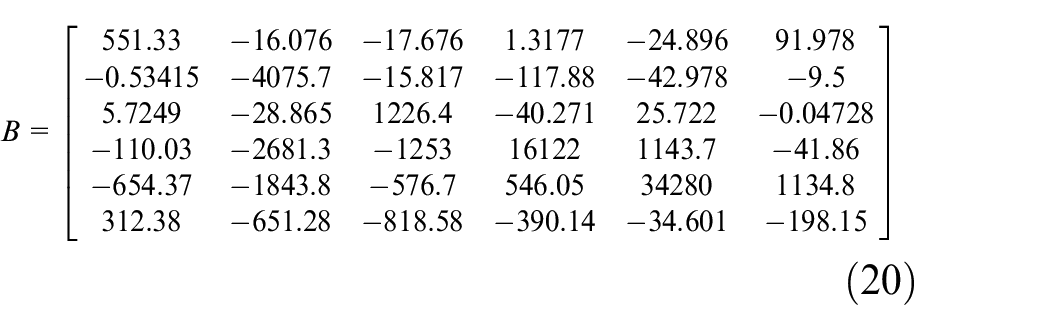
The actual calibration matrix

To Sum up, the matrix for the actual measurement output calculation is obtained:
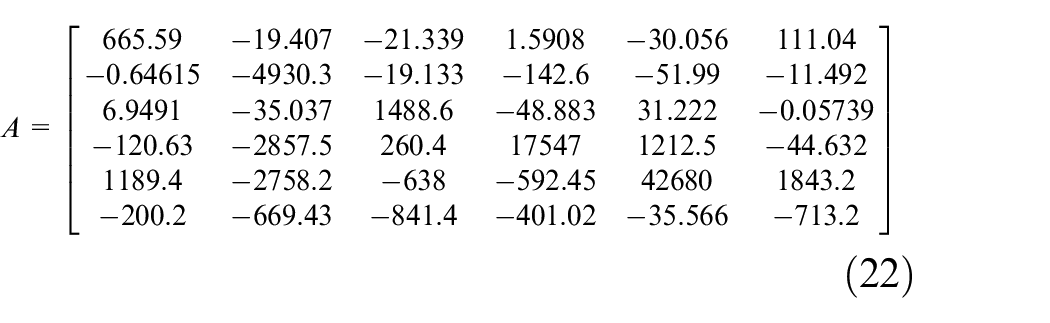
Therefore, when the output voltage values of each electric circuit is obtained in practice, the corresponding force/moment information can be calculated by using (15), the parameter value of matrix
According to the comparative experiment with the commercial sensor, the measurement error of the sensor designed in this paper is less than 5%, and the difference is not much compared with the measurement error of the existing sensor, which meets the requirements for applications.
Comparing the results of 285 coupling experiments in Section 3.3. Prototyping Test of the Sensor with the obtained calibration matrix, it can be obtained that the final error of
Conclusion
The diameter of the designed sensor, which owns the function of measuring six-dimensional force/moment, is just only 8 mm. It is not an exaggeration that this tiny size exceeds all existing high-dimensional sensors that have been produced nowadays. With proper wiring, it can be integrated as a sensor device in numerous small mechatronic devices. Besides, the columnar sensors involved in the existing researches have not been attempting to “structure” the column of the sensor elastomer, and the data in this paper shows that this initiative can effectively improve the sensitivity of the force/moment sensor. At the same time, the design in this paper has higher overall robustness and greater structural strength than layered sensors, and wire cutting has more advantages such as easier to implement than other manufacturing process. In addition, the sensor designed in this study can realize the self-decoupling function, which greatly improves the data processing efficiency of the system, and only needs to obtain the force feedback information by simply processing the output voltage such as matrix calculation, and avoids the additional design of the decoupling algorithm to achieve a great effect that gaining output of multi-dimensional force/moment without interference.
Footnotes
Declaration of conflicting interests
The author(s) declared no potential conflicts of interest with respect to the research, authorship, and/or publication of this article.
Funding
The author(s) disclosed receipt of the following financial support for the research, authorship, and/or publication of this article: This work was supported in part by the National Key R&D Program of China under Grant 2019YFB1311700, 2019YFB1312500, and 2021YFC0122702, in part by National Natural Science Foundation of China under Grant U1913216, in part by medical Engineering Fund of Fudan University under Grant YG2021-0008, in part by Science and Technology Commission of Shanghai Municipality under Grant 21511102000, and in part by Fudan-ZiMaoYiHao Medical Device Joint Experimental Center Project under Grant SGH2310020/007.