
Abstract
Manufacturing processes are usually energy intensive, contributing to the global carbon dioxide emissions. Deep Drawing is one of the most common types of sheet metal forming processes with great potential for energy efficiency improvement. In this paper, the optimised combination of molybdenum disulphide (MoS2) and graphite is proposed as a solid lubricant to reduce the punching force and energy consumption of deep drawing process. Different mixtures of MoS2 and graphite are prepared and their tribological performance are measured using experimental tests on tribometer. In order to investigate the friction reduction rate in deep drawing process, finite element simulation of the drawing process is performed. Results show that friction reduction using proposed combination of lubricants has significant effect on punching force and would provide greater process efficiency.
Keywords
Introduction
Reducing global emissions is an integral consideration to avoid consequences of climate change. For this to occur, The Intergovernmental Panel on Climate Change recommends emissions to be cut by 40-70% levels by 2050. 1 Manufacturing processes, such as sheet metal forming, have attracted great attention over recent years due to their wide use. They are rather expensive and energy intensive, thus there is still huge room for improvements in potential energy and material efficiency. 1
Within the automotive and aerospace industries, sheet metal forming is considered one of the most critical operations. Despite the broad application and knowledge of the process, factors such as tool design, choice of lubrication and selection of proper sheet materials are still heavily based on trial and error methods. 2 A study from Lovell et al. 3 showed that over $100 billion is spent annually in the U.S.A alone on the design and fabrication of stamped components. 4 These components, typically made from steel or aluminium, account for over 10% of global anthropogenic carbon dioxide emissions, showing the energy intensive nature of forming processes. 4
One of the most common types of sheet metal forming operations is deep drawing, which has been used in a variety of industrial areas, since the late 19th century. 5 The basic procedure involves a punch radially drawing the sheet into the forming die. The punch is usually drawn downwards at a velocity within the typical range of 0.1–0.3 m/s. Over the years, analytical models have been derived to predict the strains and forces of the different components, particularly of the sheet that is formed to a cup-like structure. The drawing process however involves plastic deformation together with large strains and rotations, making it difficult to derive accurate mathematical models to predict behaviour. Because of the numerous factors to account for, numerical approaches such as Finite Element Analysis (FEA) have been used to gain a greater understanding of the process.6,7
One of the key parameters that governs the success of deep drawing is the friction experienced between the components. 8 The friction between the punch-to-sheet and holder-to-sheet has a significant detrimental influence in the distribution of strain within the component. These friction forces also contribute to the cost and energy efficiency of the process. Using lubricants with lower coefficient of friction (CoF) leads to lower frictional forces, thereby reducing the required punching force to form the sheet, and reduced energy consumption, both contributing towards longer die life.9,10 It is therefore vital that the right type of lubrication is used. Generally, for light press working, low-viscosity mineral
oil, synthetic oils, or water-based lubricants are suitable. 11 Investigations on liquid phase lubricants can be found in literature. 12 Most of liquid lubricants such as chlorinated paraffin oils which are used in sheet metal forming are often environmentally hazardous and flammable. 13 Furthermore, their performance in heavy press working is not sufficient and their post-cleaning is difficult and costly which only is possible by using volatile organic solvents. 11 Therefore, solid lubricants are preferred specially for heavy press working applications. 14
One of the common types of lubricants used is graphite solid lubricant because of its low friction. 15 Other alternative lubricants can be used which possess better anti-friction properties, giving more benefit in terms of reducing the energy lost due to friction and reducing the required punching force.
Graphite and molybdenum disulphide (MoS2) as solid materials with individual atomically-thin planes that can easily slide against each other are perfect materials in lubricant applications. 16 In very clean surfaces, molybdenum disulphide can offer ultra-low friction coefficient in a range of temperatures. However, in the presence of oxygen or humidity the lubricity characteristics of molybdenum disulphide reduces considerably, while graphite is not sensitive to such contaminants. 16
In the current study, with the goal of achieving high performance solid lubricant, the friction characteristics of different combinations of MoS2 and graphite is investigated in the deep drawing process. Both lubricants have been analysed extensively separately, however the performance of combinations of both lubricants is not widely understood to this date. Samples containing different combinations of MoS2 and graphite solid lubricant were prepared and their tribological performance were measured using a pin-on-disc tribometer. The results obtained are subsequently used in numerical analysis, using Abaqus Finite Element Method (FEA) software, to model the friction experienced in deep drawing processes. The proposed numerical-experimental approach has not been reported in the literature hitherto. The friction experienced between the individual component plays a huge role in the quality and strain distribution of the final formed part. The results show that the proposed lubricant combination has a significant effect and would provide greater process efficiency.
Solid lubricants
MoS2 along with graphite are two of the most commonly used solid lubricants in reducing friction under large loads. The high levels of lubrication performance in MoS2 arises from its layered hexagonal lattice structure, consisting of alternate layers of molybdenum and sulphur.17–19 Bonds between the molybdenum and sulphur layers are strong covalent bonds, giving the material its high strength property, which helps resist penetration of surface asperities.20,21 Its low friction property arises from the weak Van der Waals forces between the sulphur layers, allowing movement of the lamellae over each other. 21 Like MoS2, graphite consists of carbon atoms which are arranged hexagonally in layers. The bonds between the carbon atoms within the layers are strong covalent bonds, enabling the crystals to resist bending or breaking of the layers. 22 Bonds between the graphite layers are weak Van der Waals forces which allow the material to split easily between layers, giving graphite its desirable low friction property. 23
MoS2 has perfect lubricity in clean and dry condition, but its lubricity substantially decreases with contaminations. On the other hand, the performance of graphite is even better in the presence of little humidity. As the real working environment mostly contains contaminations and/or humidity, it seems reasonable to use a mixture of these two materials to achieve a high-performance lubricant. In this study, in order to utilise the advantageous of both graphite and MoS2,the effects of mixing these lubricants have been investigated. Samples containing combinations of two lubricants were prepared and tested on a pin-on-disc tribometer in order to analyse their tribological performance, subsequently used in numerical models.
Sample preparation
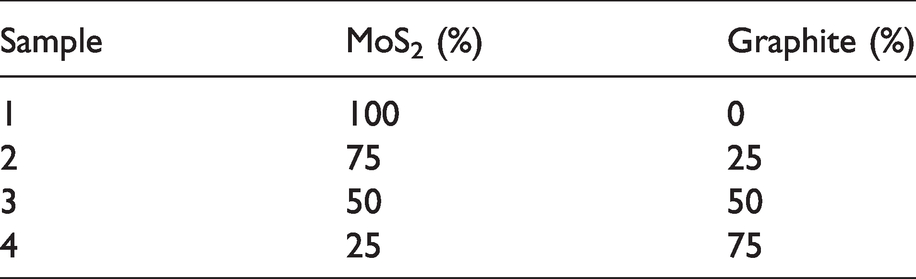
For pin on disc tribometer testing, different combinations of graphite and MoS2 were prepared. The compositions of the examined samples are presented in Table 1. The lubricant material for each sample was prepared according to weight ratios in Table 1. The lubricant coating was then applied to EN31 steel substrates using a glass rod. The samples were left to dry in air before further testing.
The samples containing different compositions of MoS2 and graphite.
Sample characterisation
A pin-on-disc tribometer was used to analyse the tribological behaviour of the lubricant samples, subjected to different loading conditions under low and high sliding speeds.
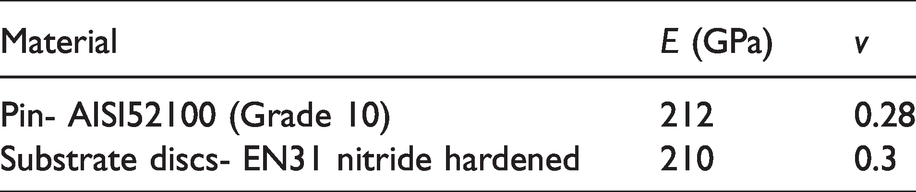
The pin material chosen was AISI52100 (grade 10) steel, which was loaded against the rotating EN31 nitride hardened discs coated with the lubricant samples. The disc diameter is 100 mm with the thickness of 8 mm. Properties of the pin and disc materials are shown in Table 2
Material properties.
Pin Loads (
As the pin possesses a hemispherical tip with nominal radius of 10 mm and the substrate is a flat surface, Hertzian contact theory is used to identify the measured contact pressure between the surfaces.
24
The Hertzian contact pressure, 

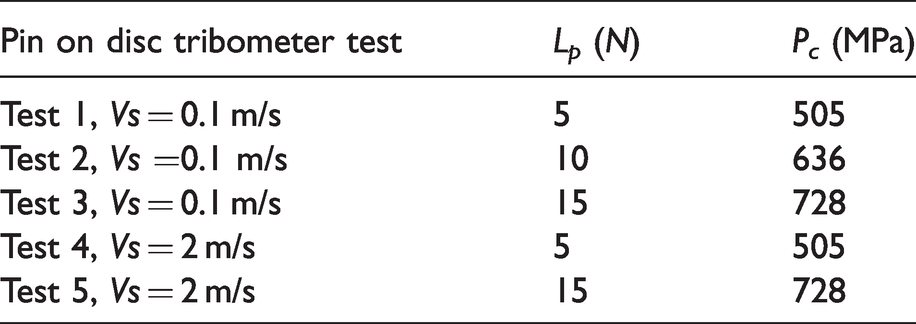
With three different loading conditions, the contact pressure for each test is shown in Table 3. As shown, the range of contact pressures are 505–730 MPa. Results from simulation will be used to check whether the contact pressures are suitable for deep drawing.
The range of contact pressure for pin on disc tribometer test.
Prior to tribometer testing, all substrate discs were cleaned with a non-polar solvent petroleum ether to remove all dust particles present on the surface of the sample. The pin on disc tribometer was calibrated before the samples were examined, to ensure accurate measurements were made. Figure 1 shows the tribometer used. The overall footprint of this machine is 1050 mm × 550 mm, with 340 mm length of measurement arm and 250 mm length of loading arm.
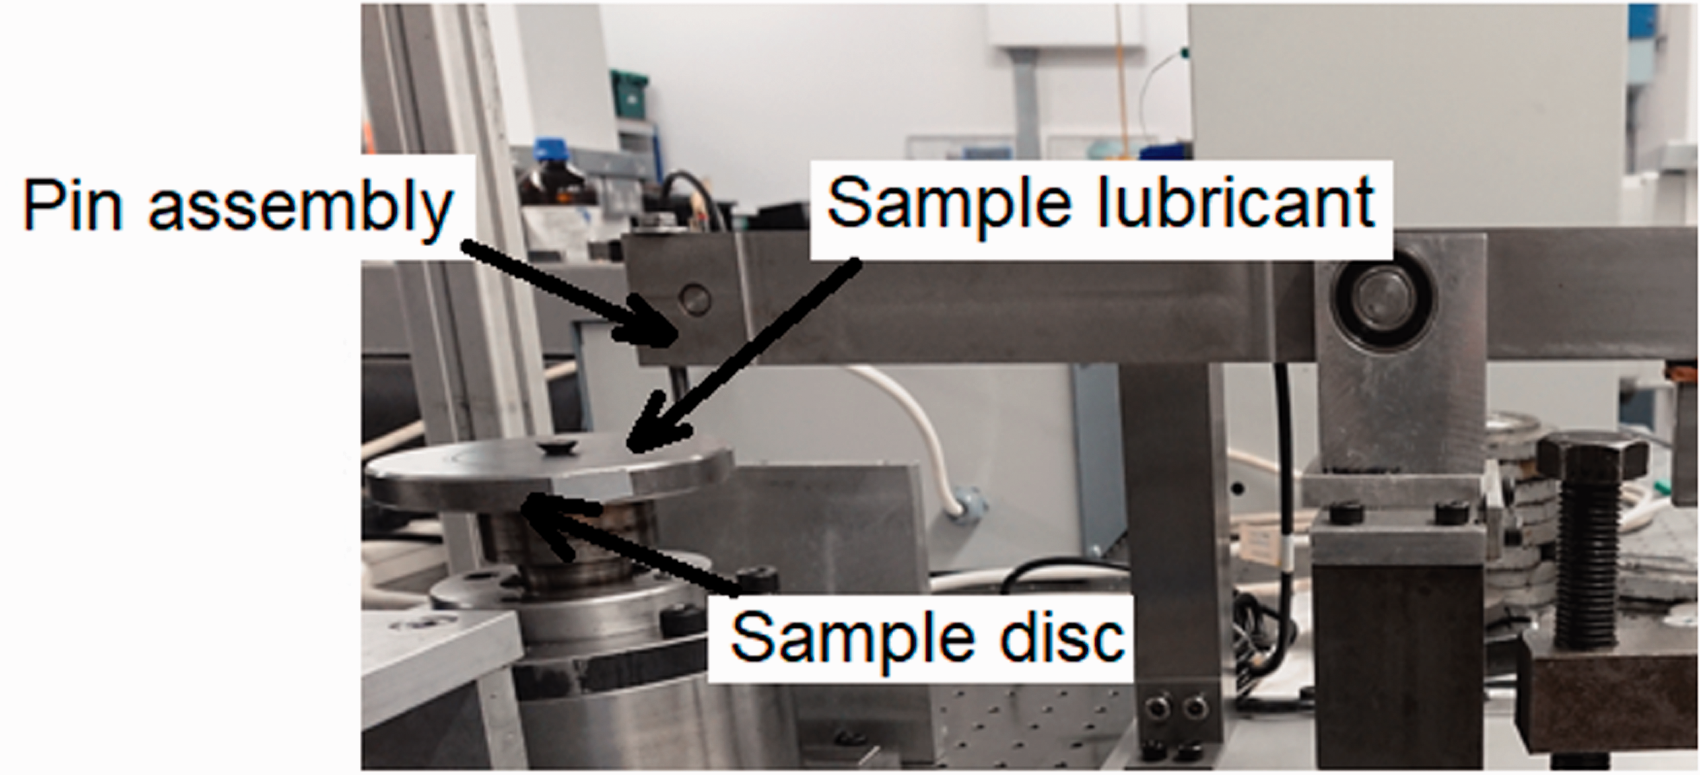
Picture of the tribometer.
Deep drawing FEA model
Model description and parameters
Numerical FEA simulations of the deep drawing process was conducted in commercial software of ABAQUS/Explicit 6.14. The ability of Abaqus/Explicit to effectively handle severely nonlinear behaviour such as contact makes it very attractive for the simulation of many quasi-static events, such as rolling, deep drawing and other manufacturing process. The assembly of the punch, die, sheet and holder of this study is illustrated in Figure 2.
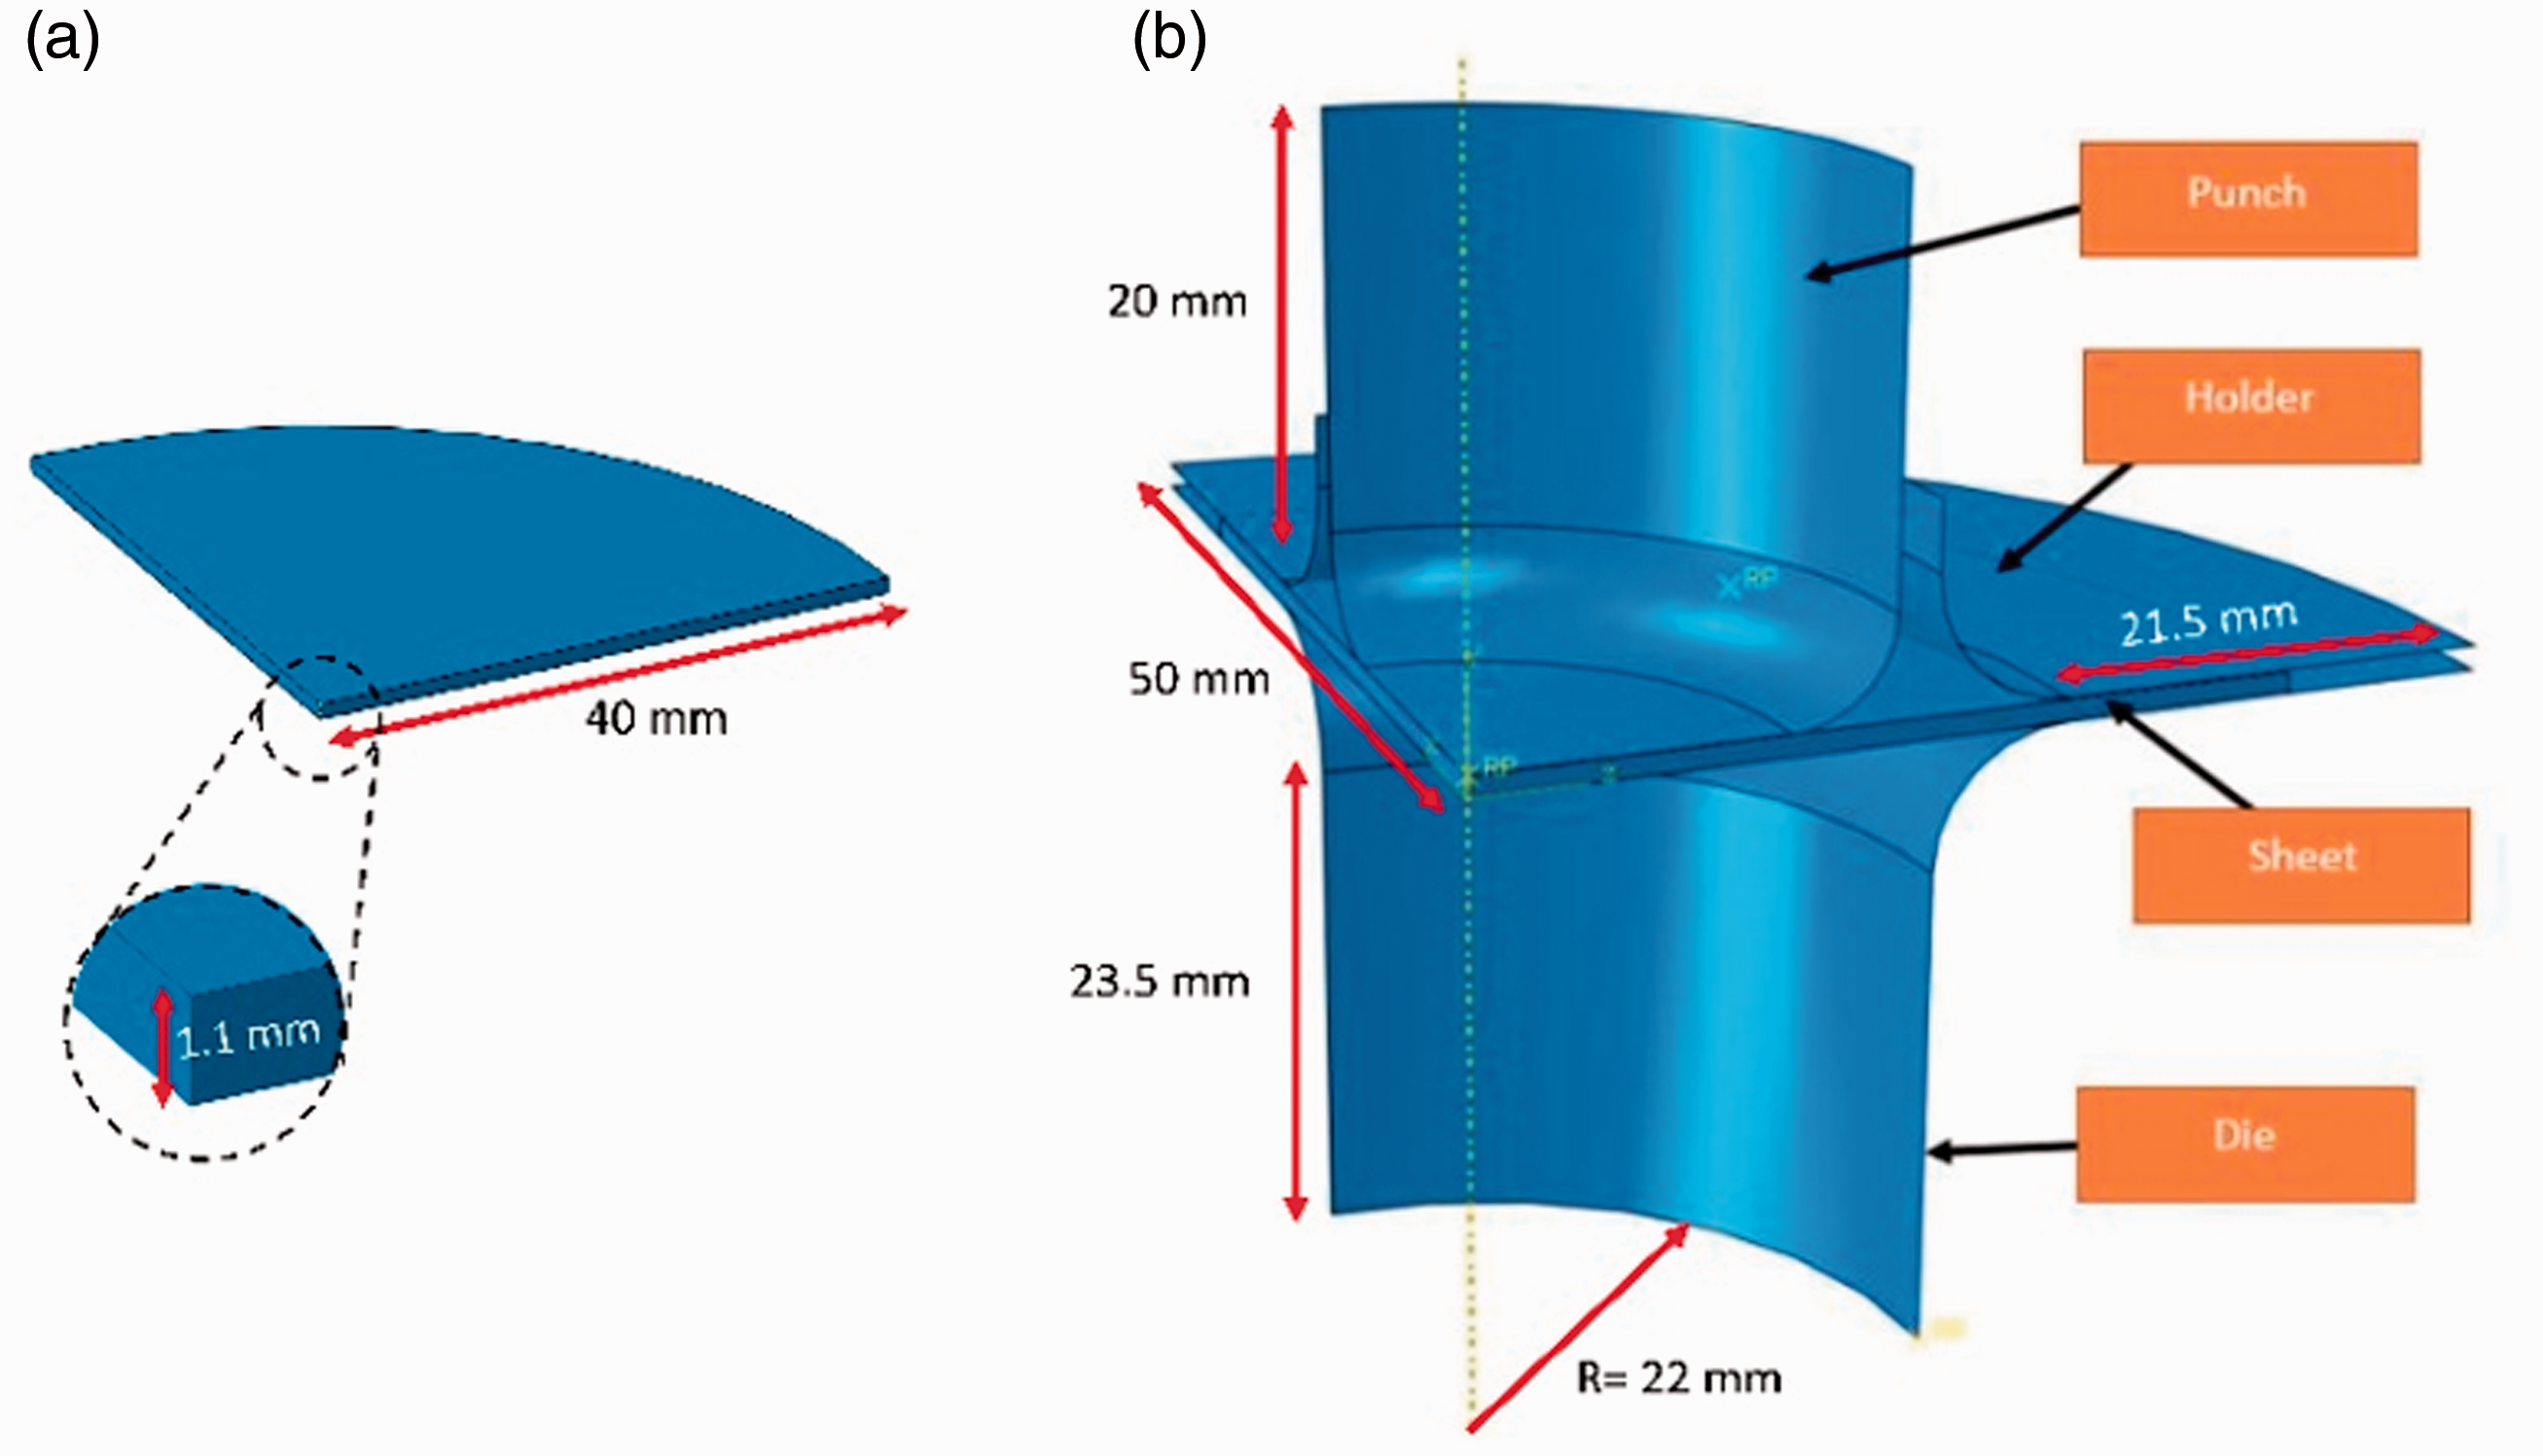
(a) The blank sheet, (b) The deep drawing assembly including blank sheet, die, punch and the blank holder.
The material properties for the sheet were selected as EN10346/DX54D+Z steel with density of 7800 kg/m3, modulus of elasticity of 200 GPa and poisson ratio of 0.36. This material is selected for numerical simulations because of its common usage in deep drawing operations. 10 The plastic deformation behaviour of the material was extracted from the flow curve, shown in Figure 3, and imported into the software. The graph is obtained using tensile test.
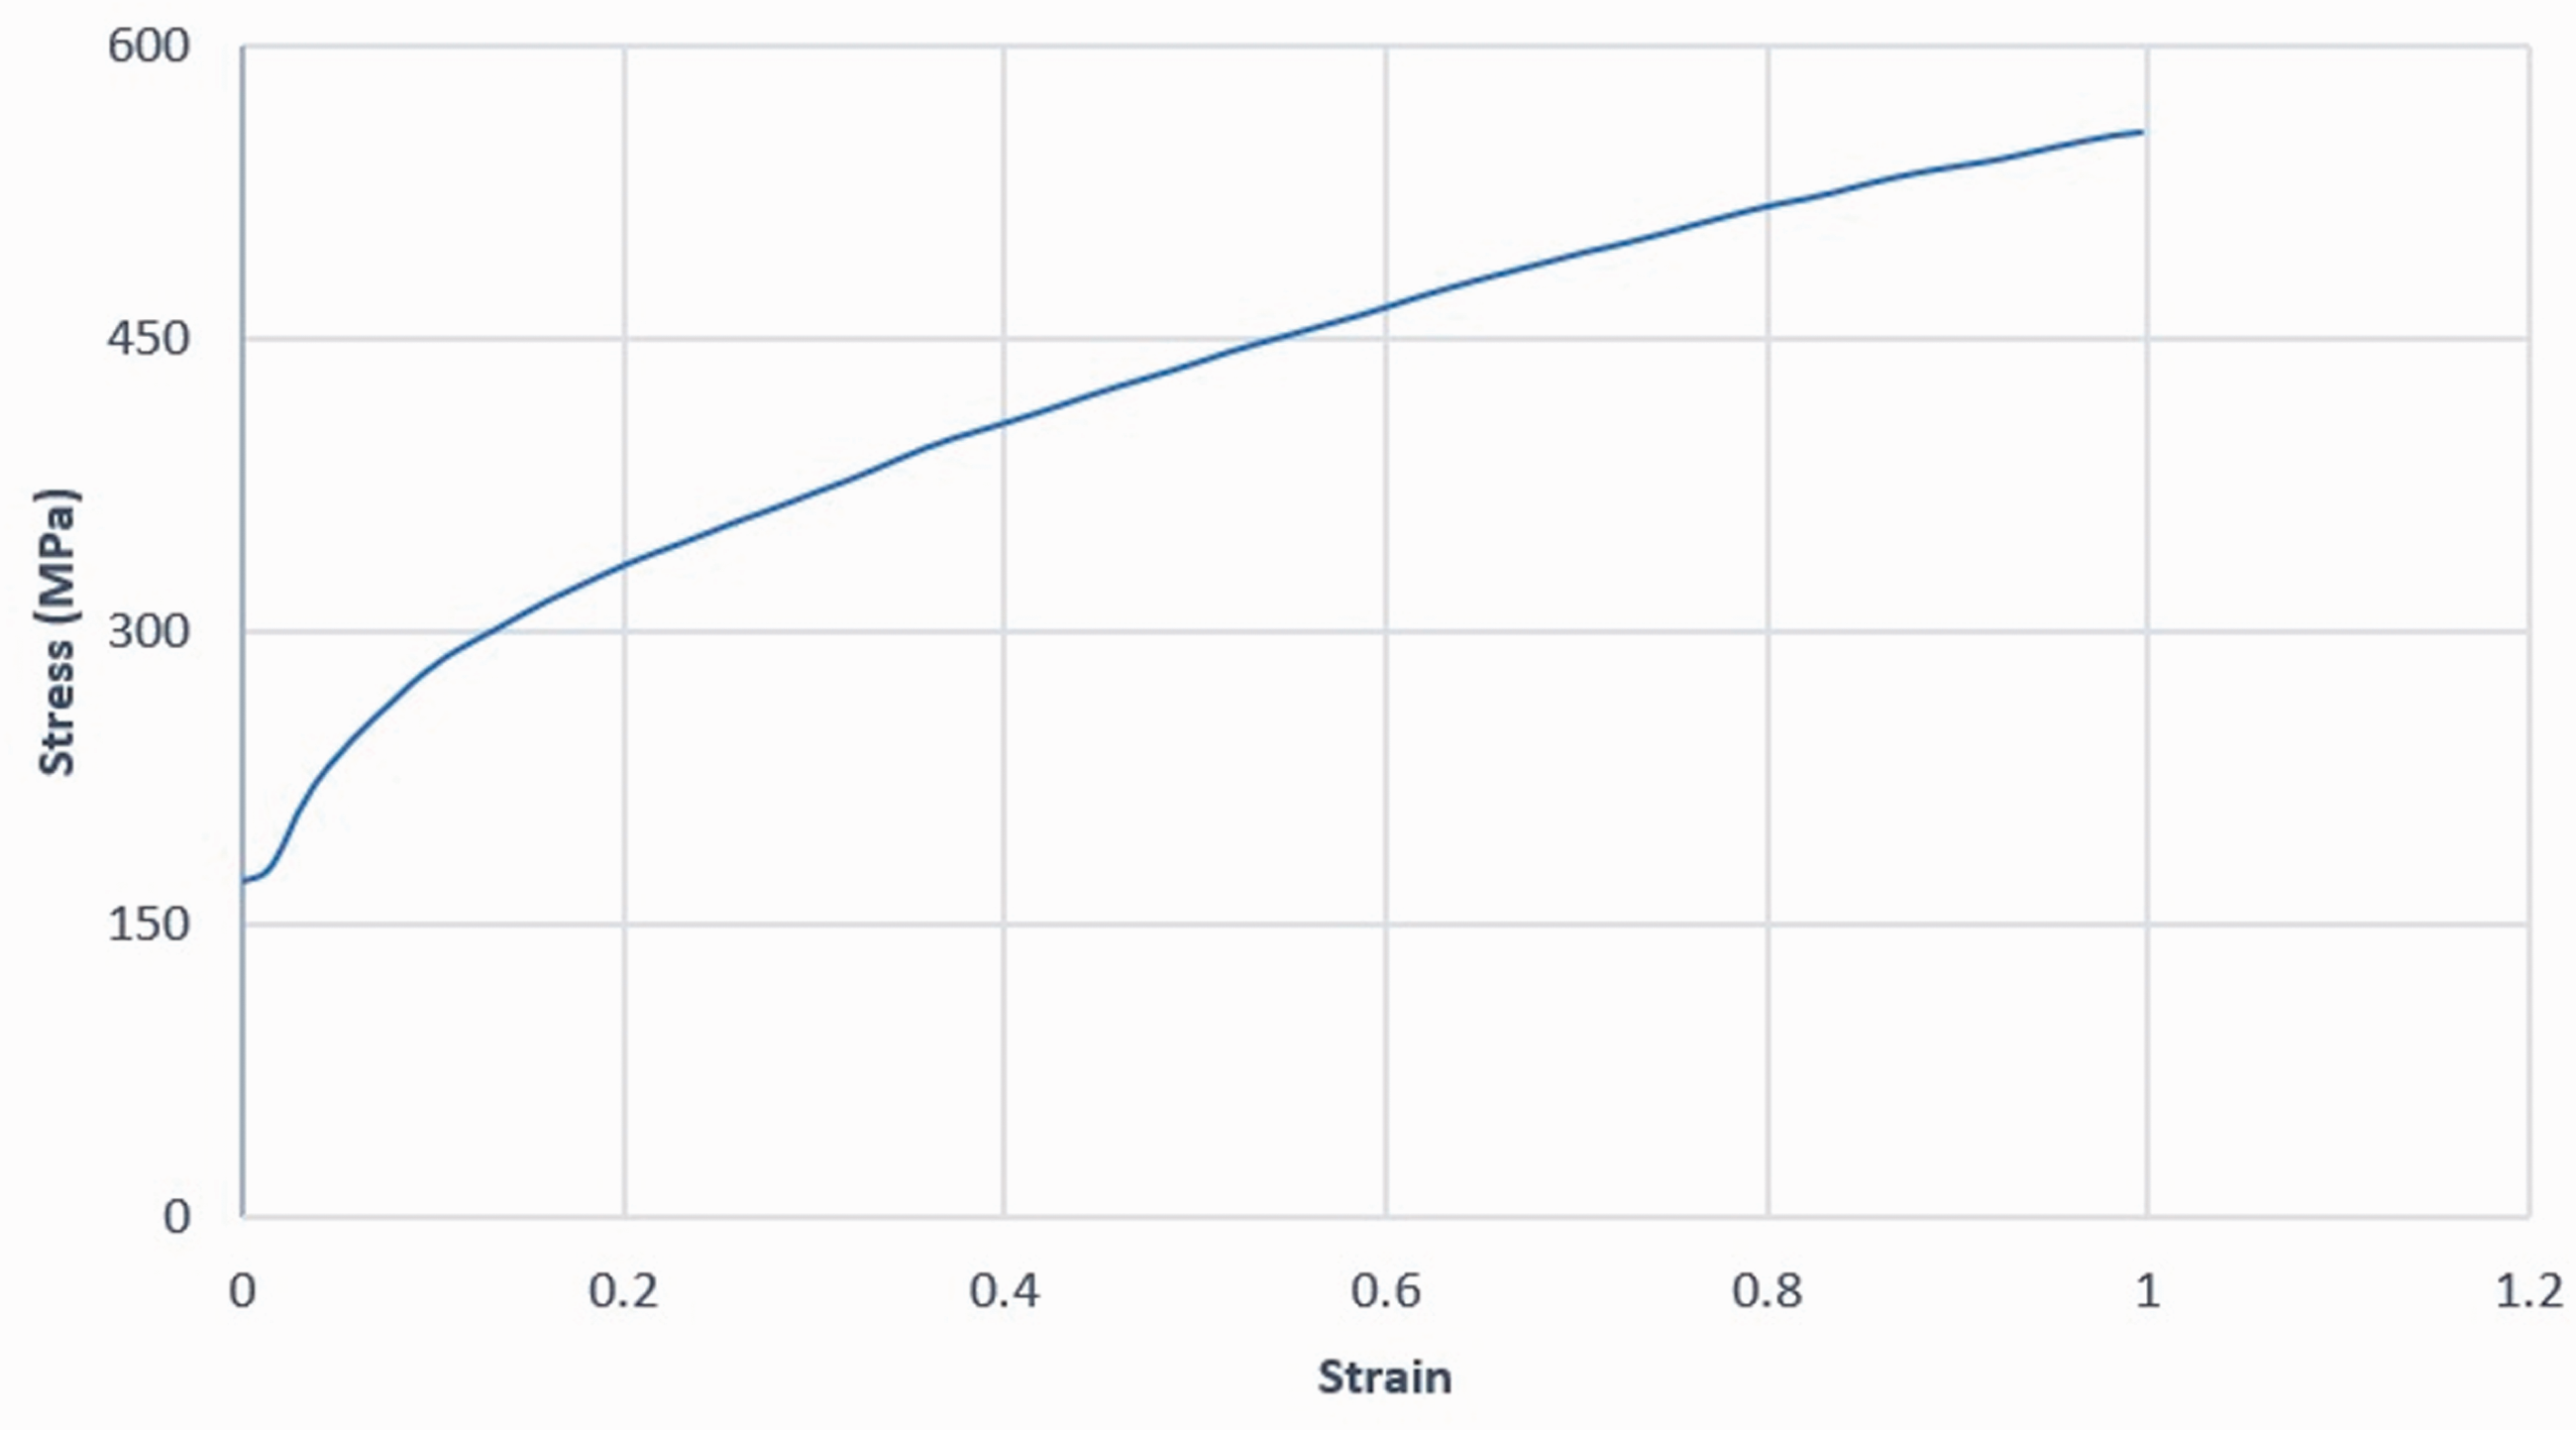
Plastic deformation behaviour of EN10346/DX54D+Z steel.
Sheet metal processes encompasses the bending of the material on a die curvature in a frictional regime, meaning both bending and contact phenomena are involved in the process. Second-order full and reduced- integration solid elements can model the bending accurately, but these elements are not perfect for contact problems. The best choice for FEA modelling of contact problems are first order element types; these elements have shear locking problems in bending. The compromised solution is using a linear incompatible element type such as C3D8I, which is an 8-node linear brick in incompatible mode which can model both bending and contact problem types accurately. Hence, this element type is used in order to model the sheet metal behaviour.
The R3D4 element type is employed for meshing the rigid bodies (punch and die). Surface to surface contact formulation is utilised for all contact surfaces with CoF of the simulated sample. The CoF is considered constant from the steady state part of the experimental measurement. Penalty method is used to simulate the tangential behaviour of the sliding surfaces. A default hard contact pressure-overclosure relationship is used to model the normal behaviour of the surfaces. With this relationship, surfaces are separated when the contact pressure between them is reduced to zero and any value of pressure is possible when surfaces are in contact. Contact pressure between two surfaces in the software can be modelled by considering a point 

A Lagrange multiplier represents the contact pressure in a mixed formulation. The virtual work contribution is given from equation (4)
For accurate modelling of static and kinetic frictions and the transition between static and kinetic friction, an exponential relation between static and kinetic frictions is used as:
25

Mass scaling was employed to further reduce simulation time. Mass scaling is valid for quasi static conditions and with the following simulations, the total kinetic energy is considerably less than the internal energy, making this assumption valid. Since it is a quasi-static process, a dynamic/explicit method was used for the simulations.
15
The CoF results from testing at
Figure 4 shows the boundary conditions applied to the model. For the sheet part, symmetry boundary condition is applied about the X and Z planes (XSYMM, U1 = UR2 = UR3 = 0, ZSYMM, U3 = UR1 = UR2 = 0) for the thickness area of the sheet located in the YZ plane. For the die and holder, both parts are fixed and cannot undergo displacement and rotations in any directions. The die and holder were modelled as rigid bodies, with the sheet metal modelled as a deformable component. With regards to the punch, a displacement boundary condition is applied, allowing for displacement only in the Y direction with a velocity of 100 mm/s (0.1 m/s) in this direction. By choosing this velocity not only represent the low sliding speed condition of the pin on disc tribometer but is also typical punch velocities used in deep drawing operations (0.1–0.3 m/s).
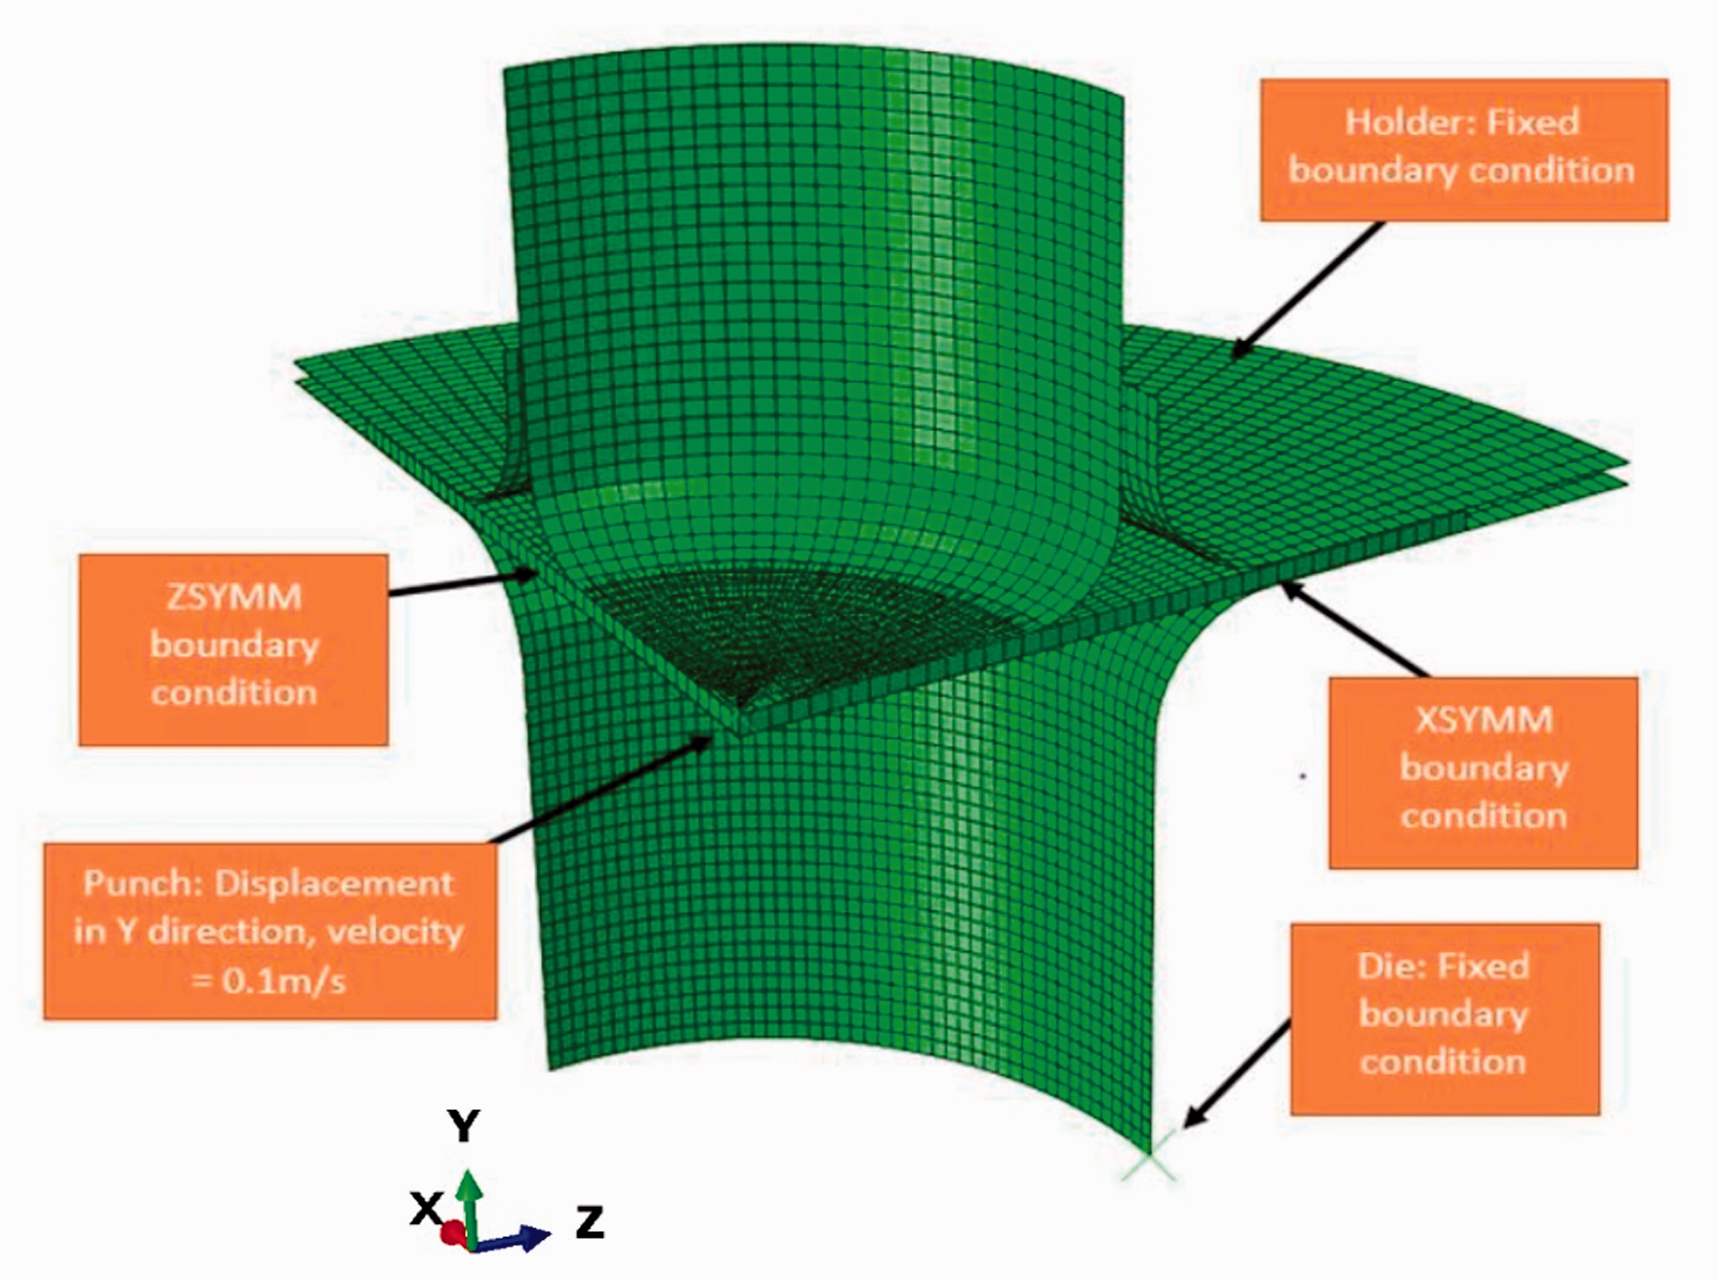
The Boundary conditions applied to the assembly.
Results and discussion
Pin on disc tribometer results
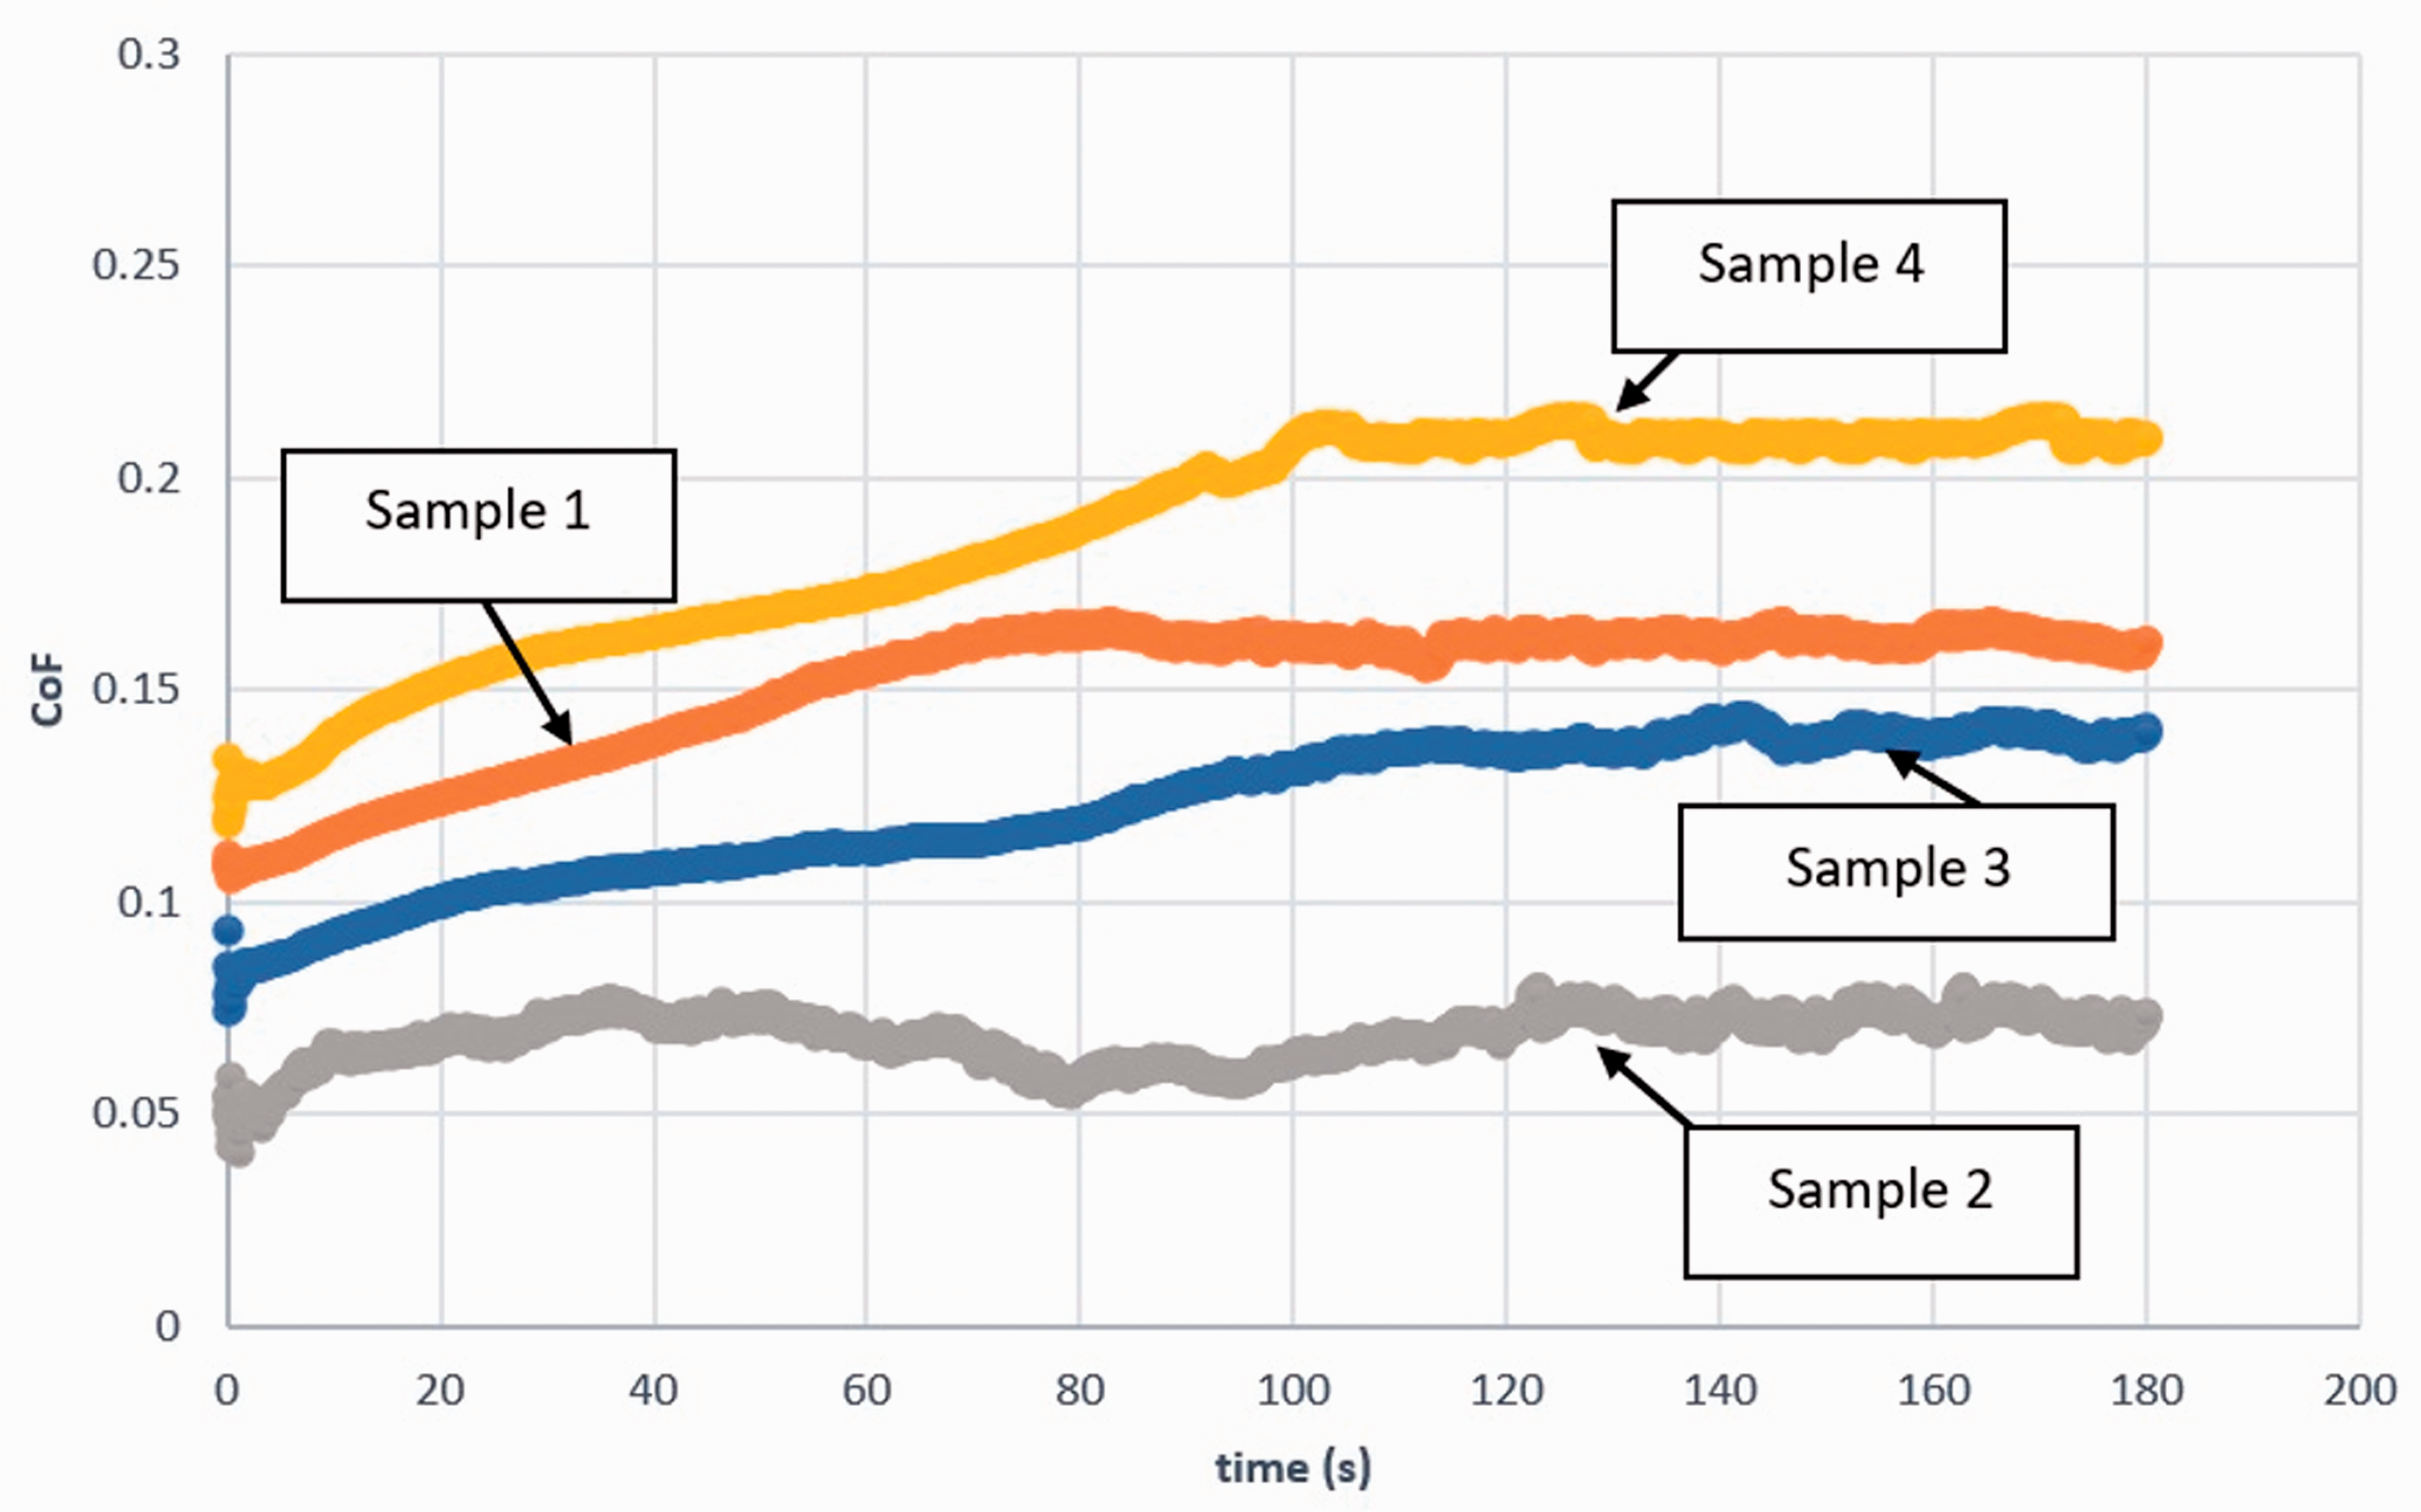
Figure 5 shows the friction data for each sample, with
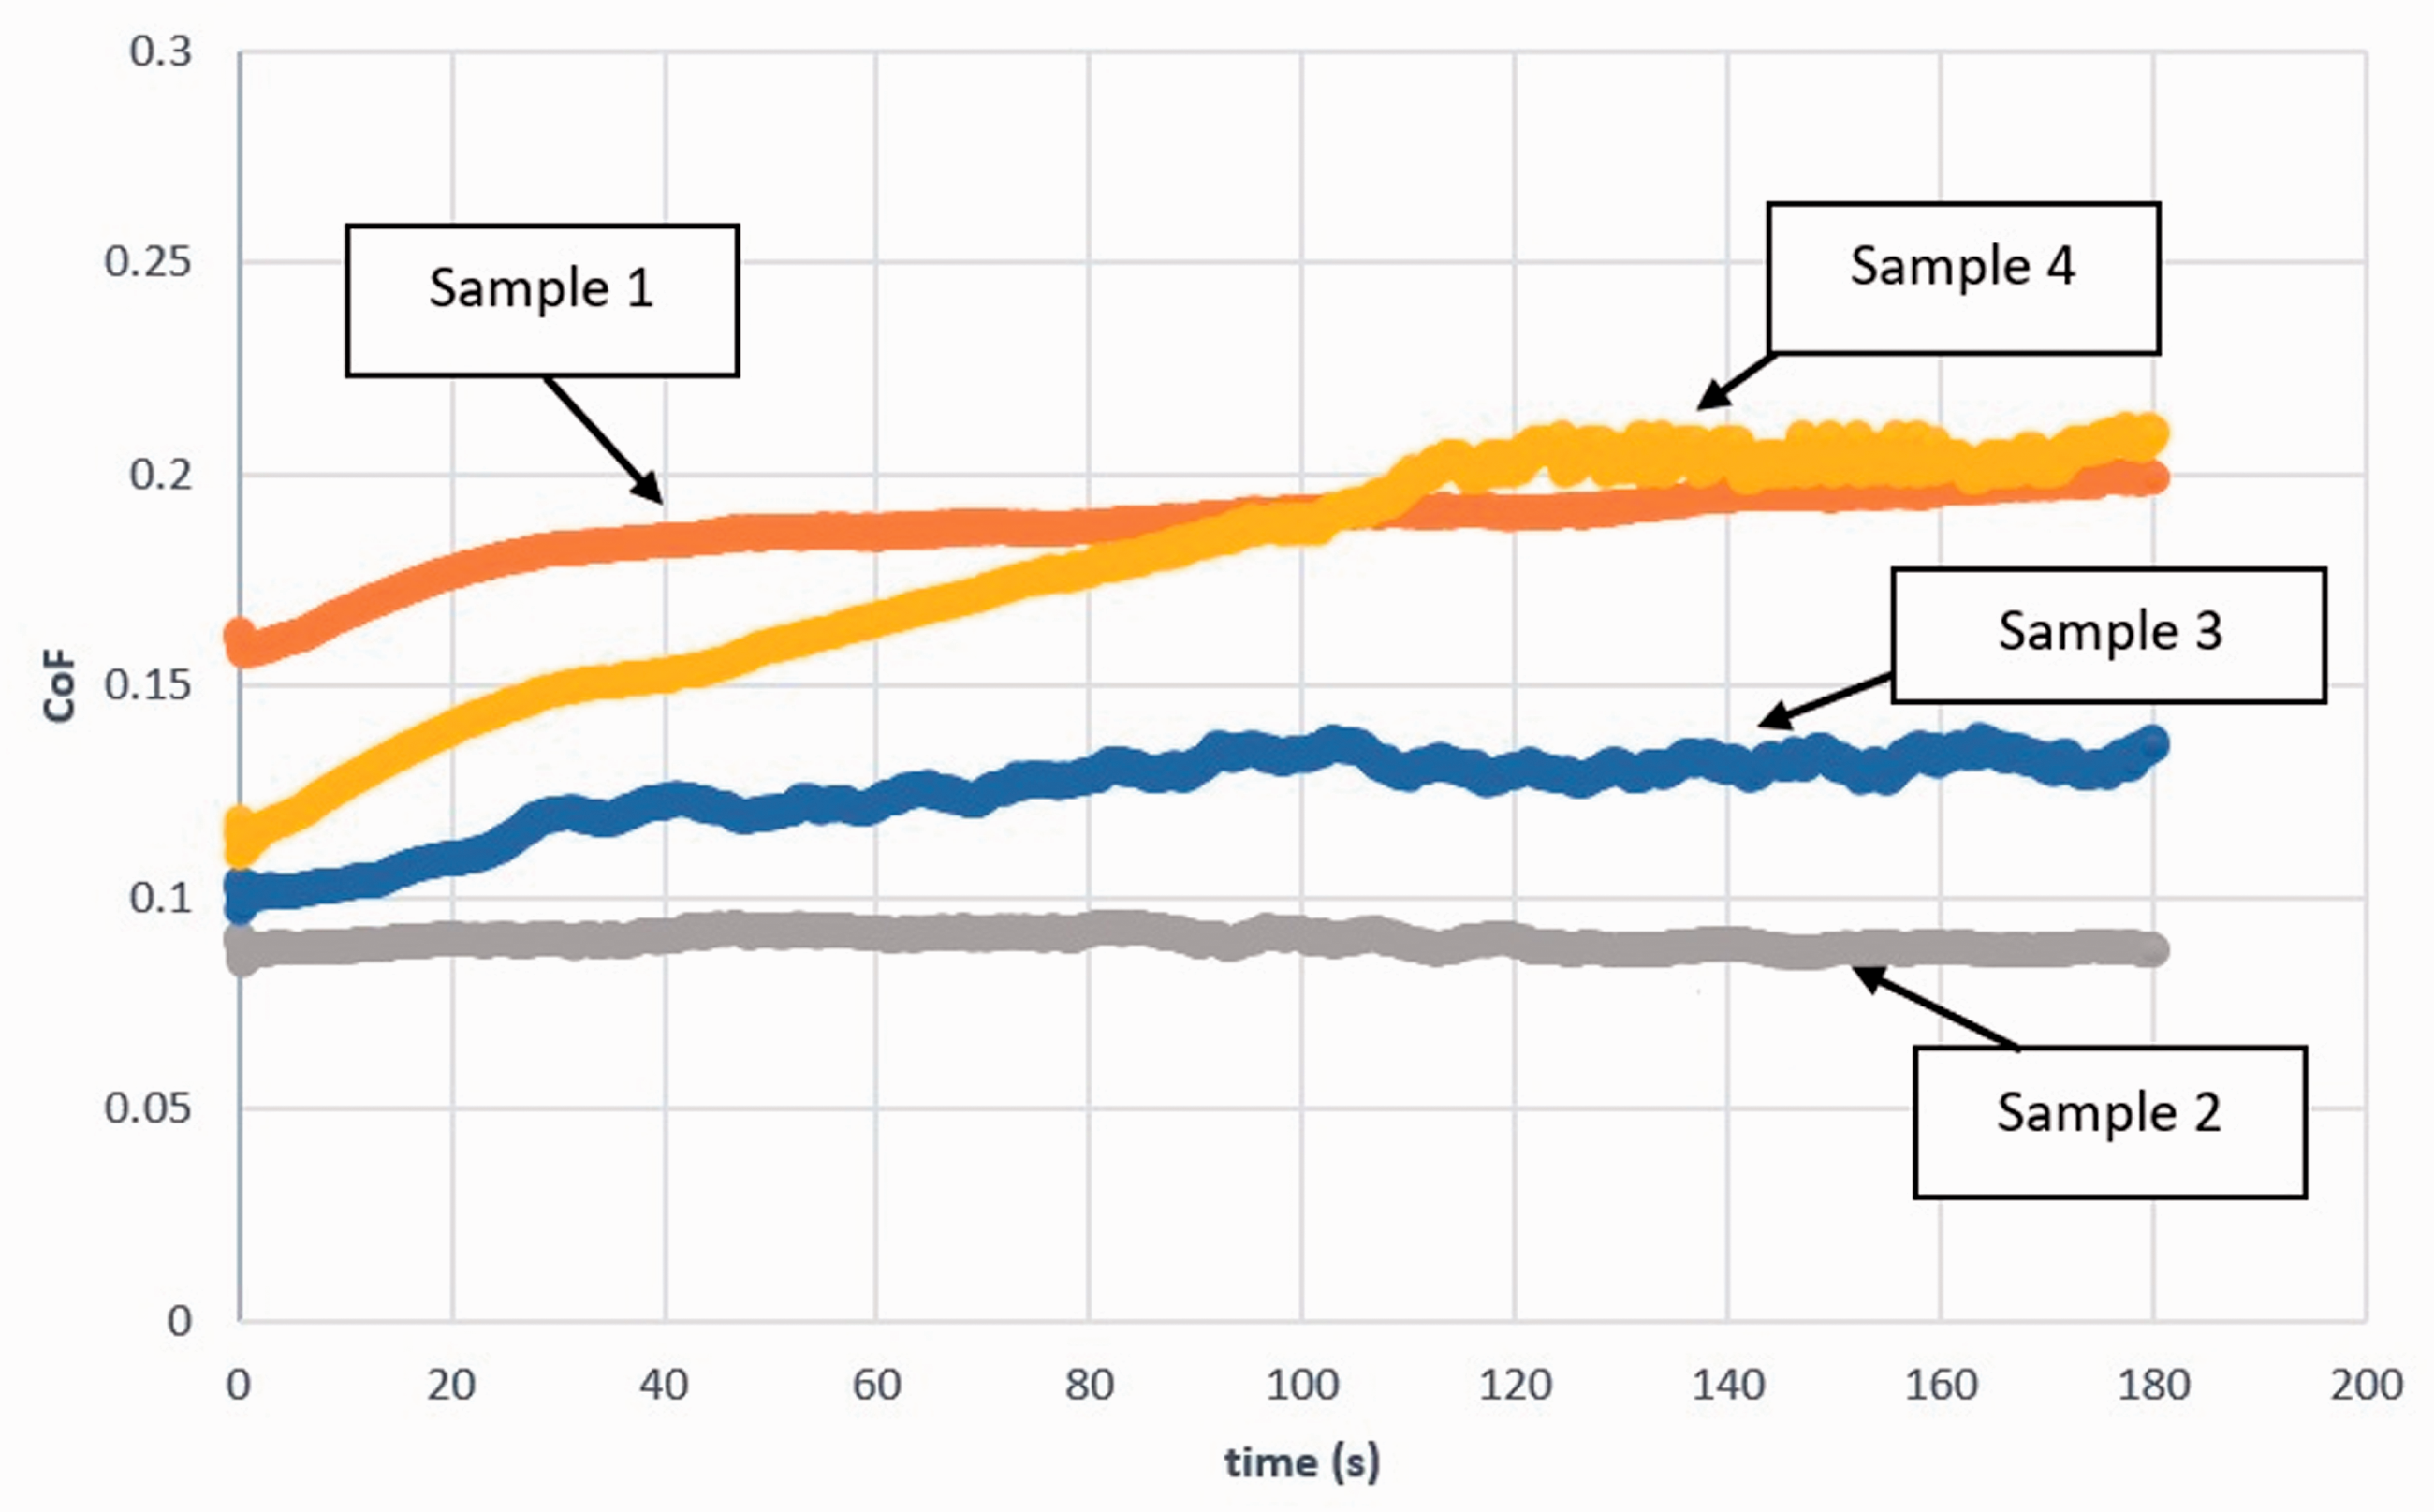
The CoF of the samples as a function of time (s) (
Sample 2 provided the most desirable friction, with a CoF of approximately 0.09. Sample 3 followed a similar trend to sample 2 although slightly larger fluctuations were present as the test continued, achieving a final CoF of 0.13. The highest amount of friction and abrasion was present in sample 4, which contained the most graphite content. Between 0–100 s of the test, the CoF increased rapidly from 0.13 to 0.20, before reaching a final steady state CoF value of 0.21. This figure shows that the optimum frictional performance does not belong to extreme values of graphite or MoS2. But, the desired performance can be achieved by specific combination of investigated elements which reveals the necessity of an optimisation process.
Figure 6 shows testing at a
The CoF of the samples as a function of time (s) (
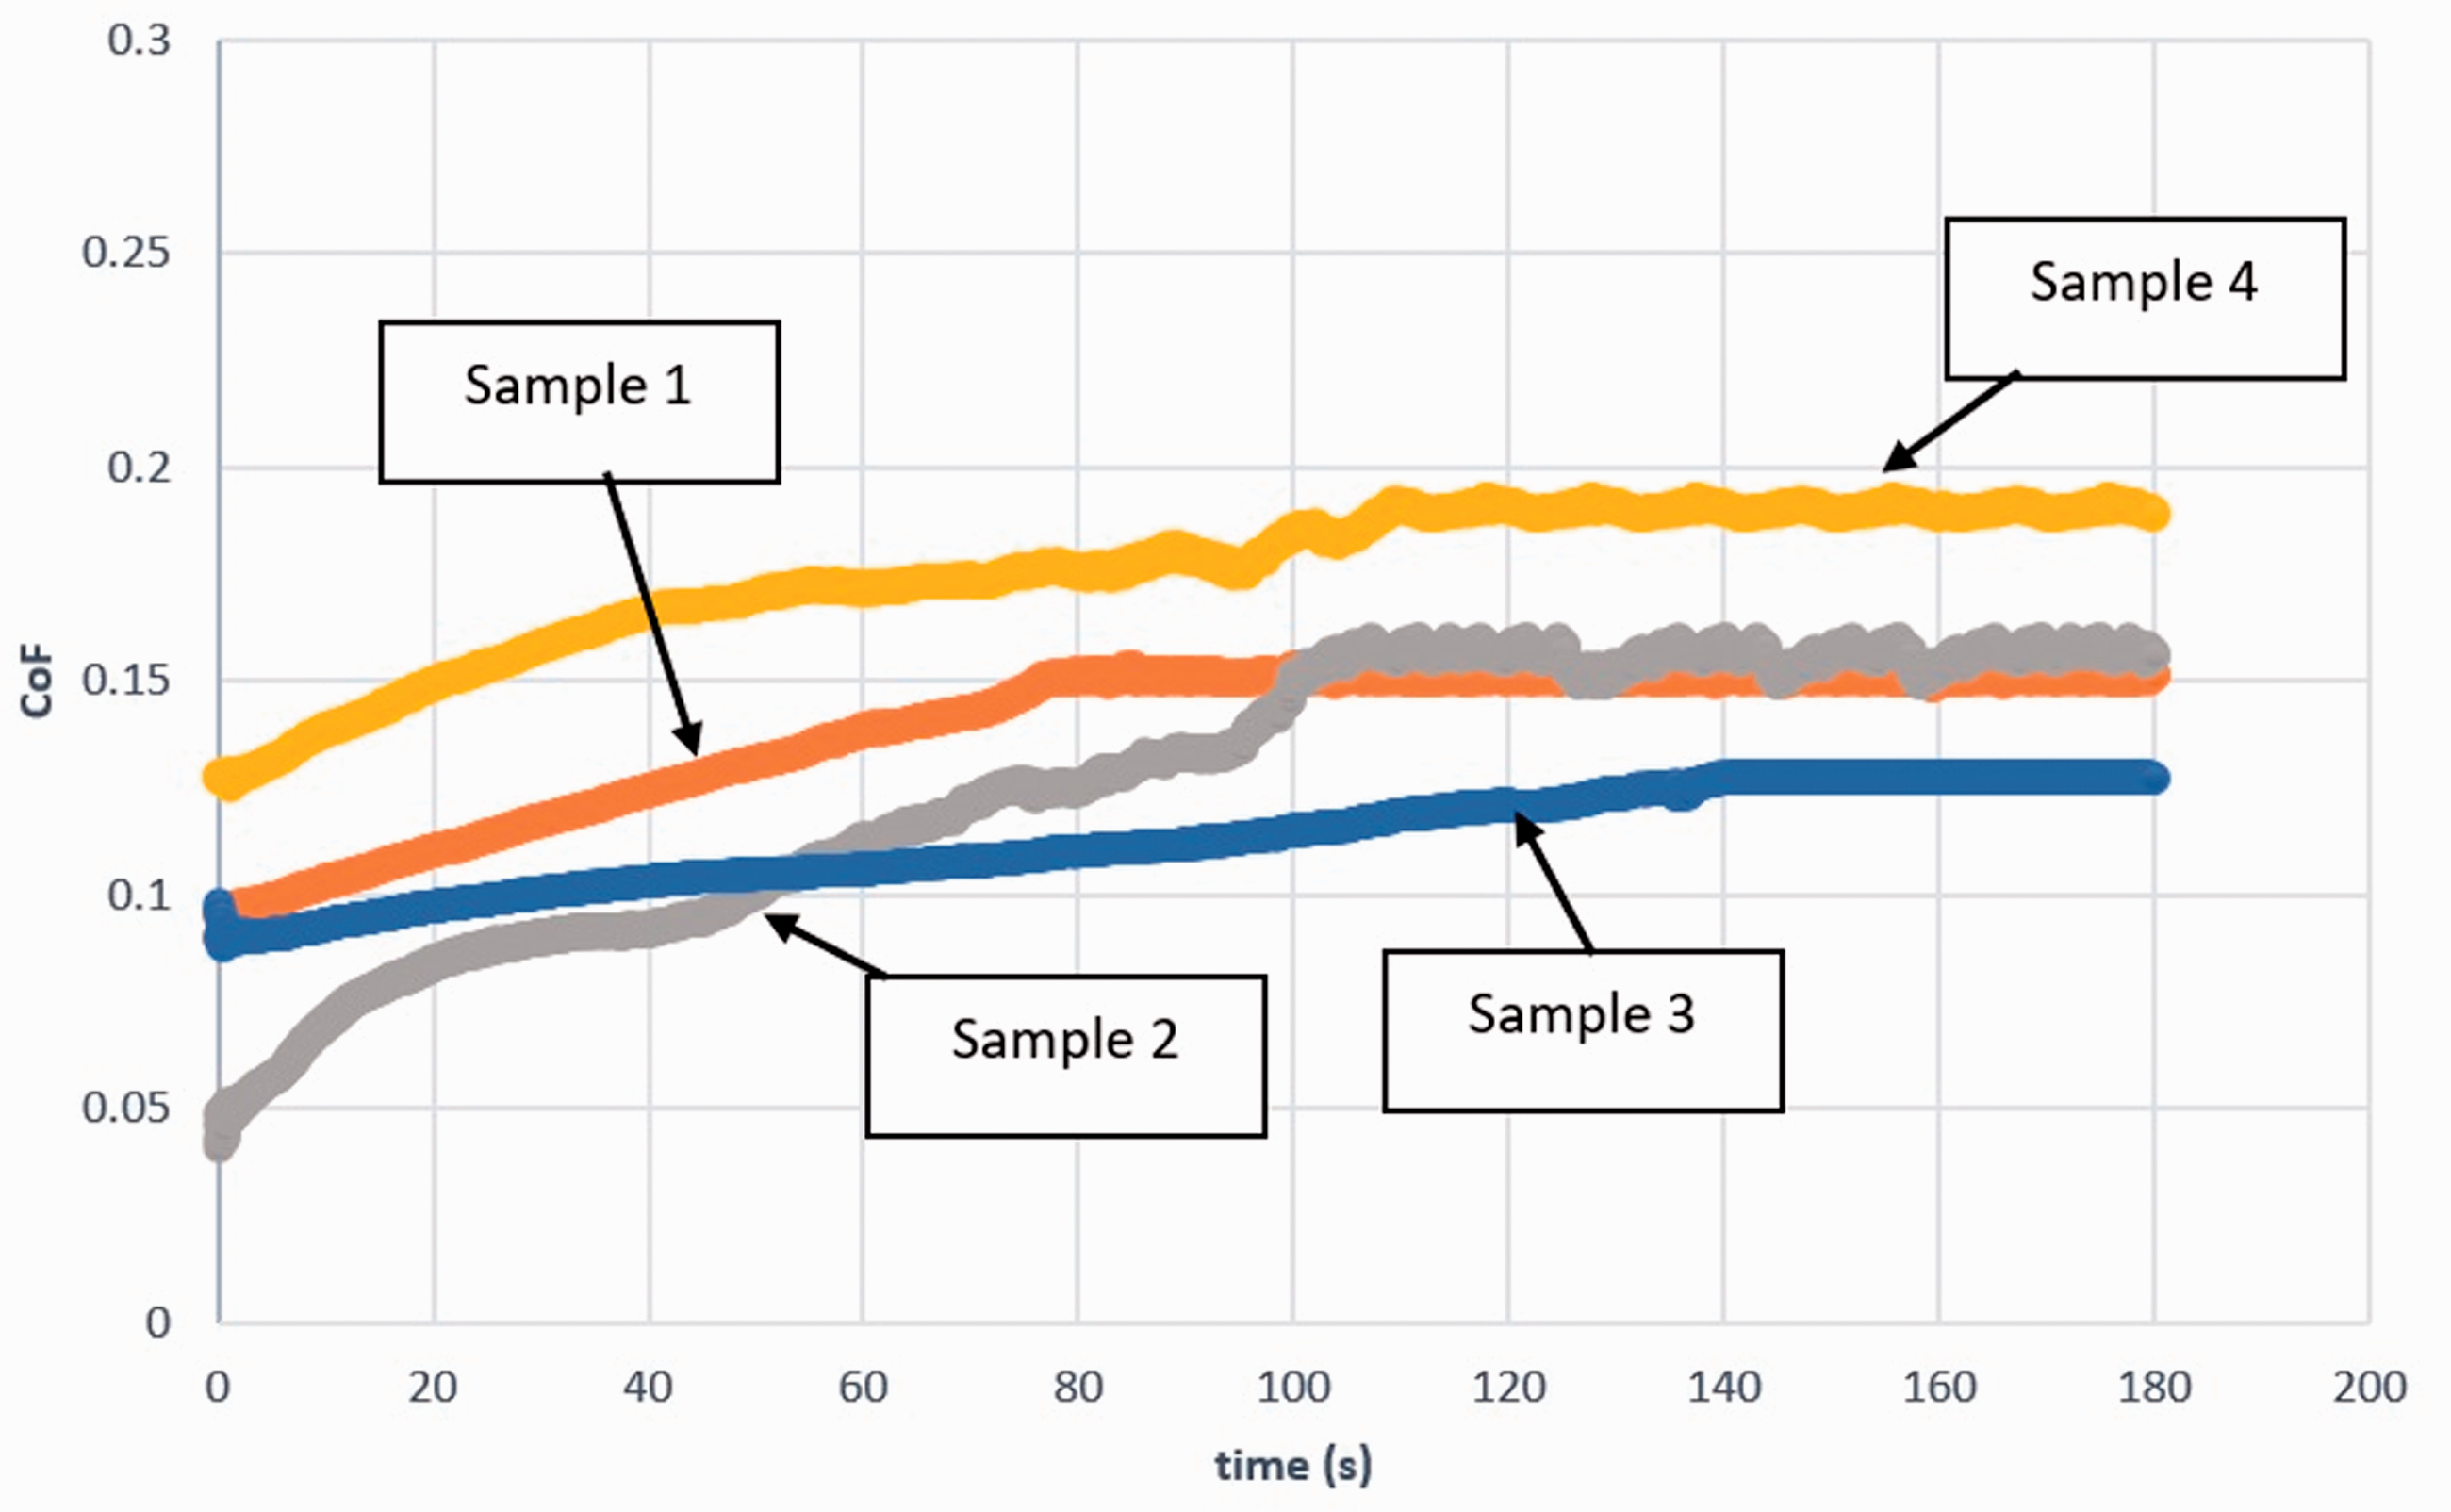
The CoF of the samples as a function of time (s) (
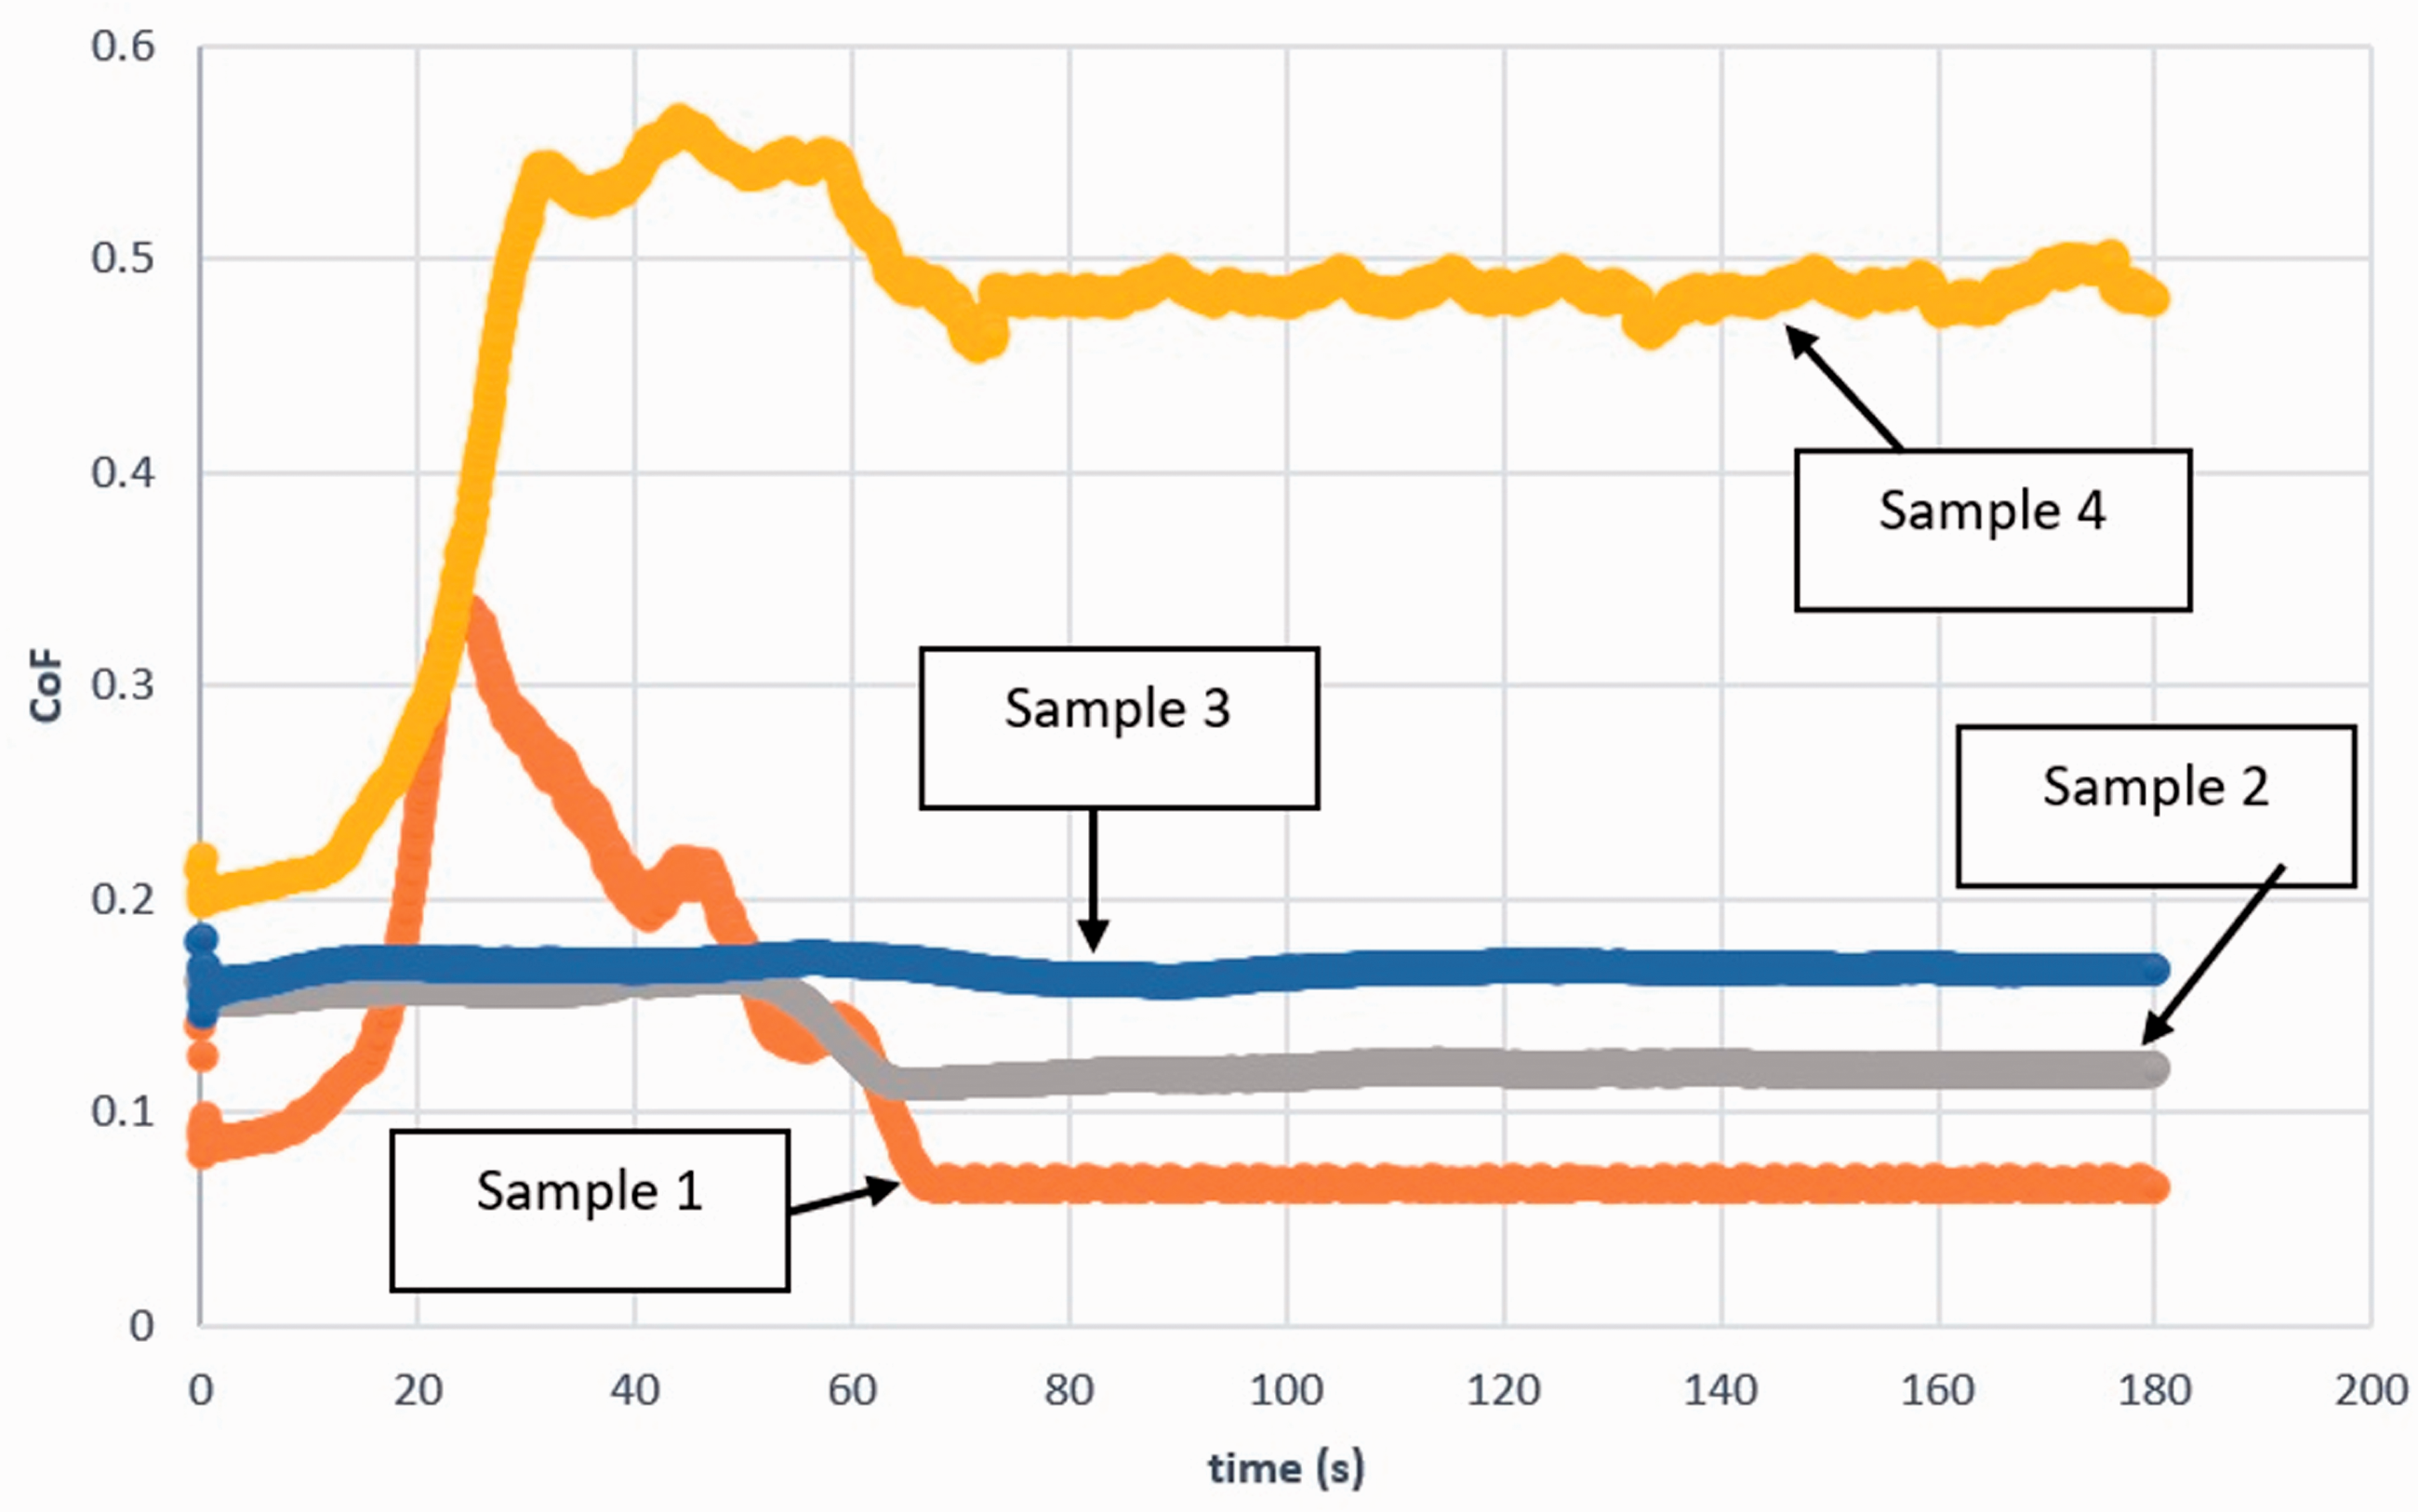
The CoF of the samples as a function of time for Lp = 5N and Vs = 2 m/s, (s).
Analysis of the samples under higher pin sliding speeds (
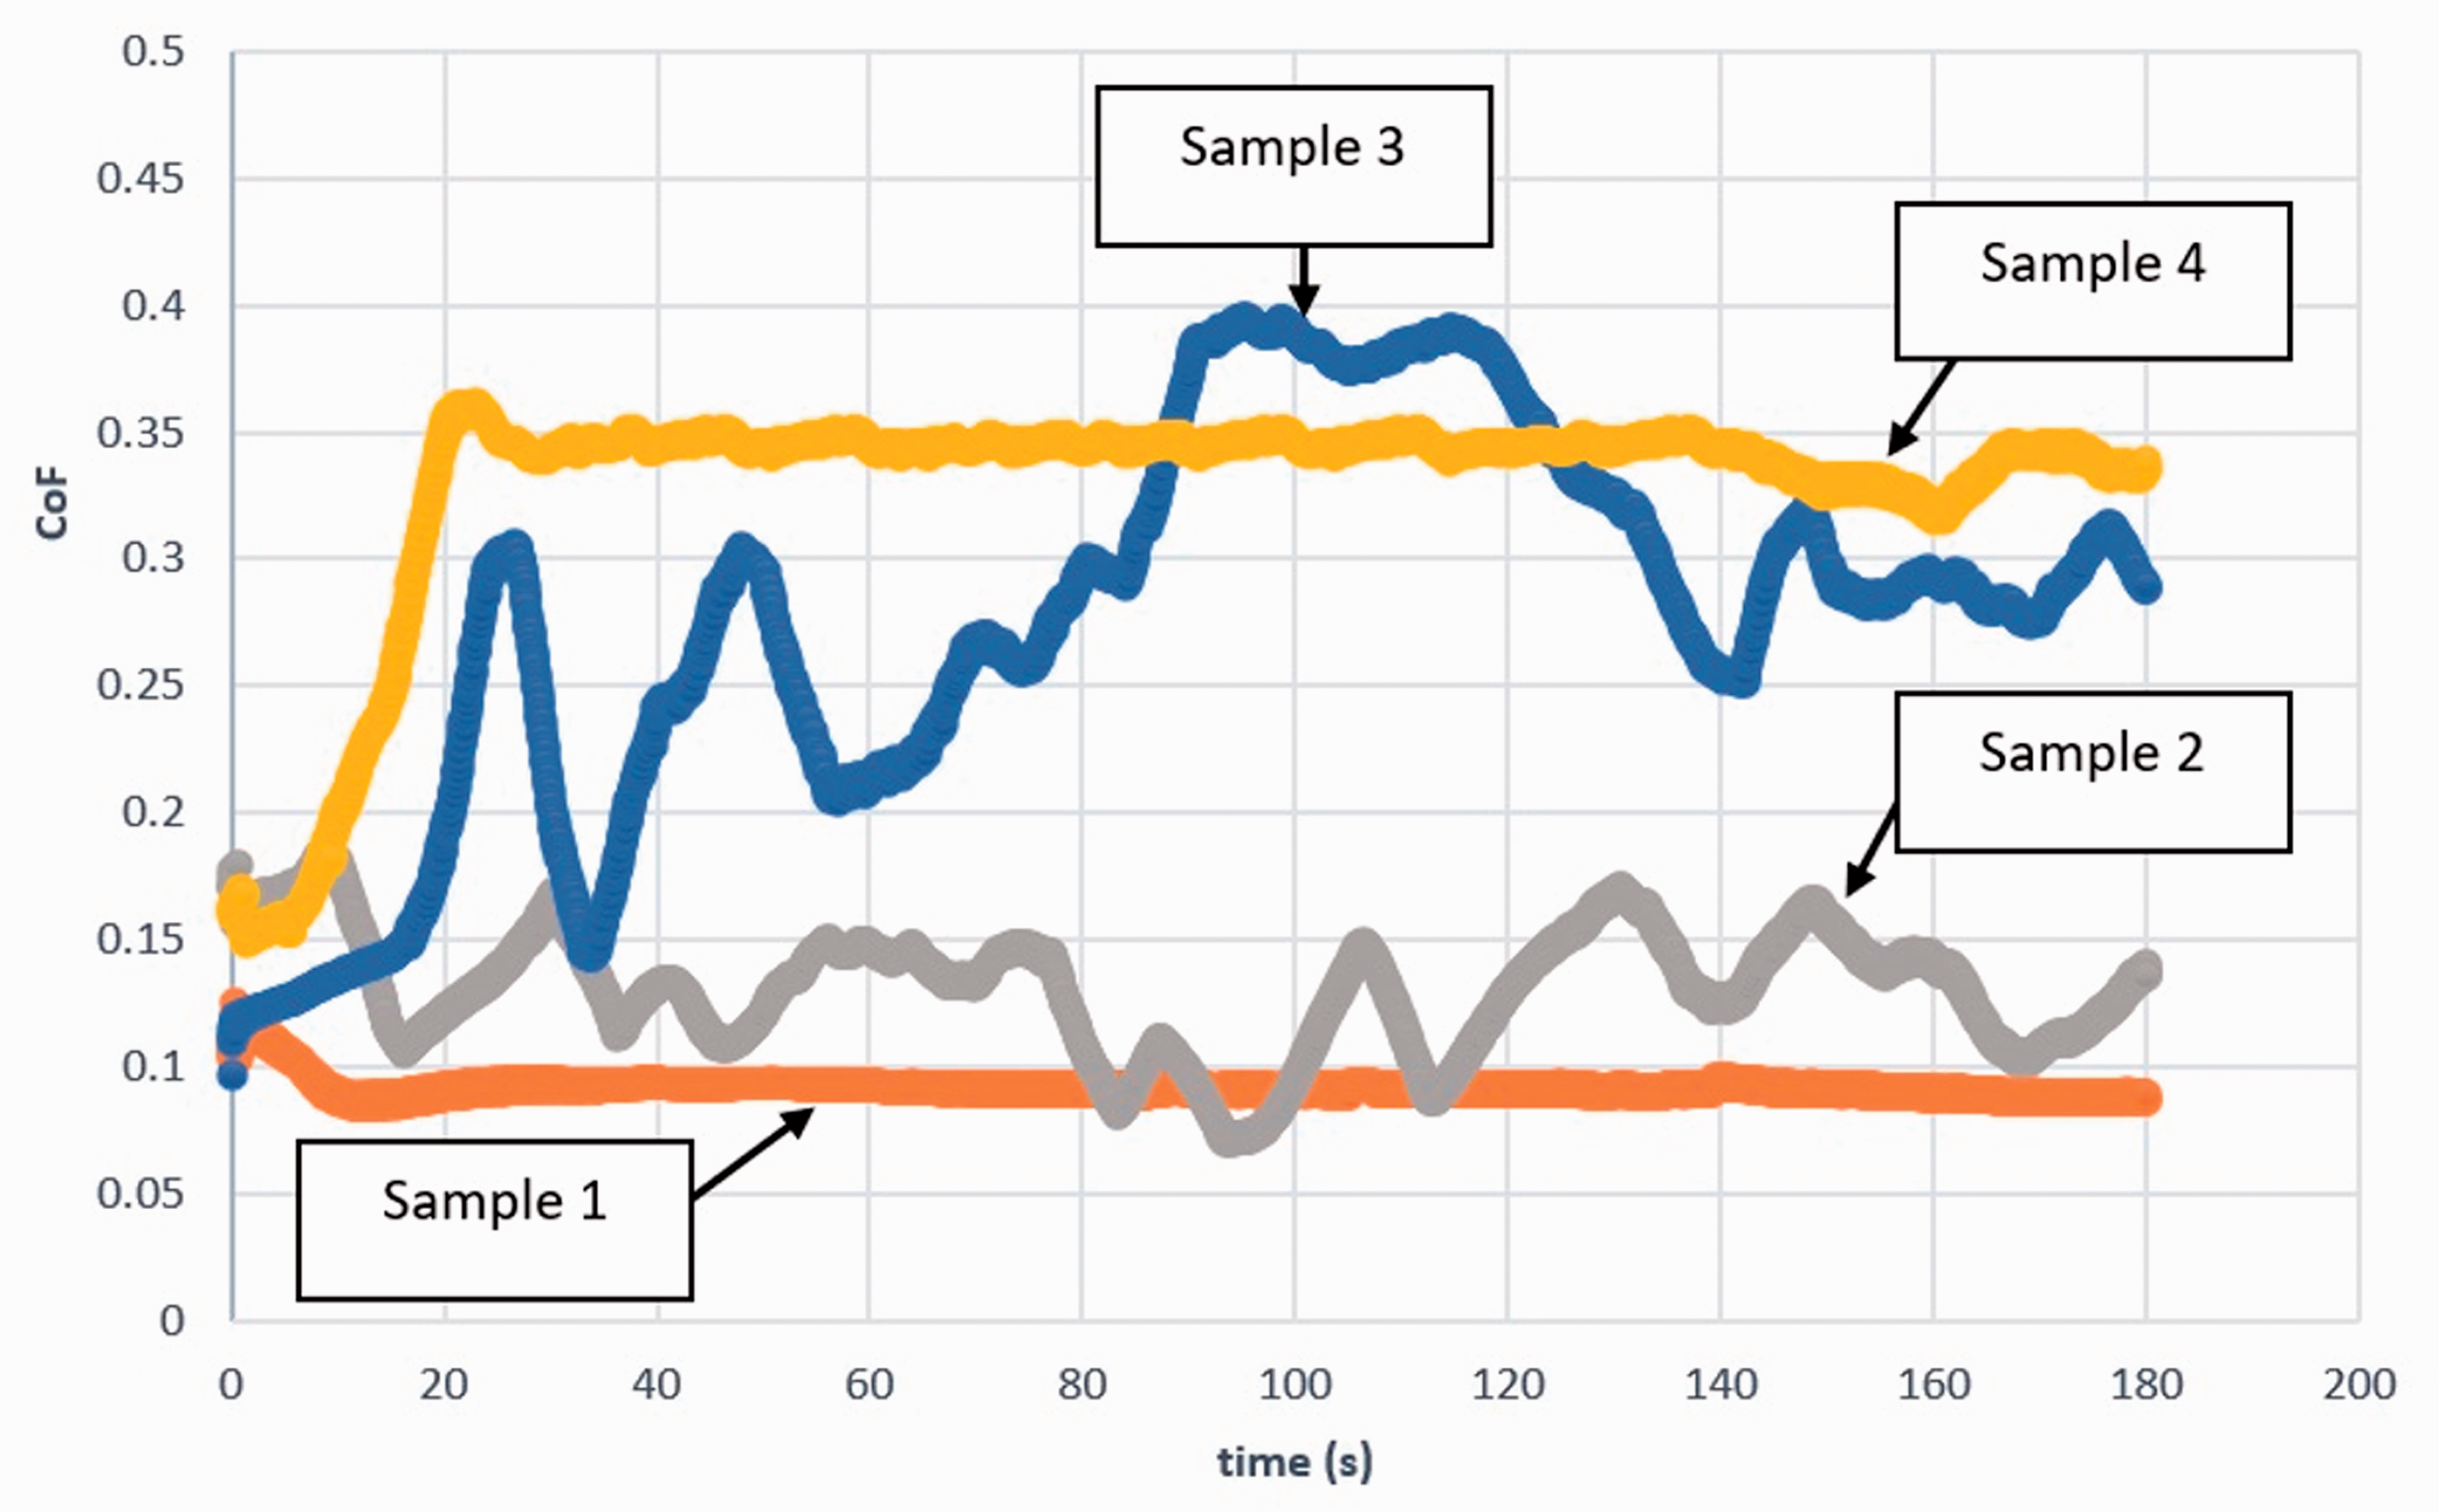
The CoF of the samples as a function of time (s) (
Final testing conditions were at the highest
The results obtained from the tribometer testing show that the frictional behaviour of each composition heavily depends on working conditions and load speed combinations. This shows the great potential of solid lubricants containing combinations of MoS2 and graphite. It is evident that the tribological performance of the proposed solid lubricants depends on the load-speed combination. The combination which proves to be optimum for one working condition is not essentially the best for other. This shows the necessity of optimising the lubricant composition for the application.
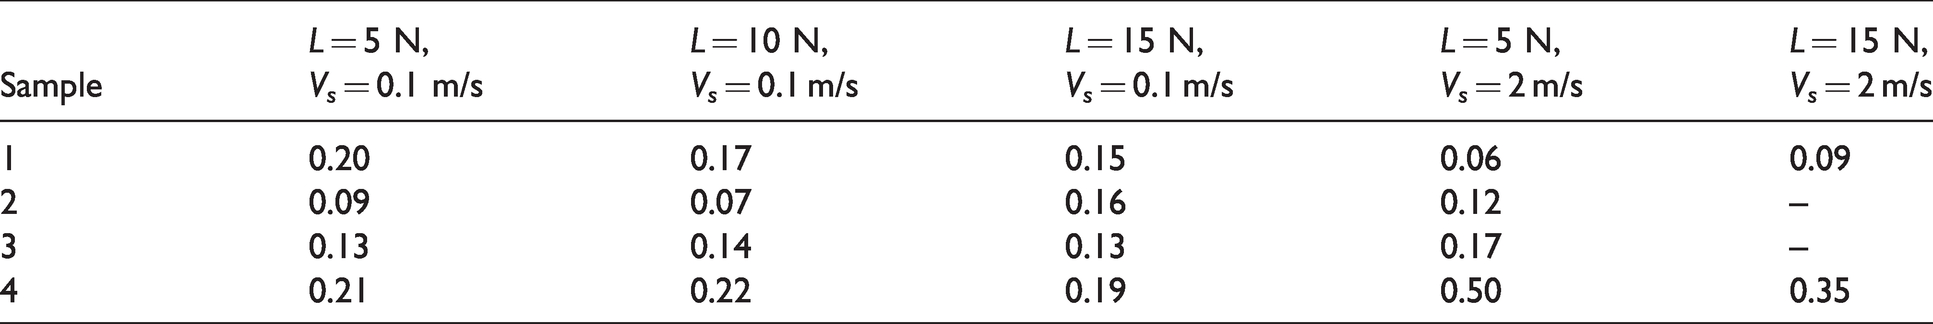
The results also show that the lubricants could be very attractive in manufacturing applications such as deep draw forming in reducing the friction between the different components. It is shown that the general trend throughout the different tests is that using highest content of graphite provided the most friction. With the common use of graphite lubrication in deep drawing, these results show that using a 75%–25% (sample 2) ratio of MoS2 and graphite provides lower CoF and could therefore be a better alternative lubricant for deep drawing. Table 4 summarises the key results from pin on disc tribometer experiments.
Summary of the steady state CoF of the samples for each pin-on-disc tribometer experiment.
Numerical results and discussion
Figure 10 shows deformation contours of the sheet component at times of 0.05, 0.1, 0.15 and 0.2 s. Results of test 2 from Table 3 are used to achieve these results. From Figure 10, it is evident that the magnitude of displacement increases after each time step due to the punch exerting a greater force as the duration of loading increases.
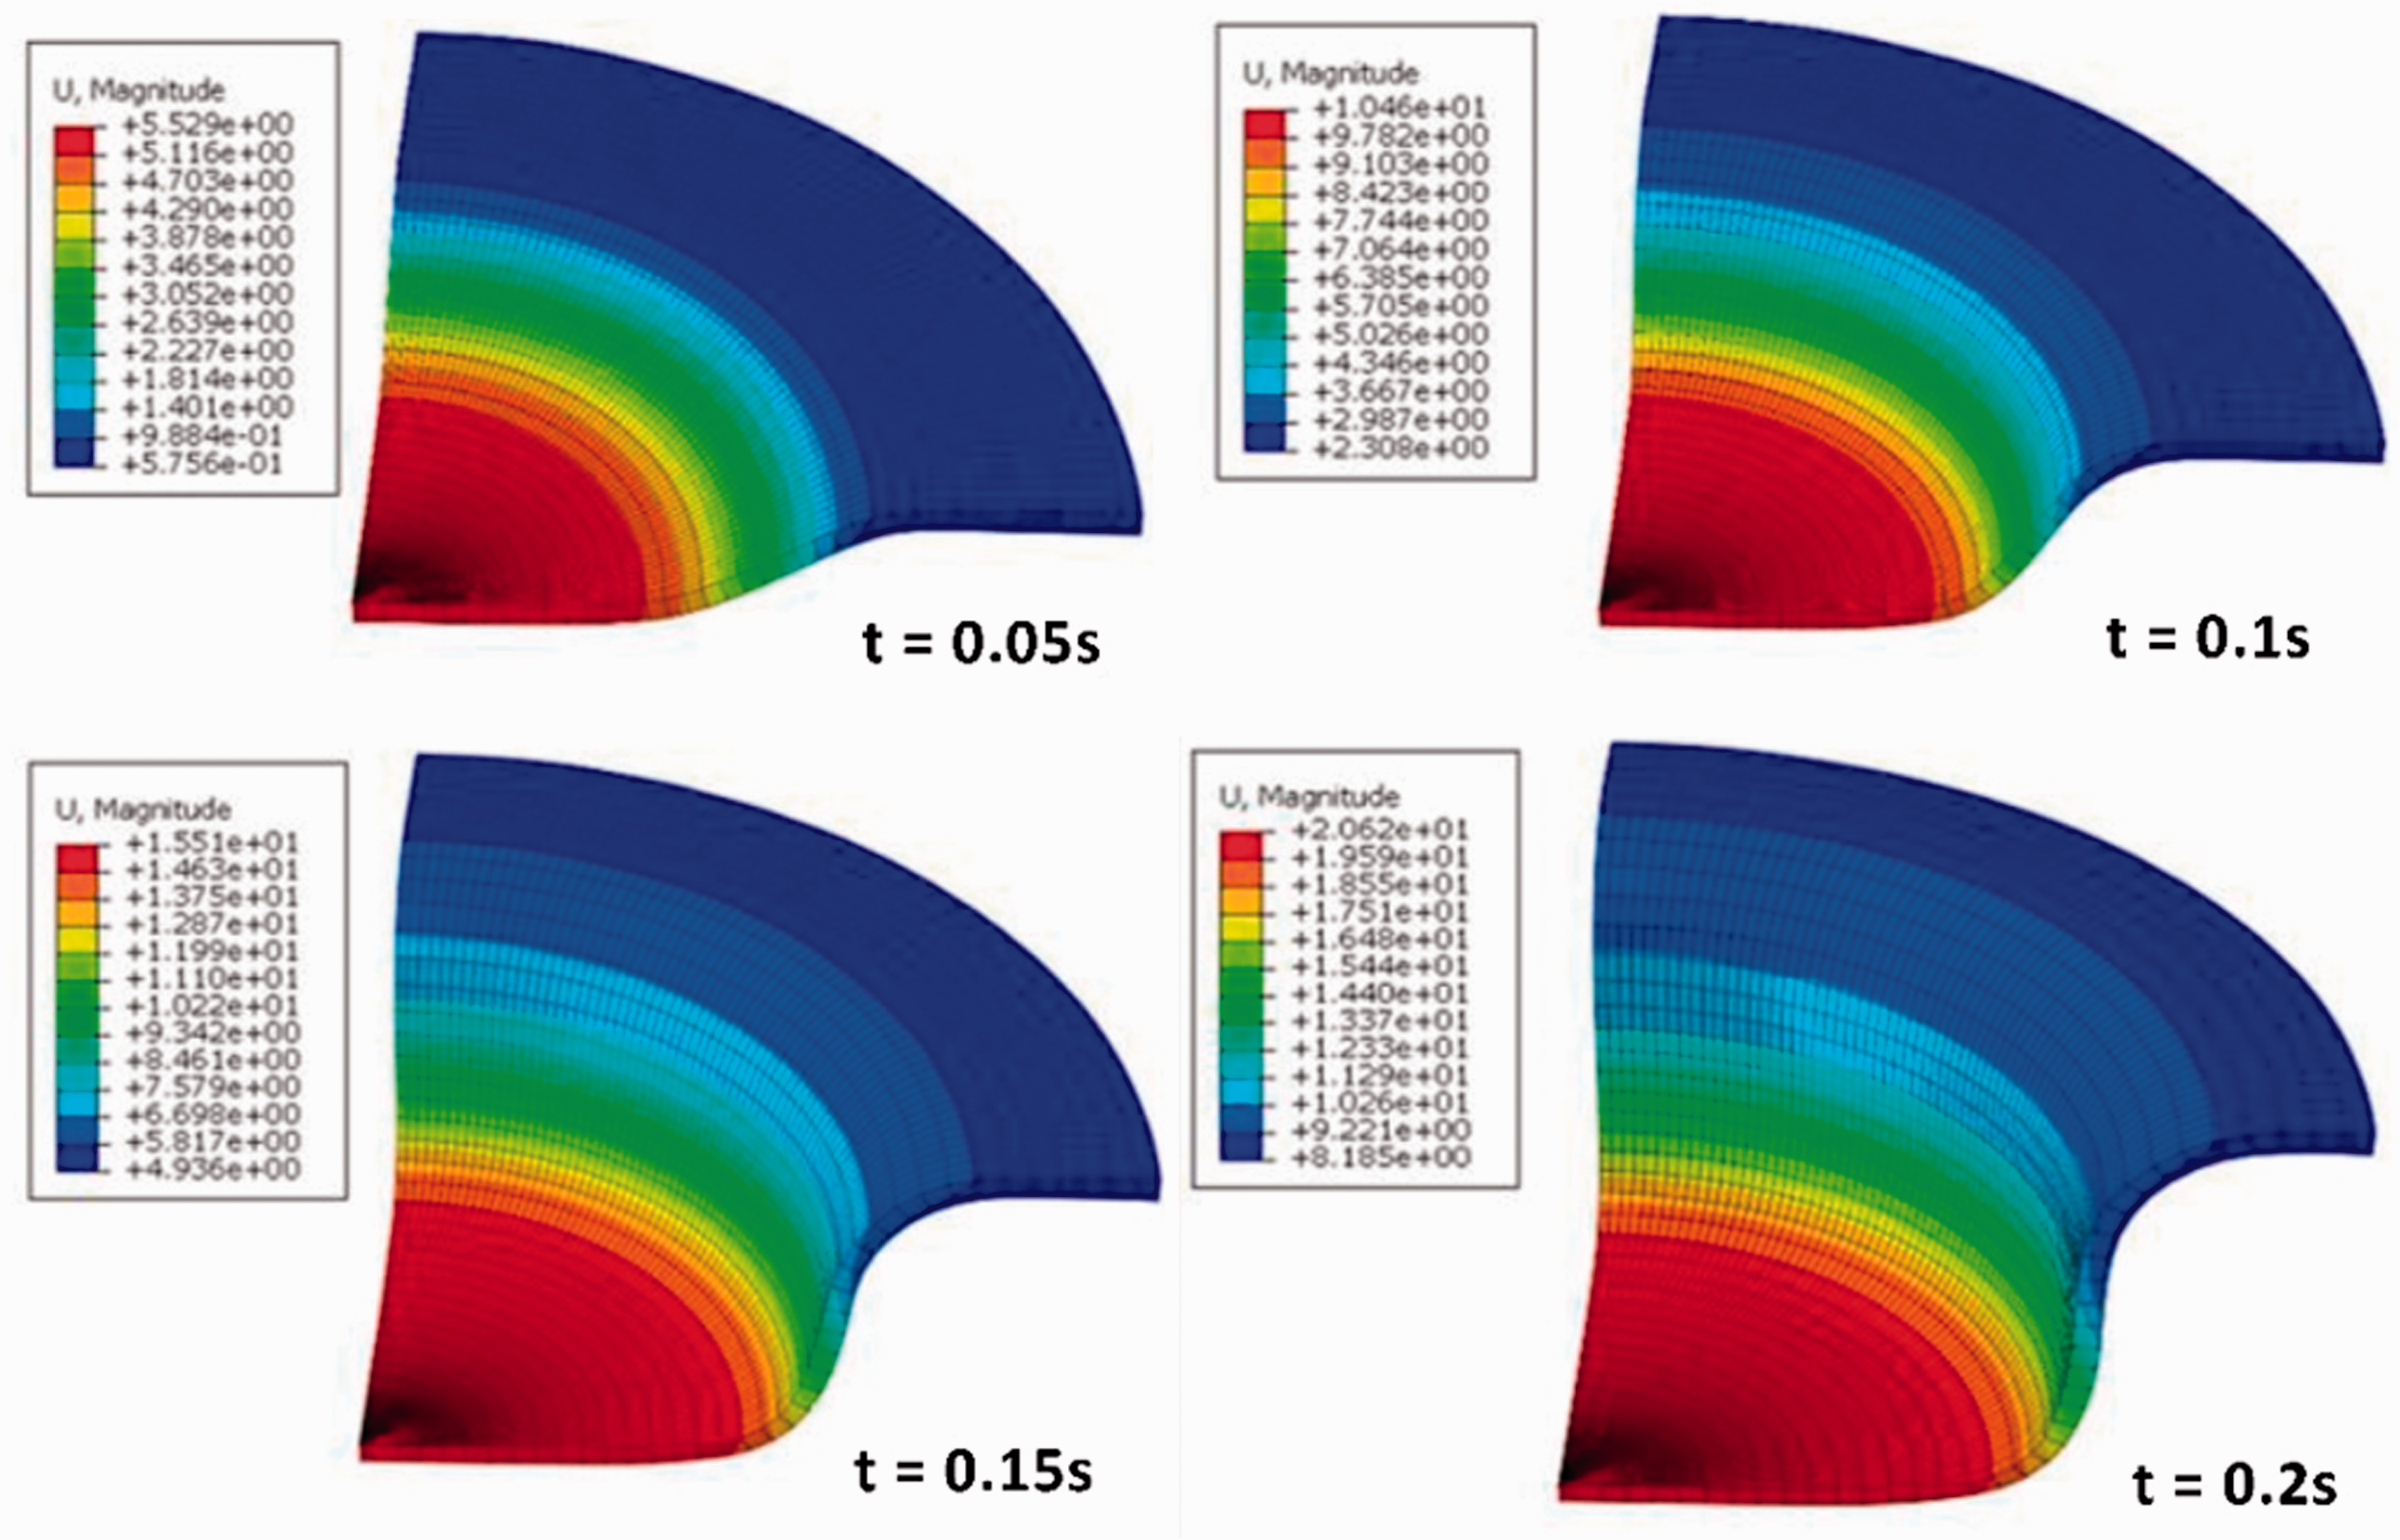
Deformation contours at time steps of 0.05 s, 0.1 s, 0.15 s and 0.2 s.
The contact pressures experienced on the sheet under similar conditions to Figure 10 are shown in Figure 11. In order to find the contact pressure, a path along an area of the sheet at which the punch was in contact with was generated. The contact pressures along this path were then obtained. As shown in Figure 11, pressures are in the range of 190–250 MPa for which shows that the contact conditions from pin on disc tribometer experiments (Table 3) are suitable for deep drawing.
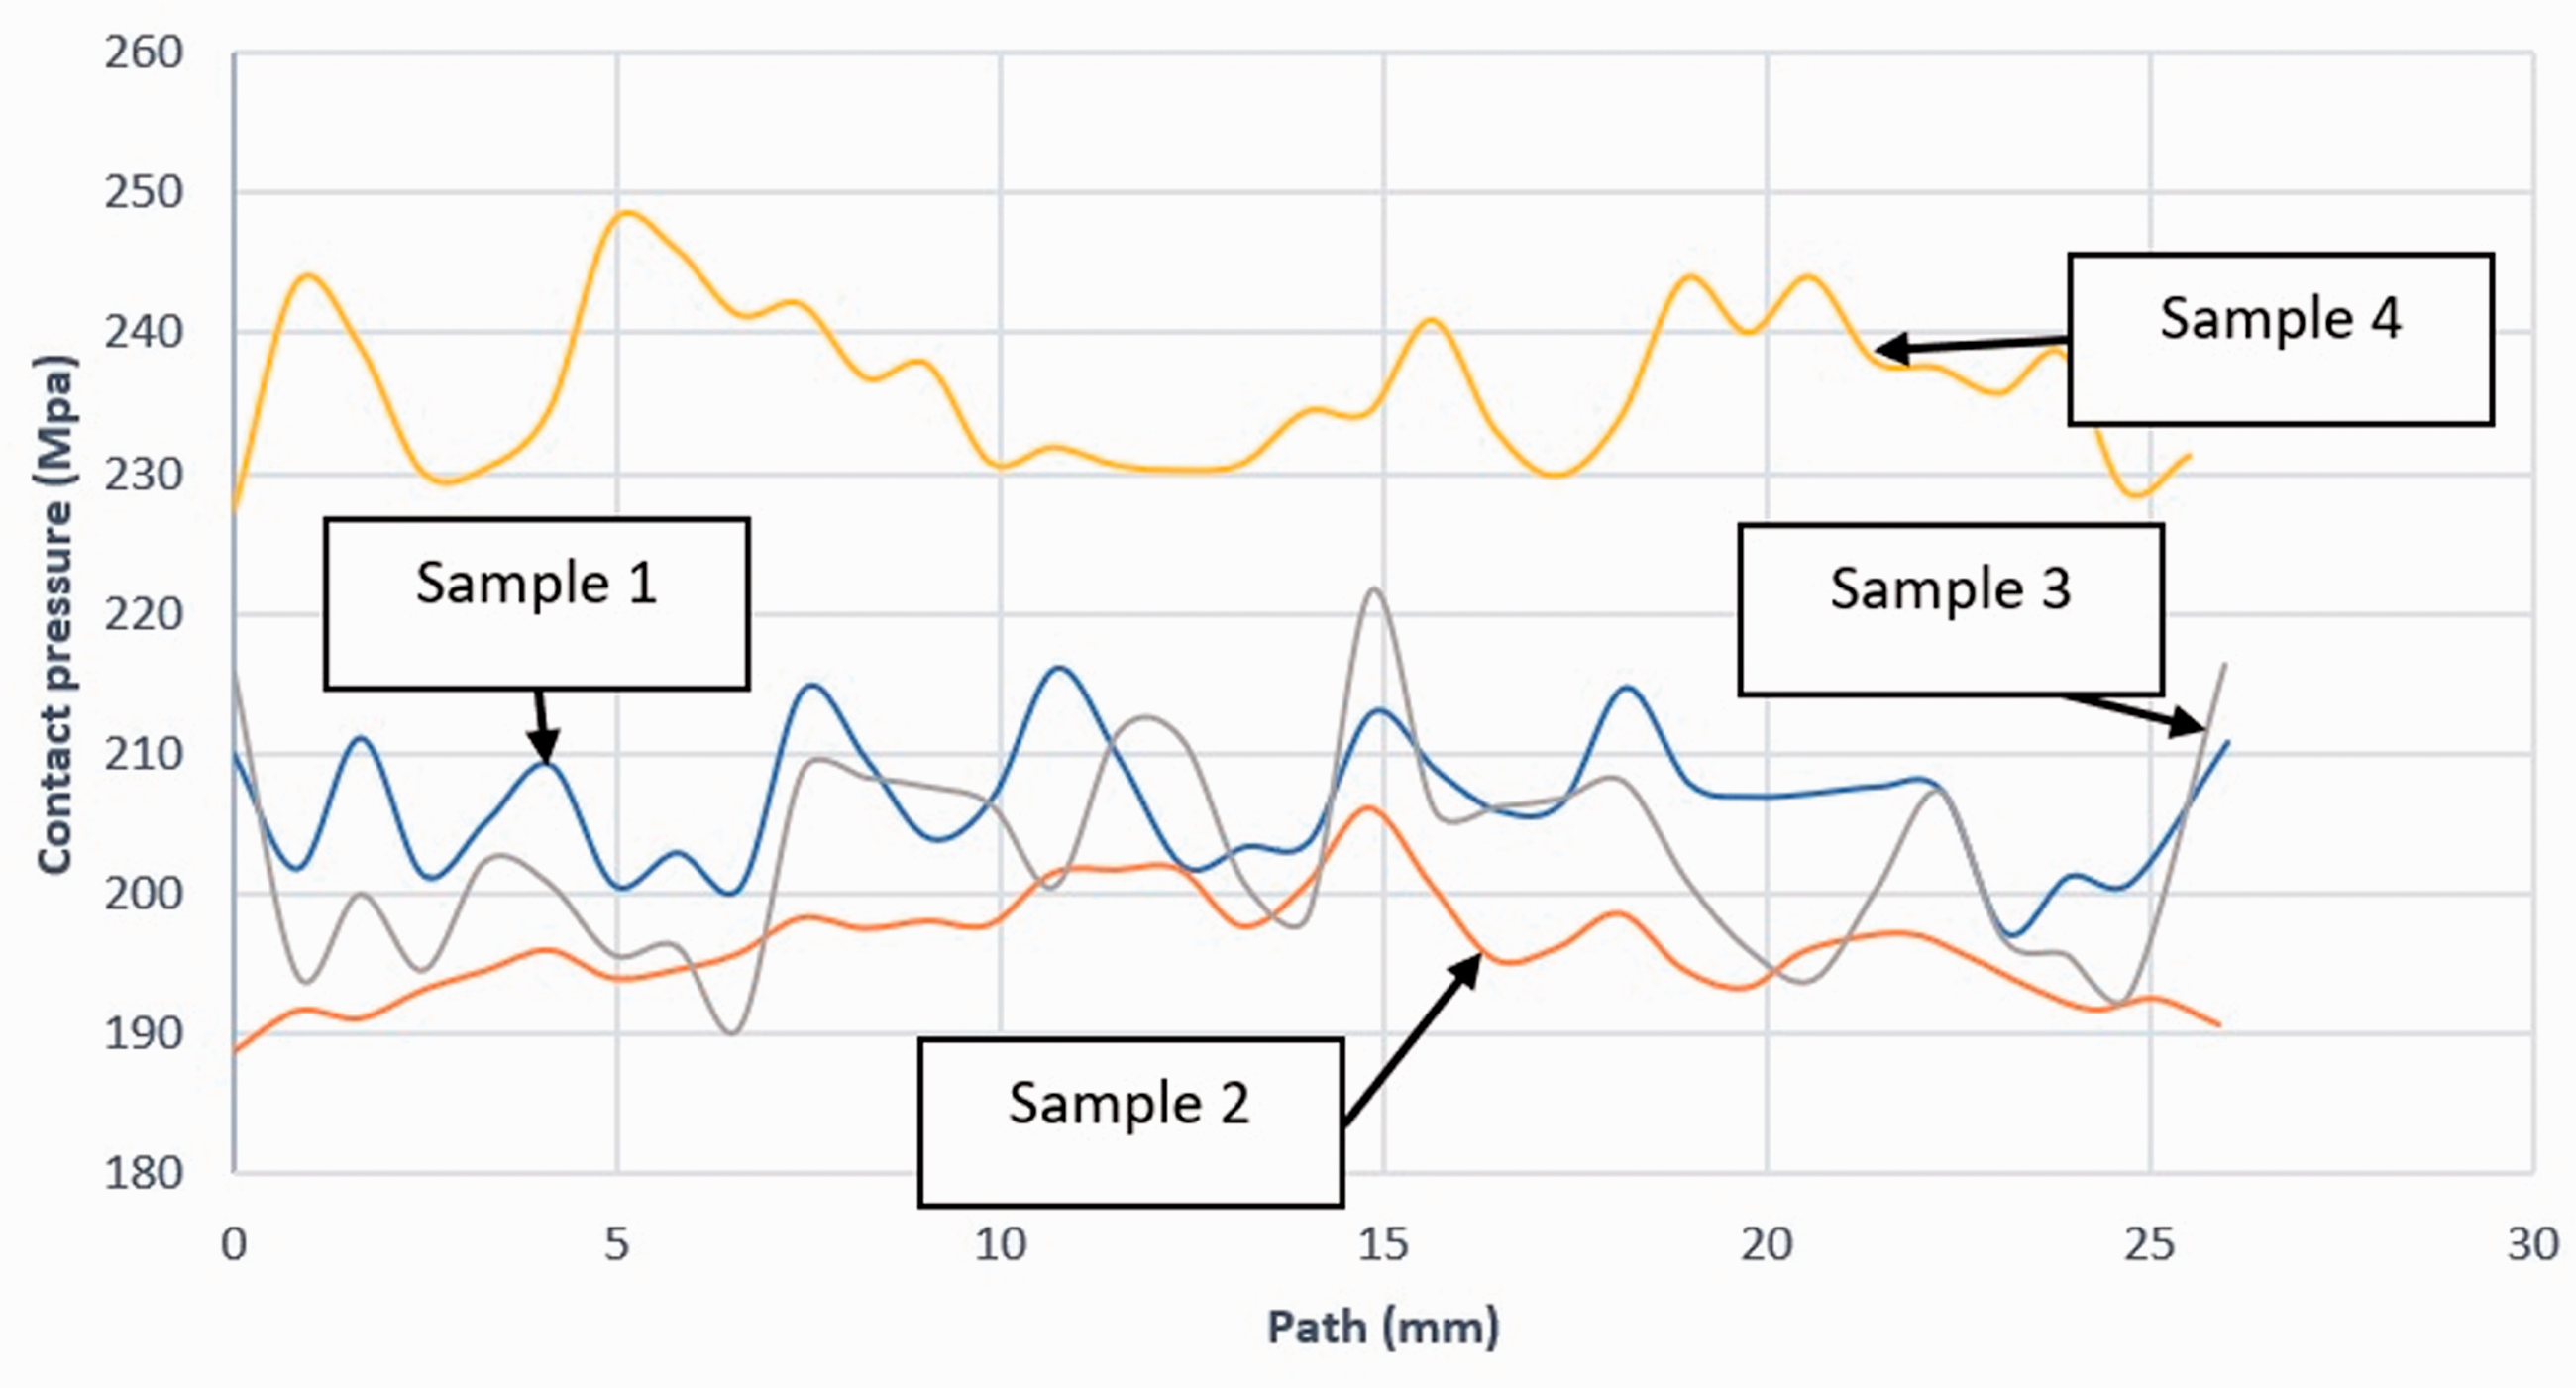
The contact pressures along the punch area of the sheet for samples 1–4.
Figure 12 shows the punching force vs simulation time for each sample, possessing a different CoF (recorded from pin on disc tribometer test 2). The general trend is that the punching force initially increases with simulation time before reaching a maximum punch force at approximately 0.2 s. As the CoF decreases, the maximum punch force required for forming is reduced. The significance of this reduction is shown in Table 5, illustrating the percentage reduction of maximum punch force of sample 2 in respect with each sample. As stated before, sample 2 contains a solid lubricant composition of 75%–25% MoS2- graphite, with the lowest CoF. The highest reduction is observed between samples 2 and 4 which is equivalent to 1968 N (24.6% reduction).
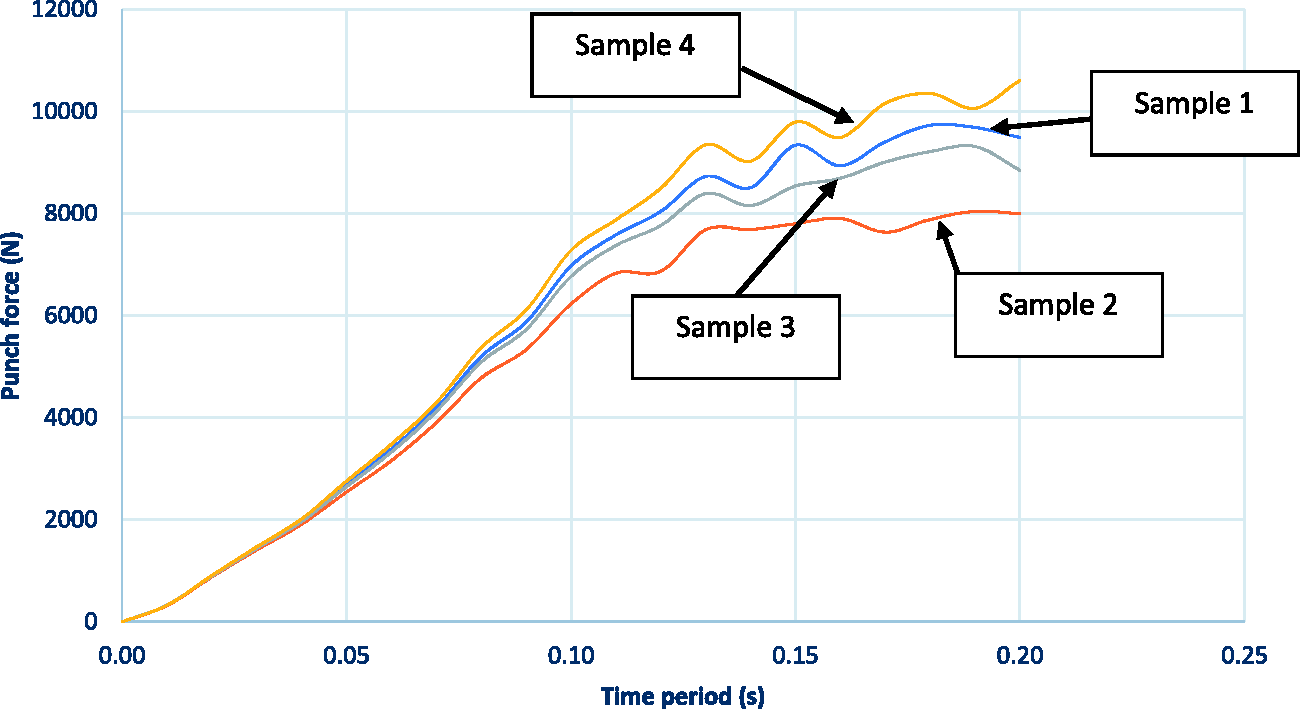
The changes in punching force vs. time for each sample.
Percentage reduction of maximum punching force with respect to sample 2.
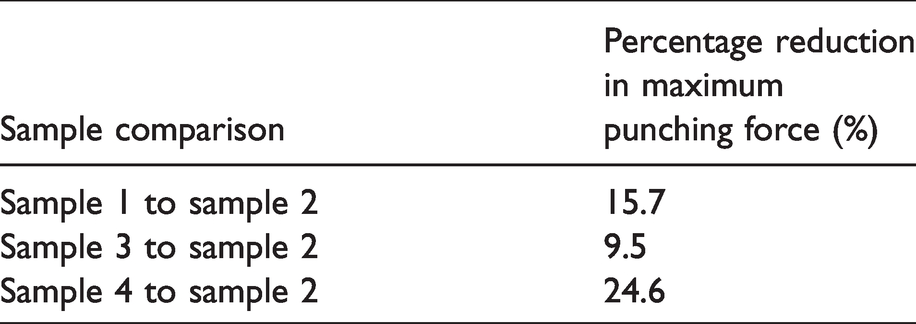
Figure 12 depicts the changes in the punching force against time. Considering the findings in Table 4 it is deduced that that the maximum punching force is significantly influenced by the CoF between the components. Sample 1, 3 and 4, with different lubricant composition possess CoF higher than sample 2, therefore will require greater punching forces, hence energy, to overcome the friction experienced. The higher friction conditions between the surfaces also causes inhomogeneous strain/stress distribution, which inversely affects the quality of the final component.
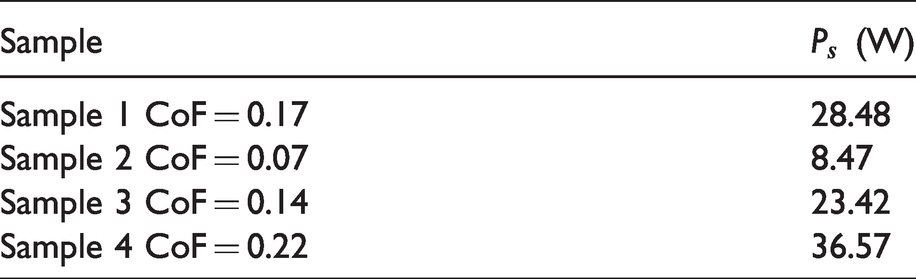
For each sample, the energy dissipated due to frictional losses is shown in Figure 13. The average power loss due to frictional energy can be calculated by first obtaining the area underneath each of the curves. Equation (6) shows the approximation used.
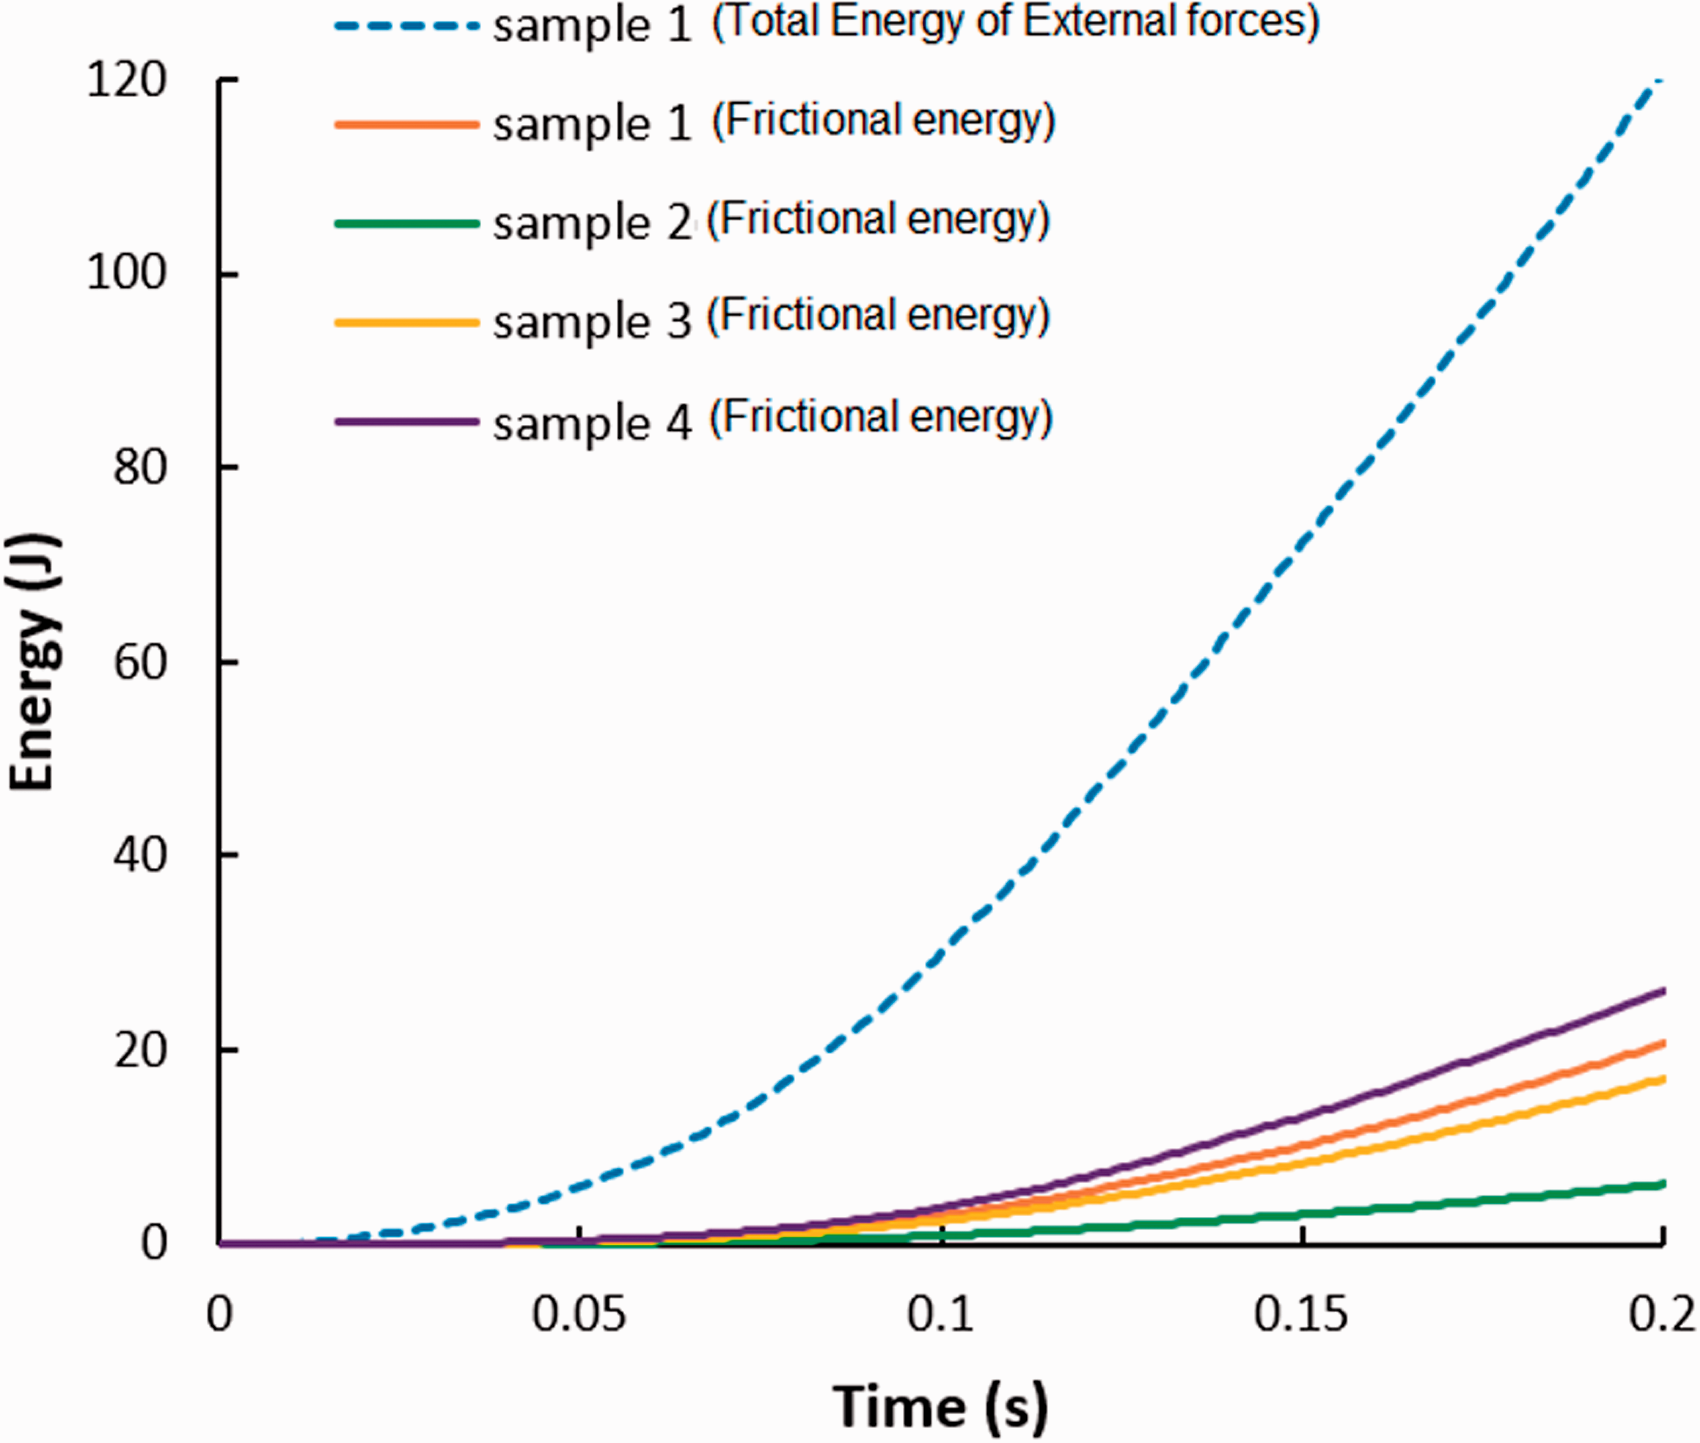
Frictional energy dissipation for samples 1–4.
By dividing the corresponding value (
Average power lost due to friction.
Conclusions
The effect of using molybdenum disulphide (MoS2) in combination with graphite on the punching force and energy efficiency of deep drawing process is investigated. The proposed combinations are characterised using a pin-on-disk tribometer. The results obtained are subsequently used in a FEA model to assess their effect on the efficiency of deep drawing process.
Results show that using the proposed combination has significant effect and would provide greater process efficiency. It is revealed that there is an optimum combination of MoS2 and Graphite, proving the most optimum outcome. Using the optimum combination can provide up to 24% reduction in the required punching force as well as up to 75% reduction in the average power loss.
Footnotes
Declaration of Conflicting Interests
The author(s) declared no potential conflicts of interest with respect to the research, authorship, and/or publication of this article.
Funding
The author(s) received no financial support for the research, authorship, and/or publication of this article.