
Abstract
Manufacturing process constraints and design complexities are the main challenges that face the aftermarket automotive industry. For that reason, recently, selective laser melting (SLM) is being recognised as a viable approach in the fabrication of injection moulding tool inserts. Due to its versatility, SLM technology is capable of producing freeform designs. For the first reported time, in this study SLM is recognized for its novel application in overcoming fabrication complexities for prism shaped topology of a vehicle headlamp’s reflector injection moulding tool insert. Henceforth, performance measures of the SLM-fabricated injection mould tool insert is assessed in comparison to a CNC-milled counterpart to improve quality characteristics. Tests executed and detailed in this paper are divided into two stages; the first stage assesses both fabricated tool inserts in terms of manufacturability; the second stage assesses the functionality of the end-products by measuring the surface roughness, dimensional accuracy and light reflectivity from the vehicle reflectors. The results obtained show that employing SLM technology can offer an effective and efficient alternative to subtractive manufacturing, successfully producing tool inserts with complex surface topology. Significant benefits in terms of surface roughness, dimensional accuracy and product functionality were achieved through the use of SLM technology. it was concluded that the SLM-fabricated inserts products proved to have relatively lower values of surface roughness in comparison to their CNC counterparts.
Keywords
Introduction
Injection moulding within the automotive industry is mostly employed in the production of spare parts. In order to sustain a competitive advantage, companies opt to employ the latest technologies for producing injection moulding tools in manufacturing. In recent years, additive manufacturing (AM) technologies have been acknowledged for the increased diversity of applications ranging from aerospace, automotive, medical, and consumer products.1,2 Townsend et al. 3 highlighted the limitation of subtractive manufacturing methods when it comes to the creation of complex features due to restrictions in the tool path. AM technologies on the other hand facilitate fabrication of geometrically complex components and freeform designs directly from 3D CAD models.4,5 Smith et al. 6 discussed feature size capabilities and geometry and their dependence on the type of material and the AM technology adopted. Kerbrat et al. 7 proposed a methodology that assessed manufacturing complexity of both subtractive and additive approaches for the manufacturing of moulds, providing a comprehensive analysis of which areas may be machined or manufactured by an additive process. Ahn 8 reviewed various laser assisted metal rapid tooling processes such as selective laser melting SLM, and research work related to the application of these processes to manufacture molding and forming tools.
Typical AM-produced components require post-processing for surface finish improvement.9,10 Surface finish and dimensional accuracy are two major limitations of AM processes. 11 Flynn et al. 12 discussed that limitations of powder bed fusion processes are component resolution, poor surface quality (caused by staircase effect), lack of uniformity in material and mechanical properties. Therefore, post-processing is necessary to accomplish the desired properties. Subtractive processes have been extensively used to achieve better geometric accuracy and surface quality for near-net parts such as moulds. 13 Flynn et al. 12 reviewed the three main categories of finishing an AM metal component, namely: machining and mechanical conversion, thermal processes, and chemical and electrochemical processes; clearly emphasising the significance of build orientation and direction. Tay and Haider 14 were able to improve surface roughness of AM components using electroless nickel plating without affecting the dimensional accuracy. In the work of Bai et al. 15 a series of post-processing analyses have been conducted to optimise the SLM fabricated samples to achieve improved material properties and machinability for additively manufactured metal alloys. Kaynak and Kitay 16 recommended the use of drag finishing and vibratory surface finishing techniques for post-processing AM-fabricated parts. Currently these processes are being used by several industries to improve surface aspects of conventionally manufactured metal parts and tools with complex shape and geometries. Therefore, as such these processes are believed to be ideal for post-processing additive manufacturing components with complex geometries.
SLM is thought to be the most versatile and widely used powder-bed-fusion process using a laser beam that melts powder grains and fuses them together. 17 One of the main advantages of using SLM technology is the increased functionality. 10 Mahshid et al. 18 reviewed that due to advancements in material development, metallic parts are manufactured using the SLM technique which is ideal for injection moulding. Former studies compared subtractive manufacturing processes with AM technologies for automotive applications. Kerbrat et al. 19 appraised results when using AM for tooling applications in terms of lead-time and cost compared to electro-discharge machining processes. AM tolerances and overall quality were considered equivalent to subtractive methods. Junker et al. 20 affirmed the use of additive manufacturing for the production of moulds for injection moulding, while debating that the technology may be adopted to improve the forging tool production. However, Karunakaran et al. 21 stated that rapid tooling is still limited to manufacturing prototypes with generally non-metallic materials. Lupeanu et al. 22 examined rapid tooling advantages when developing a highly complex surface feature of a mould and how it was difficult to manufacture using conventional machining technologies. Previous successful studies were reviewed by 23 for low volume production of injection mould tooling. Kashouty et al. 24 presented a comparative study to assess additive and subtractive manufacturing technologies through fabricating injection mould tool inserts that produced 500 injections. More studies have been carried out by Kashouty et al. 25 that proved SLM technology to be a dependable manufacturing technique for most part geometries and an effective alternative to subtractive manufacturing for high-volume injection moulding tools for the aftermarket automotive sector.
The work in this paper presents the methods employed for tool manufacturing and a detailed description of the different experimentations executed. The first stage of experimentation was executed on the SLM and CNC machined tool inserts. The second stage enabled further experiments to be carried out for the products fabricated from both tool inserts. Moreover, experimental work for stage 1 and 2 was in the context of surface roughness inspection using a laser scanning microscope and measuring dimensional accuracy using a 3D scanner. Optical testing is conducted to evaluate the products’ functionality, purposely to display and quantify the reflection of light of the reflector units that have been moulded. The scope of quantifying light reflectivity of SLM produced reflectors have not yet been investigated by previous research.
Materials and methods
For this study, the tool insert required for producing a vehicle reflector was investigated. Two tool inserts were fabricated using additive and subtractive manufacturing methods. The first insert was manufactured using CNC milling, while the other insert was fabricated using SLM. The CAD design used for both tool inserts was identical. Therefore, the same design was executed once on a CNC milling machine and another on a SLM machine, with the inserts as manufactured shown in Figure 1.
(a) CNC manufactured tool insert; (b) SLM fabricated tool insert.
The CNC machined tool insert was manufactured at an automotive company located in Alexandria, Egypt. An Okuma 3-axis CNC milling machine was used to manufacture the tool insert with a spindle motor power ranging from 18.5 to 22 KW at 15,000 RPM. Three carbide tapered end mills were used for machining the pattern on the insert. The shank diameter of the end mills was 4 mm. Tip diameters of the three machine tools were 0.25, 0.5 and 1 mm respectively. The material used for manufacturing the insert was Stainless Steel 316 L.
The SLM fabricated tool insert was built at a company located in Warrington, UK. The machine used was a ReaLizer SLM 250 with a laser power of 200 W. Stainless Steel 316 L was the material used for fabricating the inserts. The powder material was supplied by LPW Technology Ltd (Runcorn, UK), with particle size nominally in the range of 45–150 µm. The build layer thickness was 50 µm. Tumbling was used to remove the excess powder after the fabrication process.
Results and discussion
Tests were performed in two stages; the first stage was responsible for assessing the fabricated tool inserts. The second stage accounts for assessing the functionality of the end-product manufactured using the tool inserts. Following fabrication, the tool inserts were mounted on the same bolster for injection moulding to manufacture end-products for additional tests. Therefore, the inserts were exposed to the same operational conditions, to ensure consistency of results.
Injection moulding of the tool was carried out on a Nurnak MMRJ 130-225 injection-moulding machine with a clamping force of 100 Ton. The polymer used for injection was Polystyrene, with an injection pressure of 55 bar at a temperature of 220–240 °C. The average cycle time to produce two parts in one impression was approximately 42 s. The net weight for the SLM-tool enabled product was 14 g, whilst the CNC produced reflector was 16 g. The CNC produced reflector is slightly heavier in weight for the following reason: during the manufacturing process the cutting tools are expected to reach the designated depth. Due to the complexity of the surface design, tool rubbing leads to tool offset errors and shorter tool life that causes poor finish of the machined surface. 26
Tests were executed in the following sequence: Tool insert evaluation: ○Surface roughness ○Dimensional accuracy Injected part evaluation: ○Surface roughness ○Dimensional accuracy ○Optical test
Tool insert evaluation
Surfaces that are subjected to successive contact due to mating of the tools cores and cavities have been selected for surface roughness and dimensional accuracy investigations.
Surface roughness
Constant contact of the two mating halves of the tool inserts during the injection moulding process may eventually lead to coarseness of the surface due to friction between the two halves. 27 Due to the complex nature of the surfaces, non-contact profile and roughness measuring equipment is required to perform the necessary investigation. The equipment used for measuring the surface roughness was a Laser scanning Microscope Keyence VX-100 with a laser spot diameter of 0.4 µm. The laser microscope operates on the data provided from the overall surface instead of following a specific line to achieve more accurate and consistent results.
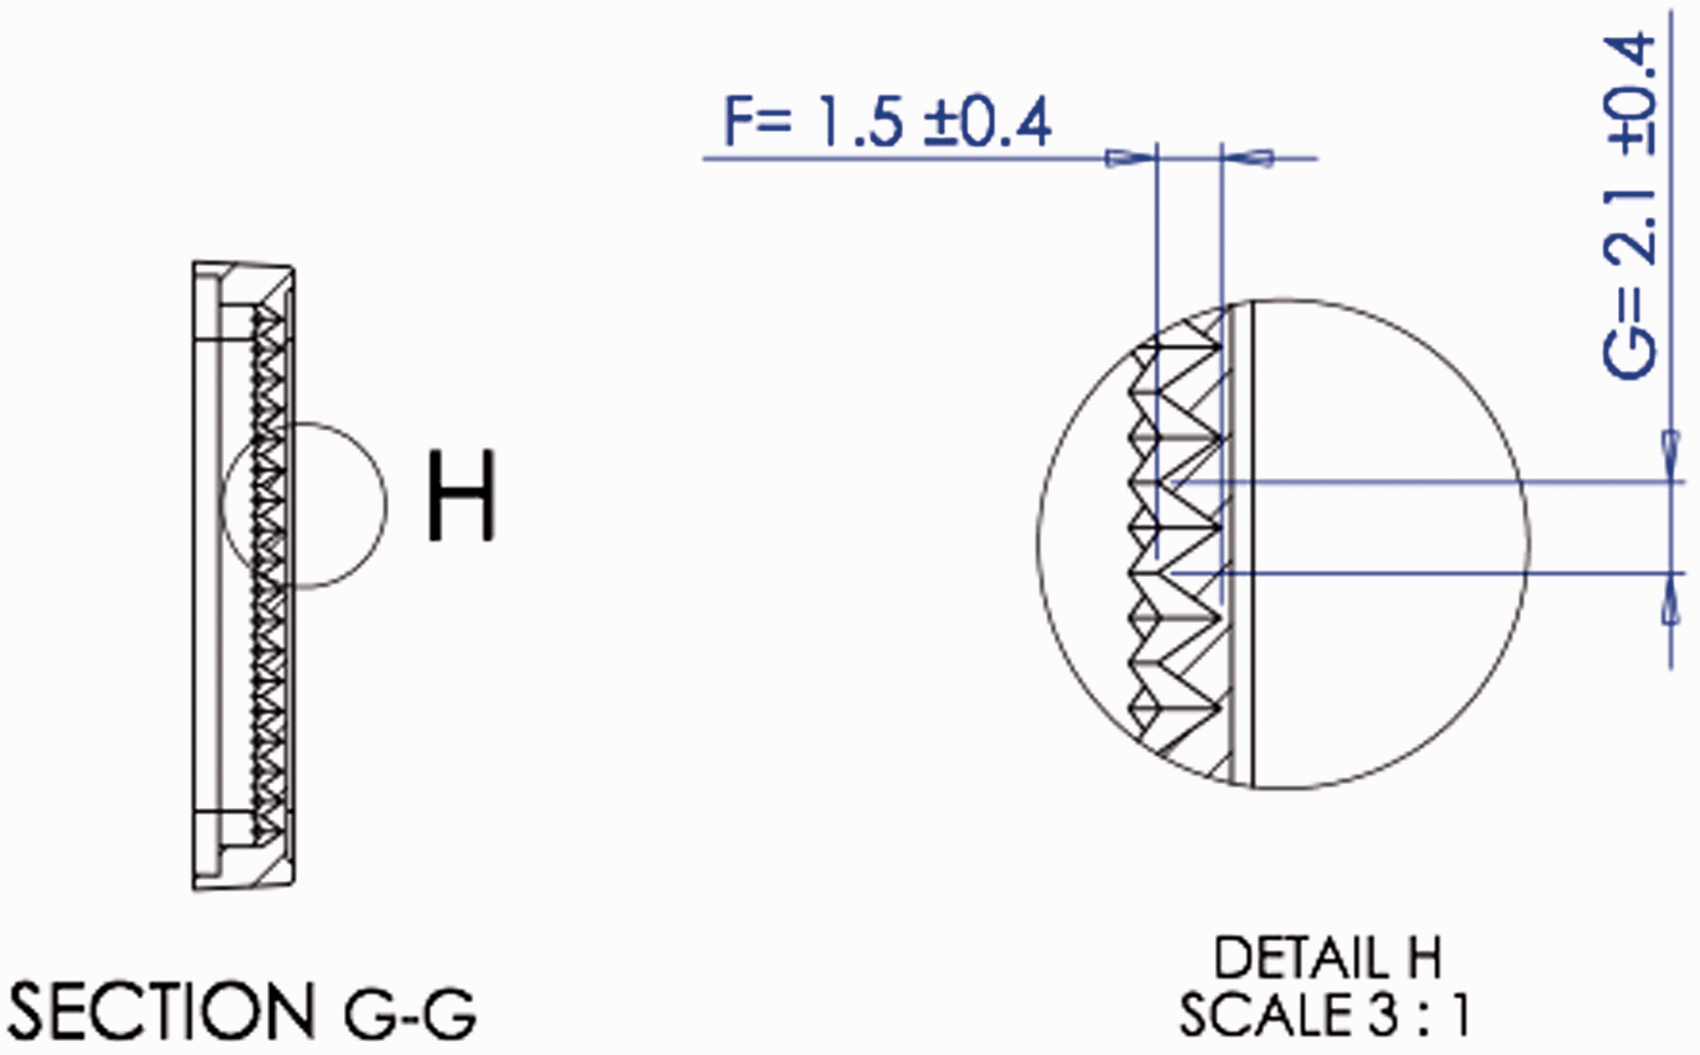
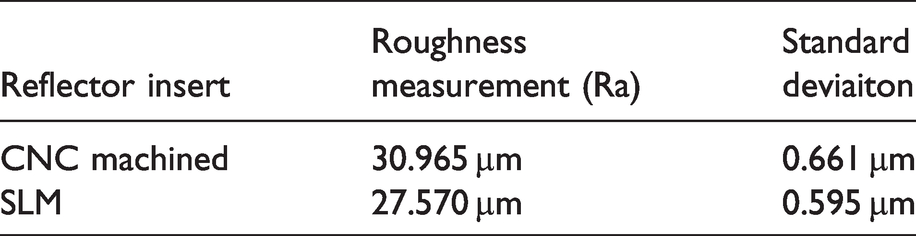
For this test, the measured surface for both the SLM and CNC manufactured tool inserts was surface H as shown in Figure 2. Section G-G shows a detailed view of the surface topology and how surface roughness measurements were sought.
2 D illustration of the fabricated tool inserts with the appointed section view G-G of surface H.
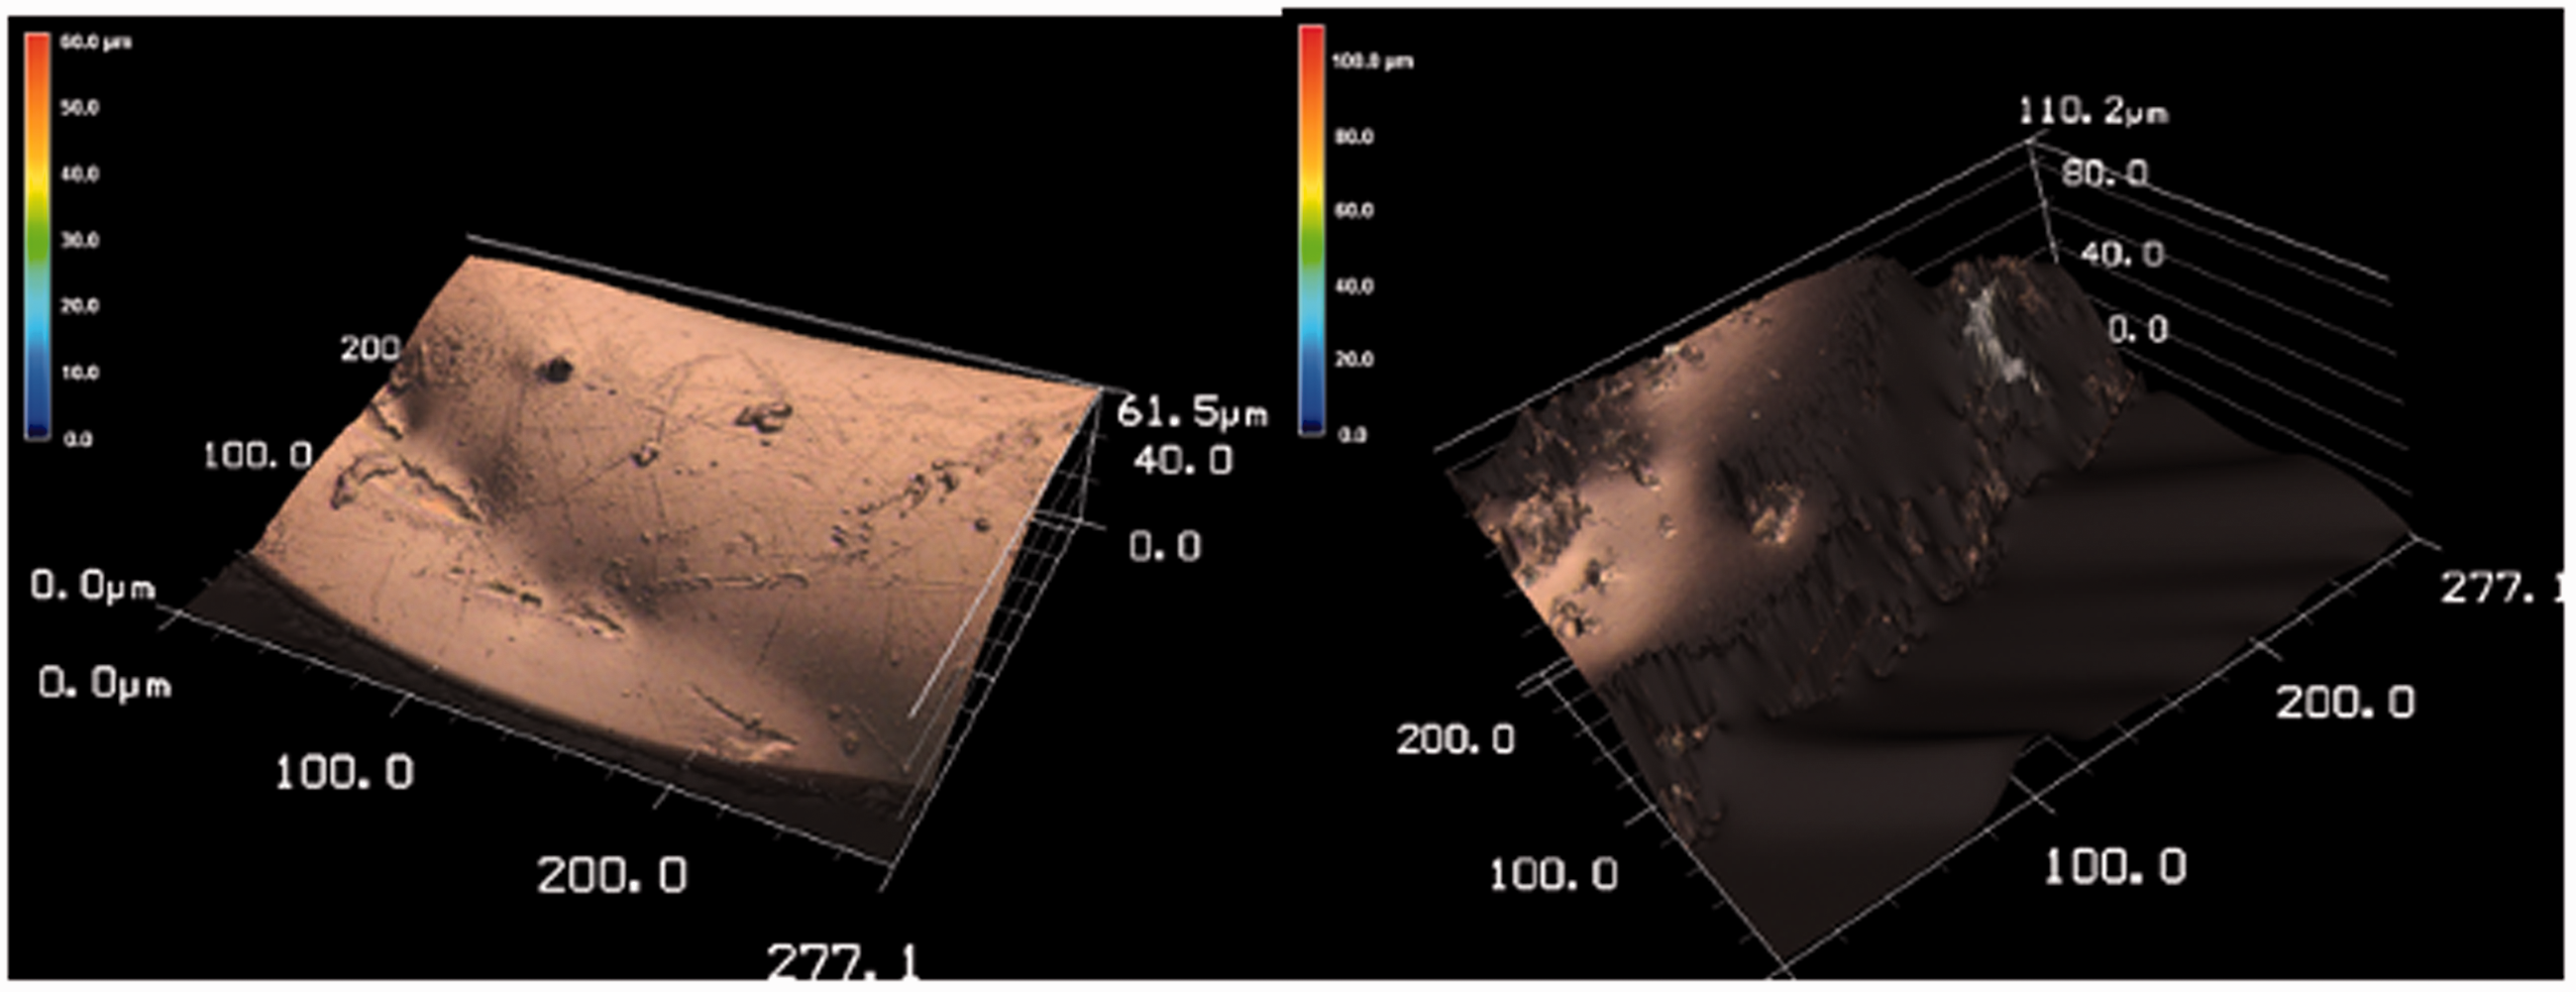
Roughness was calculated on an area of 55.42 mm2 to ensure that the whole area of the side surface of the prism shape is covered as shown in Figure 3. For each tool insert, three random points were measured. Values were recorded, and the final roughness value was an average of the three readings as shown in Table 1. The purpose of this test was to investigate probable variation in surface texture that may be caused due to use of different manufacturing techniques.
Surface roughness topology of CNC-machined insert (left) and SLM-fabricated insert (right).
Surface roughness measurements (Ra) of CNC and SLM tool inserts.
Surface roughness of the CNC-machined insert proved to be significantly higher compared to the SLM-fabricated insert, due to the complexity of the surface topology and repetition of the patterned feature on the surface. 26
Dimensional accuracy
Identifying deviation in measurements from the nominal values after the tool inserts are fabricated was necessary to achieve a complete assessment of the functionality of the products. Therefore, the CNC and SLM-fabricated tool inserts were both evaluated in comparison to the preset nominal values. The same evaluation process was repeated for the produced samples from their corresponding tool inserts and were similarly evaluated. Shown in Figure 2 is a 2D CAD illustration of the tool insert with the appointed nominal values and their tolerances. Tolerances vary depending on how critical the measurements contribute to functionality.
A FaroArm Platinum 3D scanner with a ± 0.036 mm volumetric accuracy was used to scan the appointed surfaces with the required dimensions for measurements for both the CNC and SLM-fabricated tool inserts. The Geomagic Control X metrology software was used to deliver a comprehensive analysis of the inspected surfaces to detect and identify deviation in measurements of the fabricated parts from the nominal values.
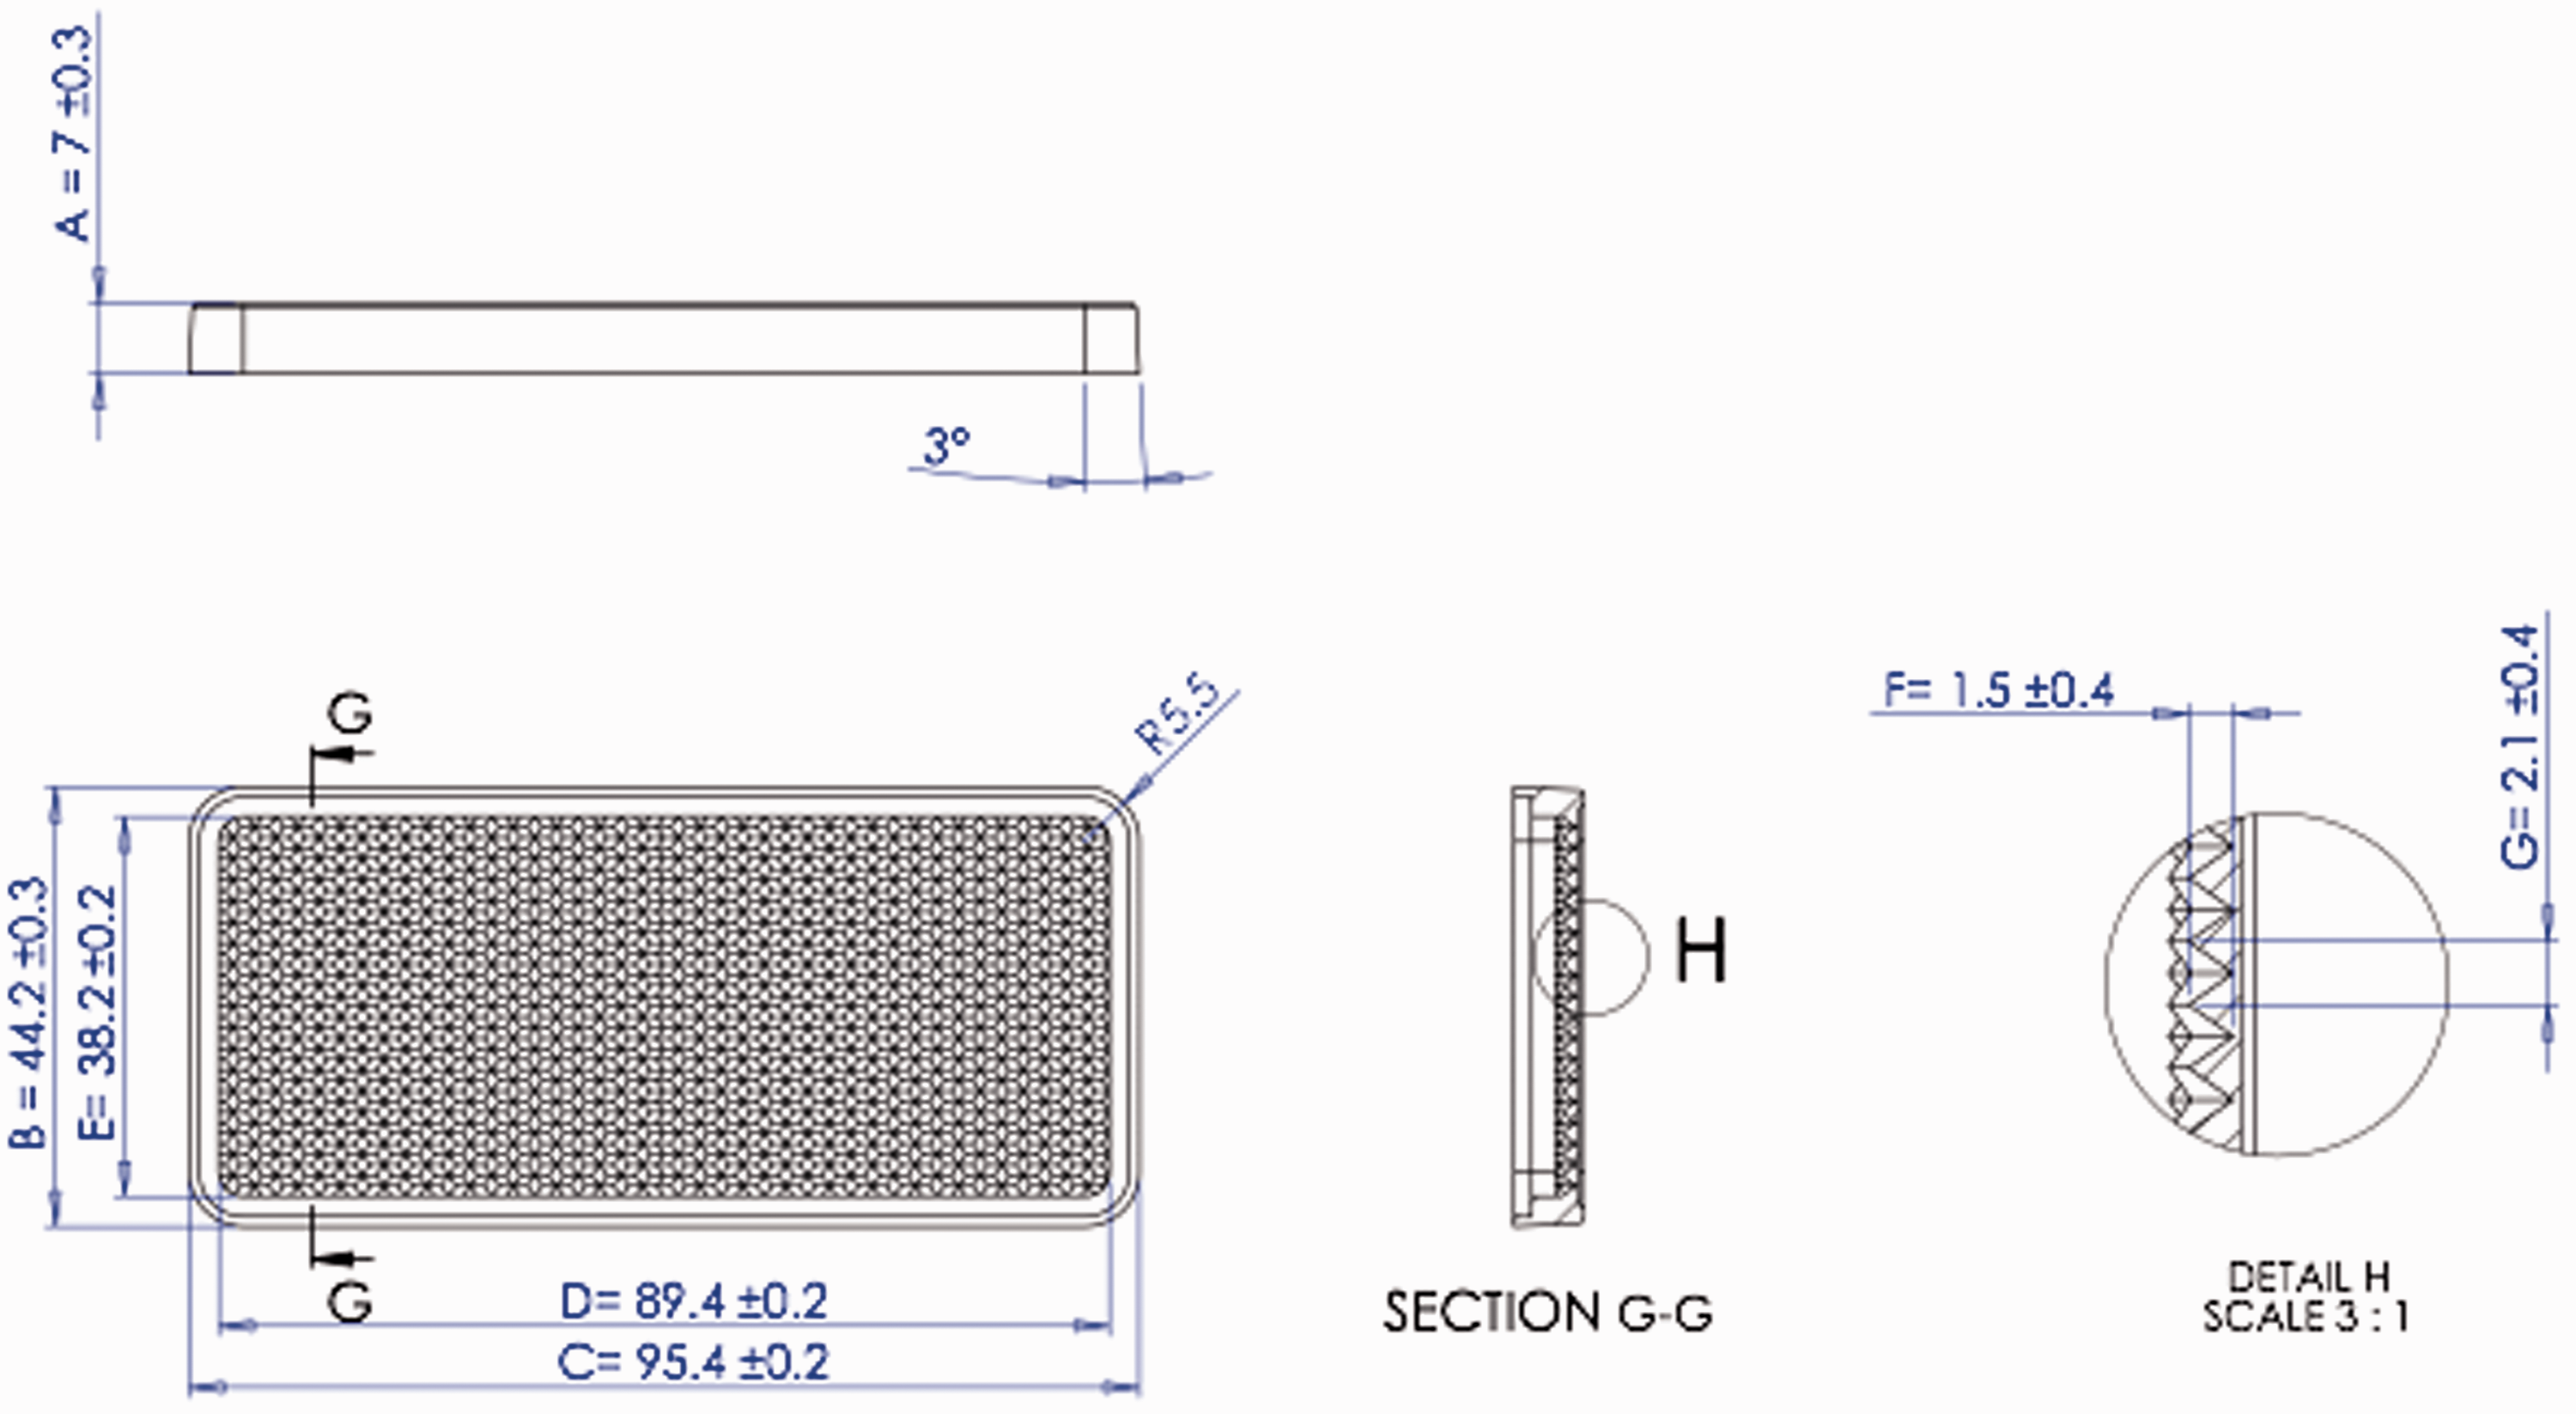
Dimensions that are of interest to this study and have a direct effect on the product evaluation are A, B, F and H. The objective of this analysis is to determine the deviation that occurred from the nominal values for the tool inserts. For the CNC-machined insert shown in Figure 4, dimension A is the total length of the insert and deviation was recorded at –0.041 mm from the nominal value within a tolerance range of ± 0.1 mm. Dimension B is the total width of the insert, three values for deviation were recorded within the tolerance range ± 0.1 mm, the values are –0.0923 mm and the other two values are –0.112 mm, and –0.13 mm overstepping the maximum permissible tolerance range. Deviation inconsistency between the three points of measurements is interpreted as a misalignment during machining in the X axis. Dimension F is the thickness of the insert’s base, the average recorded deviation value is 0.086 mm within the tolerance range of ± 0.4 mm. Four average values were recorded for deviation in dimension H, –0.044 mm, 0.013 mm, 0.274 mm, and 0.303 mm, and –0.238 mm, all values are within the acceptable tolerance range ± 0.4 mm. Fluctuation in deviation values is a result of cutting tool wear therefore, cutting tools were changed multiple times to maintain consistency to measurement accuracy.
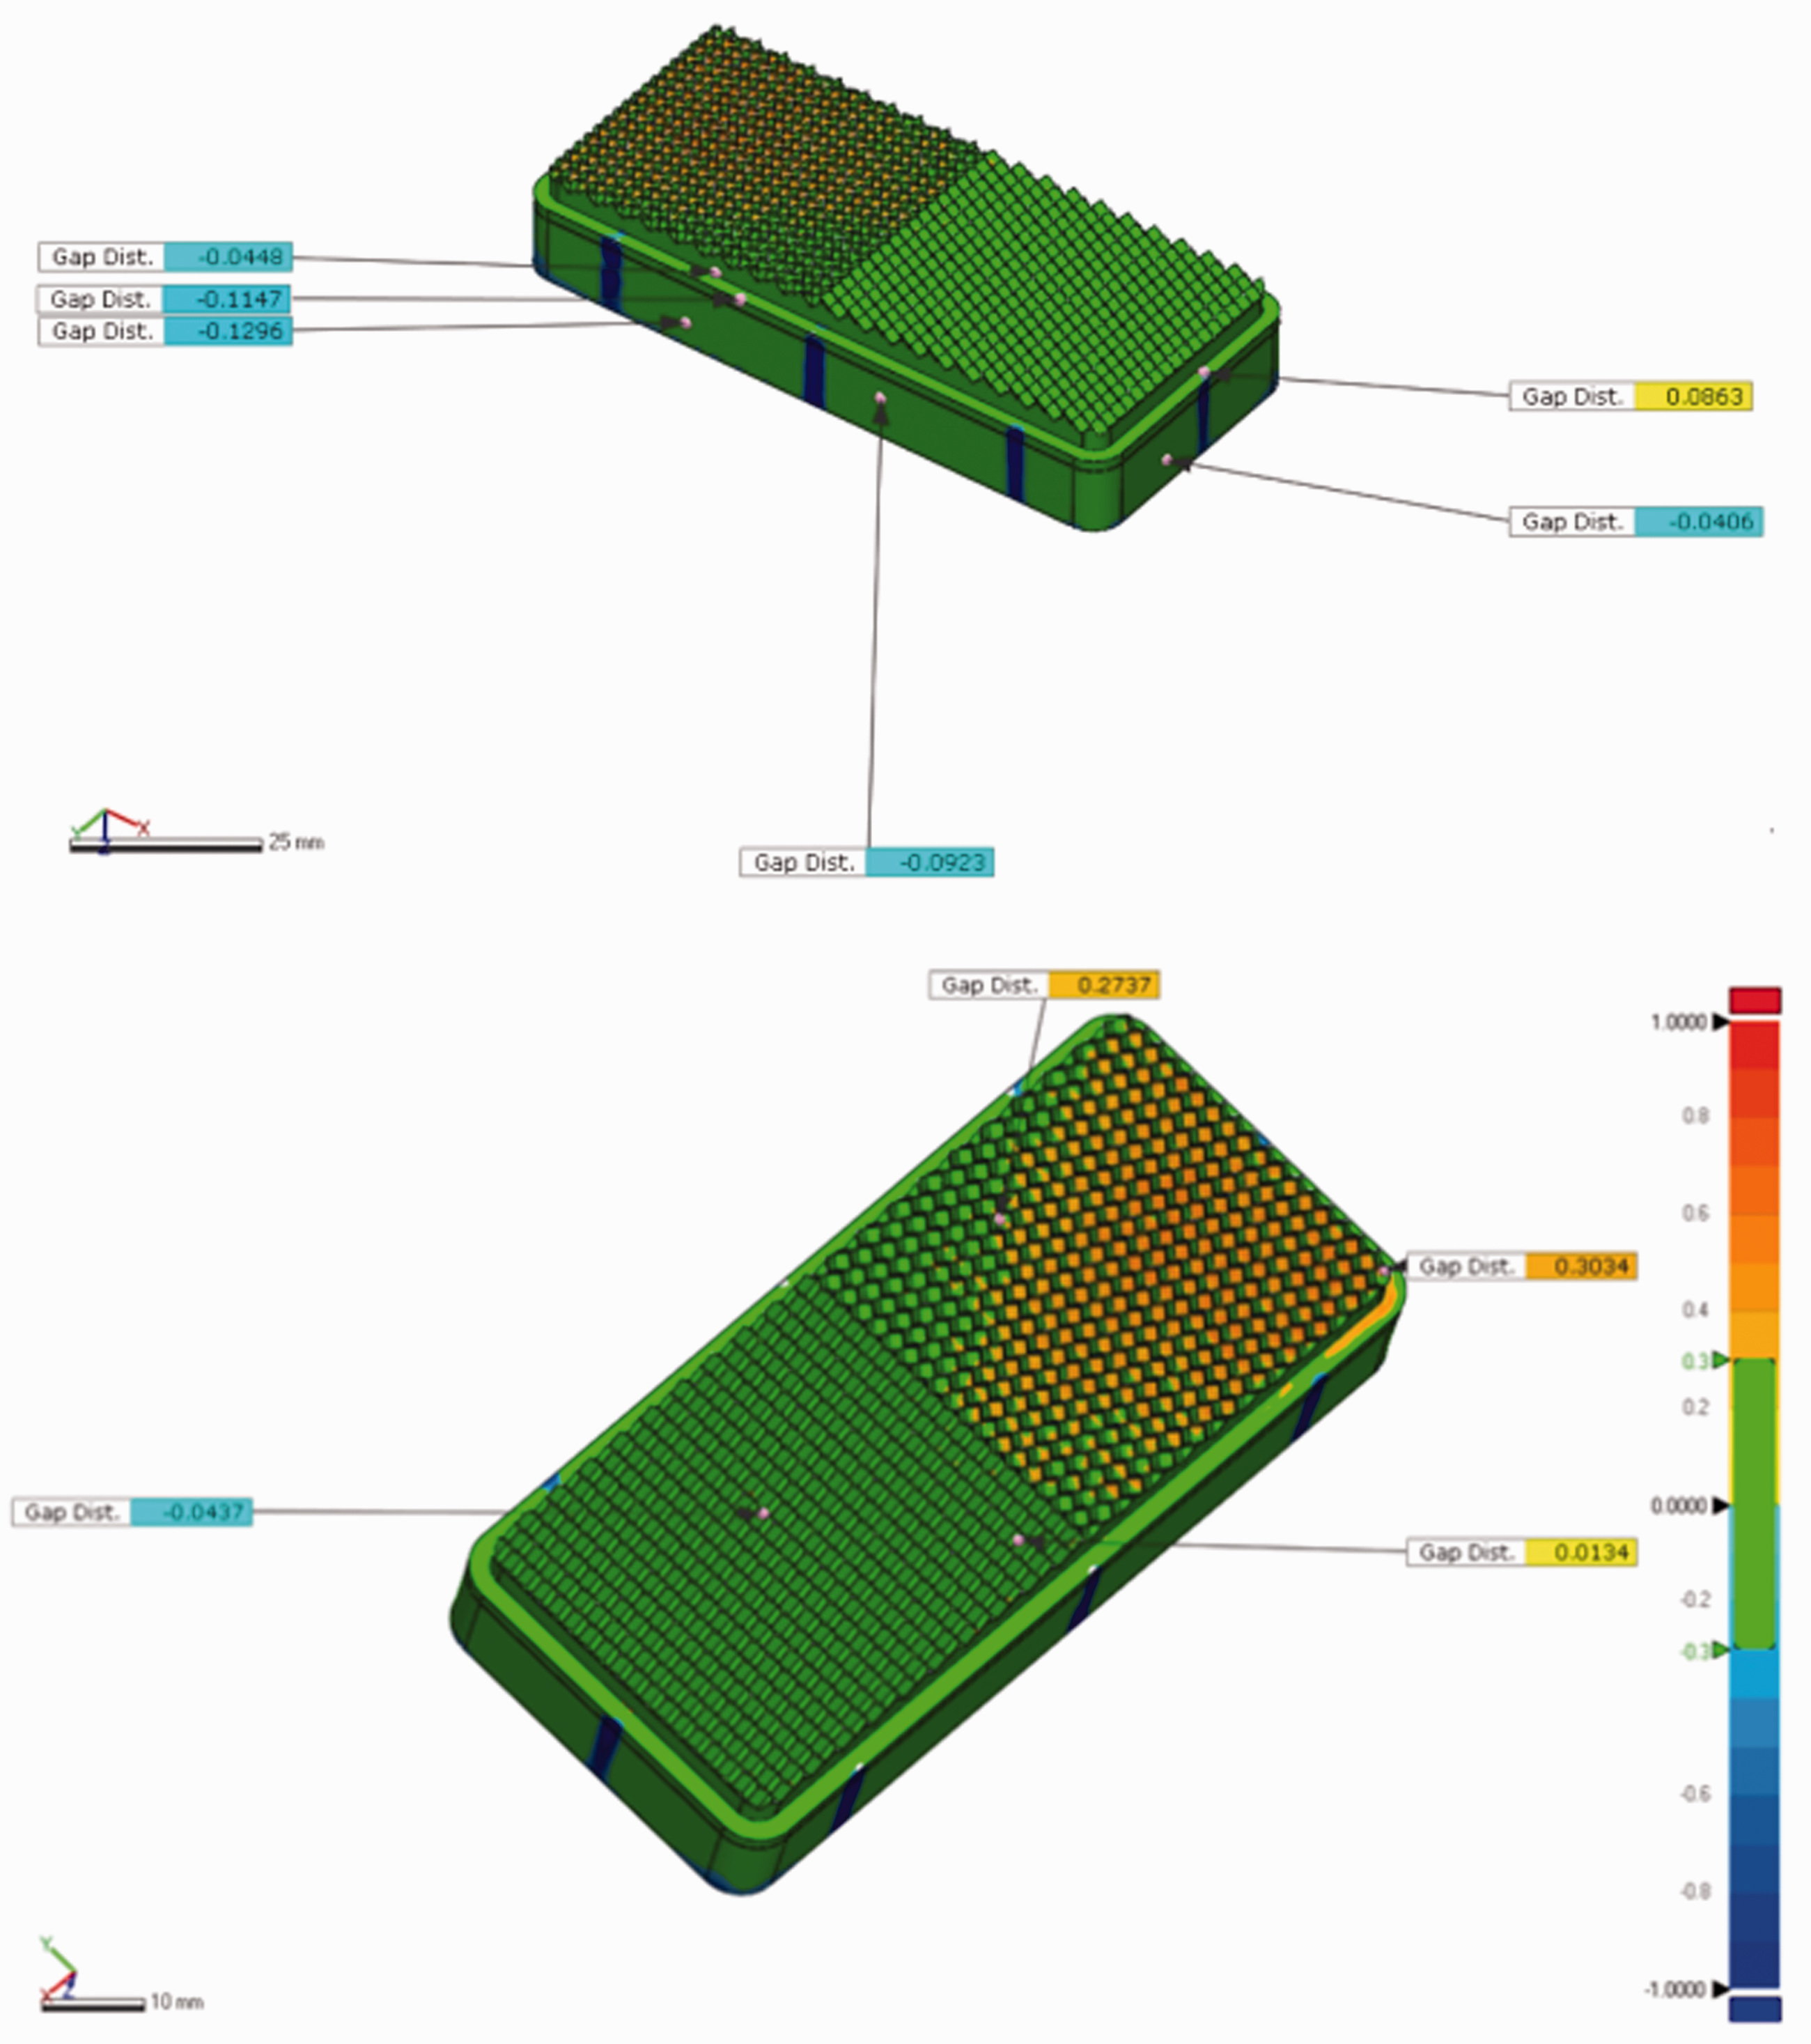
Deviation analysis of fabricated CNC insert from nominal values.
The same analysis process was adopted for the SLM-fabricated insert. The dimensions that were evaluated are A, B, F and H. Shown in Figure 5 is an illustration of deviation analysis; for dimension A, two values were recorded for deviation from the nominal value 0.007 mm and –0.118. The first value is within the tolerance range of ± 0.1 mm while the second value tends to cross over the high limit. The change in deviation is interpreted as a misalignment during fabrication in the Y axis due to shrinkage caused by the laser melting process. Deviation in dimension B records three values within close range to tolerance ± 0.1 mm, the values are –0.115 mm, –0.144 mm, and –0.14 mm. The average recorded value for deviation in dimension F is 0.0413 mm within the tolerance range of ± 0.4 mm. Four average values were recorded for deviation in dimension H, –0.079 mm, –0.147 mm, –0.2399 mm and –0.238 mm, all values are within the acceptable tolerance range ± 0.4 mm.
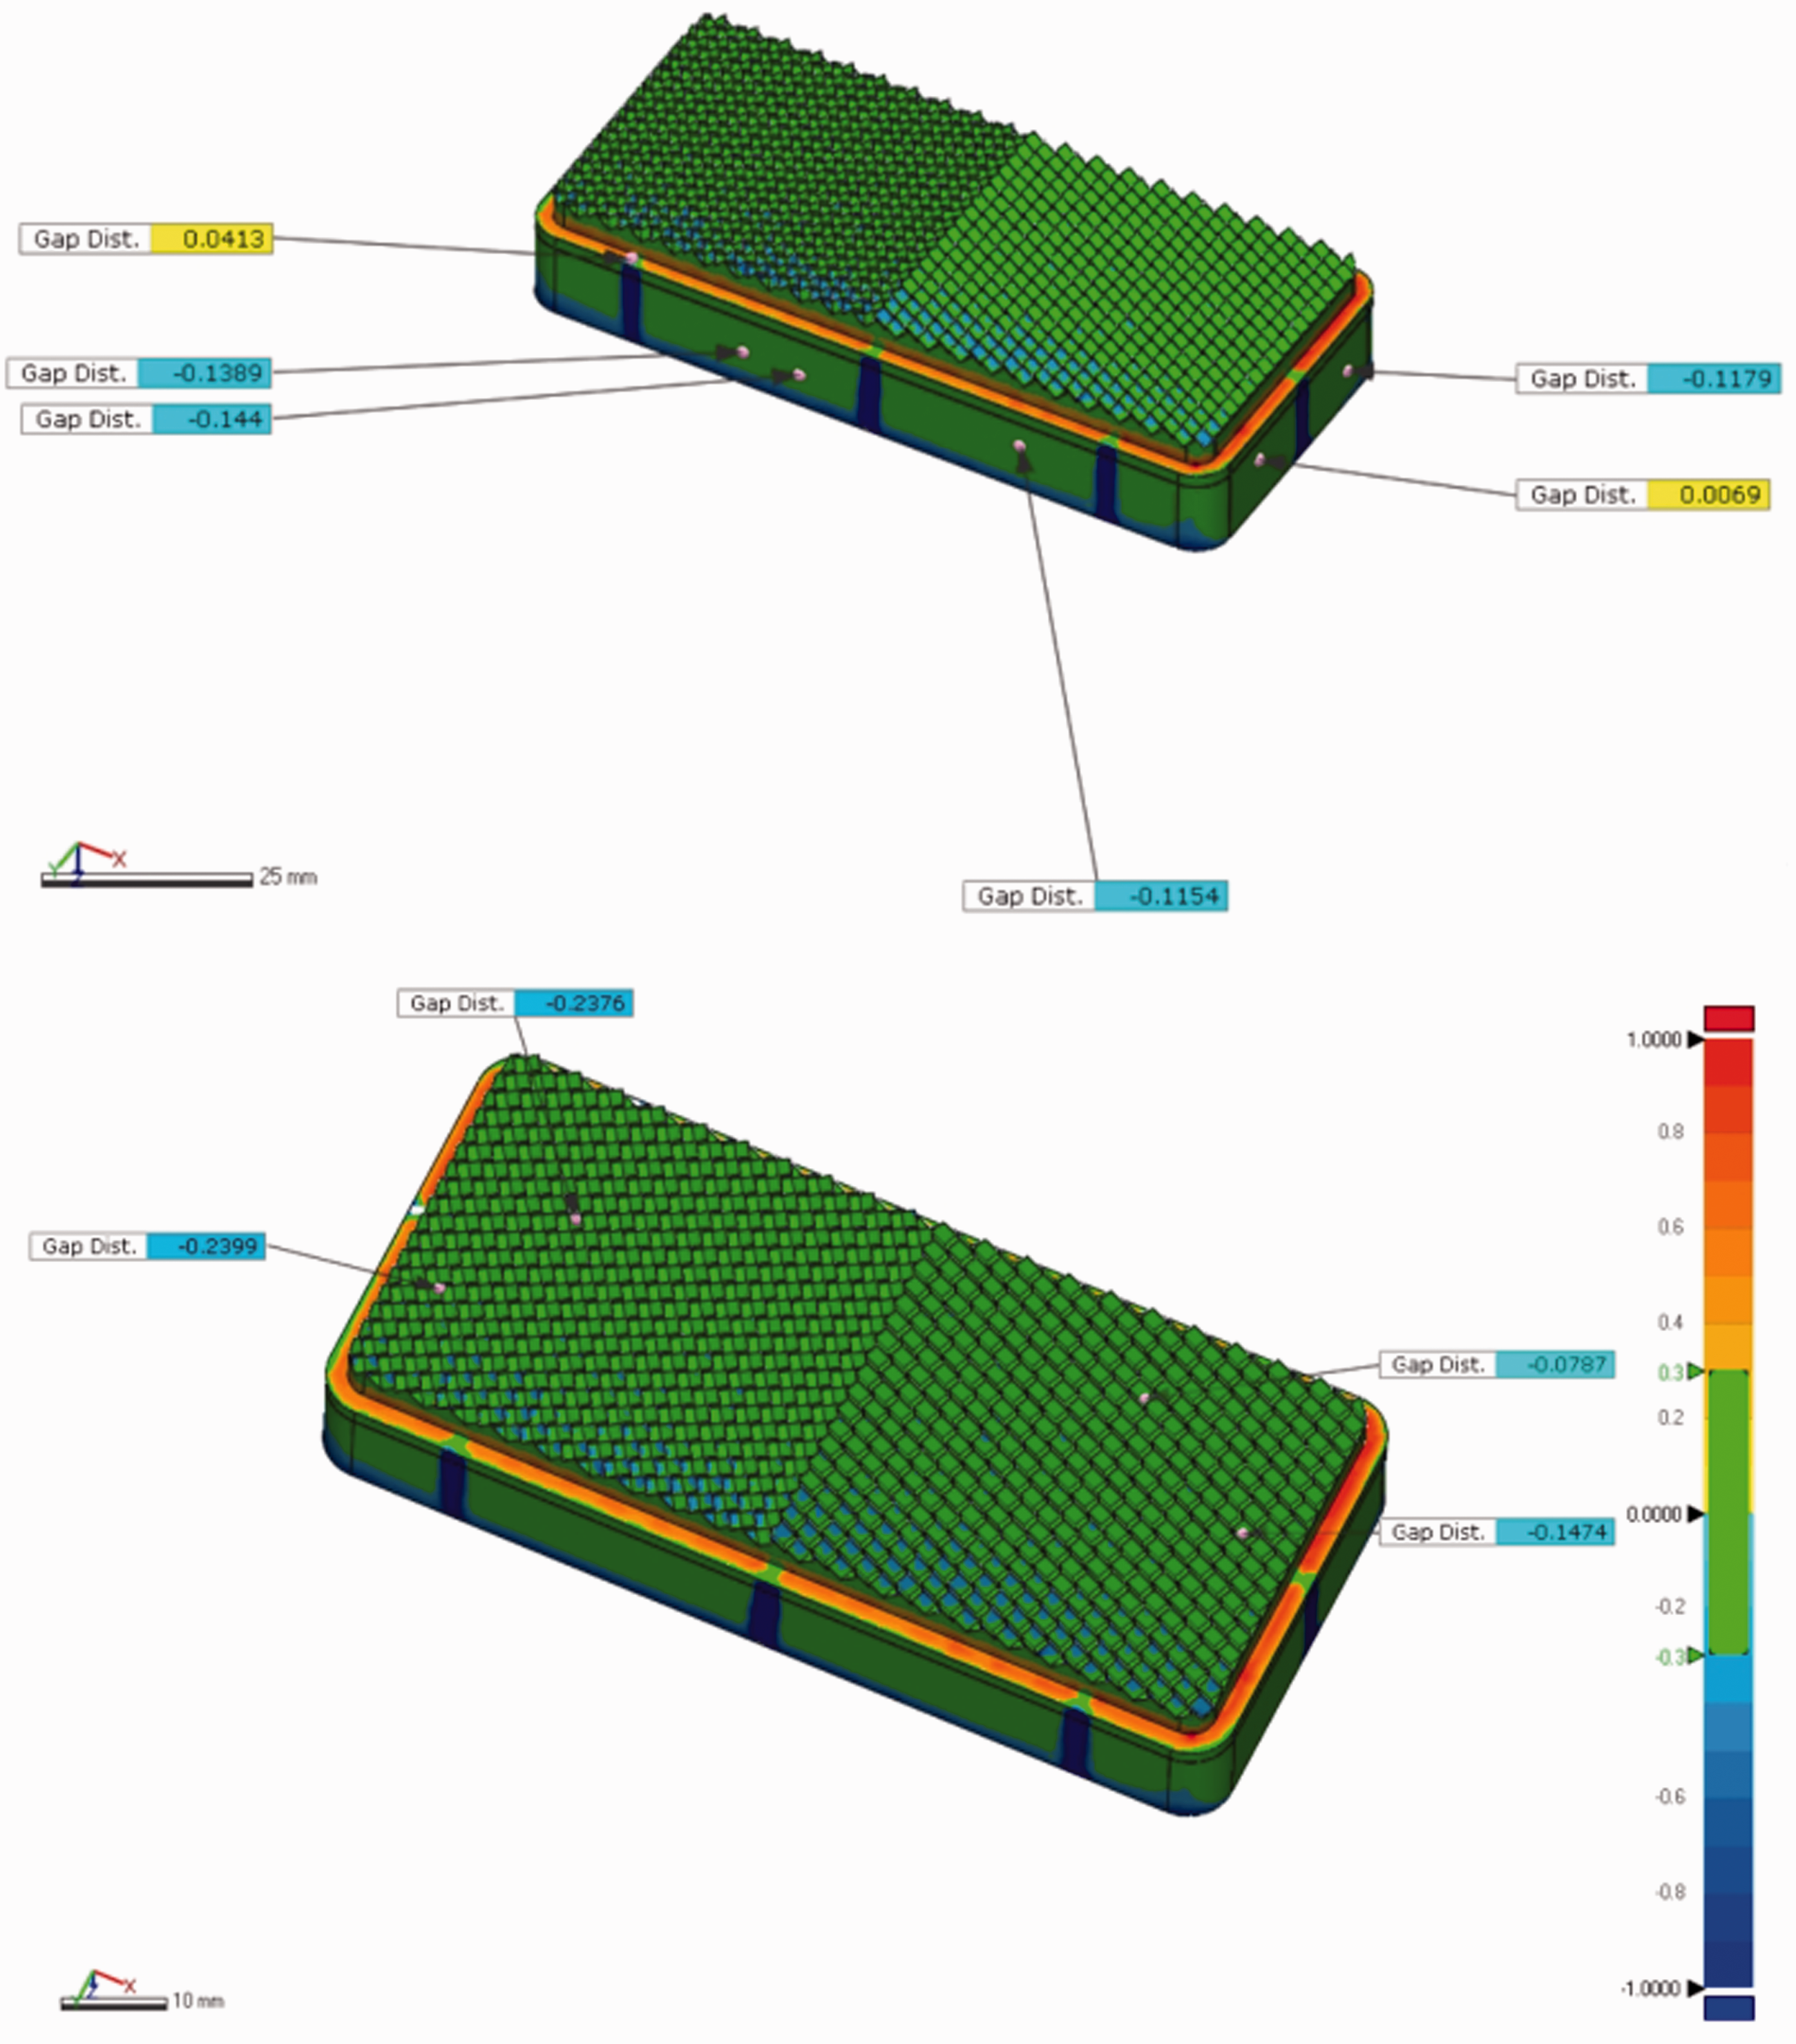
Deviation analysis of fabricated SLM insert from nominal values.
The angled position of the patterned feature leads to a high level of geometric complexity on the surface of the inserts. The complexity presented on the surface was difficult to manufacture consuming multiple cutting tools due to the repetitive sequence during processing and causing inconsistency. On the other hand, the SLM-fabricated insert provided no hardships during the fabrication process proving to be prominently competent in terms of dimensional accuracy.
Injected part evaluation
After examining the SLM and CNC-fabricated tool inserts, the second stage in the assessment process was to evaluate functionality of the respectively produced vehicle reflectors.
Surface roughness
After investigating roughness of the CNC and SLM tool insert surfaces, the same test was repeated for their respective products. Twenty parts were produced from each tool insert and the samples were selected for measurement assessment. The measured surface is H as shown in Figure 6 with a detailed illustration of the surface topology.
2D section view illustration of the produced sample.
A close-up detailed view is illustrated in Figure 7 to demonstrate the geometrical feature design of the prism-shaped pattern of the internal reflector’s surface topology. The side surfaces of the prism shape topology were the targeted area for measurements.
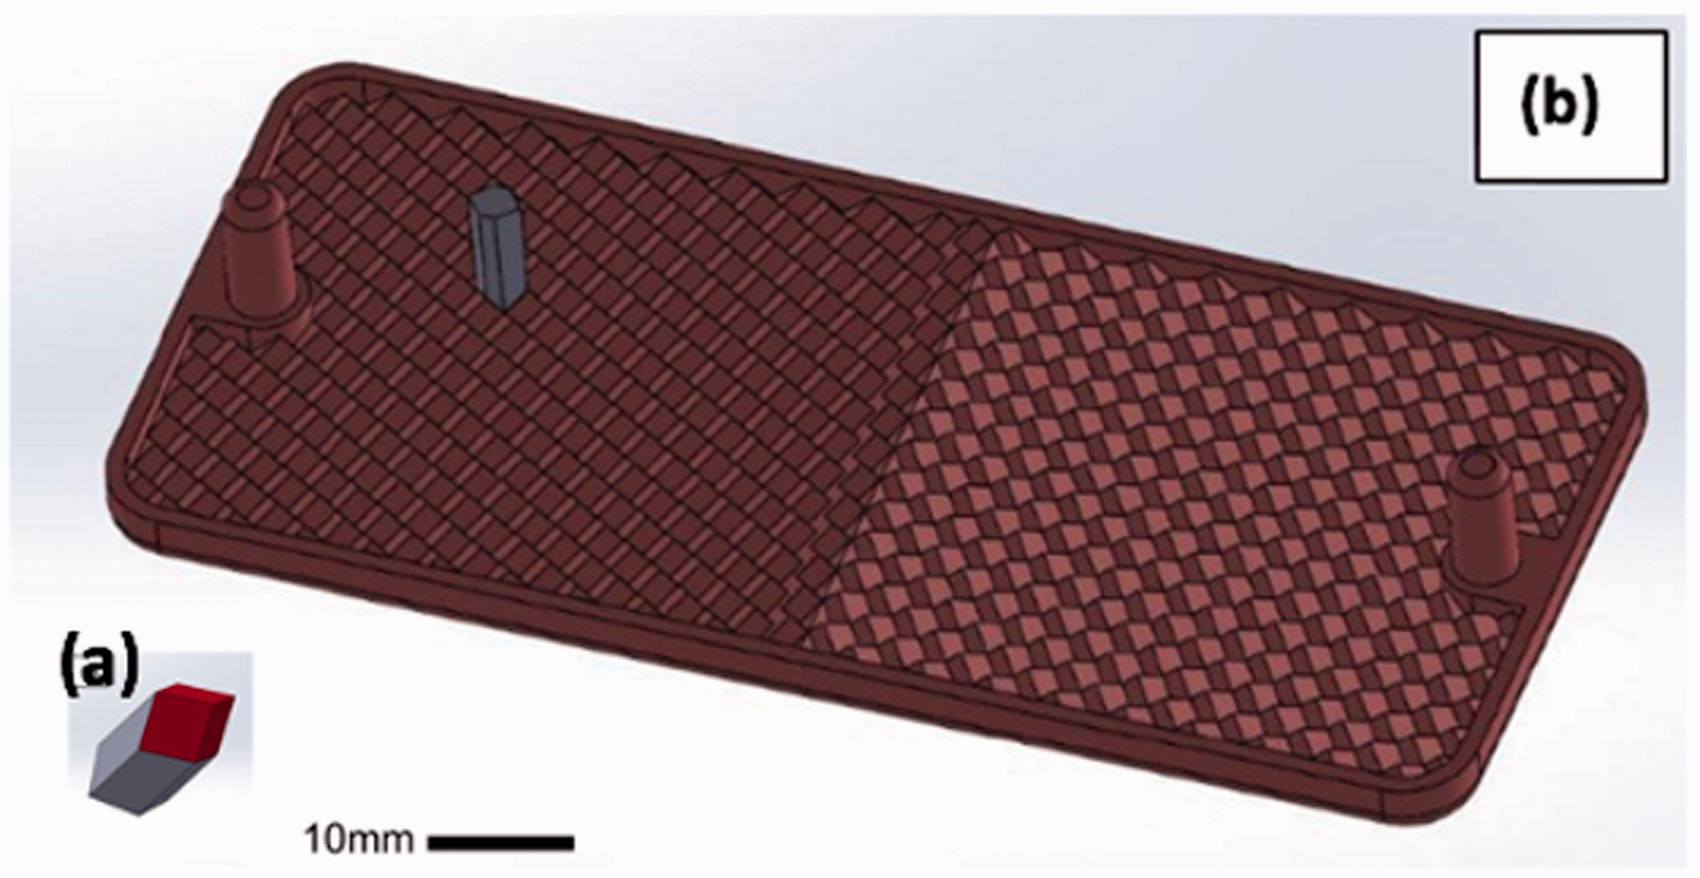
(a) A close-up view of the prism-shaped pattern topology of the reflector (b) produced reflector.
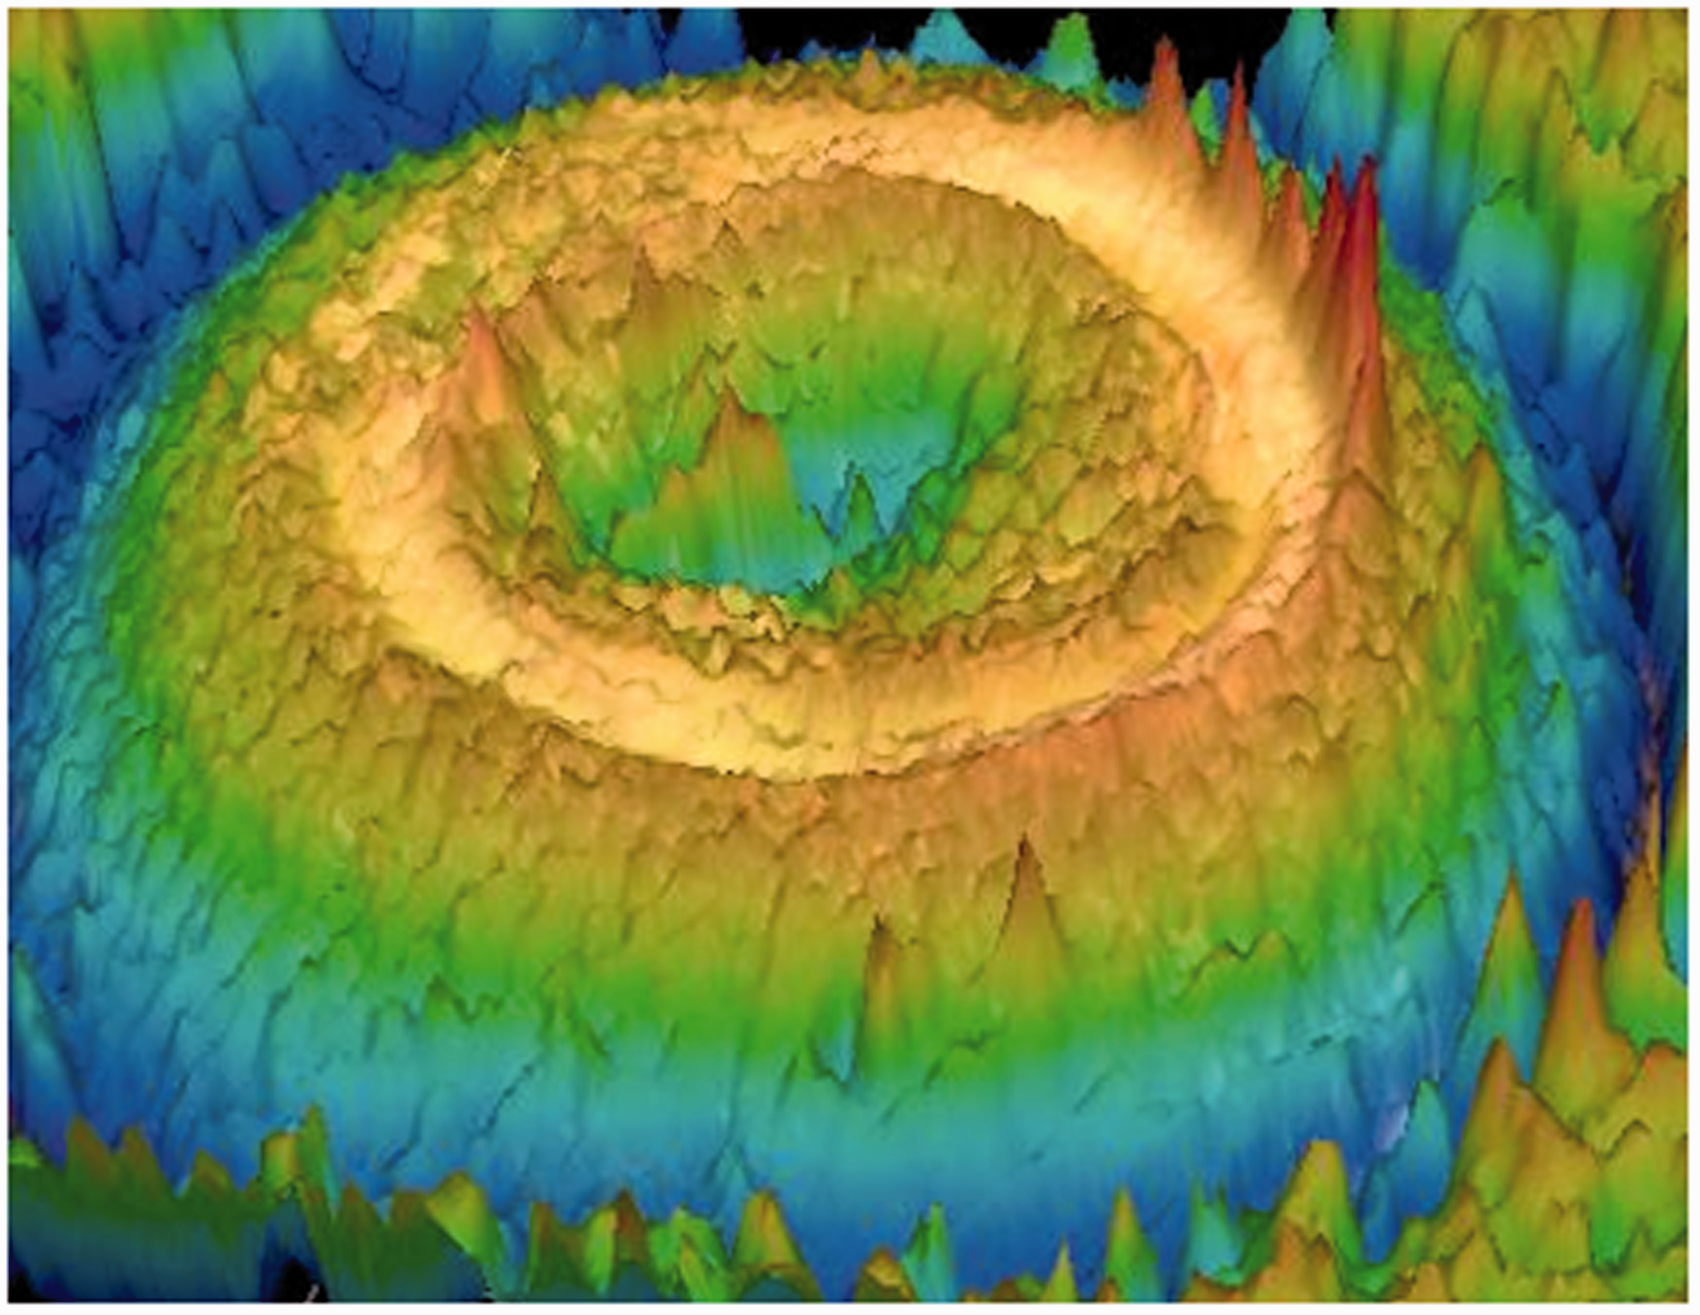
For each measurement trial, the roughness was calculated on an area of 55.42 mm2 to ensure that the whole area of the prism-shaped surface is covered as shown in Figure 8. Three values were obtained, and the average was calculated to provide the final roughness values as given in Table 2. Surface roughness proved high for both the CNC and SLM-produced inserts. The increase in surface roughness value of the CNC-produced reflector was determined to be as a result of the injection moulding process. The complexity of the surface topology and the high value of surface roughness of the CNC tool insert affects the ejection process of the reflector causing small cracks and deformation to the textured features on the reflector. Therefore, the outcome of the tests conducted proved that the SLM-fabricated inserts and hence the SLM-produced inserts have relatively lower values of surface roughness with respect to their counterparts and were deemed acceptable.
Surface topology of CNC produced reflector (left) and SLM produced reflector (right).
Surface roughness measurements (Ra) of CNC and SLM produced reflectors.
Dimensional accuracy
A 2D CAD design of the injection moulded sample product with the corresponding nominal values and tolerances are illustrated in Figure 9.
2D CAD illustration of the injection moulded sample product.
Deviation from nominal values for the CNC-produced reflector are given in Figure 10. The following are the evaluated product dimensions B, C, and resultant of F selected in relation to the tool insert dimensions of A, B, F and H. Dimension B is the overall width of the produced reflector; two average deviation values are recorded, –0.091 mm, and –0.14 mm. Deviation is accepted to be within the tolerance range of ± 0.3 mm. Recorded average value of deviation from C dimension is –0.367 mm exceeding the accepted tolerance range of ± 0.2 mm. The increased deviation is a result of a misalignment during machining of the insert in the Y axis. Deviation values for the internal pattern feature were recorded at two points on both ends of the reflector, the values are 0.867 mm and 1.021 mm respectively. These values are in excess of the acceptable tolerance range of ± 0.4 mm.
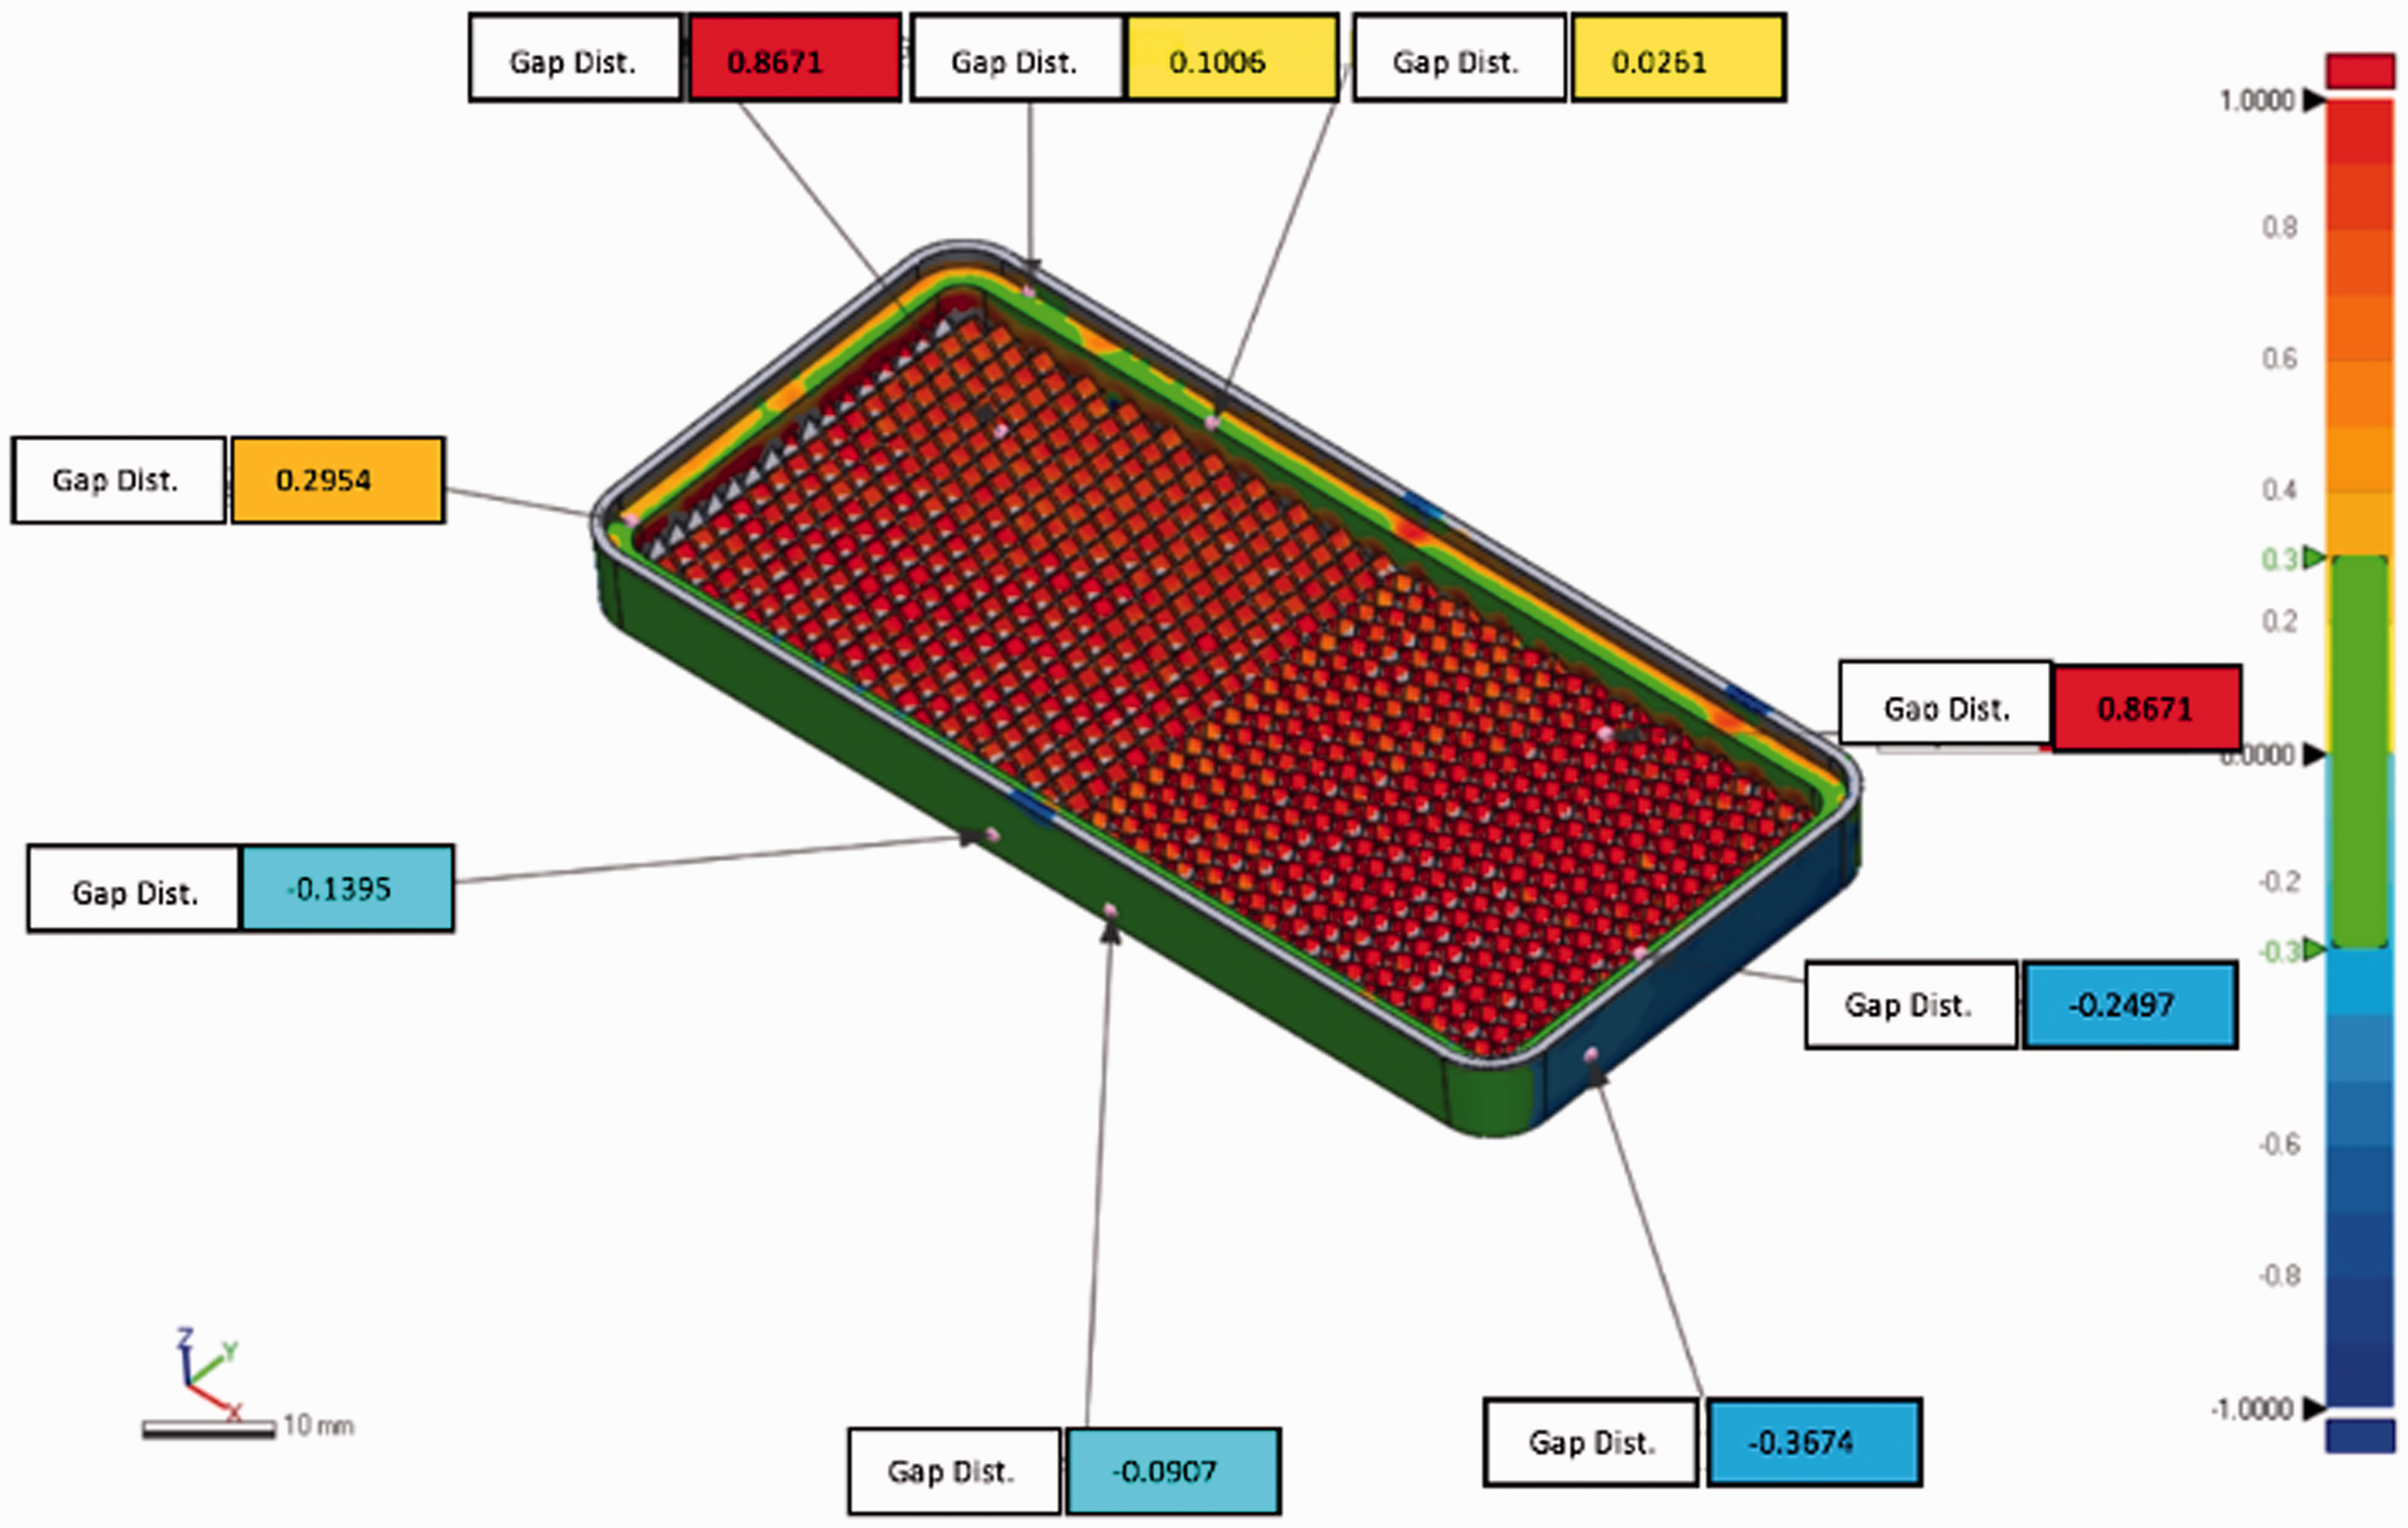
Deviation analysis of the produced CNC sample.
During the injection moulding process, complications occurred as a result of difficulties encountered during the machining process of the insert. The angled position and small measurement value of the patterned prism shape caused a high level of geometric complexity hindering complete access of the cutting tool on the surface to create sharp-edged faces, resulting in low wall thickness of the prism-shaped feature (showing like a crater in Figure 11).
Detailed close-up view of the patterned feature.
Deviation from nominal values is shown in Figure 12 for the SLM-produced reflector for the following dimensions B, C, and resultant of F acquired in relation to the tool insert dimensions of A, B, F, and H. Four average deviation values are recorded for dimension B, –0.0004 mm, –0.258 mm, –0.212 mm, and 0.135 mm. The deviation is accepted to be within the tolerance range of ± 0.3 mm. Average value recorded for deviation from C dimension is –0.4983 mm crossing over the accepted tolerance range of ± 0.2 mm. Moreover, this increased deviation is a result of shrinkage during the SLM-fabrication process resulting in a reduction in overall length of the injected reflector. As for deviation values measured from the patterned feature on the internal surface of the reflector, two values were recorded within the accepted tolerance range of ± 0.4 mm, these values are 0.253 mm and 0.311 mm.
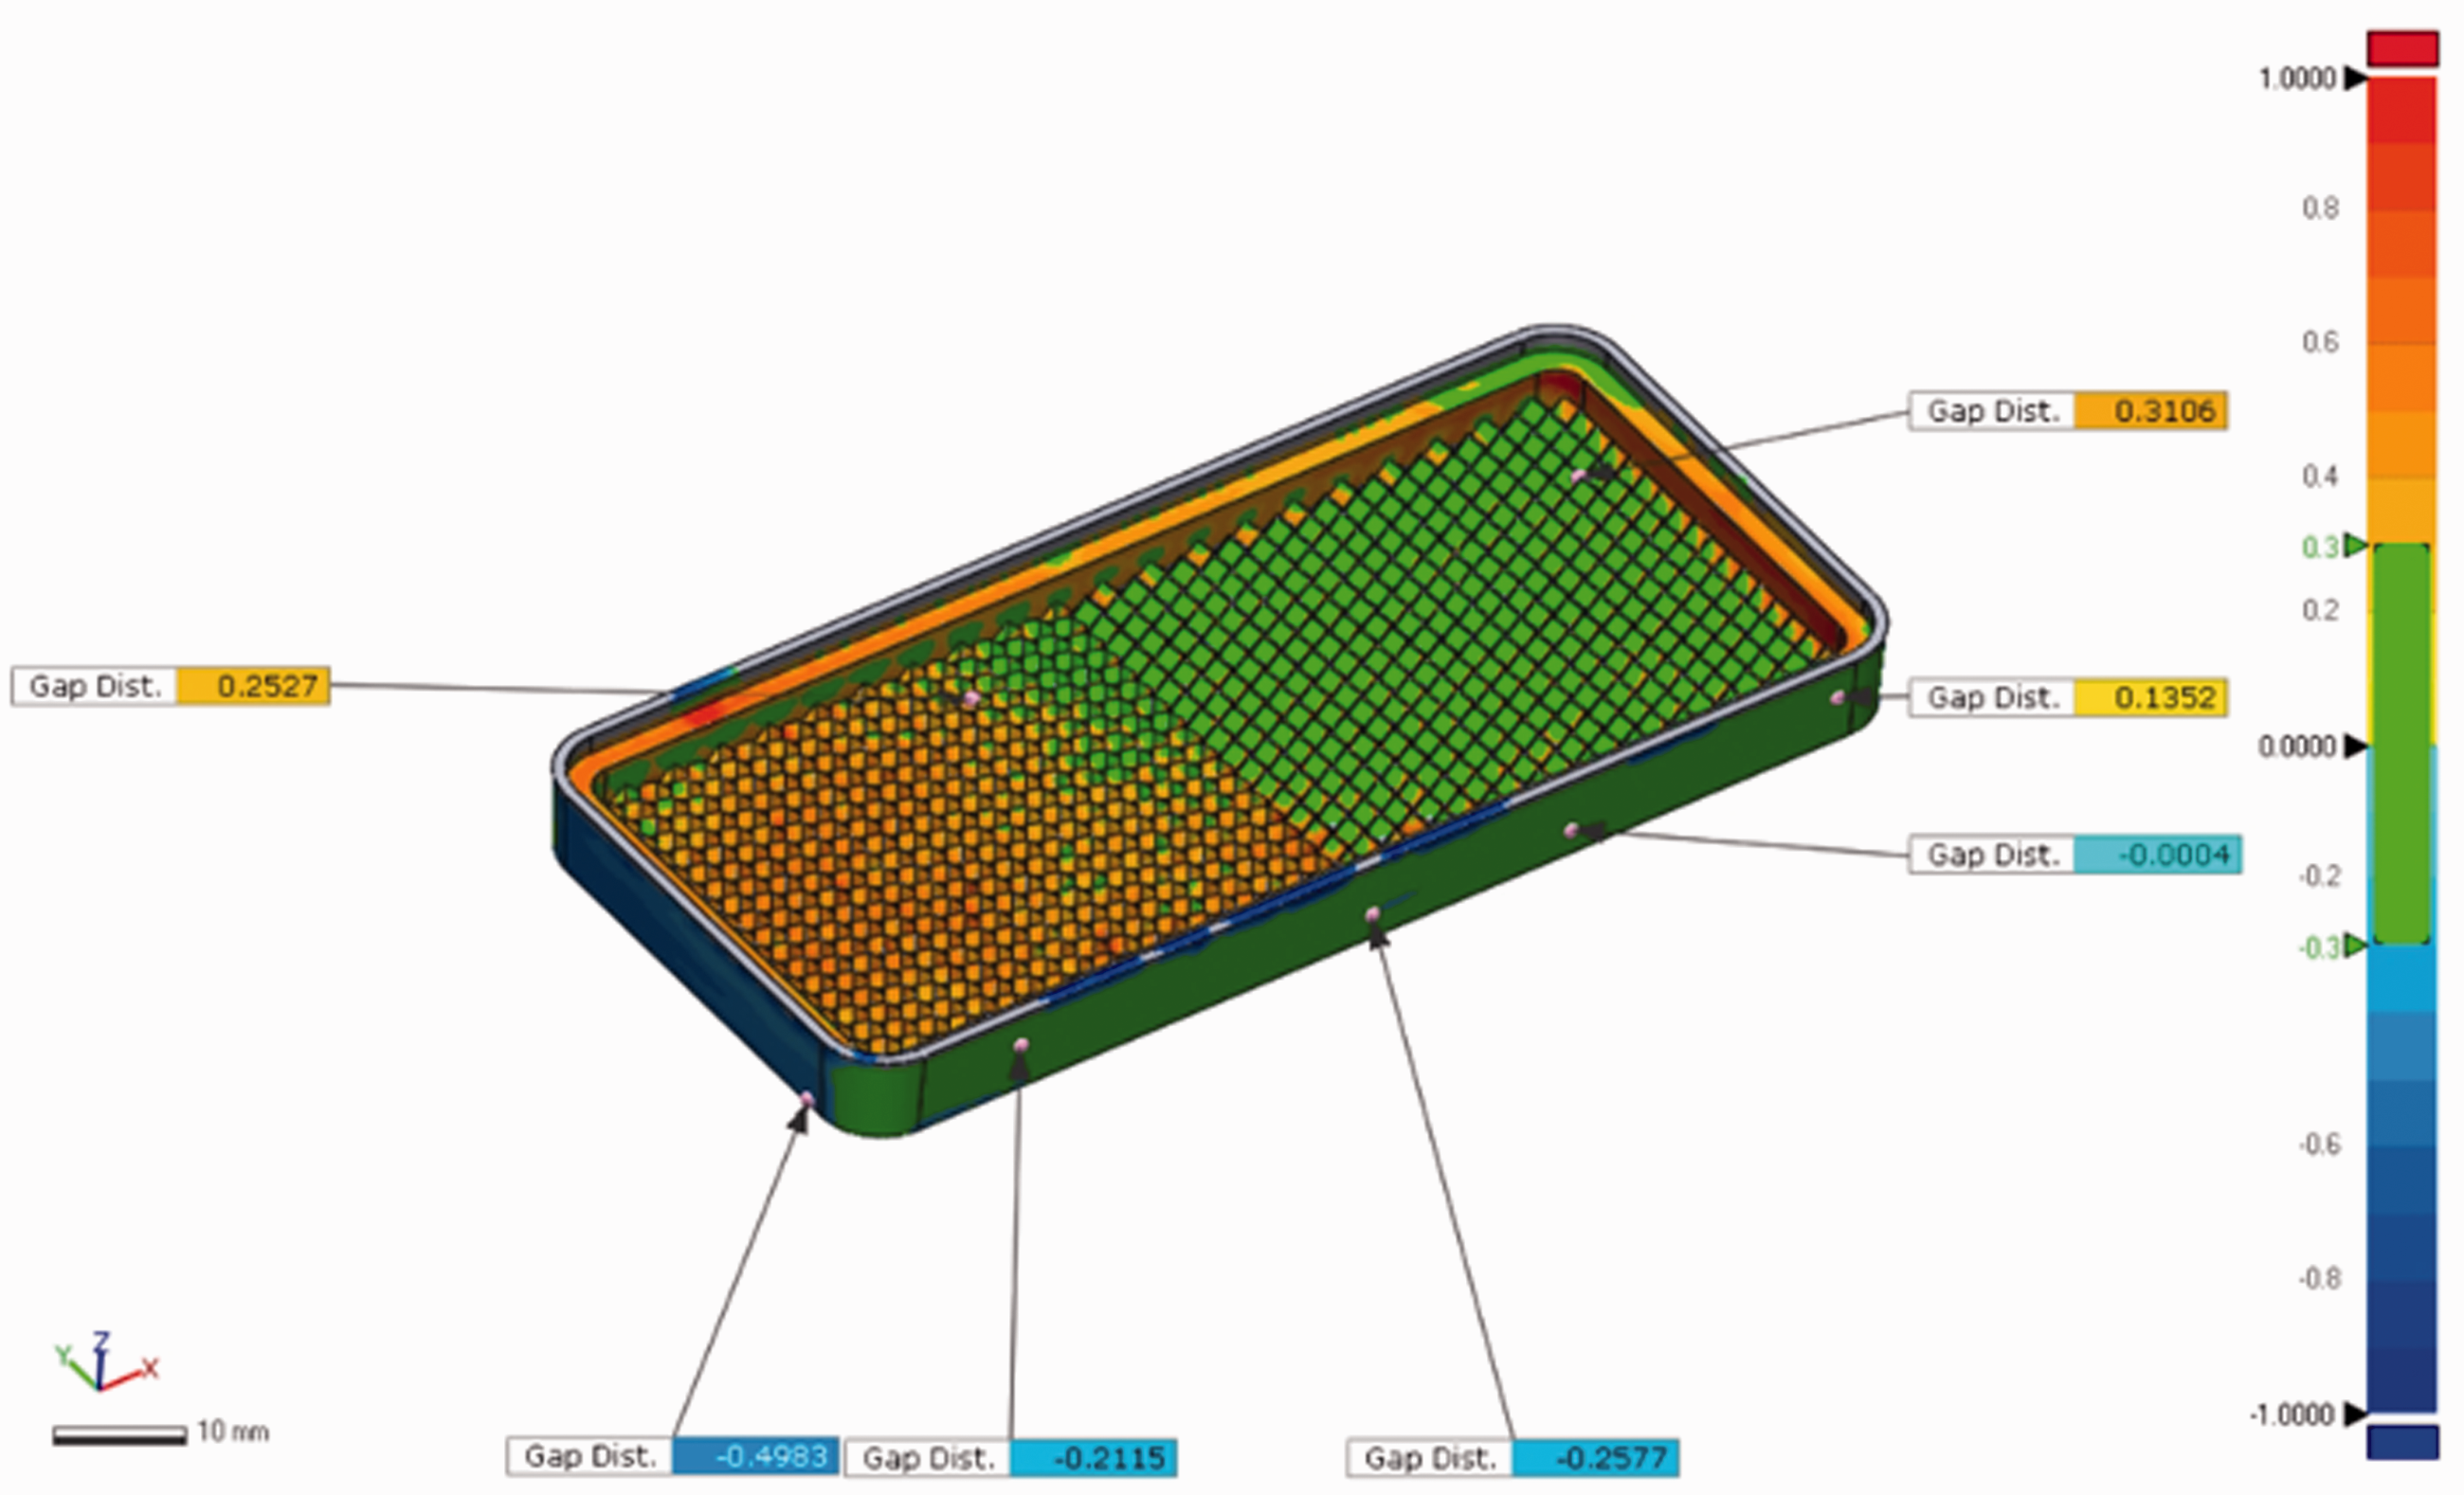
Deviation analysis of the produced SLM sample.
It should be highlighted that overall, the resulting dimensional measurements of the SLM reflector have minimal deviation in comparison with the CNC reflector. Moreover, difficulty in machining resulting from surface complexity of the CNC insert contributed to increasing deviation values specifically for the patterned feature.
Light reflectivity test
Since the manufactured end-products are vehicle reflectors, measuring the light reflections is an essential parameter that further compares the functionality of both the SLM and CNC processes. No such research on measuring the light reflectivity has yet been reported in the literature to evaluate the end-products performance. The purpose of the test is to display and quantify the intensity of the light reflected from these sample reflectors in order to achieve the desired functional effectiveness. The experiment was carried out in an optical laboratory where light was controlled. The experiment consists of an optical source where the light is illuminated, the SLM and CNC produced samples and an optical power meter to measure the light intensity/power as shown in Figure 13.
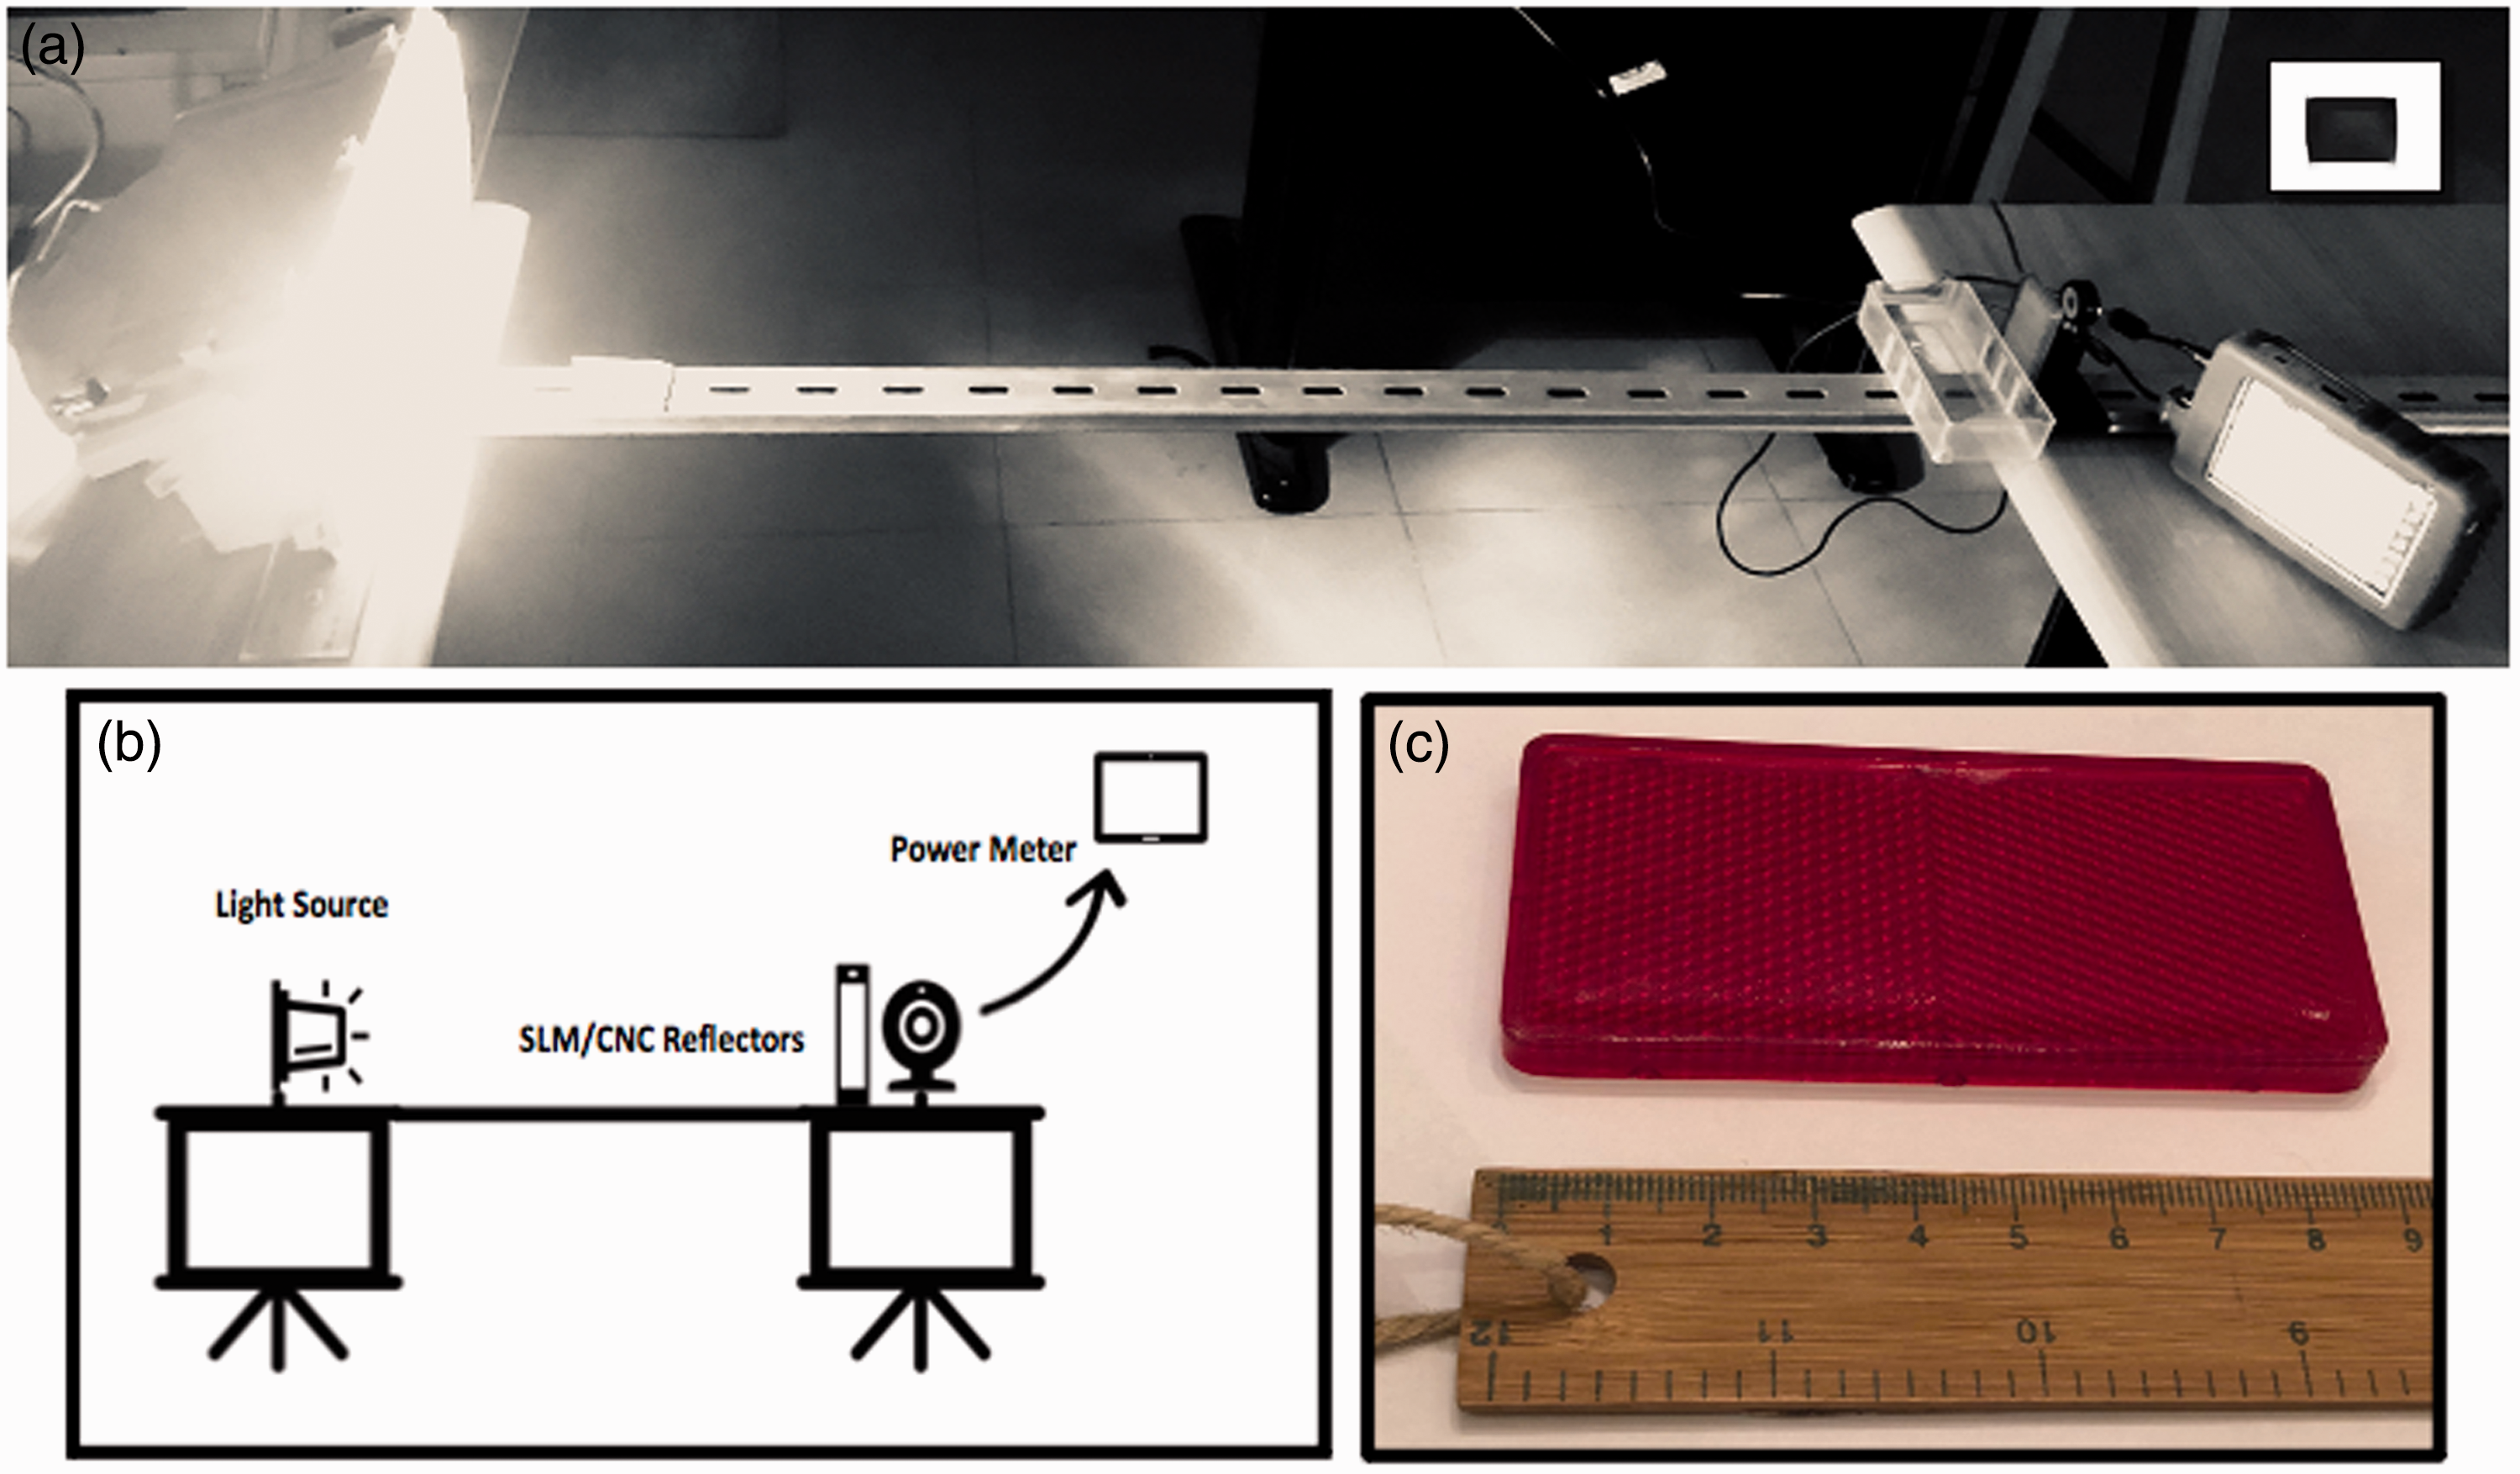
(a) Experimental setup to measure light intensity using a PM200 optical power meter. (b) Schematic illustration of the test setup. (c) Injection moulded reflector.
The light source is an automotive headlamp equipped with an H4 12 V 130/90 W Halogen bulb which transmits light centered at a wavelength of 532 nm and has a bandwidth of 100 KHz. The output light from the source propagates along the channel on the Y axis (with variable distances) until it reaches the produced sample reflector. The distance between the light source and the tested specimens in the X and Z axes are fixed throughout the tests. The amount of light transcending through the reflectors provides an inverse relation to the reflection intensity of the reflectors. The reflected light is diverged in different directions (with different angles) and light is distributed.
In this study light intensity is measured as the light transmitted through the reflector rather than the reflected light from the reflector. In the case of measuring light reflectivity, the power meter will have to be placed in between the power source and the reflector. Hence, causing distortion and error in results due to the absorption of some light from the power meter. For that reason, in this study, the transmitted light through the reflectors are the measured intensity for more efficient and accurate results. The optical power meter used is a Thorlabs PM200 module that can record power up to 150 W. The module has a high sensitivity silicon PIN photodiode (PM16-121C) attached to the meter that covers the visible light wavelengths range (i.e. 400–700 µm). It has a response time of less than 1 µs allowing variations of frequencies up to 1 MHz to be measured.
The test is performed in darkness in order to avoid background light and any interference from other sources. Six experiments at different distances were carried out for each specimen to analyze variation in light transmitted through the reflectors. For each experiment (i.e. at each distance), the light is firstly recorded in order to measure the light intensity reaching such a distance with no reflections directly from the light source. The reflector produced from the CNC is then placed at this distance and the transmitted light is recorded to measure reflectivity of the sample. The sample is then replaced by the SLM-produced reflector and the transmitted power is also recorded to compare its functional effectiveness.
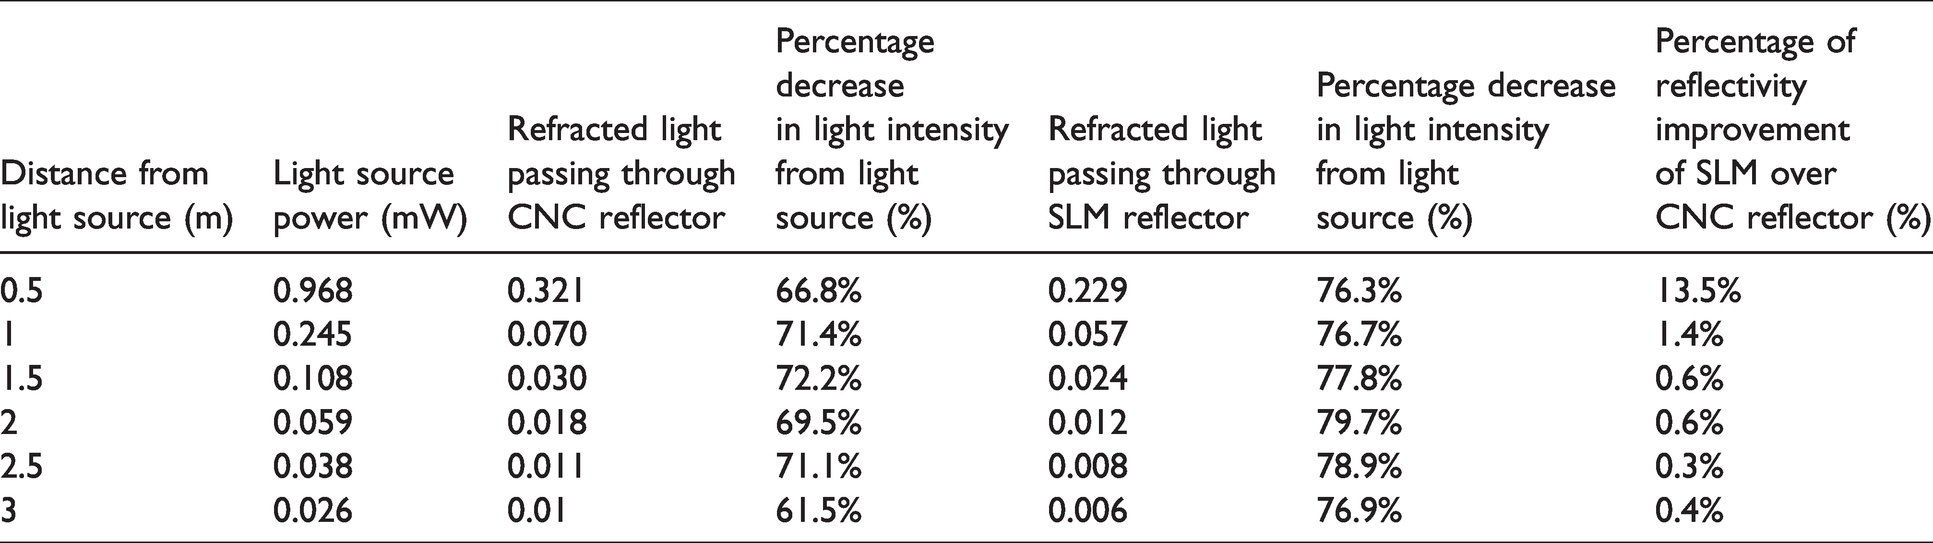
At 0.5 m distance, the light power before reflection was measured at 0.968 mW. The refracted ray passing through the CNC reflector recorded 66.8% substantial descent in power reading (i.e. 0.321 mW) due to the reflection of light by the vehicle reflector. Similarly, a 76.3% decline in light intensity is recorded using the SLM reflector with power of only 0.229 mW. These measurements show that light transmitted through the SLM reflector is less than that of the CNC sample which indicates that the reflectivity of the SLM produced reflector is higher at 13.5%.
These measurements are repeated at 1 m, 1.5 m, 2 m, 2.5 m and 3 m and all recorded powers are displayed in Table 3. Figure 14 demonstrates a graphical illustration of the measured light power transmitted directly from the light source versus the light transmitted through the SLM and CNC reflectors.
Measurements of the light power readings and percentage decrease in light intensity and improvement in reflectivity.
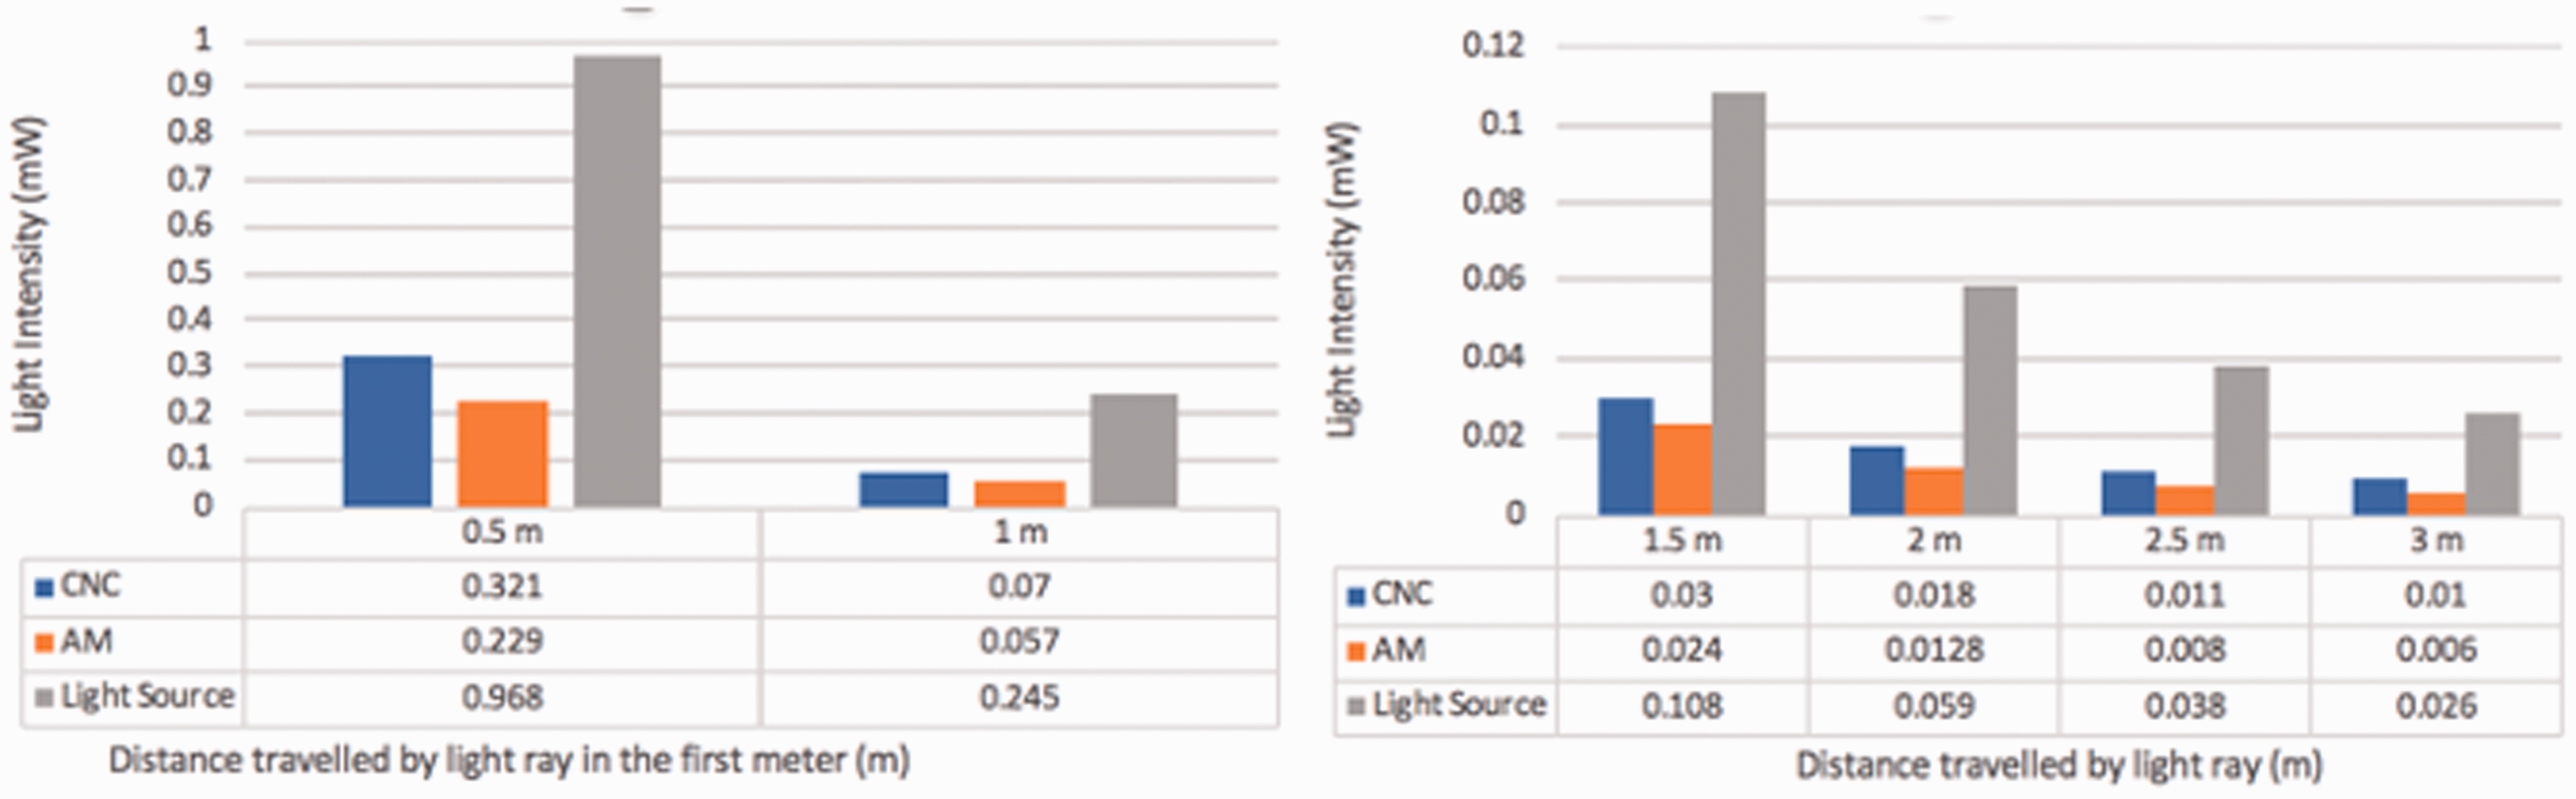
Measured light intensities at different distances.
A substantial decrease is shown between the first readings at 0.5 m as compared to further readings at other distances. The light intensity was considerably high at 0.5 m and gradually diminished at further distances. Therefore, the percentage in reflectivity improvement of the SLM reflector over the CNC reflector was calculated. The highest improvement of 13.5% was recorded at 0.5 m. The percentage improvements that followed at further distances showed a significant fall in values until 0.4% improvement in reflectivity was reached for the SLM reflector.
It is perceived that a decline in light intensity is notable after the reflectors are placed infront of the power meter. Starting from a distance of 0.5 m until 3 m, the percentage decrease in light power is directly proportional to the distance travelled by the light ray. Figure 15 depicts the changes occuring in light intensity as distance varies.
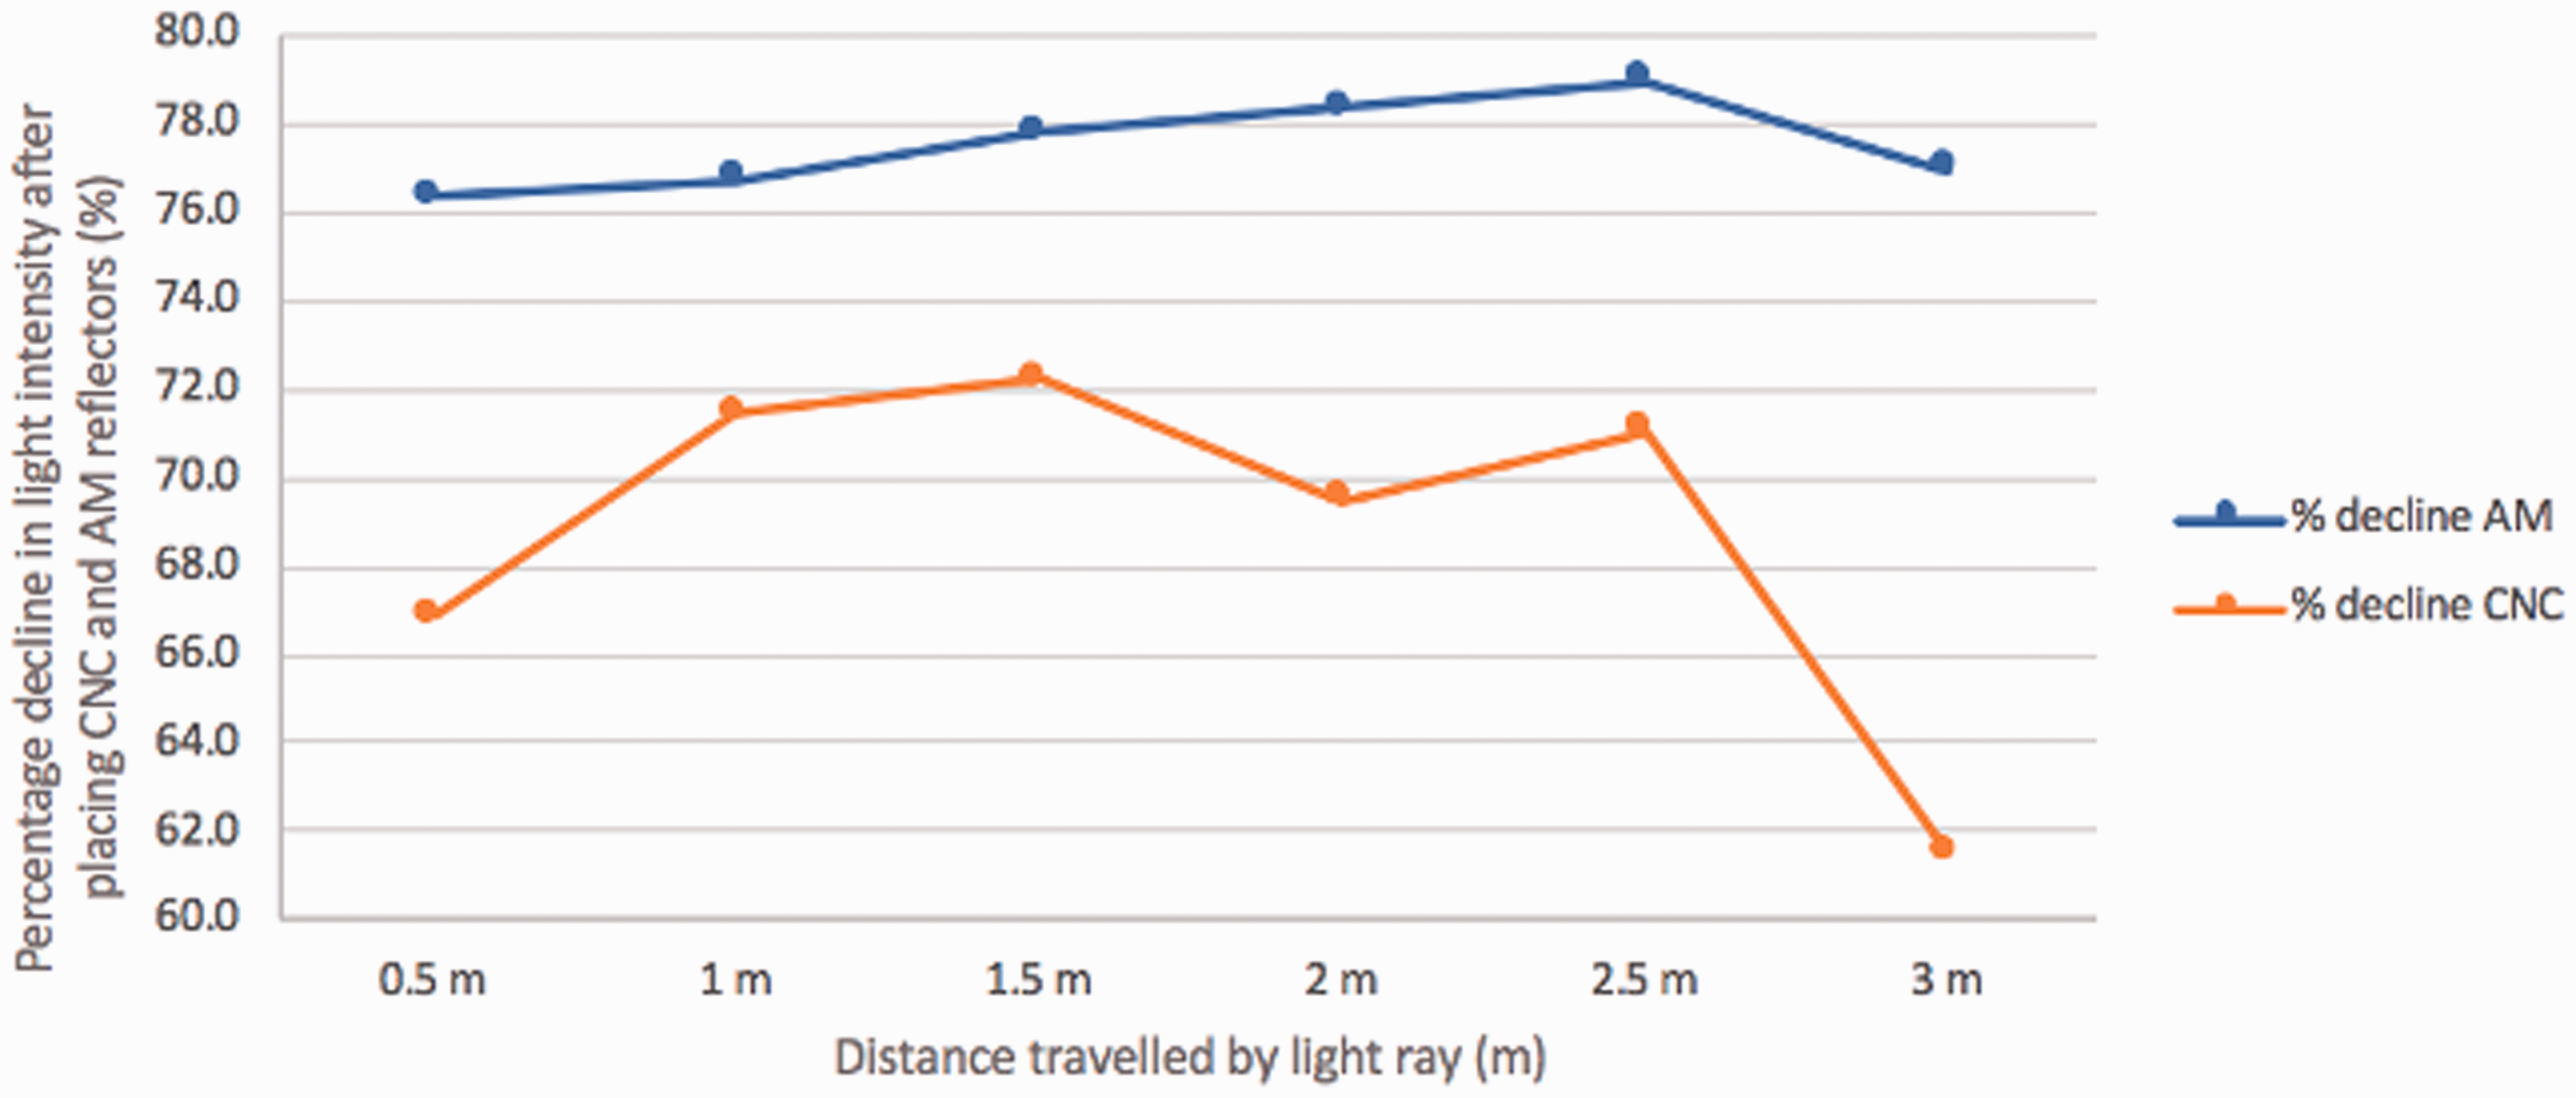
Percentage decline in light intensity after placing CNC and SLM produced reflectors at different distances.
It was noted that the light power measured after placing the SLM reflector continuously indicated a lower value of transmitted light power, as compared to the light power measured from the CNC reflector. This experiment was determined on verifying reflection competencies of the reflectors. Therefore, if the value of the measured light power of a certain reflector for a given distance is higher than the value of the other reflector, then it proves that the reflector with the higher light power shows less reflection capabilities. For all the established trials, the CNC-produced reflector gave the higher light power as opposed to the SLM reflector. Therefore, the SLM-produced reflector demonstrates enhanced reflection capabilities.
Conclusions
In this study, CNC machining and SLM techniques were successfully used for the production of an automotive vehicle reflector’s tool insert. The SLM tool insert achieved significant benefits in terms of surface roughness, dimensional accuracy and product functionality. In terms of surface roughness, it was concluded that the SLM-fabricated inserts and hence the SLM-produced inserts proved to have relatively lower values of surface roughness in comparison to their CNC counterparts. SLM is advantageous when dealing with complex geometries attaining required geometries, surface roughness, and maintaining dimensional accuracy. Therefore, this work proposes that the active inserts are to be fabricated using SLM as an improvement to quality characteristics and to be fitted into the machined pocket of the actual bolster.
The optical test performed verified that the reflectors are functional. The SLM reflector reflectivity improvement surpassed that of the CNC reflector, with a maximum improvement of 13.5% at 0.5 m and 0.4% at 3 m. As a result, due to higher geometrical accuracy of the SLM-produced reflector, reflection capabilities surpass those of the CNC-produced reflector. Therefore, this study recommends that SLM is the processing approach to be adopted for fabricating the reflector.
Footnotes
Acknowledgements
The authors are appreciative of the technical support provided by Croft Additive Manufacturing Ltd (UK) and Al Fouad for Automotive Spare Parts Co. (Egypt) for the assistance provided during the preparation of this paper.
Declaration of conflicting interests
The author(s) declared no potential conflicts of interest with respect to the research, authorship, and/or publication of this article.
Funding
The author(s) received no financial support for the research, authorship, and/or publication of this article.