
Abstract
Determining the root causes of various noise, vibration and harshness phenomena in modern automotive drivetrains is a critical task for industry, since noise, vibration and harshness issues often result in worsened driving experience. The aim of the current research is to investigate the dynamics during dry clutch engagement and the associated – often problematic – oscillations. This paper reports the development and partial validation of numerical models to study dry clutch behaviour. The models are used to investigate the influence of clutch and throttle actuation on the occurrence of unwanted clutch oscillations. The dynamic coefficient of friction between the clutch interacting surfaces was measured using a pin-on-disc rig under different slip speeds and contact pressure conditions, which are representative of a typical clutch engagement manoeuvre. The paper highlights the occurrence of instability issues in clutch dynamics (disc radial mode) as potential generators of aggressive noise, vibration and harshness, particularly during two different clutch pedal actuations. Such analysis has not hitherto been reported in the open literature.
Introduction
The development of modern automotive powertrains must consider – often contradictory – design aspects, including: efficiency, vehicle performance, emissions and passenger comfort. The automotive drivetrain is a source of various noise, vibration and harshness (NVH) phenomena,1–3 which cause the aggravation of the driver. Identifying the root causes of drivetrain NVH is crucial in the modern automotive industry, as the vehicle’s NVH performance directly affects the passengers’ perception of vehicle quality and influences their comfort. Medium to high frequency NVH issues can be generated by instabilities in dynamic friction systems, such as dry clutches and brake systems, 2 which can be attributed to friction-induced vibrations. 3
A potential source of drivetrain NVH is the clutch system. Single or dual dry clutches are employed in automotive drivetrains due to their reliability and efficiency combined with low fuel consumption. The key advantages of the dry clutch systems are their low maintenance cost and operational response. Nevertheless, the main drawback is that the transmitted torque from the engine to the rest of the powertrain is restricted due to the limited thermal capacity and stability of the clutch system. In order to ensure driving comfort, it is essential to eliminate problematic clutch oscillations. 4 The latter may lead to complex noise and vibration phenomena because of the interactions between the moving parts. 5 In order to investigate any of the clutch NVH issues, it is essential to capture accurately the process of clutch engagement and disengagement. Thus, various studies have been dedicated to simulating the engagement – disengagement cycles of dry clutch systems.
Dutta et al. 6 presented a clutch engagement model which was used to analyse drivetrain torsional oscillations under different engagement conditions. The angular velocity and displacement of the clutch, slippage time and angle of the clutch disc can be predicted. Szadkowski and Morford 7 and Szadkowski and Mcnerney 8 designed a three degree-of-freedom (DoF) torsional model of a dry clutch system to simulate the engagement process in heavy duty vehicles. The analysis showed the importance of driver behaviour on the clutch performance. In particular it was observed that during lower slip speeds between the flywheel and clutch disc, a smoother engagement process could be achieved, extending the life of the engine and driveline components.
Hoic et al. 9 explored the axial vibrations of the pressure plate during engagement utilising an axial/torsional dry clutch model. It was observed that axial dynamics do not have a strong influence on NVH when the clutch is fully engaged. During engagement the axial DoFs are shown to be coupled with torsional dynamics, acting as a source of NVH issues. Ozansoy et al. 10 developed a clutch model to study the effect of pressure plate axial vibrations on NVH during engagement. The model and experiments show the importance of axial vibration in the clutch system; however, clutch disc wobbling behaviour which may interact with axial vibratory behaviour is neglected. Wickramarachi et al. 11 presented a six-DoF model capable of predicting commonly observed mode coupling instabilities in dry clutch systems including the consideration of the first pressure plate elastic deformation mode. The paper shows stability for various combinations of system parameters, highlighting that the friction coefficient has significant influence on mode coupling. Trinh et al. 12 used a very similar dynamic model for stability analysis as in Wickramarachi et al. 11 to investigate the advantages of multi-element generalized polynomial chaos over Monte Carlo methods to efficiently account for the uncertainty in multiple parameters. The analysis and results presented in liteterature11,12 clearly show dependency of stability on design parameters; however, incorporation of such models to consider time varying actuation forces and friction coefficient variation on stability during clutch engagement manoeuvres is not reported.
The novelty of the present work is the combination of the following aspects in a single analysis: (i) development of a transient torsional dry clutch model (validated against vehicle experimental measurements) to simulate the engagement/disengagement process, (ii) measurements of the clutch component friction coefficient using a pin-on-disc machine at the laboratory for clutch engagement operating conditions and (iii) development of a six-DoF clutch model (excluding torsional motion) to implement input data captured during various engagement processes in order to examine clutch oscillations and system stability that may be related to particular NVH issues.
Methodology
The clutch investigated in the current study originates from a mid-range vehicle. A single friction disc is attached to the transmission input shaft, while the flywheel is directly connected to the clutch cover, rotating in unison with the pressure plate. A certain degree of pressure plate axial motion results from retraction of the release bearing, creating an axial force due to the diaphragm spring. The clamping load that presses against the friction disc lining generates friction between the discs, allowing for torque transfer from the engine to the rest of the driveline.
The methodology presented herewith comprises two dynamic models: (i) a transient torsional model for simulating clutch engagement and (ii) a six-DoF model (including axial, radial and tilting DoFs) to examine clutch dynamics during various engagement manoeuvres. Gyroscopic terms have not been included due to the decoupling of clutch torsional motion and tilting actions. Measurements of the friction coefficient were conducted in the laboratory using samples from clutch components.
Transient torsional dry clutch model
A schematic representation of the torsional (three-DoF) clutch system model is shown in Figure 1.
13
The first component on the left-hand side of the figure contains the effective mass moments of inertia of the engine Torsional dry clutch model.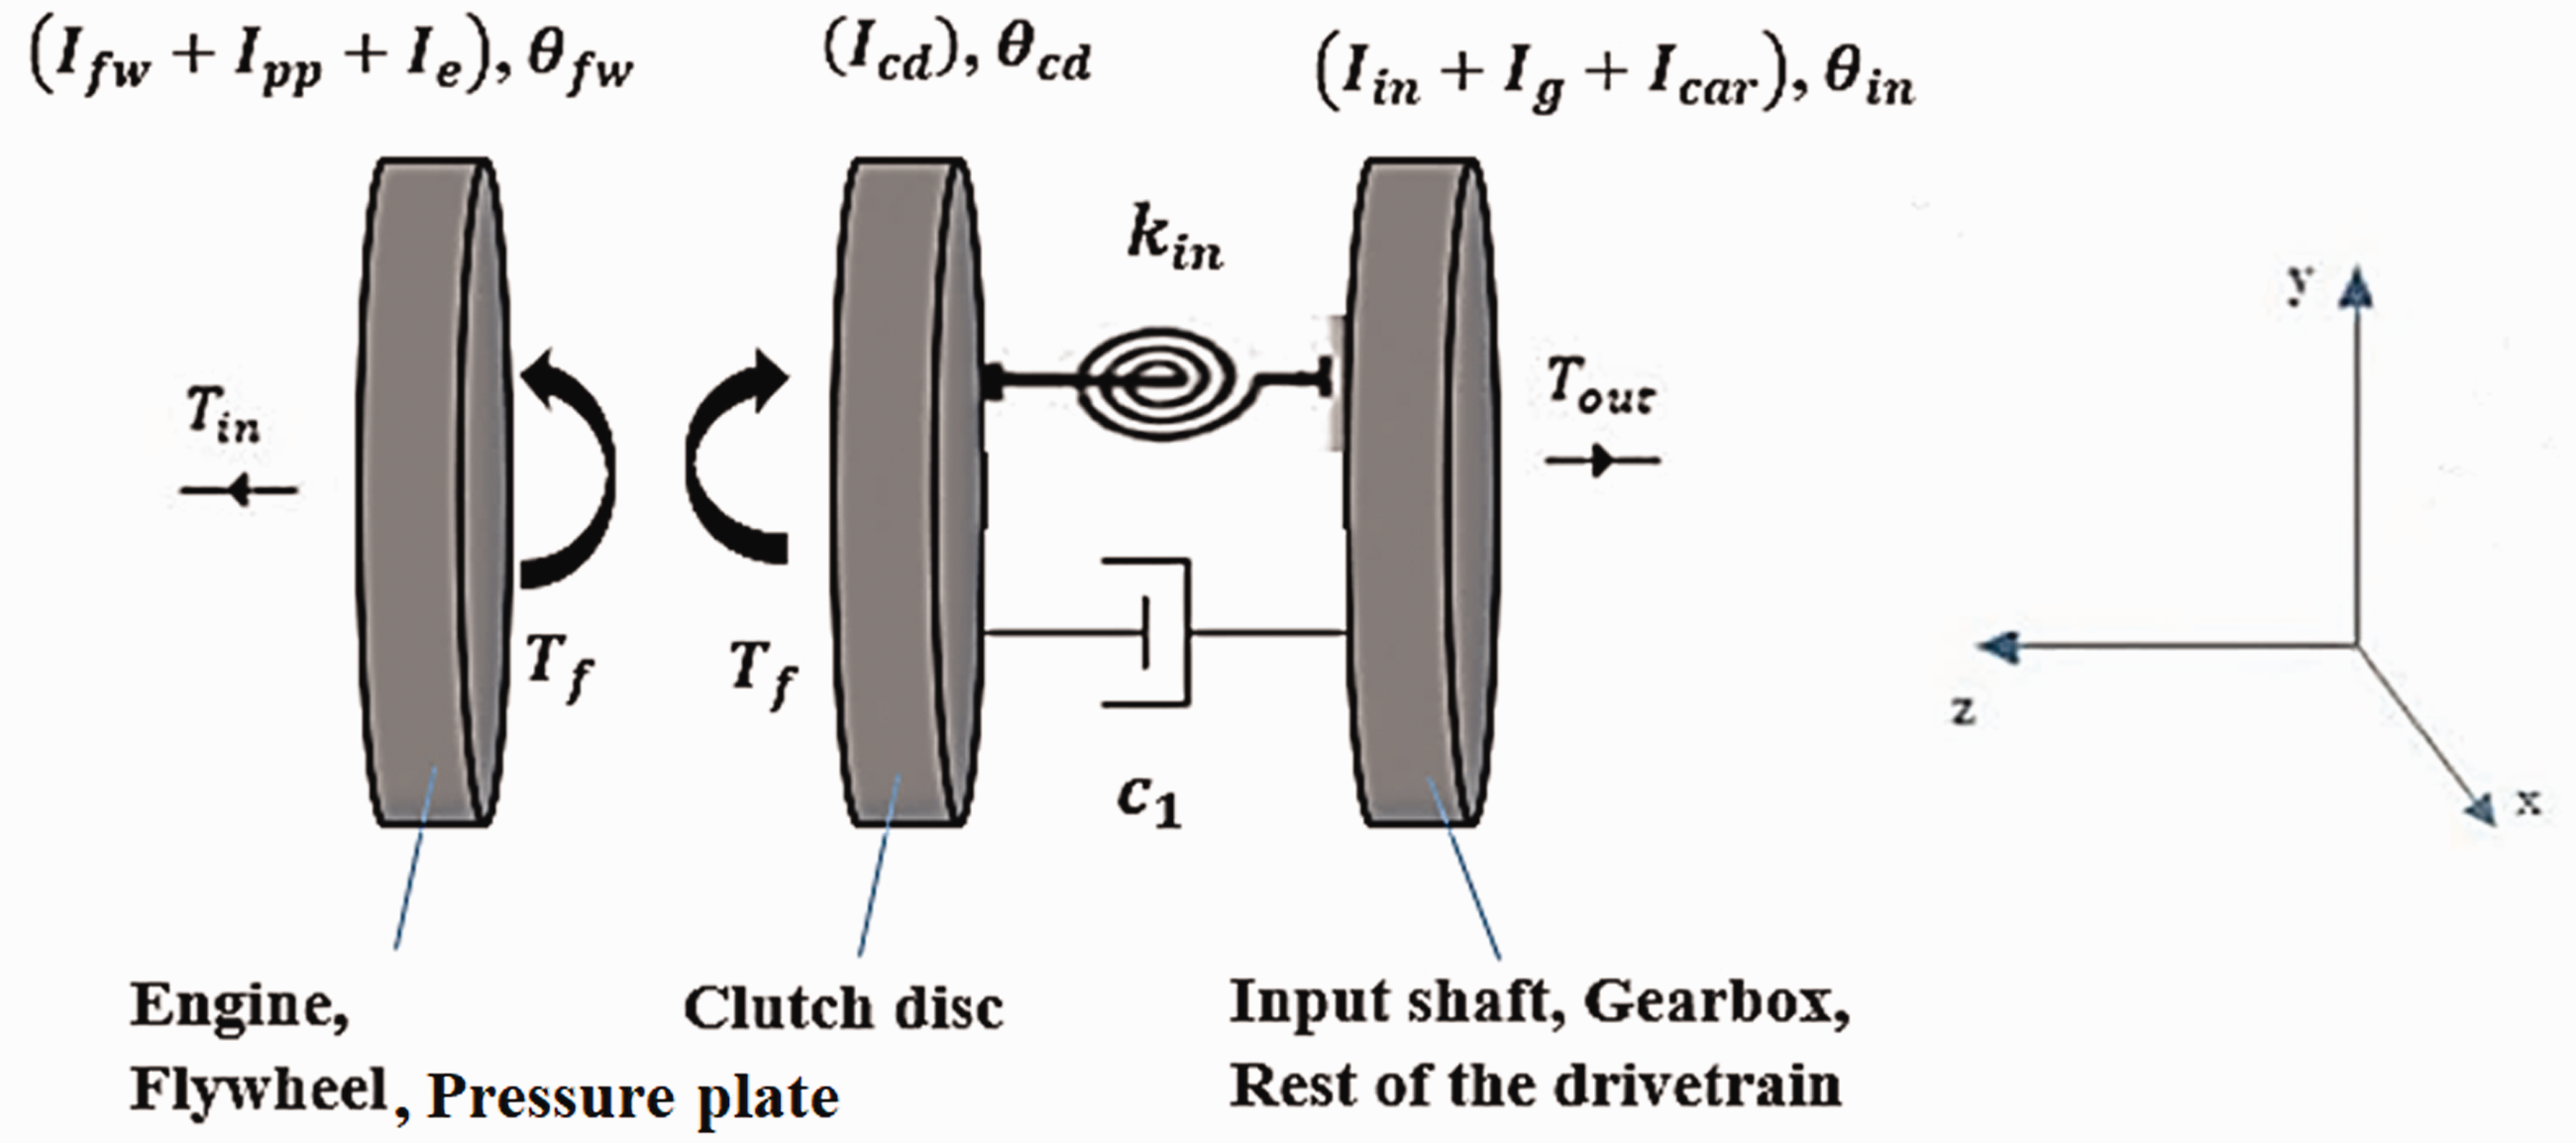
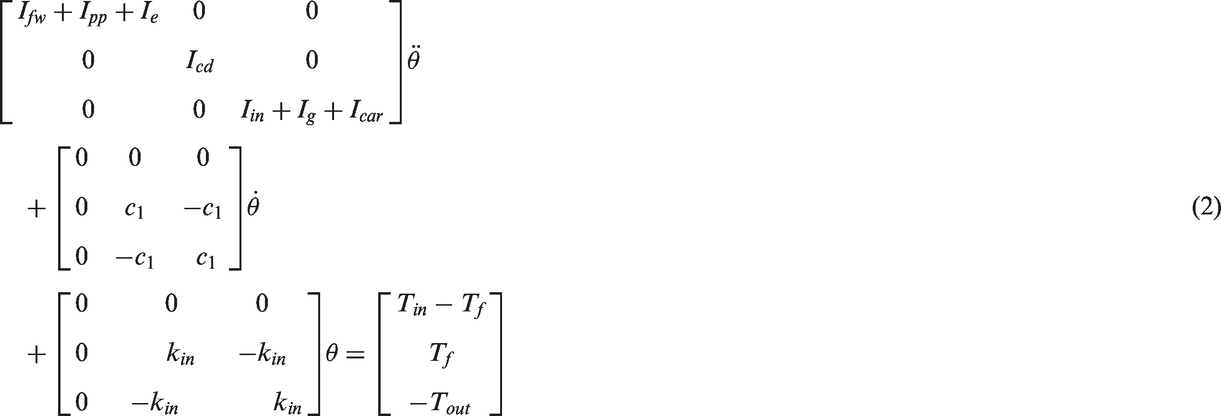
The angular displacements of the flywheel and pressure plate, clutch disc and input shaft are given by

After the engagement phase is complete, the flywheel, pressure plate and the clutch disc rotate in unison and the system can be described as ‘locked-up.’
15
As a result, the torsional model can be reduced to a two-DoF system (as shown in Figure 2) with static friction acting between the pressure plate/flywheel and the clutch disc.
The engaged torsional dry clutch model.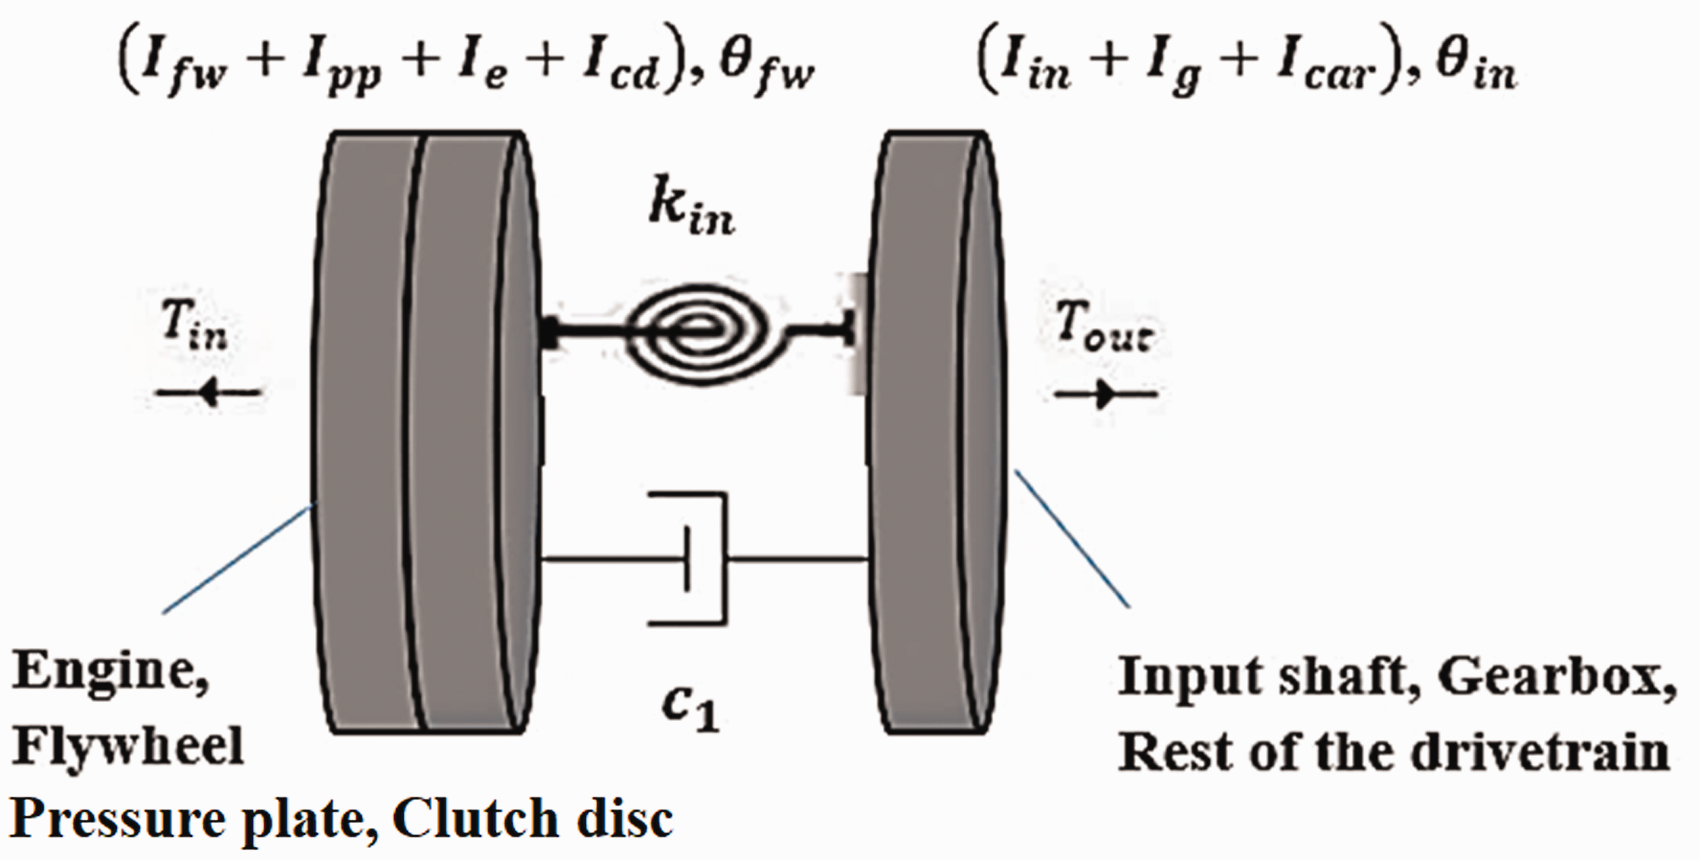
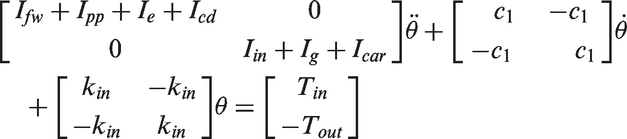
When the clutch is ‘locked up,’ the equations can be described in matrix form as
When the surface of the clutch disc is under pressure between the flywheel and the pressure plate, friction enables the transmission of the engine torque. The effective radius can be determined by assuming uniform pressure distribution across the contacting surfaces. The kinetic friction coefficient varies across the radius of the annular interface bounded by the inner ri and outer radius ro. The effective radius re can be found by taking the quotient of the friction torque and net friction force (assuming that the friction coefficient is a linearly varying function of the slip speed)
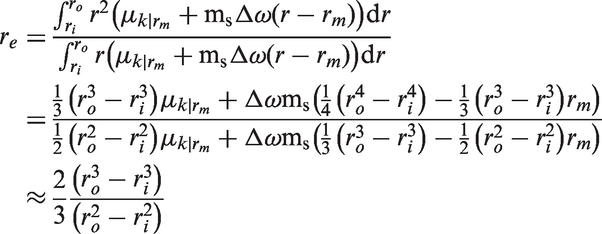


Therefore, the effective radius can be calculated using only the inner and outer radii. The kinetic friction coefficient,


The net axial force applied to the clutch disc is referred to as clamp load. Figure 3 is a schematic representation of a typical clutch system. It can be observed that the clamp load depends on the force that the diaphragm spring (Fdiaphragm), cushion spring (Fcushion) and the straps ( Clutch clamp load components.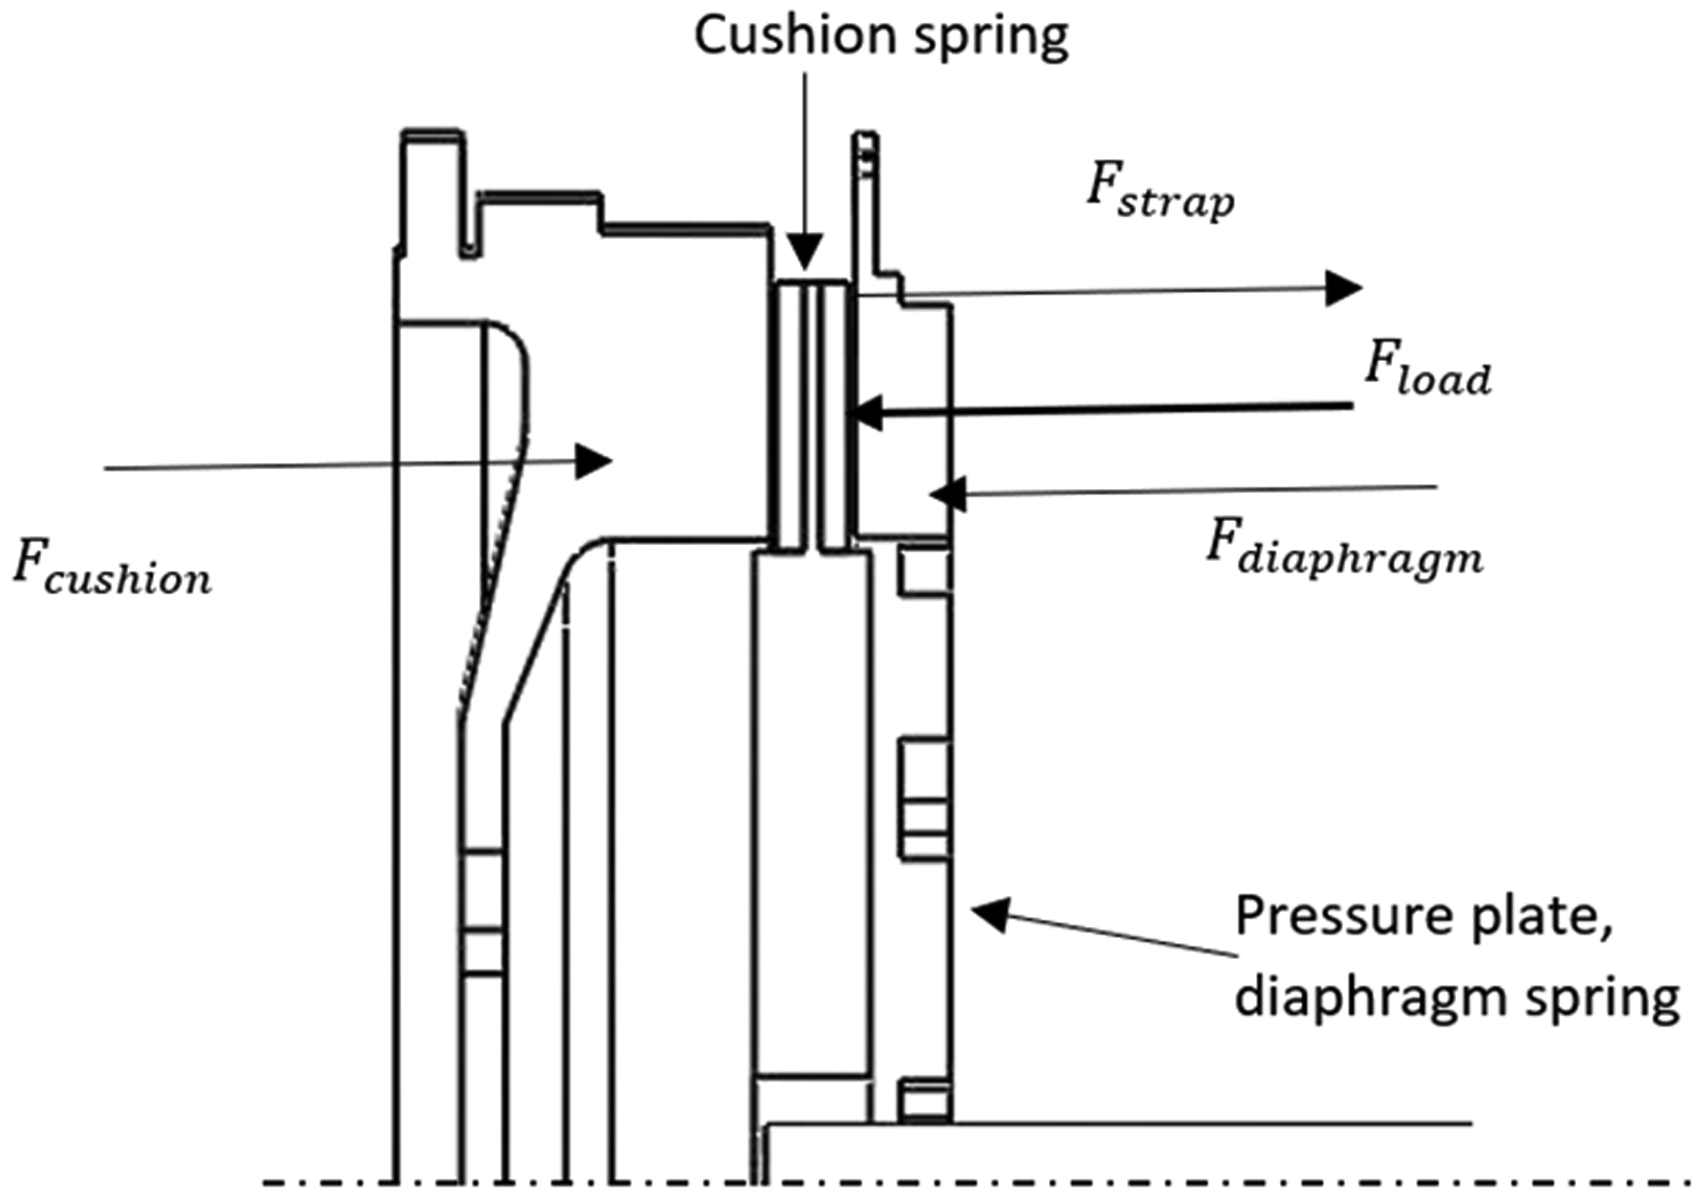

The force from the straps is assumed to be negligible compared to the force applied from the diaphragm and cushion springs; thus, the former can be neglected.
21
For the simulation of a clutch engagement manoeuvre, an exponential profile of the cushion spring force will be utilised,
22
based on typical driver behaviour. In this research, the diaphragm spring force is defined as (a) Schematic presentation of the dry clutch model excluding drivetrain torsional motion and (b) the degrees of freedom employed in the model.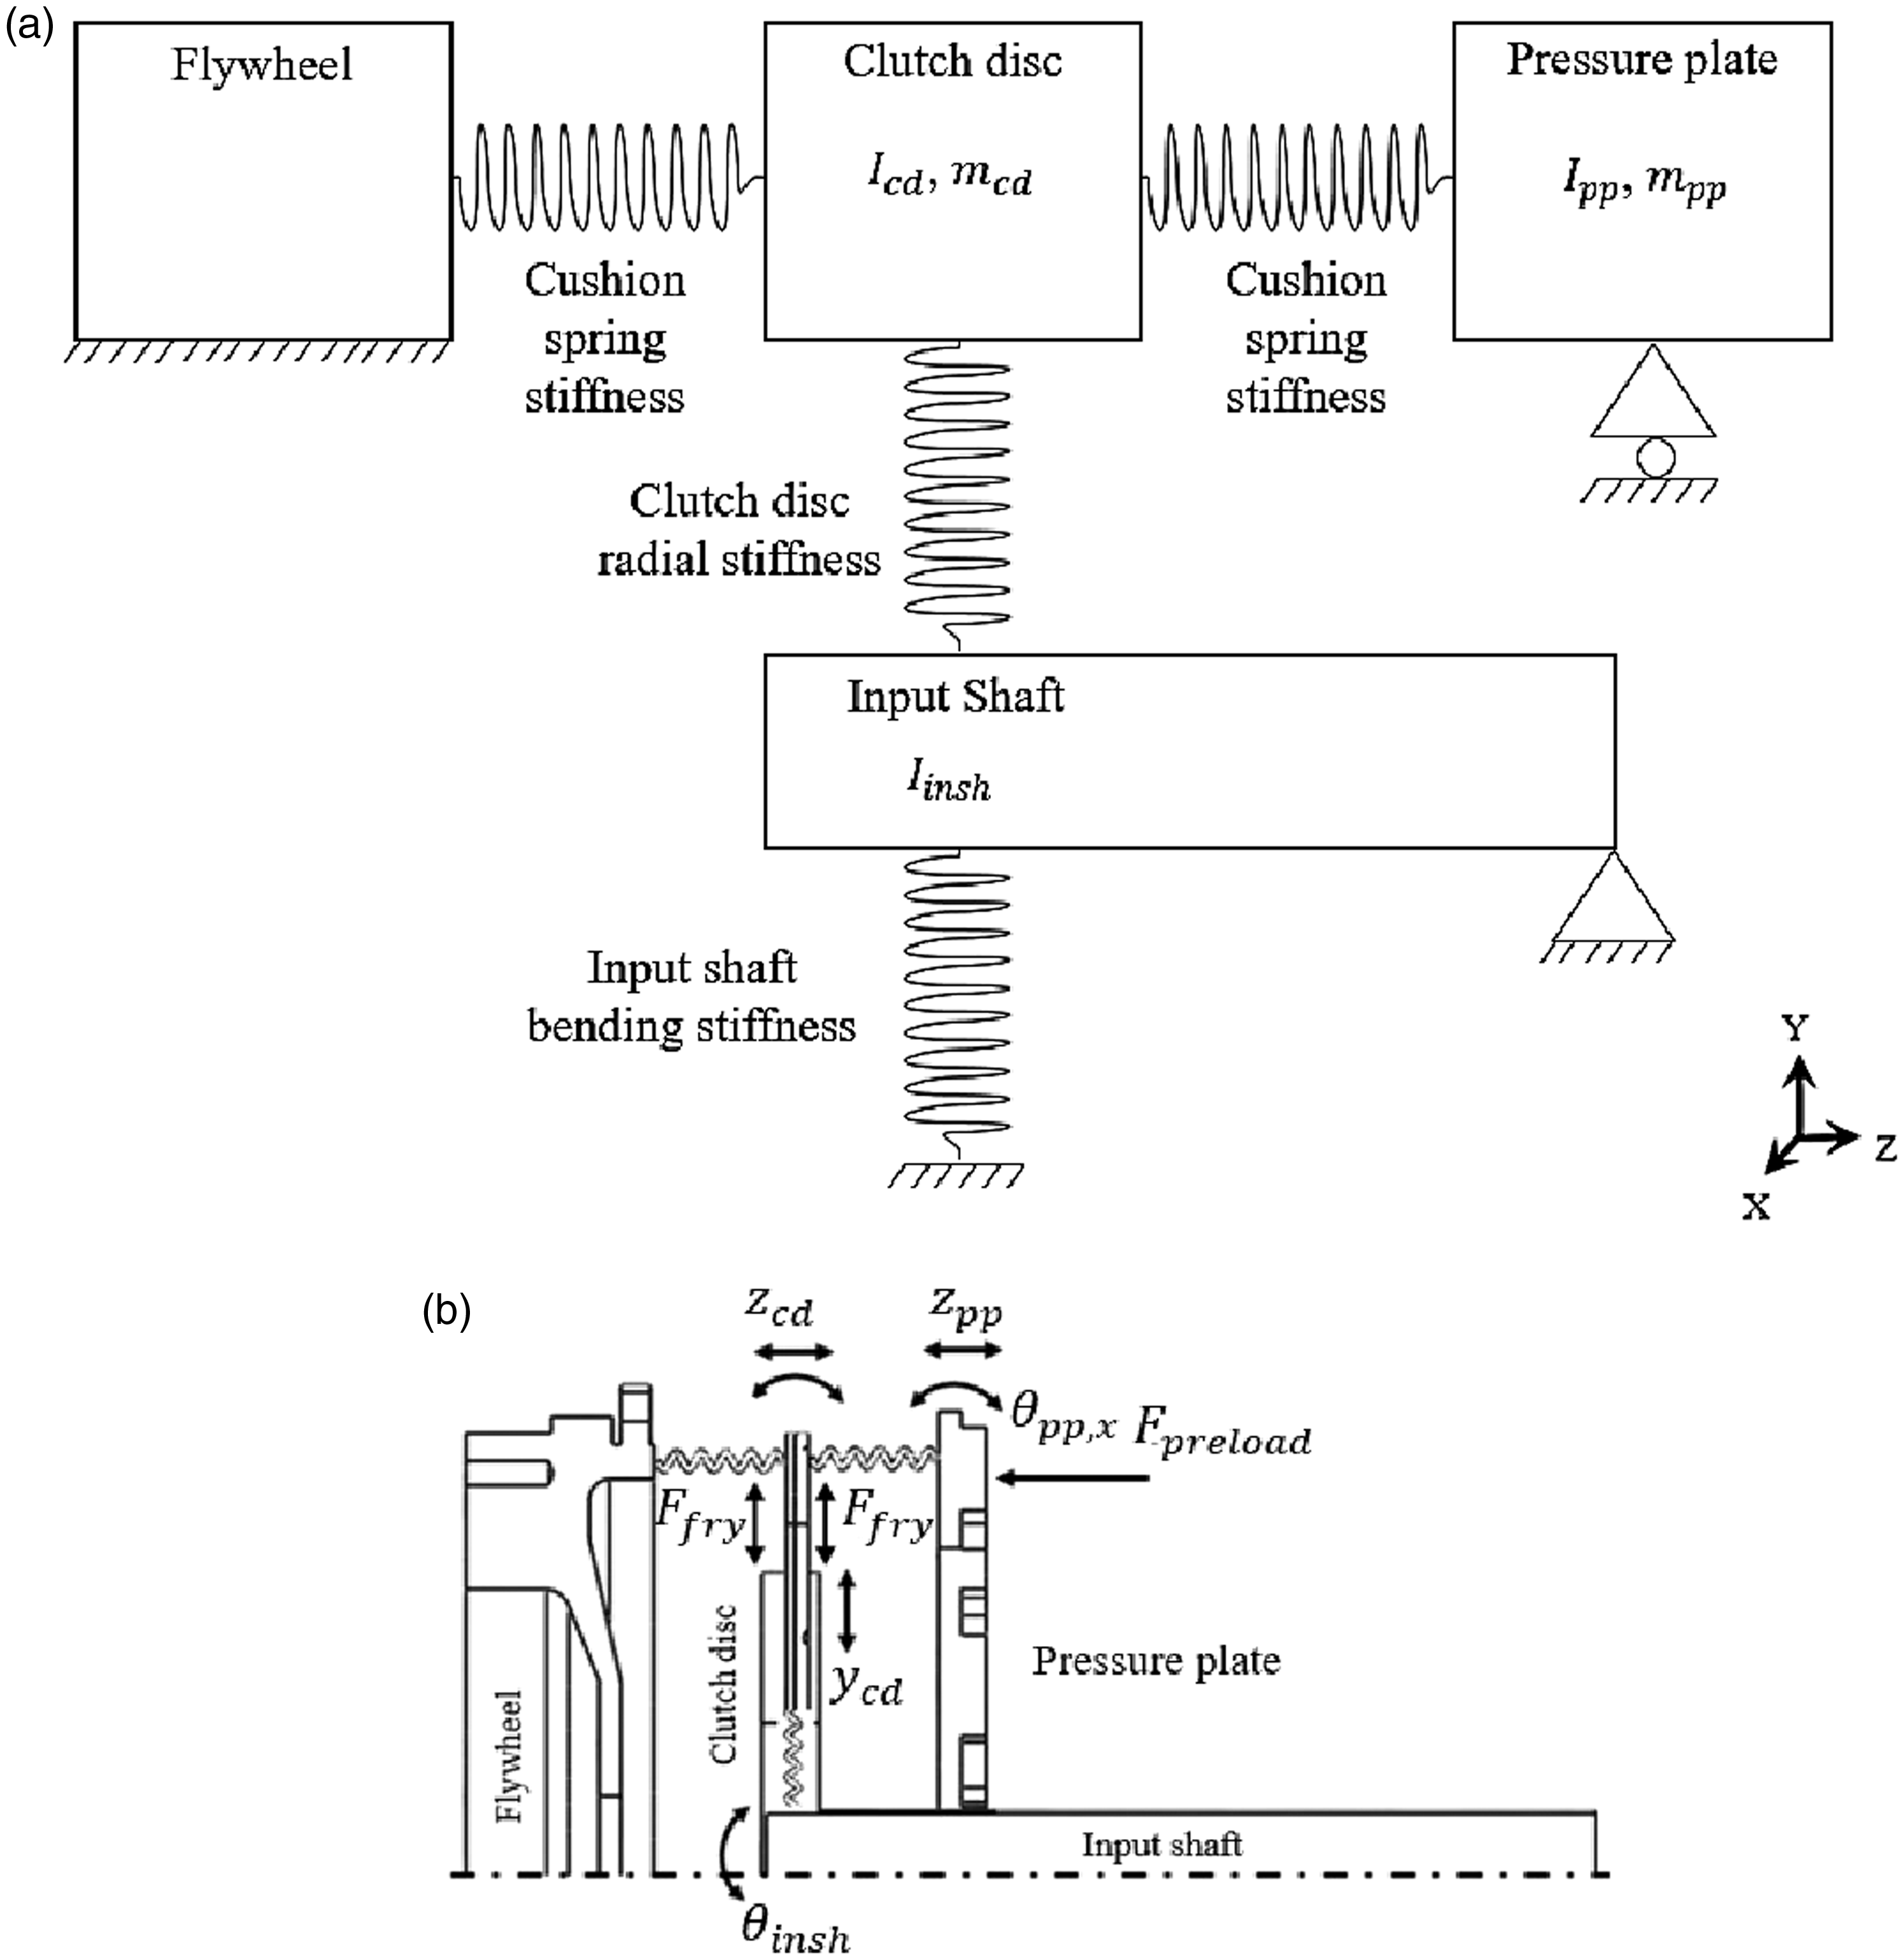

Assuming a flat road surface and negligible aerodynamic drag during vehicle pull away, the resistive torque from the rest of the drivetrain (Tout) can be simply approximated by considering the rolling resistance from the vehicle tires with radius

Clutch transient model (excluding torsional motion)
The aim of the current study is to investigate clutch NVH behaviour during different engagement manoeuvres with varying clamp load, coefficient of friction and engagement time. A second clutch model excluding torsional degrees of freedom but comprising axial, bending and tilting motions was developed, as shown in Figure 4. This is an attempt to capture clutch NVH behaviour by using a two-dimensional model, which is more efficient computationally. The degrees of freedom employed in the clutch model are uncoupled from the rotational motion of the drivetrain; such an approach is often described in the literature. Chen et al. 24 introduced a two-DoF model, simulating only the radial motions of the clutch disc in two directions. Senatore et al. 25 considered the tilting motion of the pressure plate in an uncoupled manner with respect to the clutch rotational motion. Freitag et al. 26 explained that a critical DoF for NVH studies is the tilting motion of the clutch disc along with the transmission input shaft bending. In the present work, a combination of key DoF as described in the literature, accompanied with additional motions to describe clutch oscillations have been utilised.
The dry clutch model shown schematically in Figure 4 comprises: the flywheel, pressure plate, clutch disc and gearbox input shaft. The cushion spring stiffness (kcs) is introduced between the clutch disc and the flywheel and pressure plate. The radial stiffness (kr) represents the connection between the input shaft and clutch disc. Finally, the tilting stiffness of the clutch disc (ktiltcd) and pressure plate (ktiltpp), as well as the bending stiffness of the input shaft (kbend) are also considered.
The tilting stiffness of the clutch disc has been measured experimentally (Figure 5). A shaft, representing the gearbox input shaft was inserted to the hub of the circumferentially rigidly supported clutch disc. In order to calculate the tilting stiffness of the clutch disc a vertical load at a known distance is applied to the shaft. The resulting angular deflection of the shaft was measured using a digital protractor. In total, 32 measurements were conducted at 9.8 N intervals until a limit of 0.04 rad shaft deflection was met. Thereafter, 4.9 N was added at each load increment. The torque profile variation against angular deflection can be seen in Figure 6. Equation (12) represents the torque applied in the main body of the clutch disc (y) as a function of the shaft angular displacement (x) after loading the load point of the shaft as described before. The tilting stiffness of the main body was calculated using the derivative of the fifth-order polynomial function shown in equation (12).
Experimental setup to measure clutch disc tilting stiffness. Torque applied to the clutch disc main body from the attached loaded shaft vs shaft angular displacement.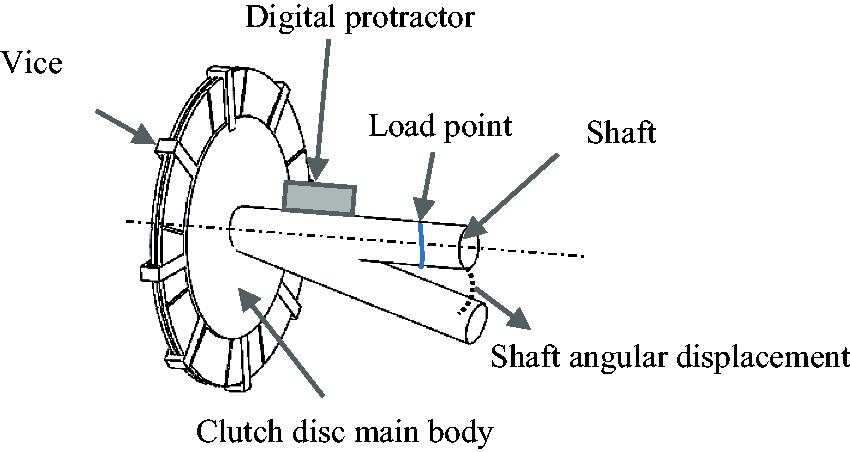
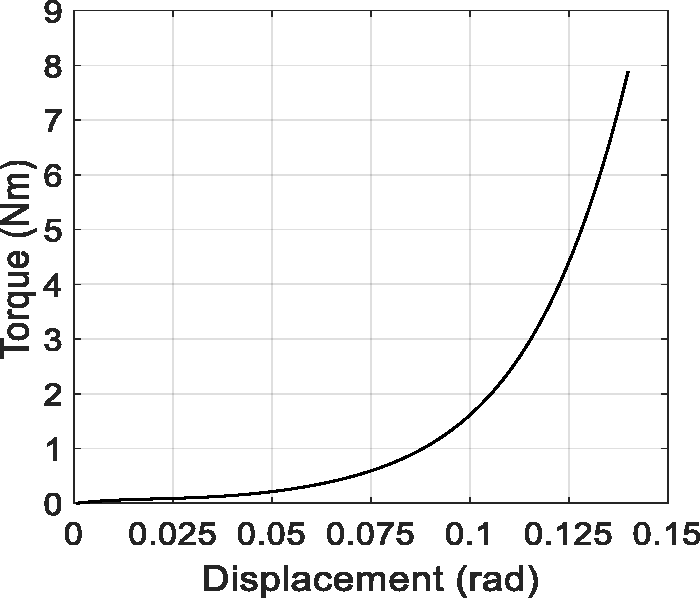

In which d = 9.512, e = −443.446, f = 11,080.741, g = −110,745.56, h = 509,283.55 and n = −0.0059.
The DoFs considered in the model presented in this section are the bending, tilting, radial and axial motions of the clutch system components, as shown in the following vector

The corresponding equations of motion (14) to (19) are described as

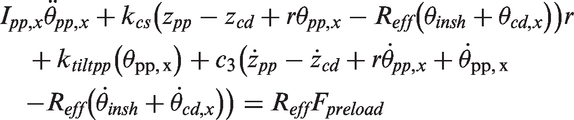

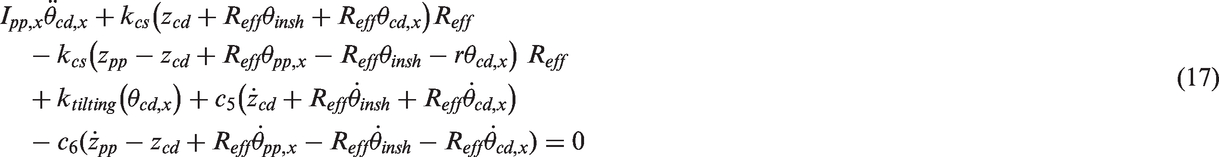
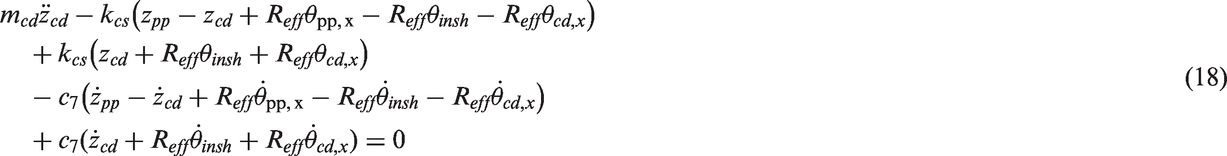
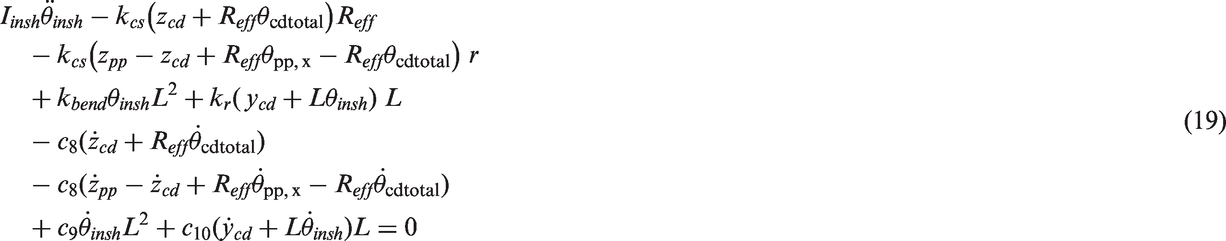
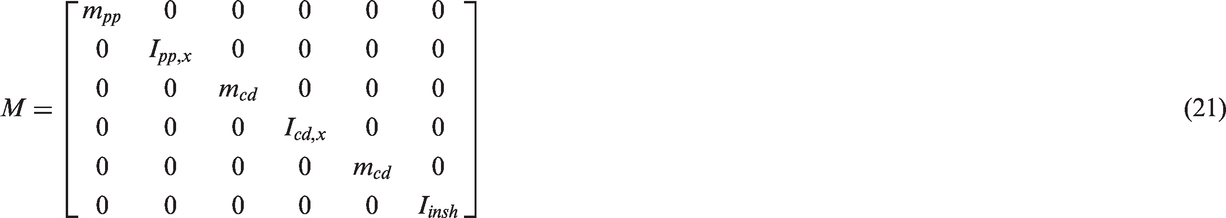
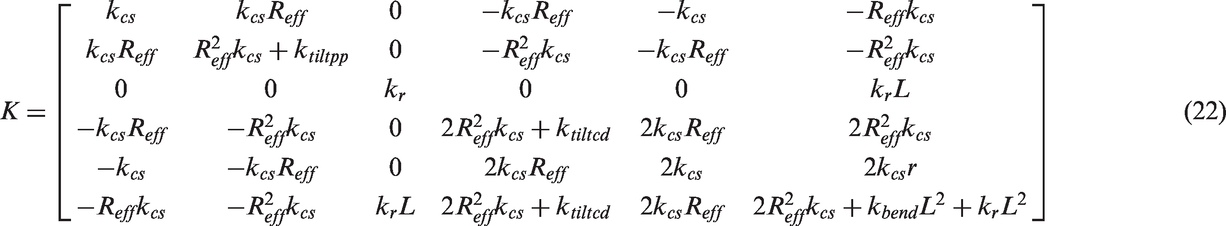
The above set of equations of motion can be written in the matrix form as shown below


A component of the friction force vector acts in the radial direction (Y-axis) due to the relative translation and rotation of the discs. The magnitude of the friction force vector is determined by the clamp load and friction coefficient.
27
Equation (24) provides the component of the friction force generated in the direction of radial motion28,29

For both clutch models, structural damping is introduced based on proportional damping

It is assumed that internal damping is low
21
and thus,


In order to conduct stability analysis, a vector solution of the following form is used

Substitutions of equation (29) into the equations of motion lead to the following

The characteristic equation is calculated as

The stability of the system can be examined using the real parts of the complex eigenvalues. 31 If any of the real parts is a positive number, then the system is unstable (Routh Hurwitz criterion). The imaginary part corresponds to the natural frequency of the corresponding mode. 32
Friction coefficient measurements
Experimental measurements of the dynamic friction coefficient.
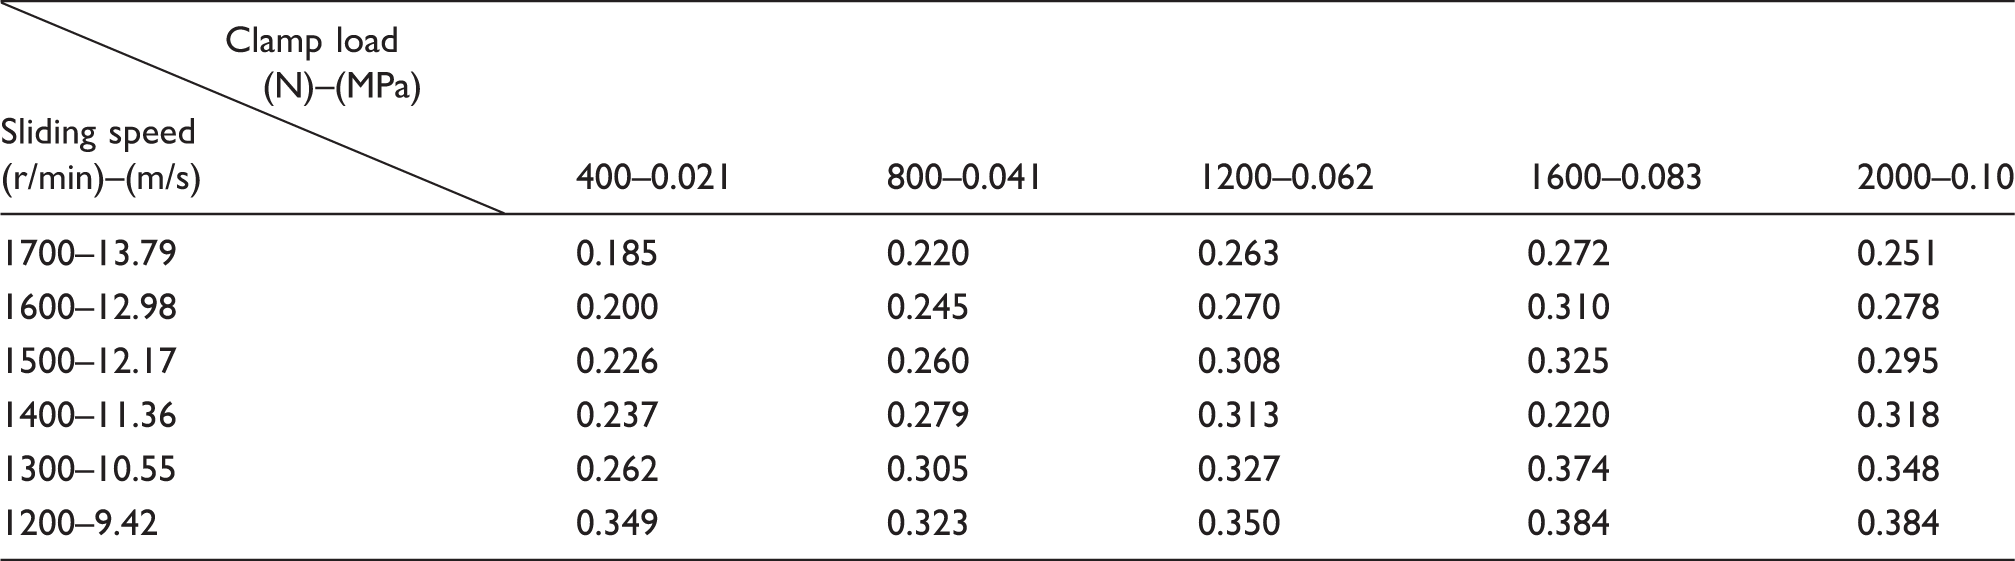
The lowest friction coefficient values occur at high sliding velocities and lower clamp load. Conversely, the highest friction coefficients are found at lower sliding velocities and higher clamp loads. The carpet plot of friction coefficients shown in Figure 7 provides values for the gradient ms with relative velocity in m/s, which is used as an input to the simulations (ms = −0.013). A typical engagement manoeuvre starts with high relative velocity between the clutch disc and the pressure plate/flywheel and it finishes when the relative velocity becomes zero. Figure 7 shows the direction of the gradient selected for this study. The static coefficient of friction, μ
st
, for the system under investigation is taken as 0.4.
30
Figure 7 presents the results of the laboratory experimental measurements of the dynamic friction coefficient variation simulating dry clutch engagement/disengagement conditions.
Coefficient of friction experimental measurements simulating dry clutch engagement/disengagement manoeuvre.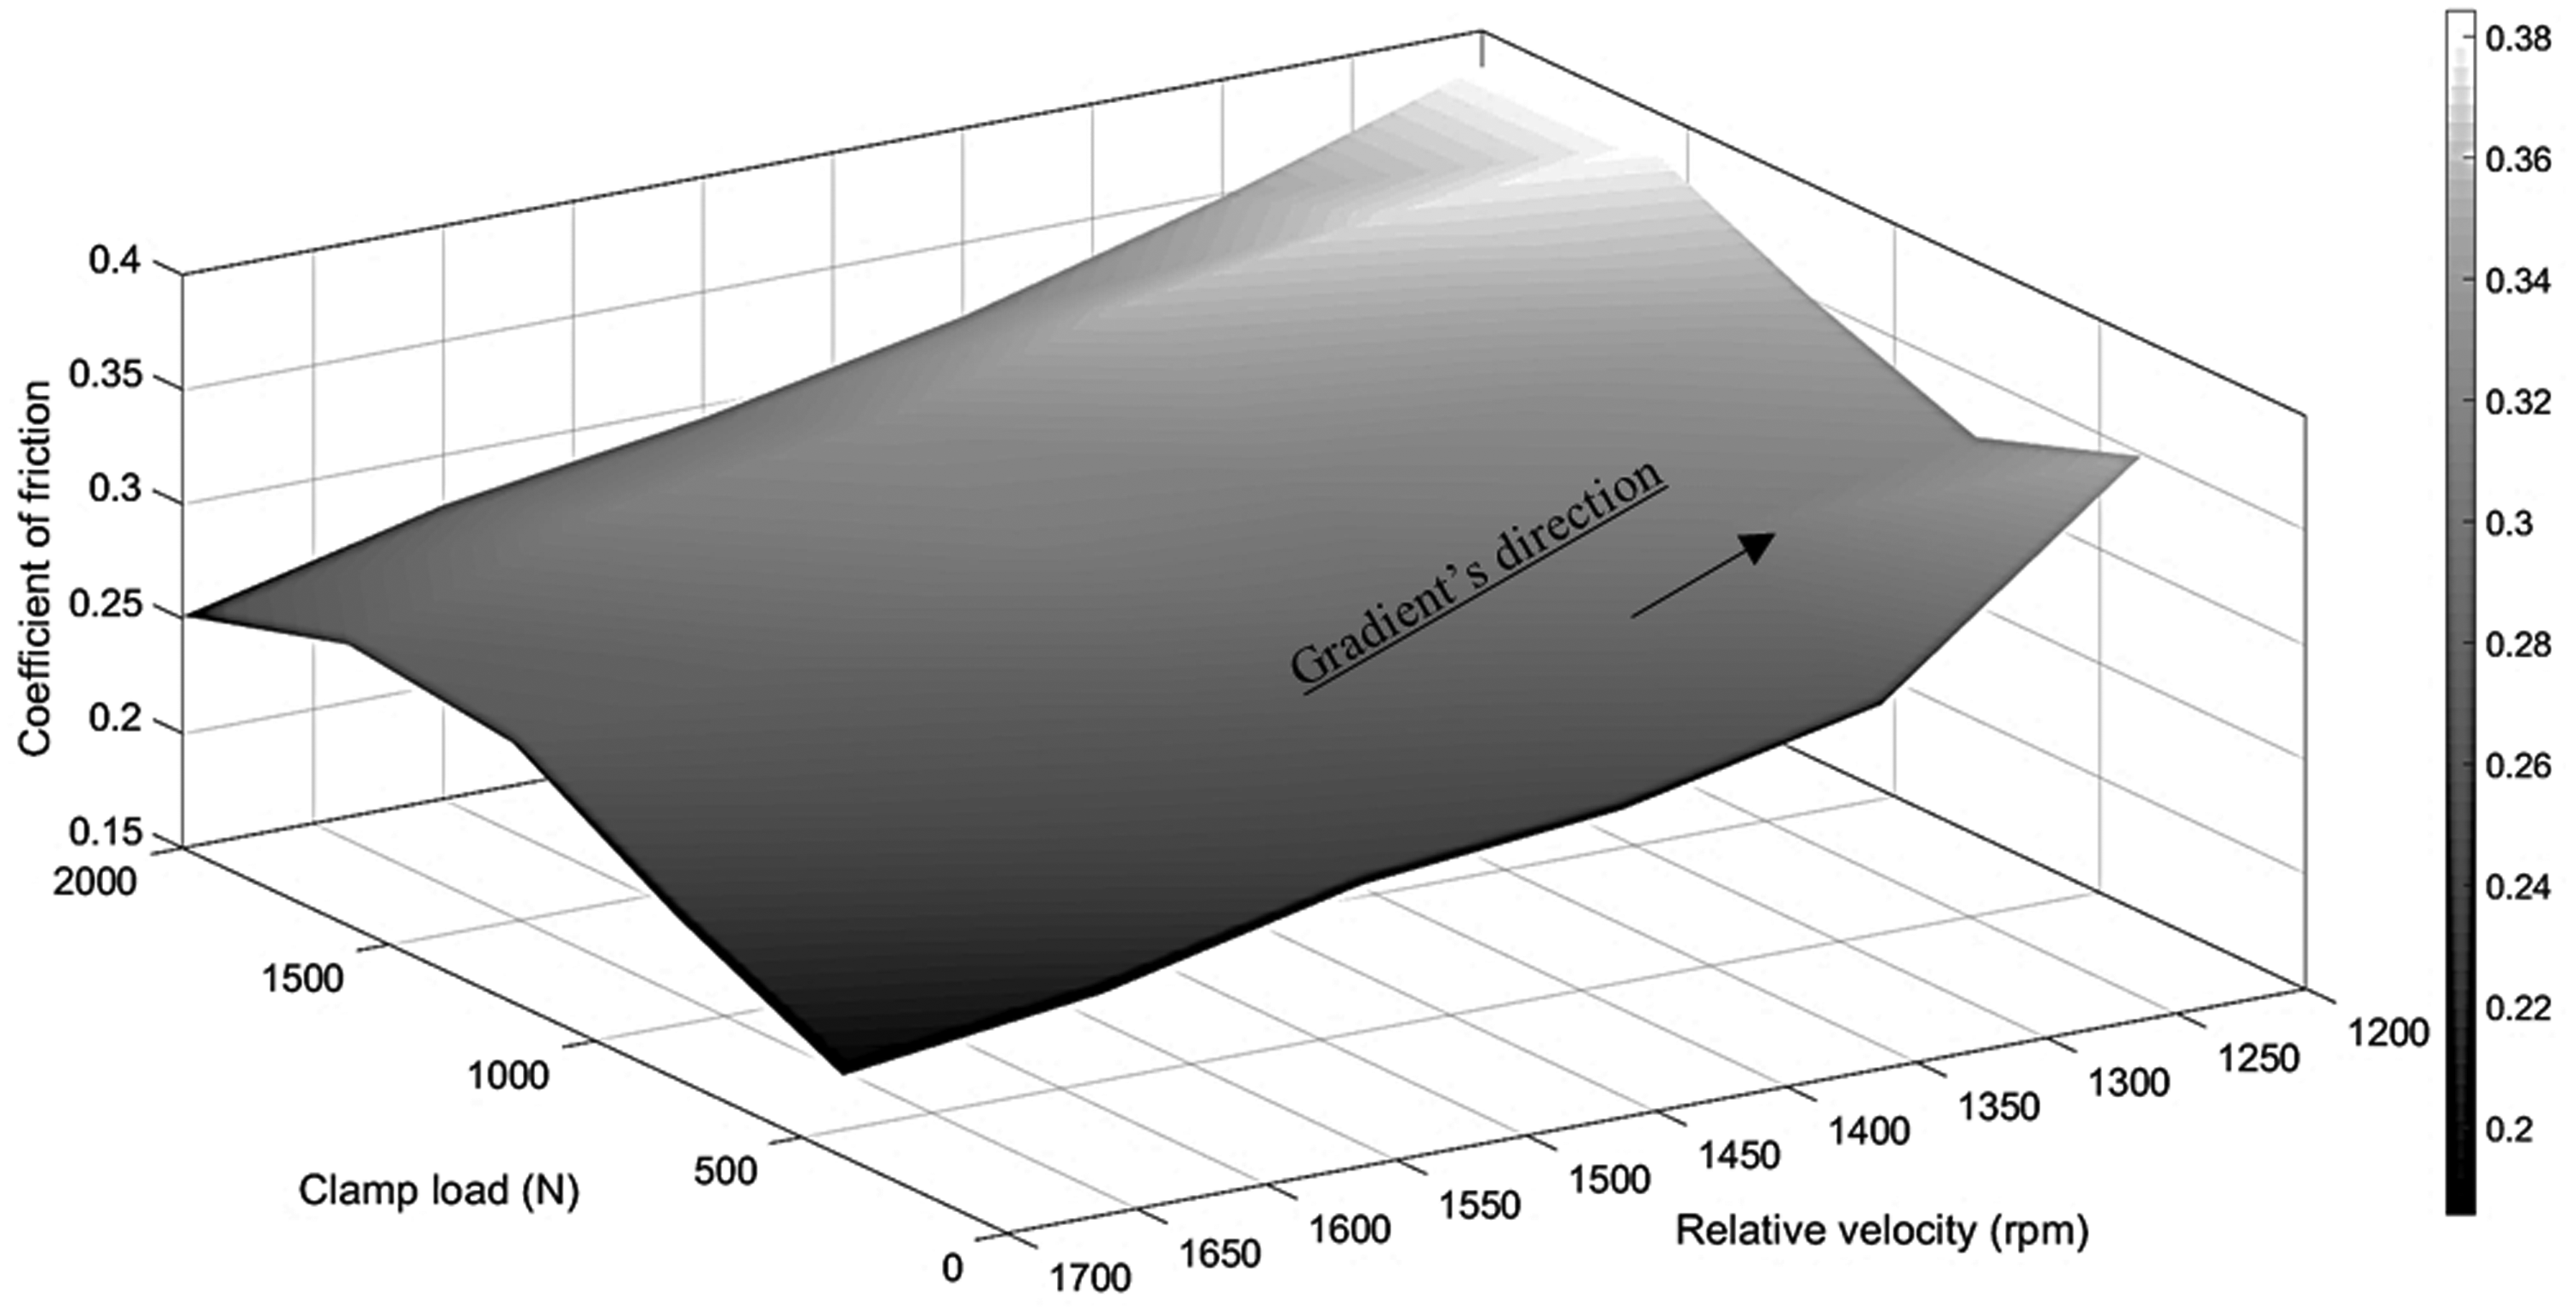
Solution procedure
The equations of motion for both clutch models were solved using a procedure in Matlab commercial software. The ode45 function, which applies a Runge–Kutta iterative method was used to calculate the motion time history for every component.
It is important to note that simulation data of the engagement process created by the torsional clutch model is used as an input to the clutch transient model (excluding torsional motion). The parameters that connect the two models are the time-varying coefficient of friction and clamp load under which the clutch is locked up during fast and slow engagement manoeuvres. The relative speed between flywheel and clutch disc is selected to be 2000 r/min at the beginning of the engagement process.
Results and discussion
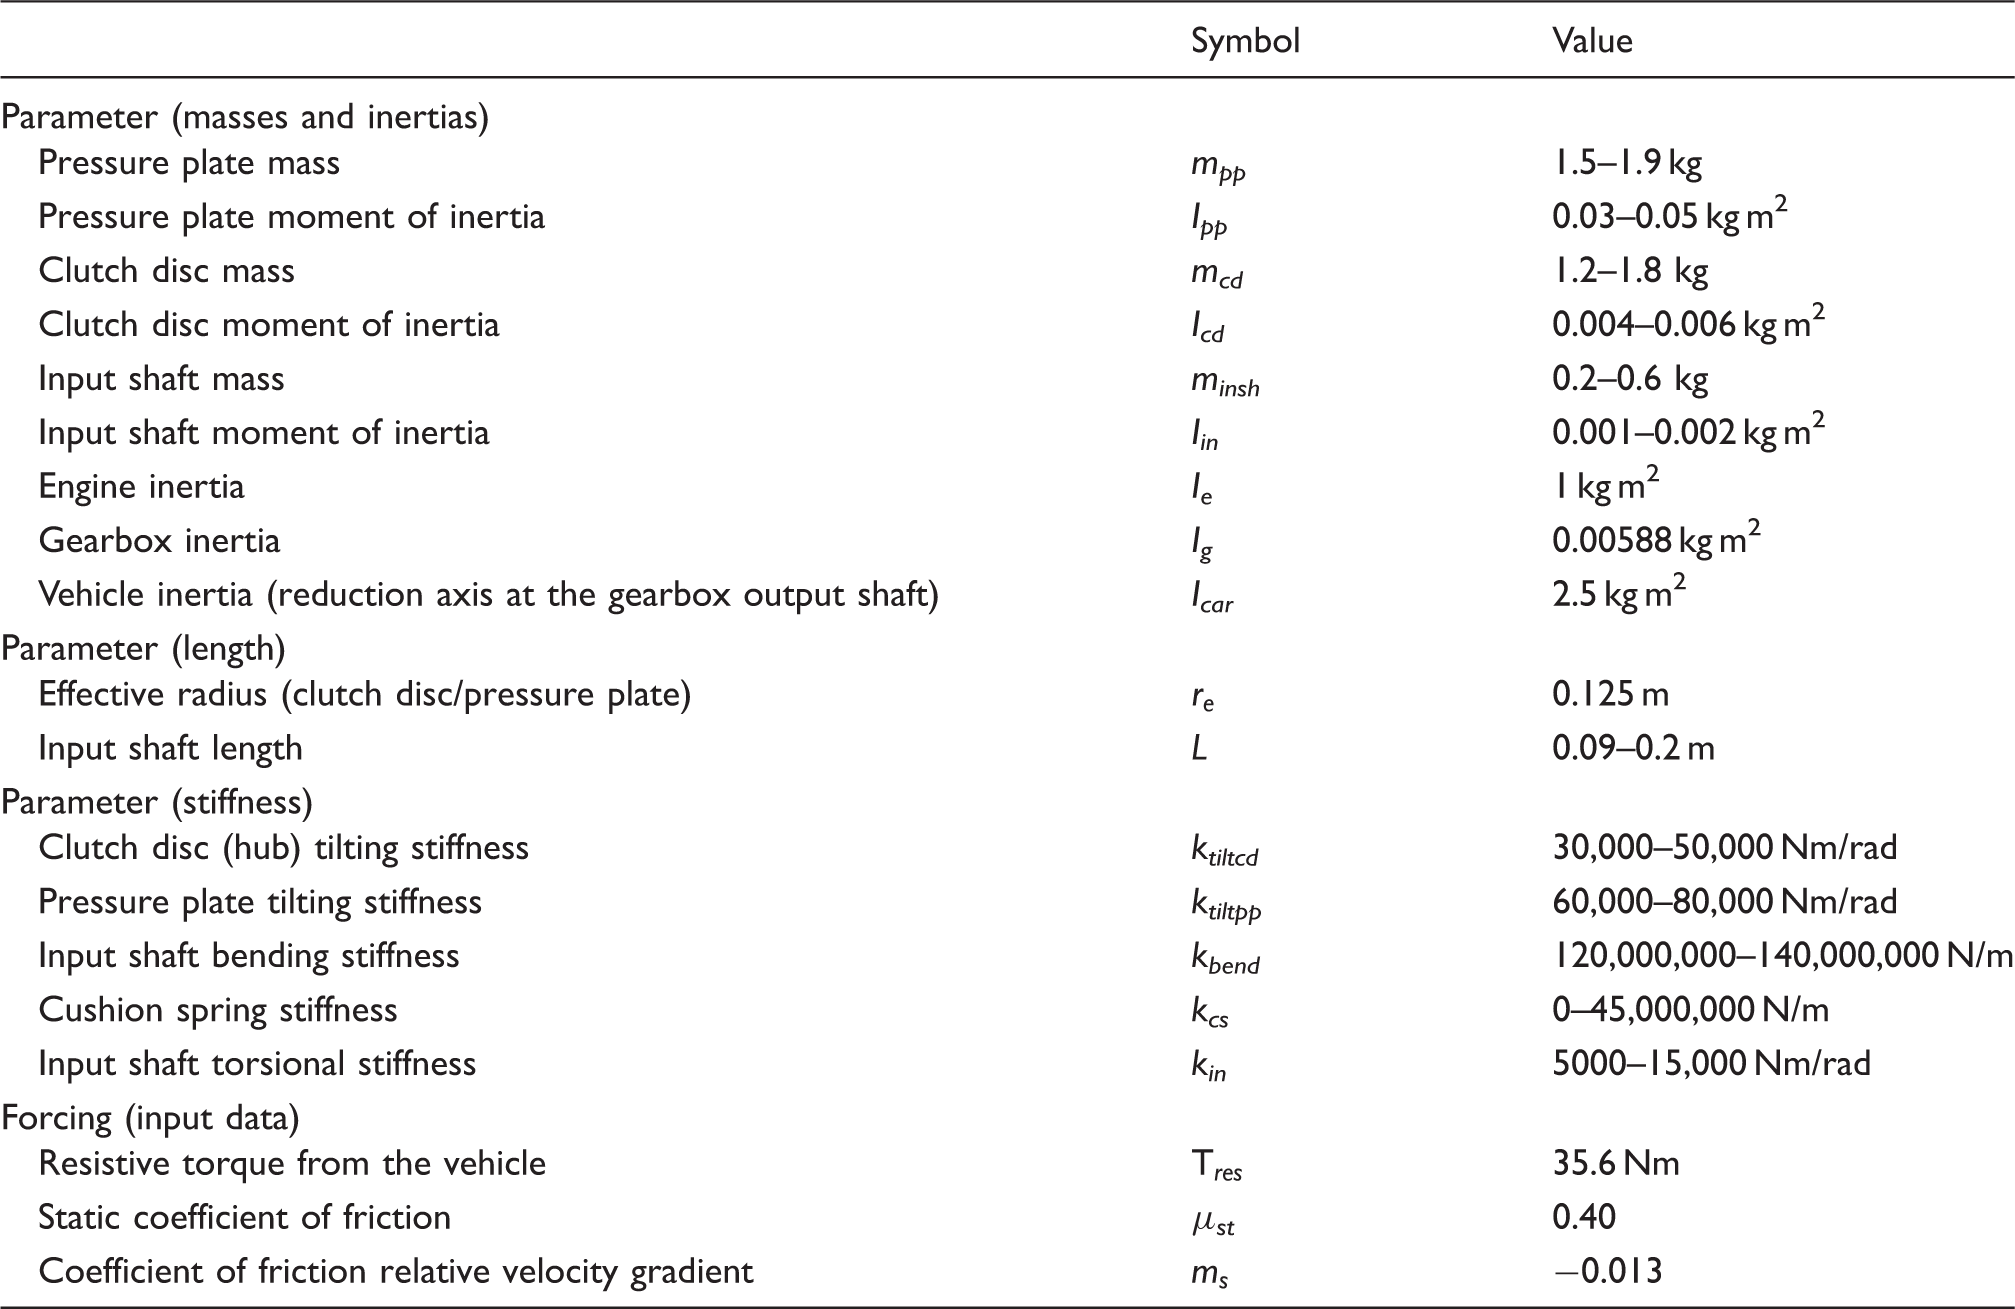
Model input parameters
Clutch model parameters.
The validation of the torsional dry clutch model only is shown in Figure 9. The simulation results are compared with vehicle experimental measurements obtained with a fixed clutch pedal actuation position at 45% of the overall travel and engine torque variation shown in Figure 8. The engine rotational speed was measured using hall-effect sensors and a toothed trigger wheel mounted directly on the crankshaft. The signal generated from the hall-effect sensors is processed using pulse code modulation (PCM) method digitally representing the analogue signal. The engine torque represented in Figure 8, is an estimated torque, calculated from measurements of air mass and injected fuel mass data using the PCM method. Finally, the clutch pedal position was measured using hall-effect sensors attached to the pedal as well as magnetic target on the hydraulic master cylinder piston, proportional to clutch pedal travel. Again the signal was processed using PCM. The experiments were conducted on a stationary vehicle (hand brake applied) on a flat road. The sampling frequency for the measurements shown in Figures 8 and 9 is 3 kHz.
Vehicle engine torque variation. Flywheel speed vehicle measurements against simulation results.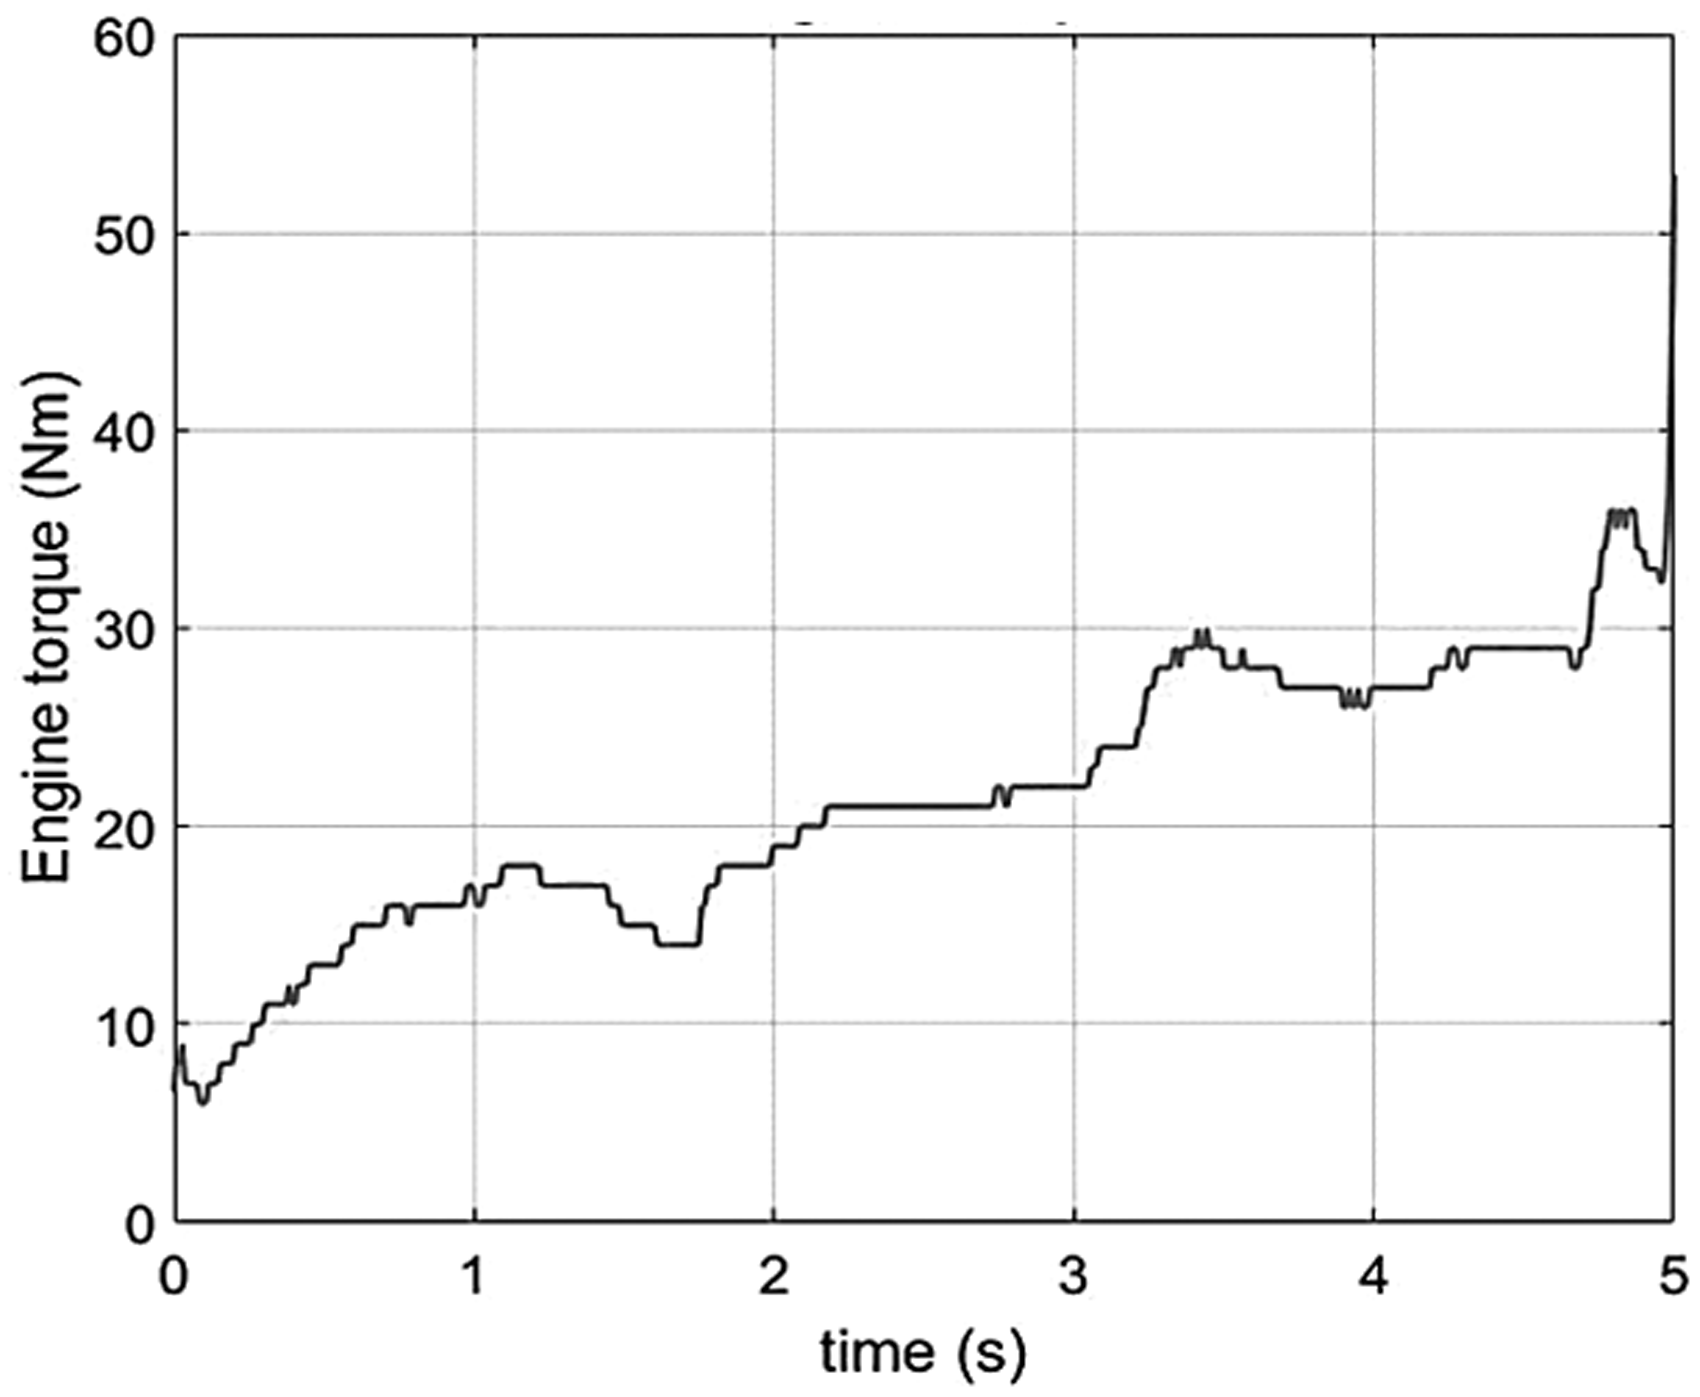
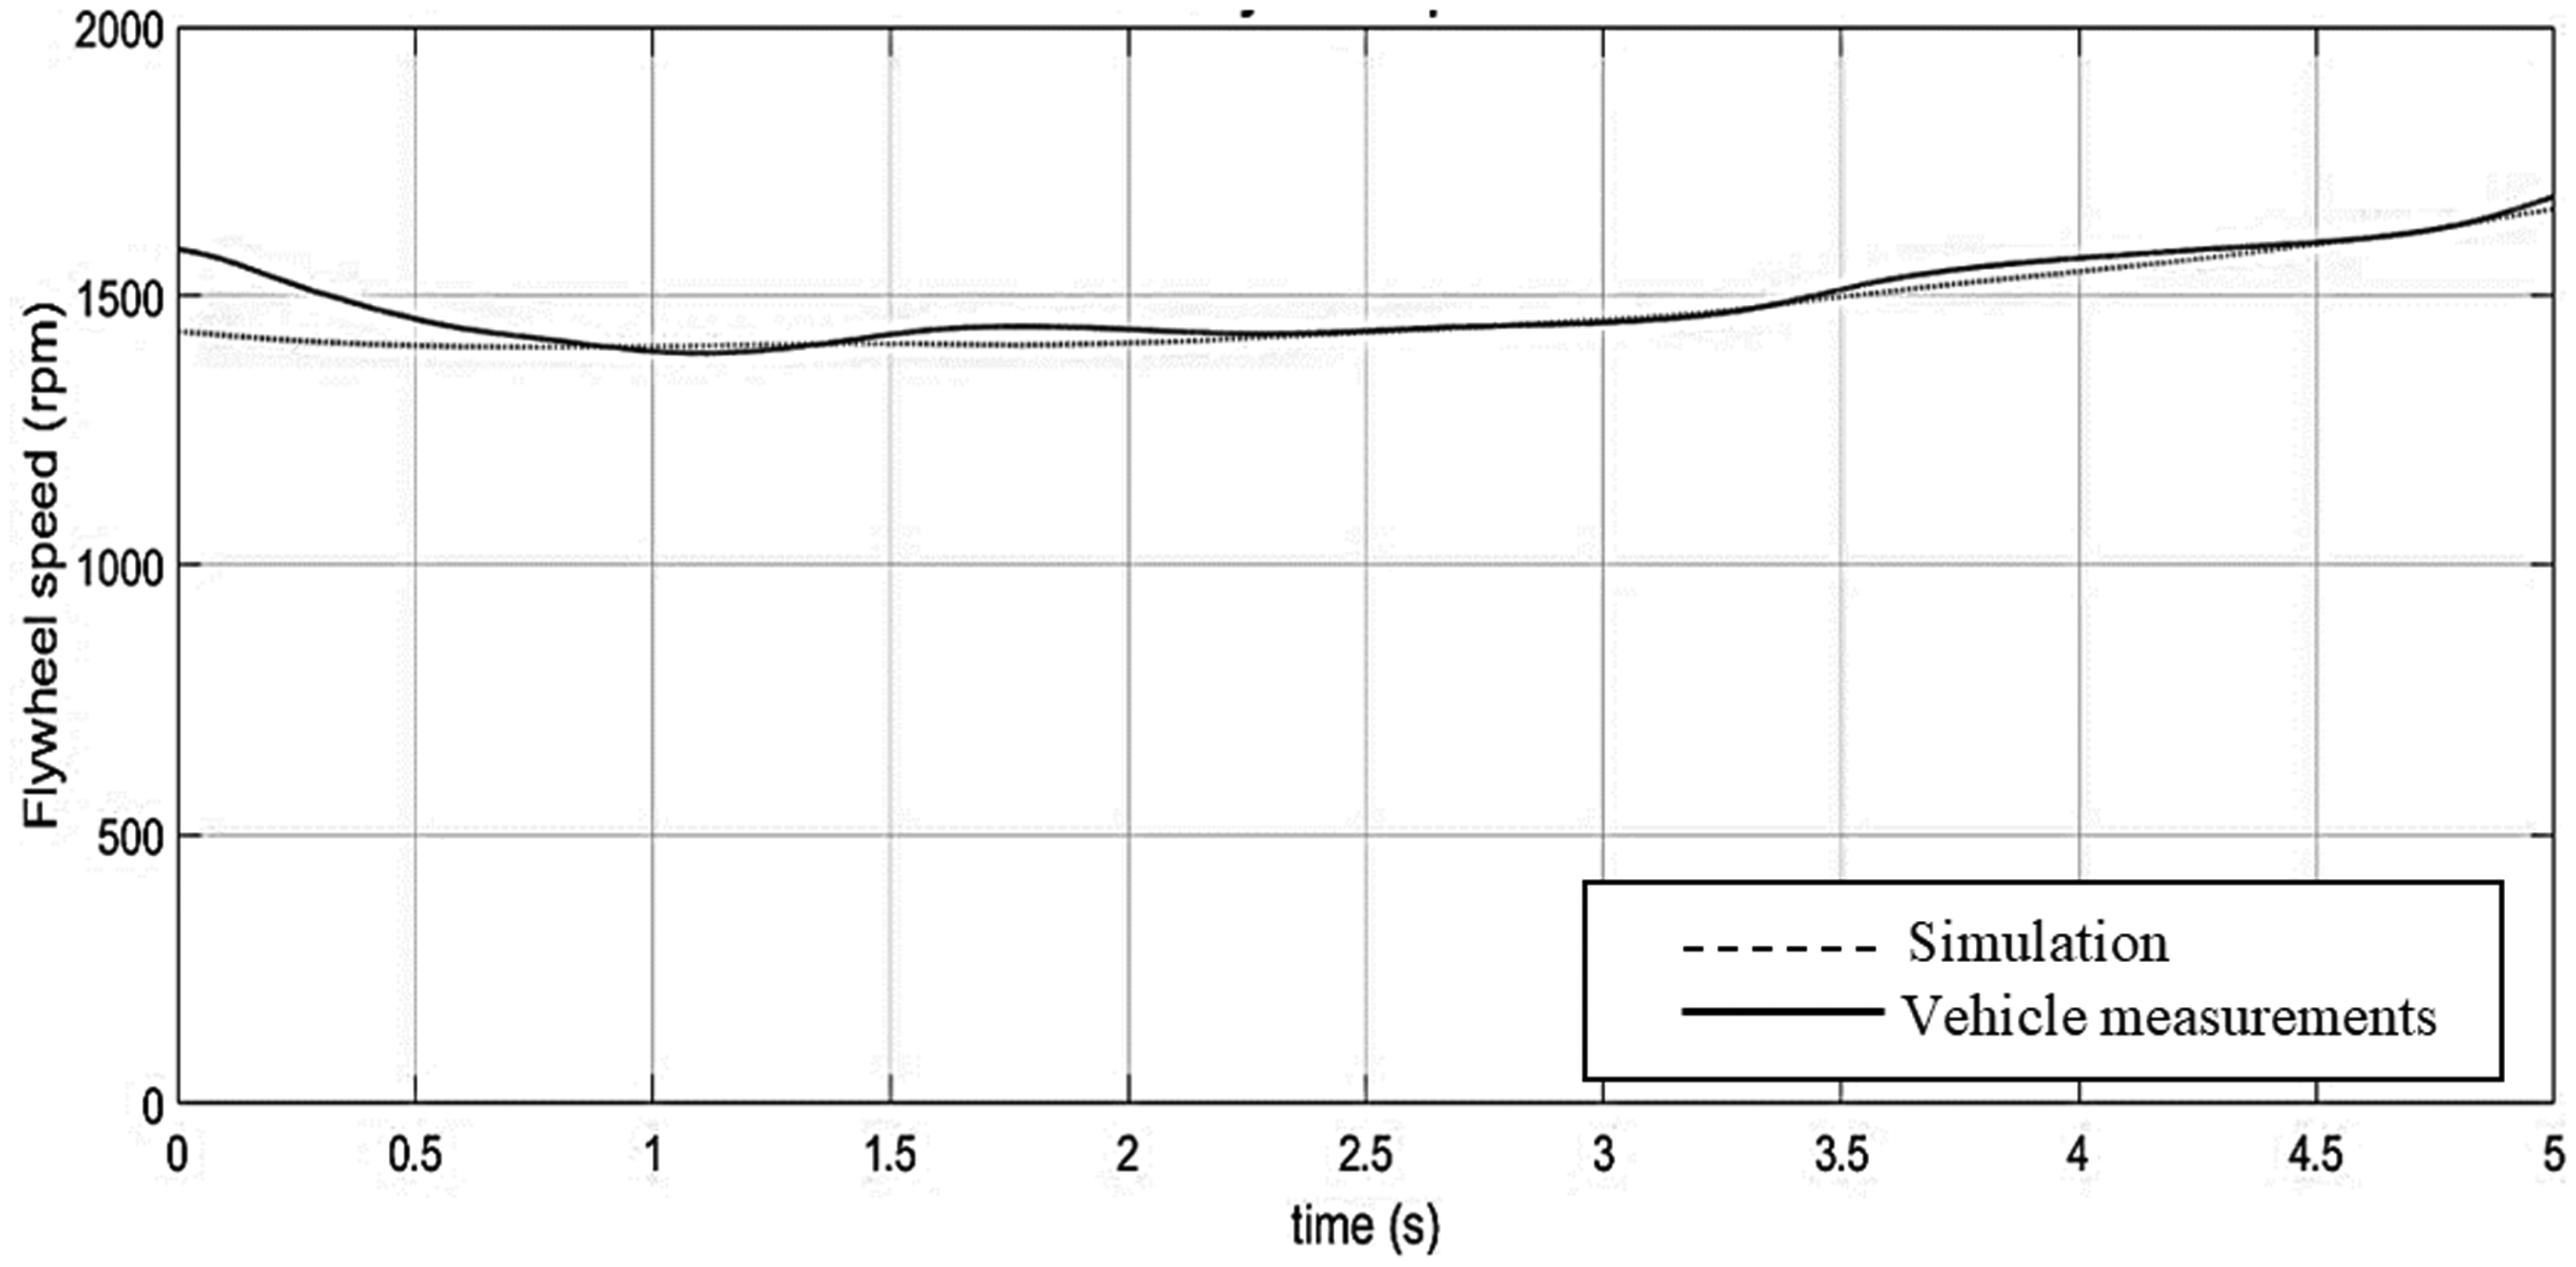
The clutch actuation position is introduced to the model through variation of the cushion spring deflection. In these simulations, the cushion spring is deflected by 0.15 mm for the 5 s time period investigated. The simulated and measured flywheel velocity variations are presented in Figure 9. It can be observed that the simulation and experimental measurements match well.
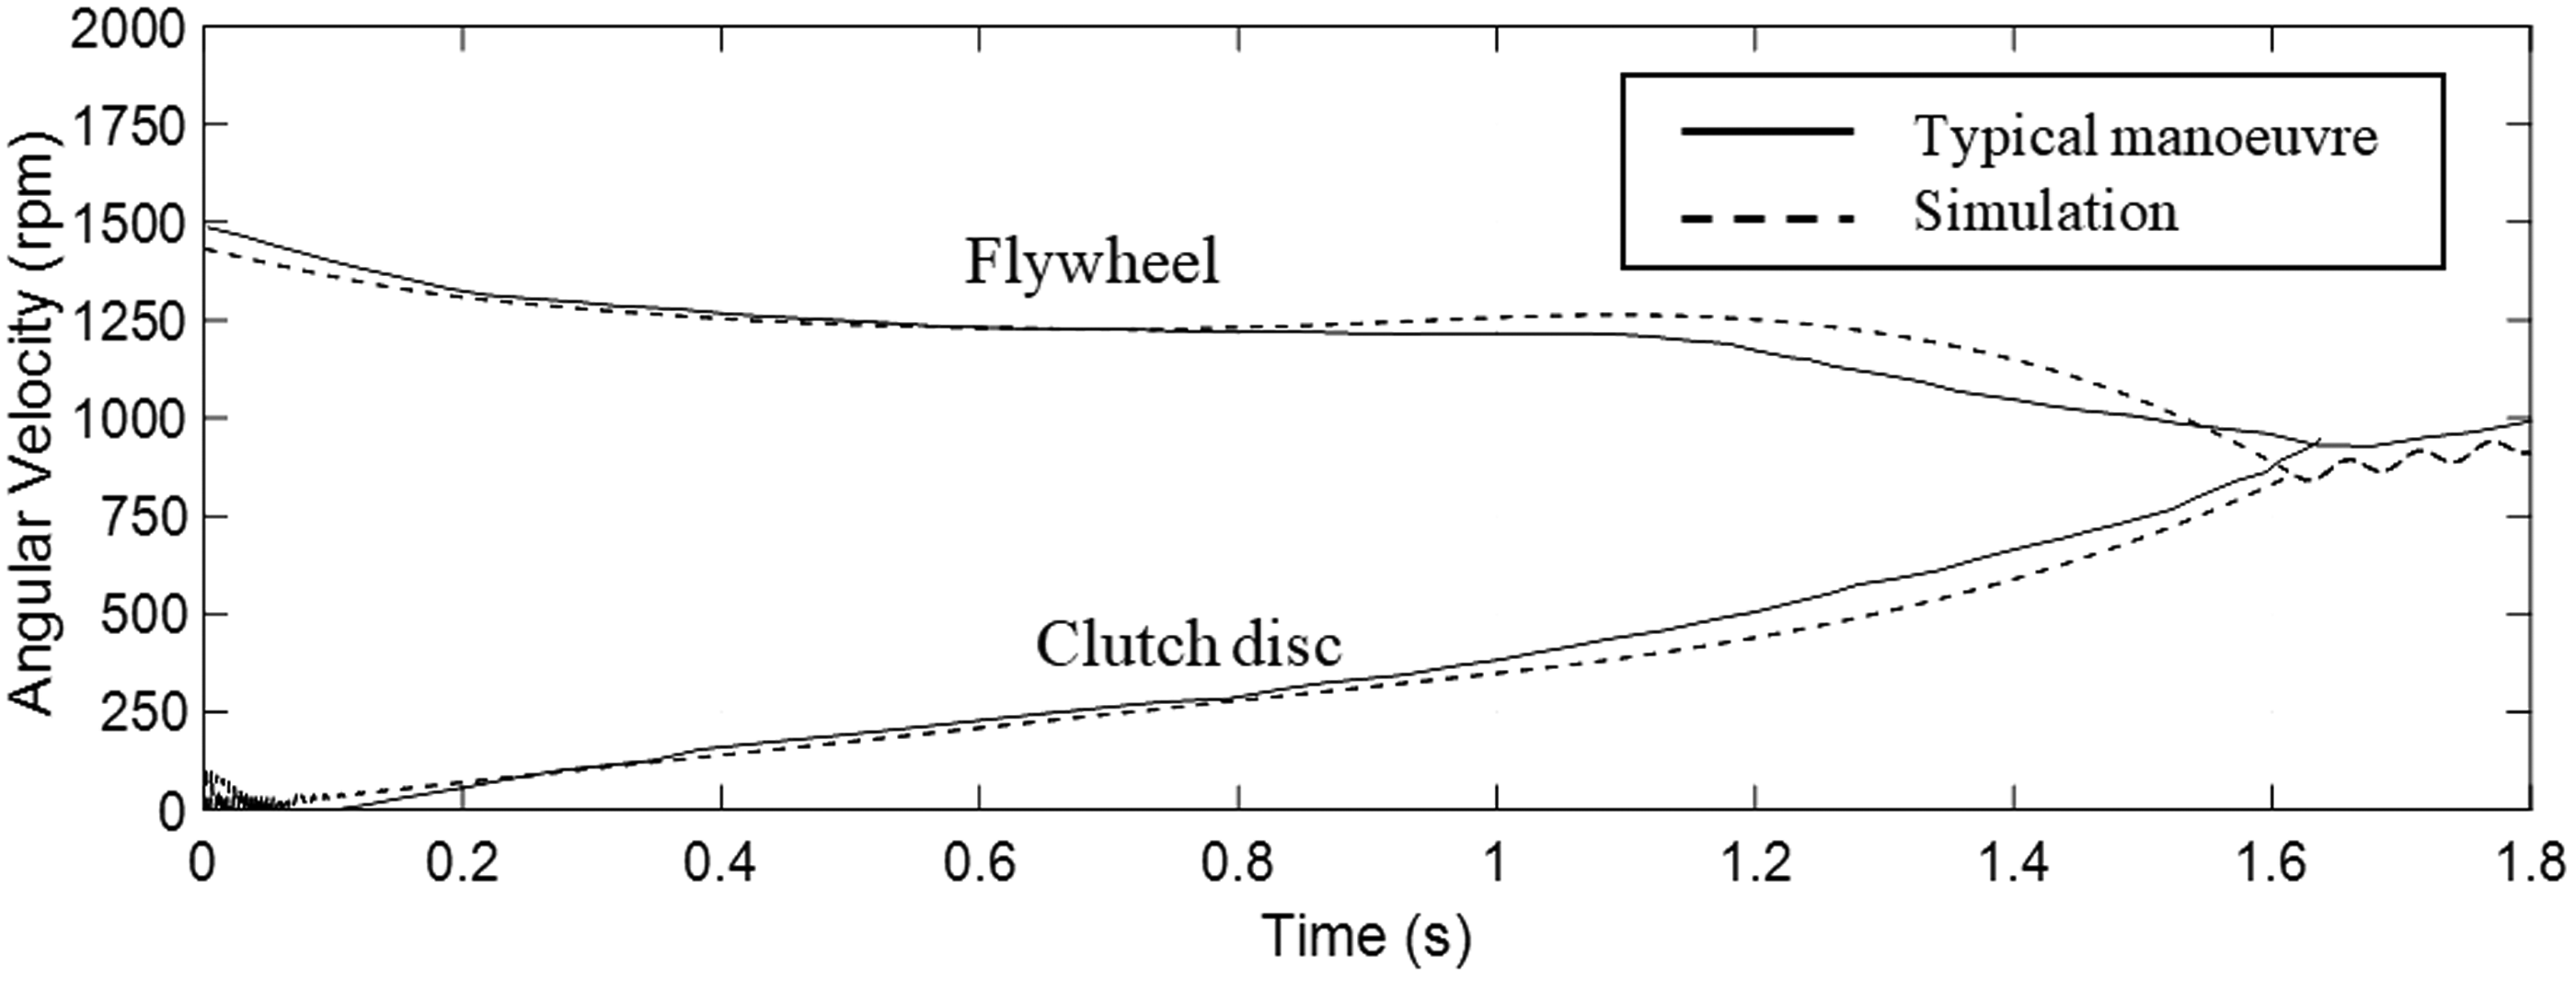
A second validation of the torsional model only was conducted using a typical launch manoeuvre of a mid-range vehicle (the corresponding engine torque profile is shown in Figure 10). At the beginning (corresponding to the time that the pressure plate first touches the clutch disc), the flywheel has an angular velocity of 1500 r/min, as shown in Figure 11. The clutch is fully closed at 1.8 s (full clamp load). It can be observed that the friction torque between the components causes the clutch disc to accelerate and the flywheel to decelerate due to the opposing friction torque. The synchronisation of the two parts is accomplished at 1.6 s (after this point the flywheel is rotating at the same speed with the clutch disc and input shaft). The model is shown to accurately predict the primary torsional response of the clutch system during engagement.
Vehicle engine torque variation. Angular velocity time histories (flywheel and clutch) during an engagement manoeuvre.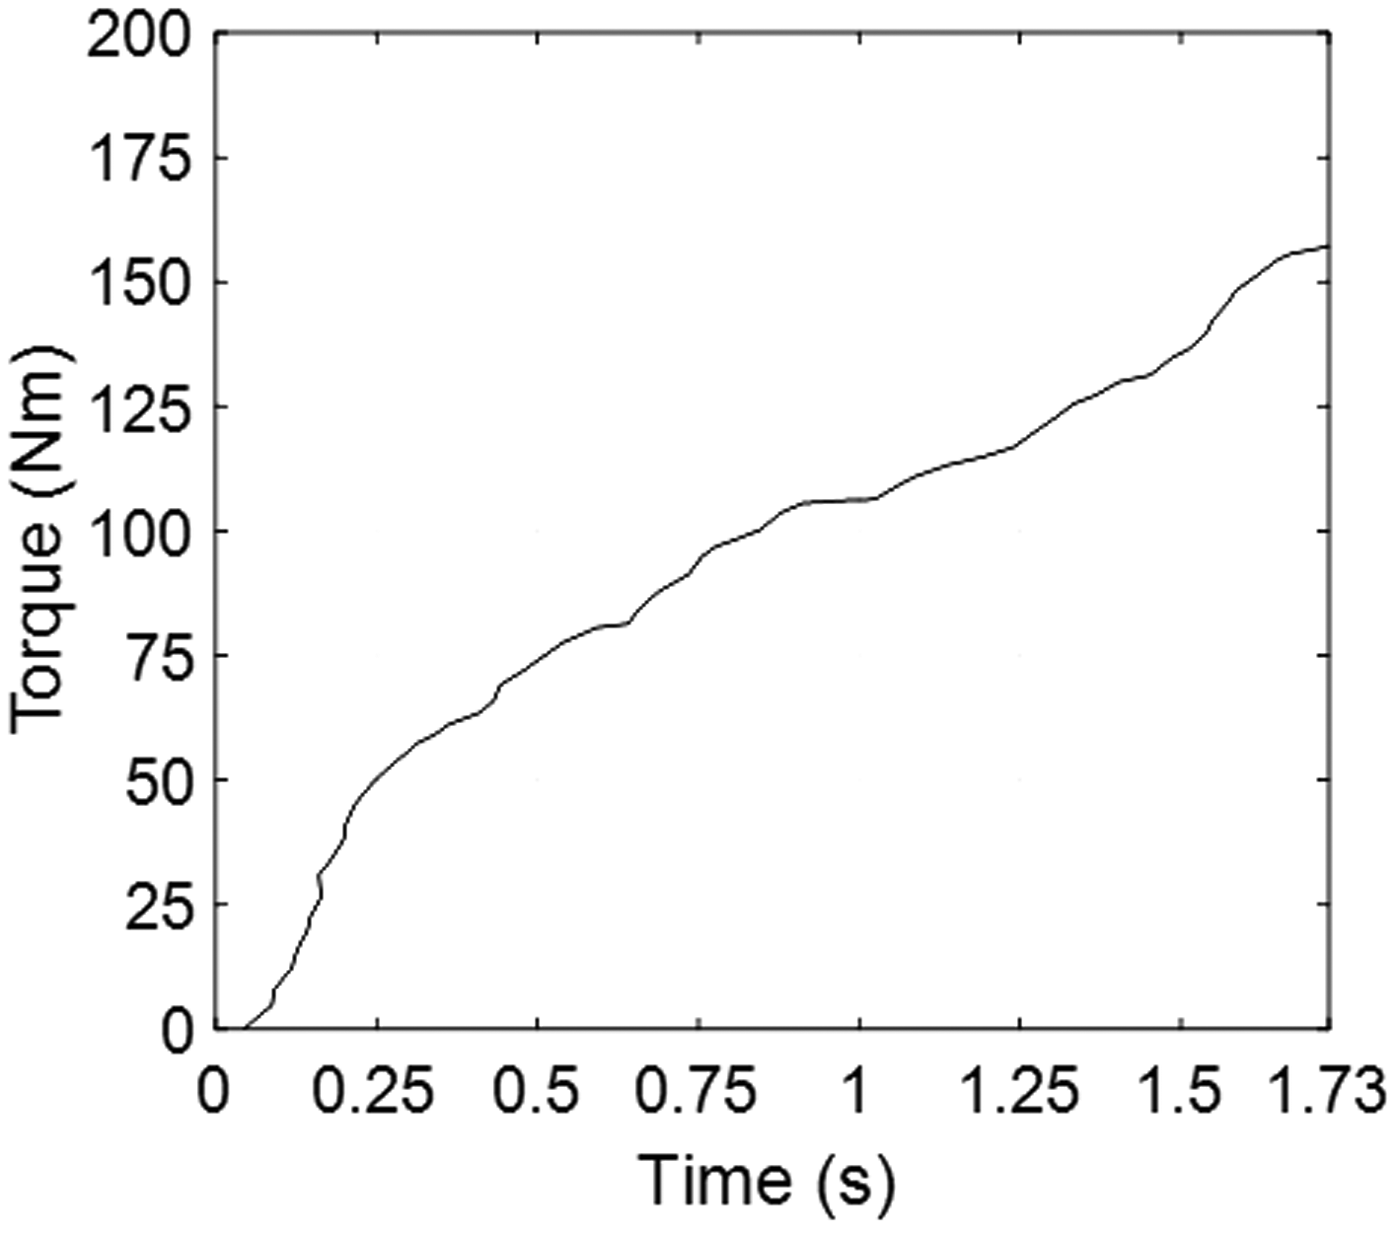
Transient torsional clutch model results
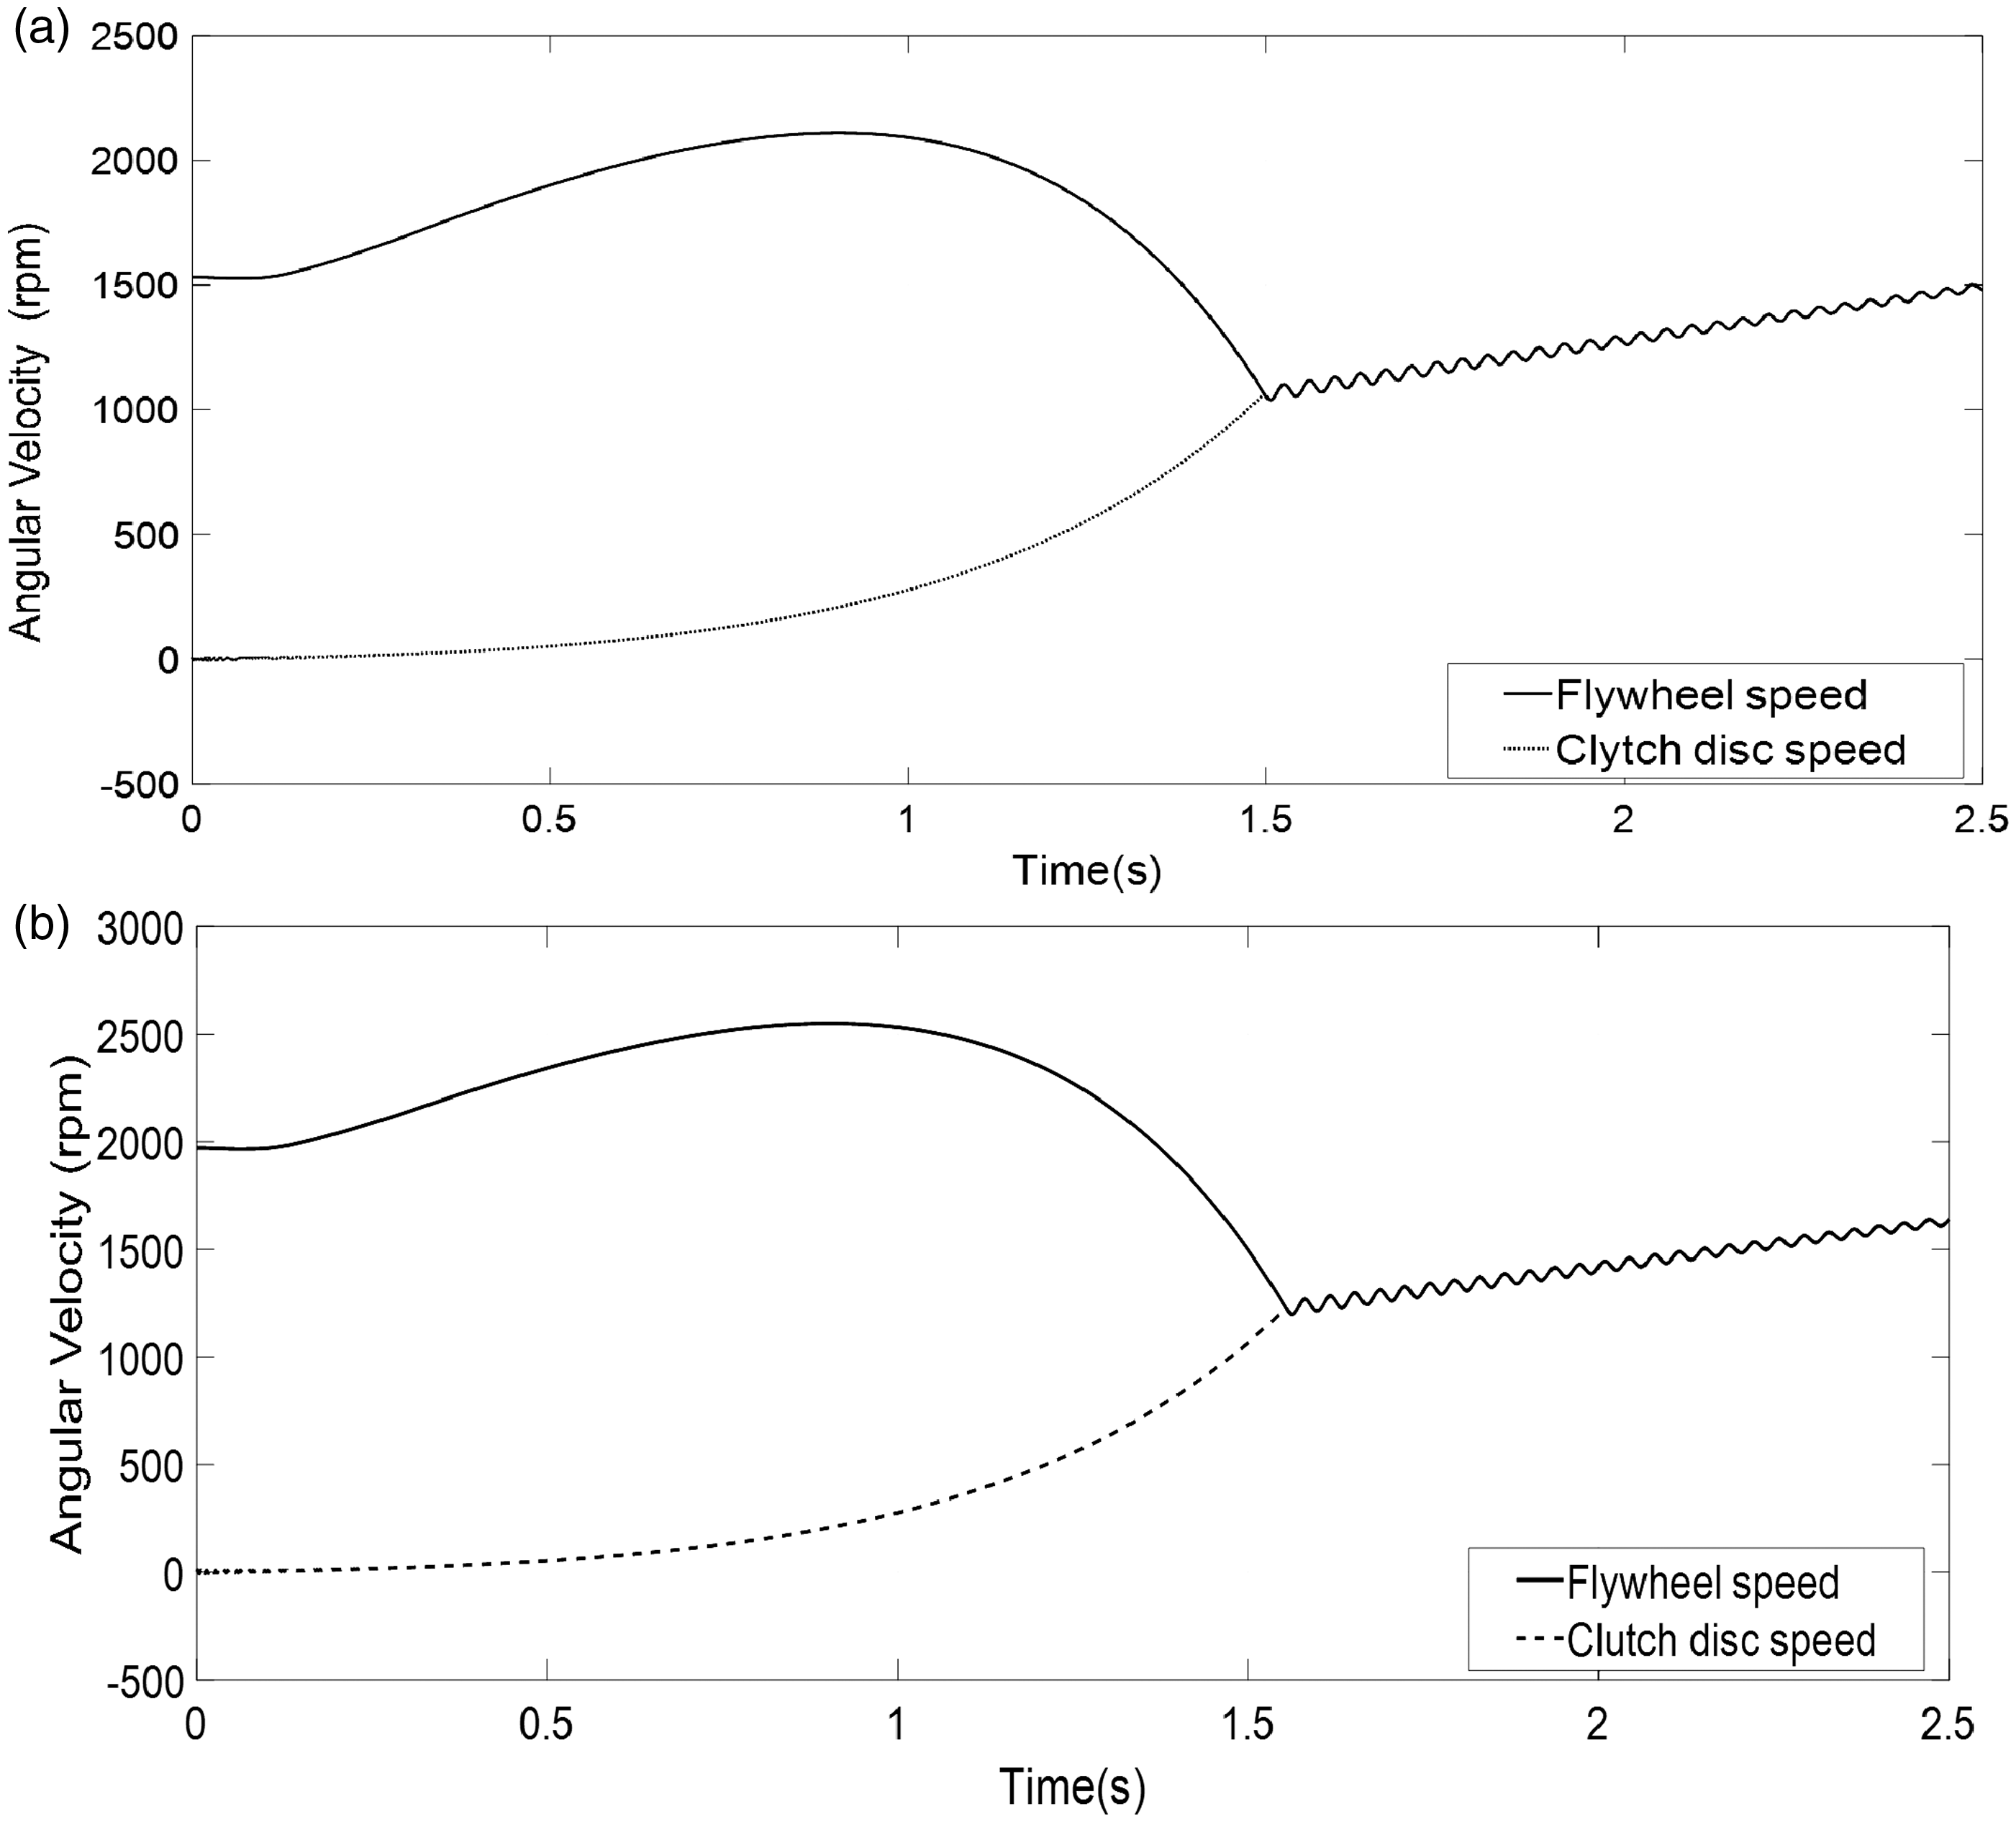
In this section, clutch dynamics results are presented for various pull away manoeuvres. In total, four different manoeuvres are investigated, each of which results in different engagement times. The first two manoeuvres reveal the system response to an aggressive (short duration) clutch engagement with different initial flywheel rotational speeds (1600 and 2000 r/min, respectively). For both cases, the clutch closes at 1.2 s (maximum cushion spring deflection). The time histories of the engine and clutch disc angular velocity are shown in Figure 12. The next two manoeuvres show the system response to a more conservative (longer duration) clutch pedal actuation again with different initial flywheel rotational speeds (1600 and 2000 r/min, respectively) and clutch closure time of 1.8 s. The corresponding angular velocities are shown in Figure 13.
Fast engagement manoeuvre with flywheel initial speed: (a) 1600 r/min and (b) 2000 r/min. (a) Slow engagement manoeuvre with flywheel initial speed: (a) 1600 r/min and (b) 2000 r/min.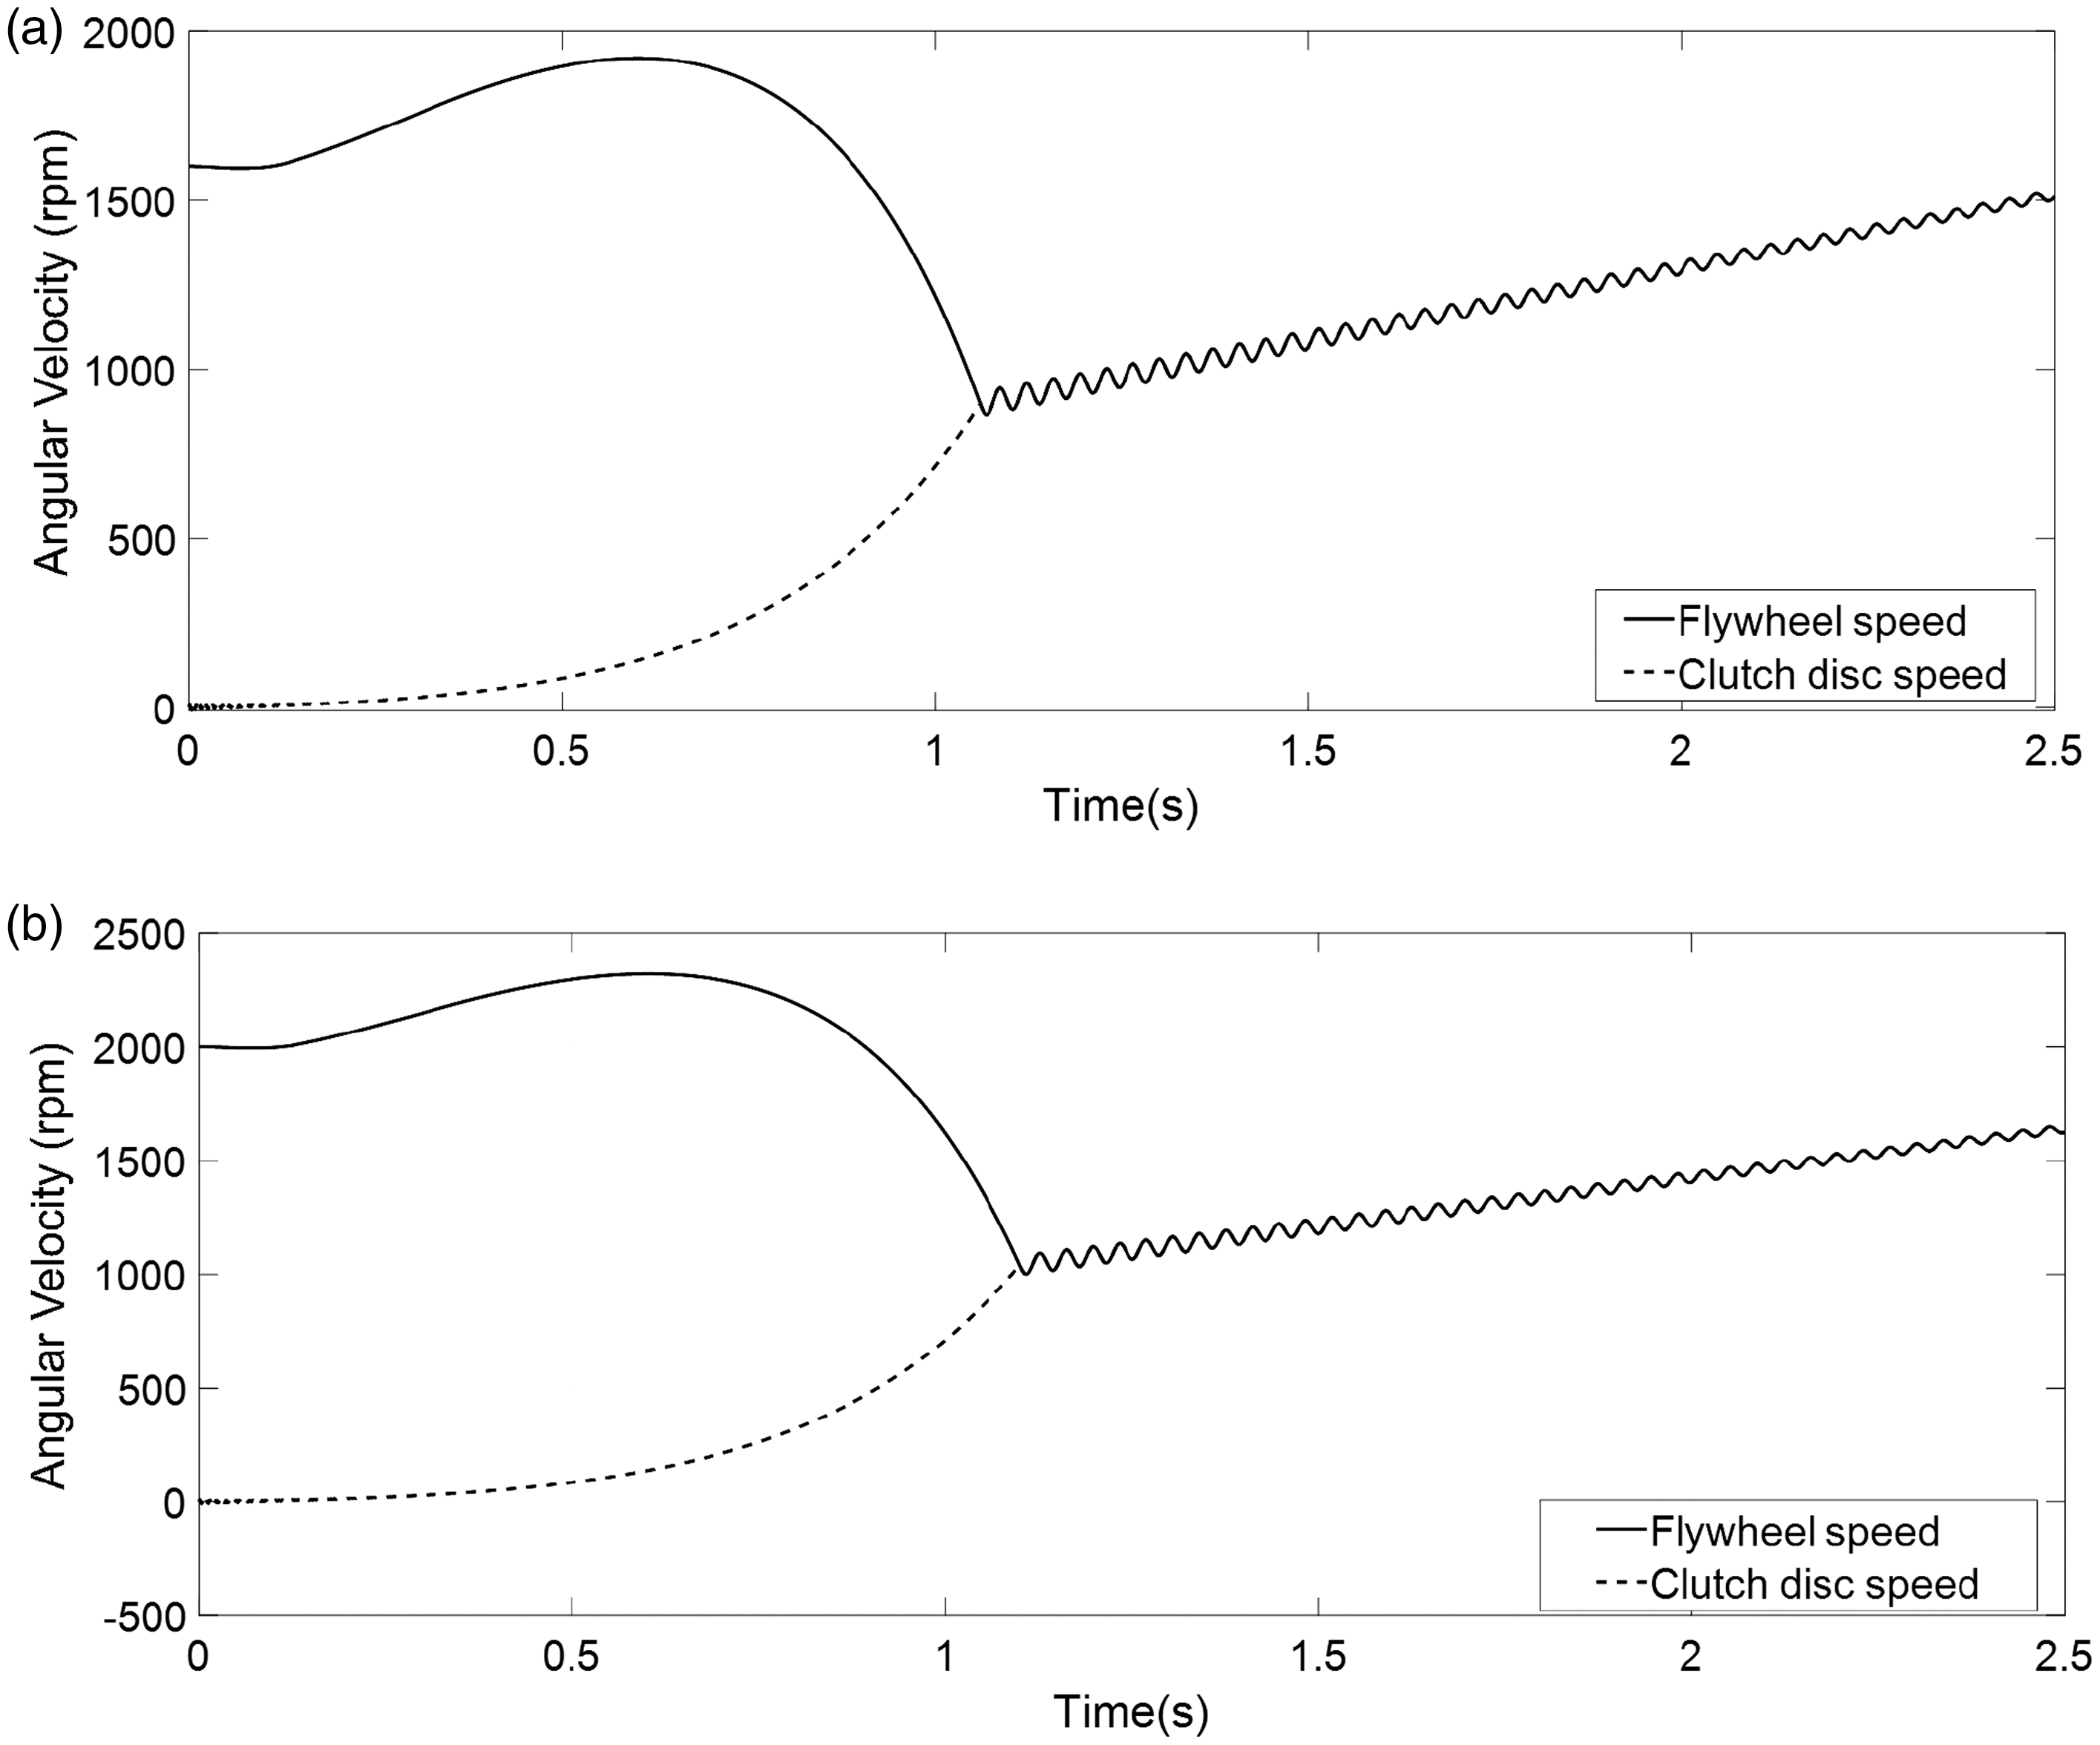
The main purpose of this exercise is to assess the duration for the angular velocities of flywheel/pressure plate and clutch disc to synchronize. Moreover, the clutch torque capacity and the clamp load at the time at which the clutch is locked up will be noted for different engagement conditions in order to detect the effect that the engagement rate has on potential NVH issues. In both Figures 12 and 13, time zero corresponds to the first contact of the pressure plate and clutch disc (‘kiss point’).
35
At this time, there is a nominal clamping force of 70 N and friction torque is generated between the components. The corresponding time histories for engine and friction torque are shown in Figure 14. The friction torque value during lock-up is indicated in Figure 14.
Friction and engine torque variation during fast and slow clutch engagements.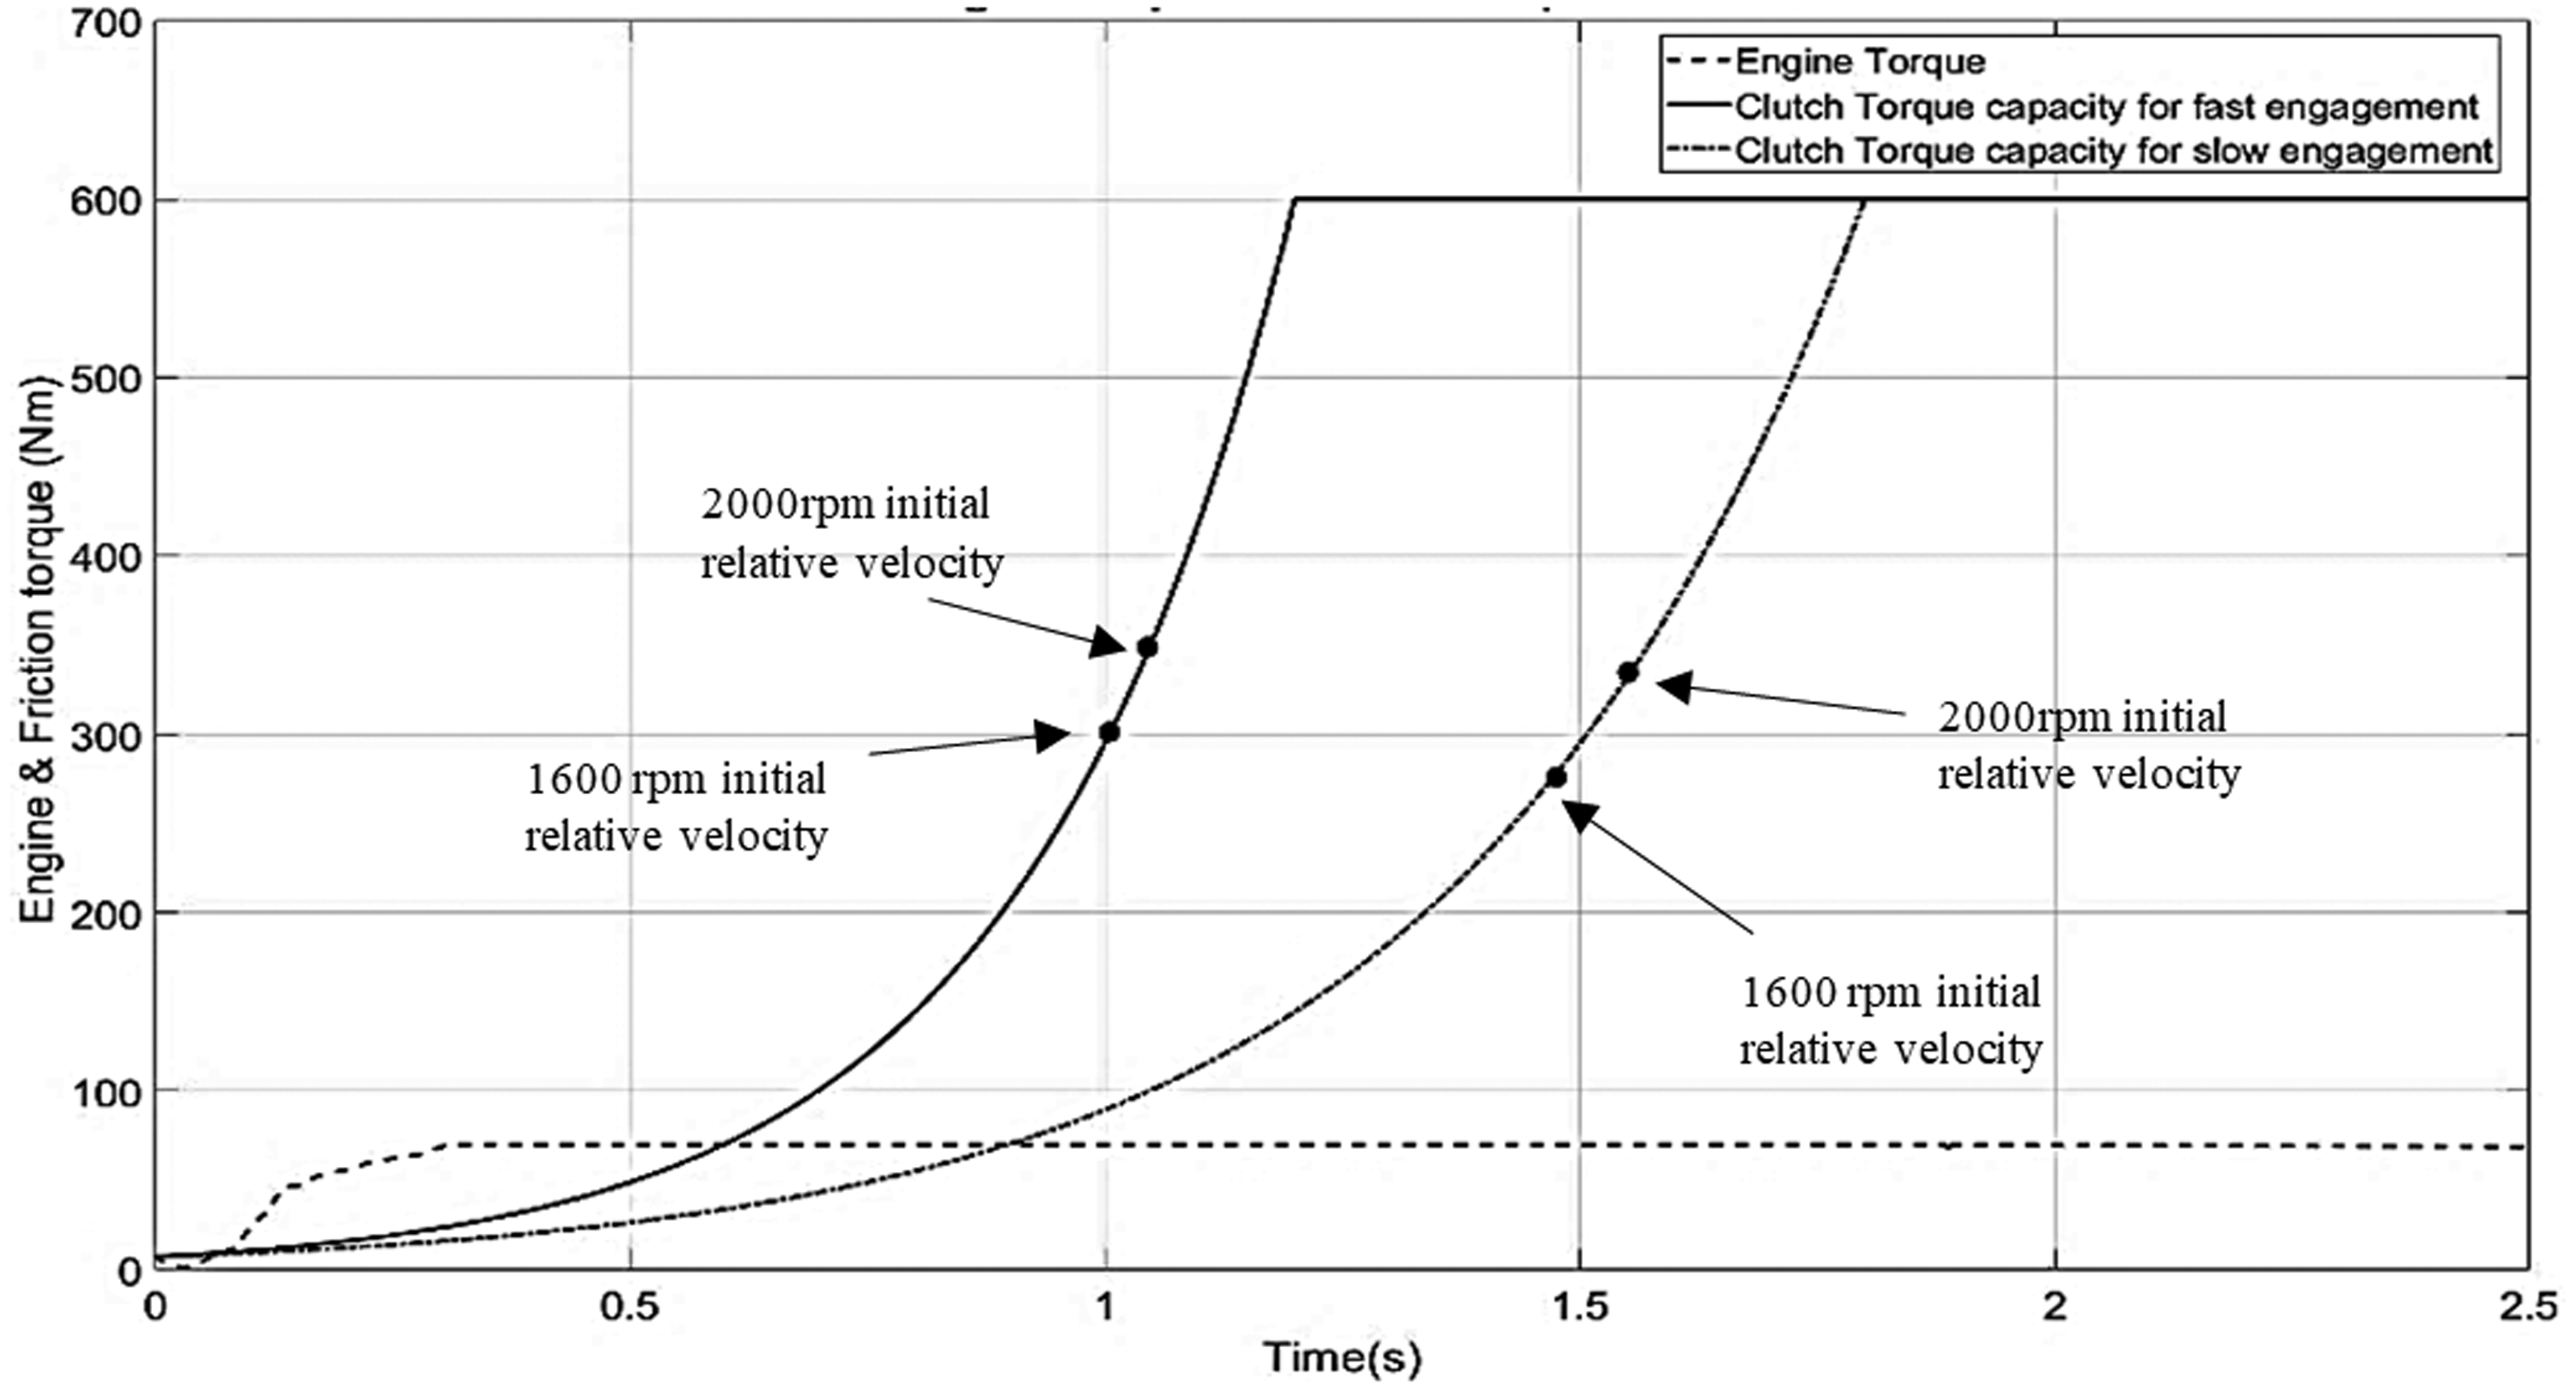
During the engagement manoeuvre shown in Figure 12(a) the two angular velocities are synchronised at 1.05 s. The clamp load at this point is 3.1 kN and the generated friction torque is 315 Nm (Figure 14). For the engagement manoeuvre of Figure 12(b) the clutch lock-up occurs at 1.1 s. The clamp load is 3.9 kN and the friction torque is 359 Nm (Figure 14). Moreover, the lock-up velocity for the first case (1600 r/min initial flywheel velocity) is 930 r/min and for the manoeuvre with 2000 r/min initial flywheel angular velocity is 1053 r/min. This differnce in the initial flywheel speed leads to different clutch lock-up times and as a result different clamp lock-up loads and generated friction values. If the initial flywheel speed is higher when the driver starts the engagement, the generated friction torque reaches higher values. This may lead to different types of NVH behaviour.
Figure 13 presents the results of a slower clutch engagement manoeuvre, where clutch lock-up is achieved at 1.48 and 1.55 s, respectively. The clamp load during lock-up in Figure 13(a) manoeuvre is 2.9 kN and the generated friction torque is 288 Nm (Figure 14). For the case of Figure 13(b), the clamp load is 3.4 kN during lock-up and the friction torque is 339 Nm (Figure 14).
The inspection of Figures 12, 13 and 14 reveals that during the time period (0–0.1 s) the friction torque generated at the two interfaces is higher than the engine torque acting on the system. However, when the engine torque exceeds the generated friction torque, both flywheel and clutch disc accelerate. After 0.6 s, the friction torque exceeds the engine torque and the flywheel decelerates until its angular velocity is synchronised with that of the clutch disc. 7 Depending on the magnitude of friction torque during the engagement process and the engine torque, the amount of time that the clutch system needs to lock-up varies. If the engine torque exceeds the generated friction torque, then synchronisation of the clutch system is delayed. Consequently, the clamp load increases and more friction is generated between the clutch parts.
Figure 14 describes the clutch friction torque capacity from intial to full engagement, comparing the manoeuvres described previously. Each bullet point shows the generated torque at lock up for each case examined. Clearly when the relative velocity is 2000 r/min, in both fast and slow engagement manoeuvers, the generated torque required for clutch lock-up is higher compared to those of 1600 r/min initial relative velocity. Moreover, in fast engagement manoeuvres higher friction torque is required for clutch lock-up compared to slow engagement manoeuvres.
Figure 15 shows the variation of dynamic friction coefficient with clamp load and sliding speed. After the clutch lock-up, there is no relative motion between the flywheel and clutch disc, static friction prevails, and resistance is applied from the rest of the drivetrain only ( Coefficient of friction variation during fast and slow clutch engagement manoeuvres.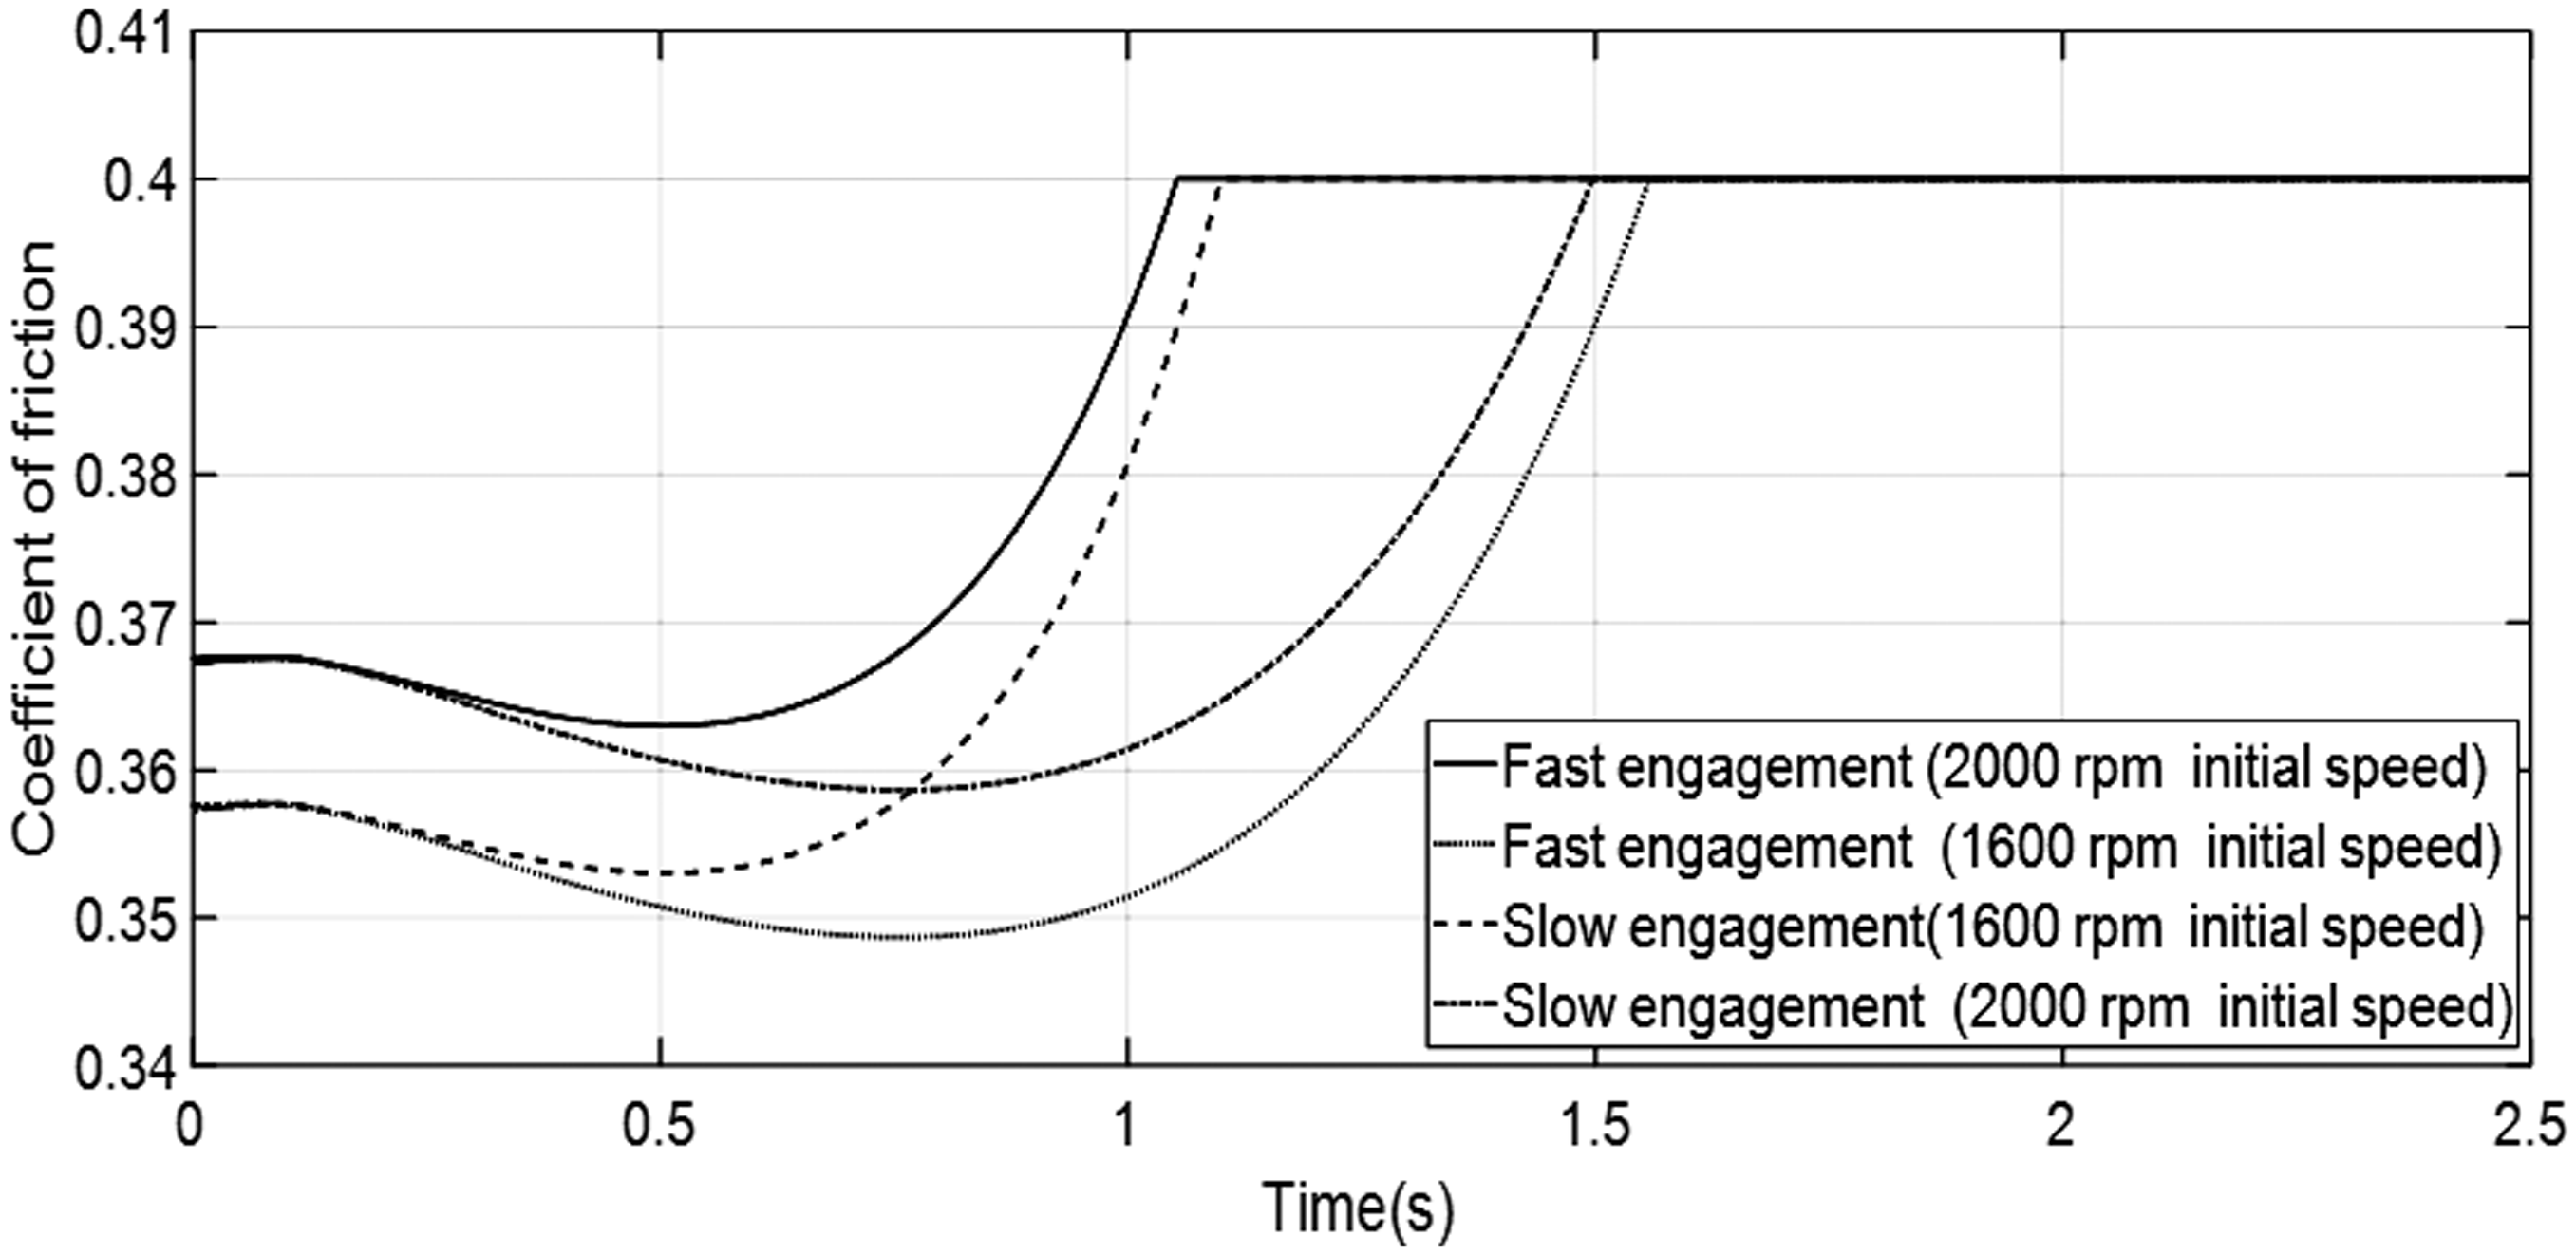
Clutch transient model (excluding torsional motion)
The fast and slow engagement manoeuvres (with initial flywheel speed 2000 r/min) are simulated to evaluate and compare the clutch response under different driver behaviours. Those conditions were selected because the friction torque, coefficient of friction and the clamp load are higher during clutch lock-up. Figure 16 depicts the time histories for the key clutch motions. Figure 16(a) and (b) presents the pressure plate tilting motion for slow and fast clutch engagement, respectively. It can be seen that the oscillation amplitudes are quite similar, mainly because the pressure plate oscillations are affected by the clamp load and cushion spring stiffness, which in both cases are quite comparable. The key difference is the duration of the engagement period, as described previously. The oscillations decay considerably for slow and fast engagements after 1.8 and 1.2 s respectively, due to structural damping. Moreover, after the clutch lock-up, the clamp load is high enough to prevent severe oscillations.
10
Time histories for slow (left) and fast (right) clutch engagement manoeuvres: (a) – (b) pressure plate tilting motion, (c) – (d) input shat bending motion and (e) – (f) clutch disc radial motion.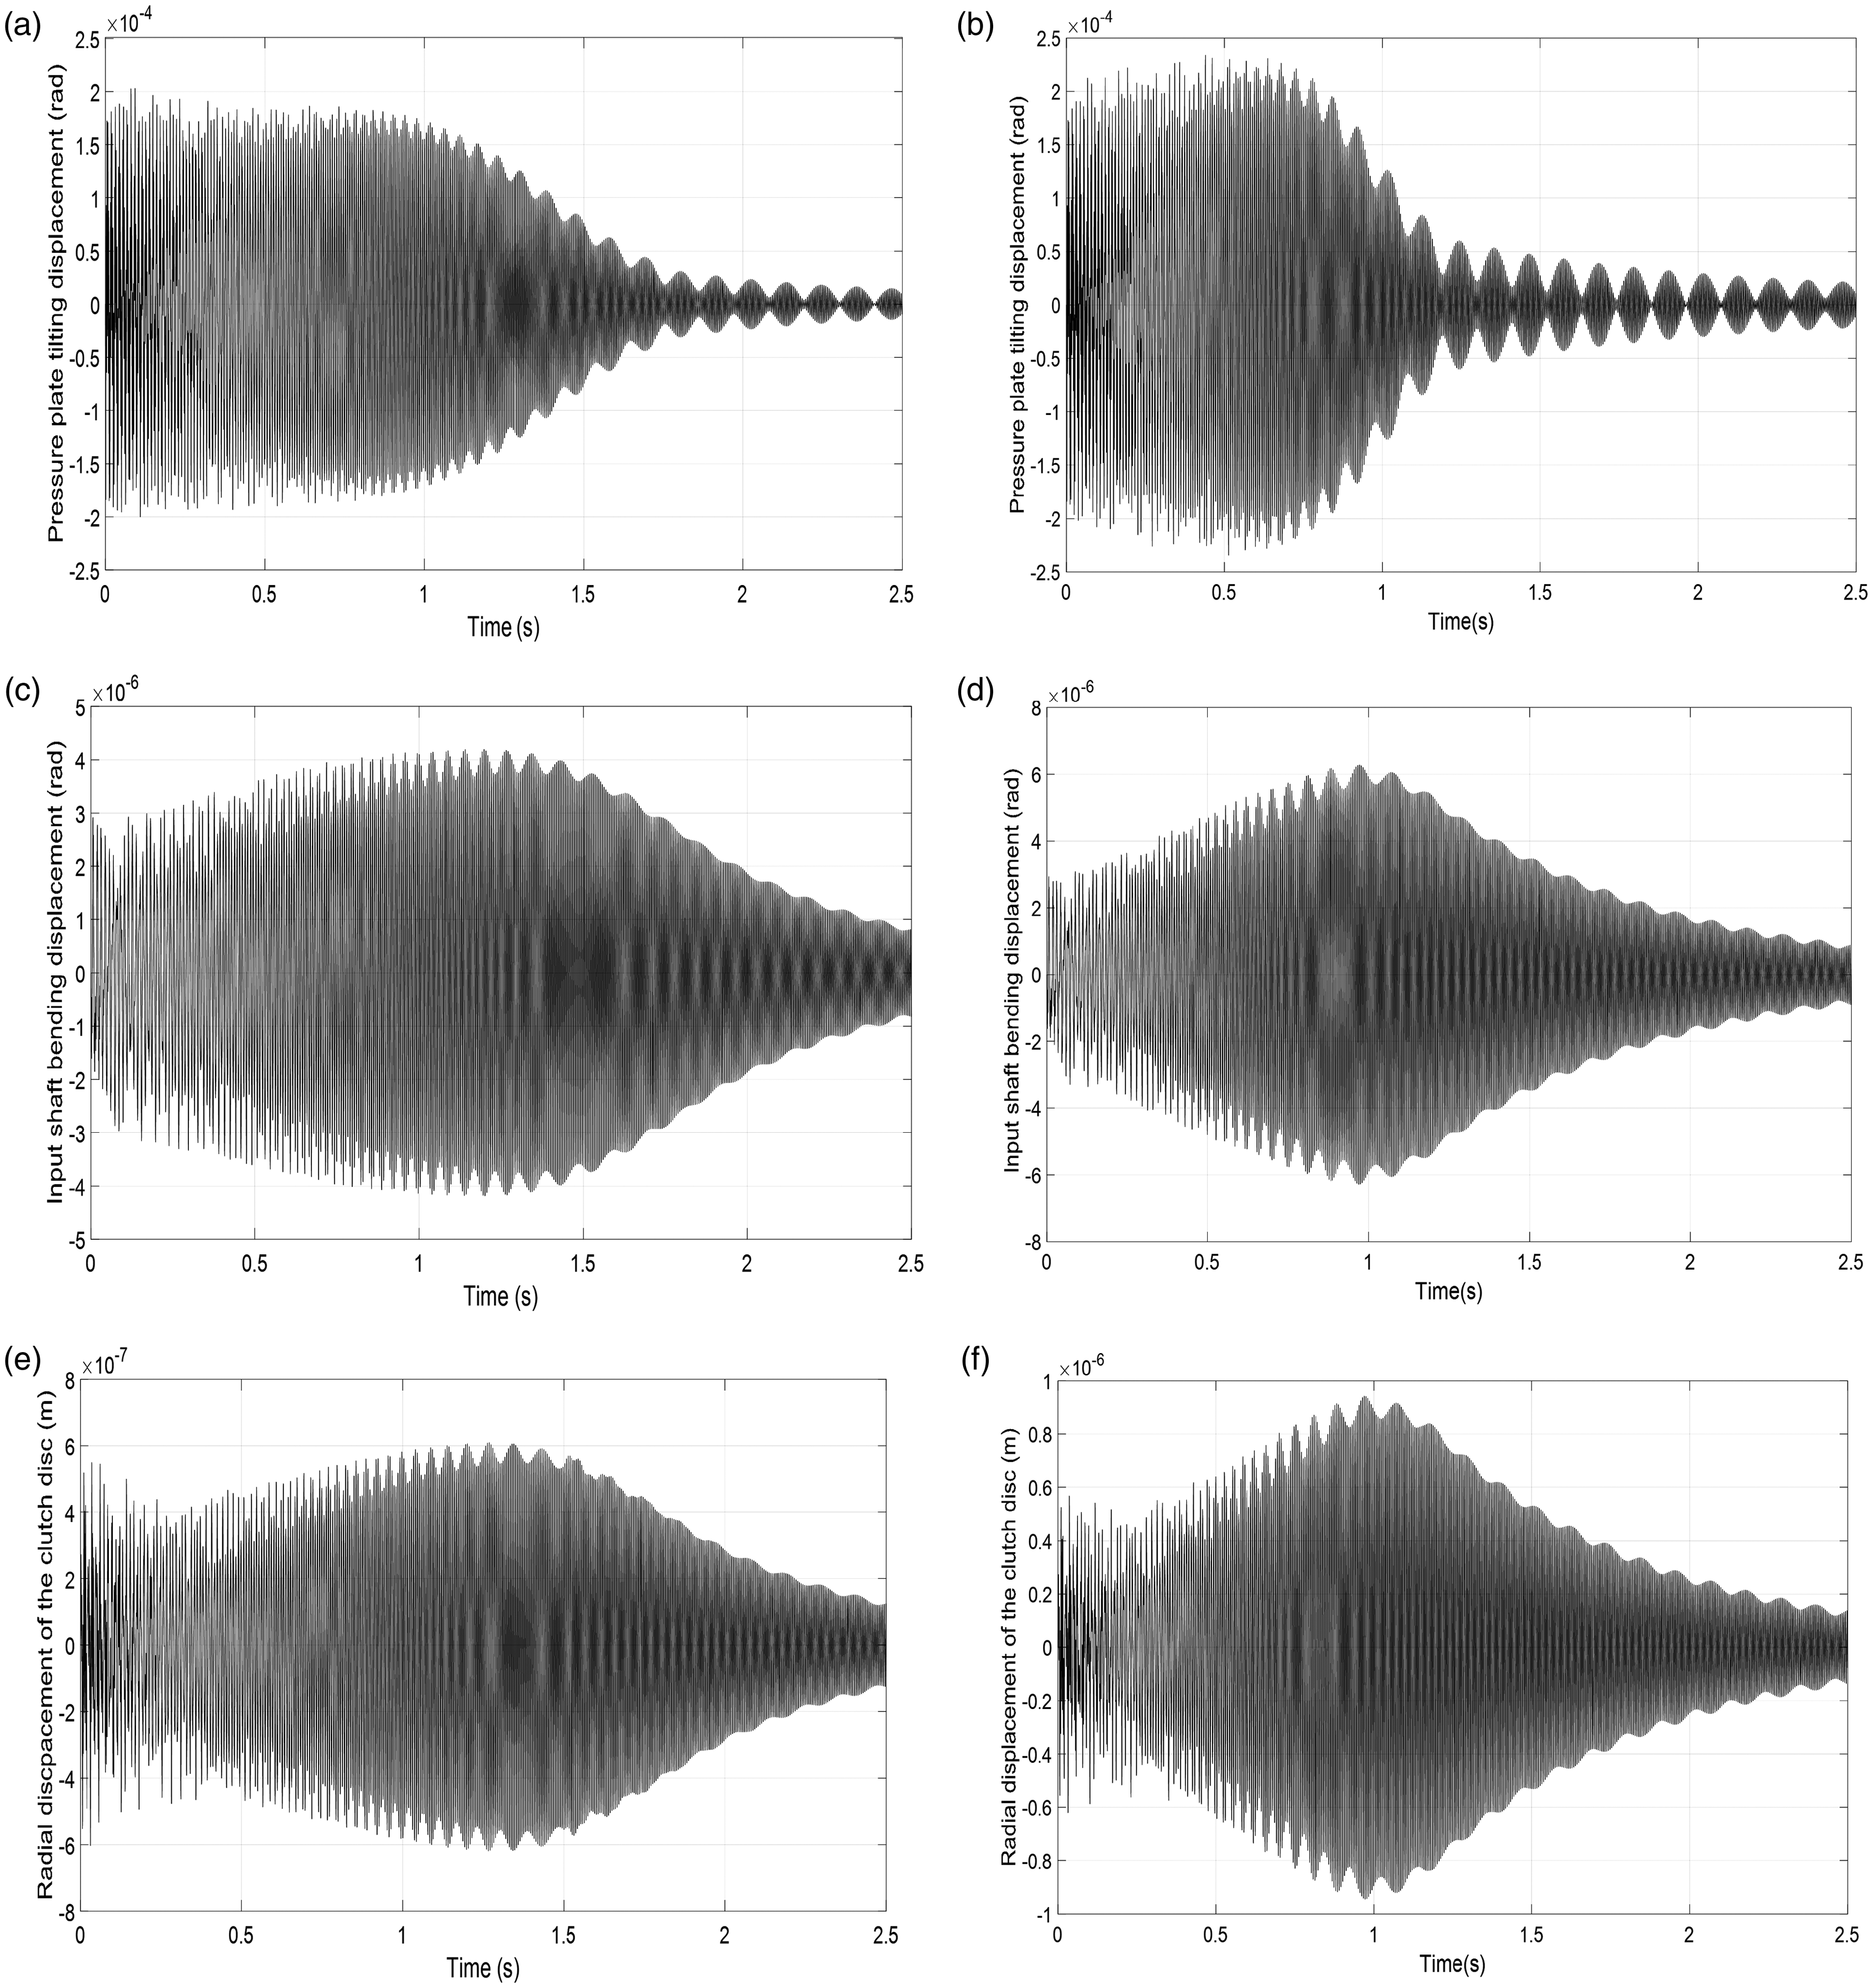
Figure 16(c) and (d) depicts the input shaft bending motion for both manoeuvres. The amplitude of the vibration is higher during the fast manoeuvre, particularly near full engagement. The largest differences are noted in the clutch disc radial motion (Figure 16(e) and (f)). The effect of friction force in this degree of freedom is a key factor for the clutch behaviour. The friction force acting in radial direction is a function of the clamp load, direction of slip, as well as the dynamic friction coefficient. The clutch lock-up during the fast engagement manoeuvre takes place when the clamp load is 3.9 kN with dynamic friction coefficient value close to the static value compared to 2.9 kN clamp load at the slow engagement manoeuvre. As a result, the friction force and stick slip behaviour until clutch lock-up generate oscillations with higher amplitude when the engagement process is more aggressive.
Continuous wavelet transformation (CWT) plots are obtained to determine the transient spectral content for each engagement process. Figure 17 presents the CWTs for the corresponding time histories presented in Figure 16. The CWTs of Figure 17(a) and (b) show the frequency content of the pressure plate tilting motion (slow and fast engagements, respectively). The consistent frequency content noted in the range 100–200 Hz corresponds to the natural frequency of the pressure plate axial motion. During early engagement the CWT contains contributions from the pressure plate tilting motion natural frequency (400–800 Hz). During the slow engagement manoeuvre this activity is restricted to 600 Hz, well before clutch lock-up. However, during the fast engagement manoeuvre this natural frequency threshold rises above 700 Hz due to different clamp loads at lock-up, which is around 0.8 kN for slow engagement and almost 2 kN for fast engagement. The CWTs of the input shaft bending motion (Figure 17(c) and (d)) show a frequency contribution starting at 100 Hz until 200 Hz (corresponding to the natural frequency of the clutch disc axial motion) with similar content. Finally, the CWTs of Figure 17(e) and (f) corresponding to the clutch disc radial motion exhibit two main frequency contributions: (i) the lower one corresponds to the natural frequency of the axial motion and (ii) the contribution at around 380 Hz corresponds to the natural frequency of the clutch disc radial motion. However, in the slow engagement manoeuvre this contribution decays at 1.5 s, corresponding to 2.9 kN clamp load and, consequently, to lower friction force in the radial direction compared to the fast engagement case. In the latter, the natural frequency around 380 Hz starts decaying at 1.1 s, close to clutch lock up corresponding to 3.9 kN clamp load. The main conclusion that can be extracted from the wavelets of Figure 17 is that although the frequency content for each degree of freedom response is similar, in the case of fast engagement the region with high intensity appears across almost the whole engagement process. On the other hand, in the slow engagement process the natural frequencies decay at lower cushion spring deflections. The latter difference (cushion spring compression) may show that although in both slow and fast engagement processes the frequencies that appear are similar, the level of the clamp load (which is linked with the generated friction), can lead to different behaviour for potential NVH issues.
CWTs for slow (left) and fast (right) clutch engagement manoeuvres: (a) – (b) pressure plate tilting motion, (c) – (d) input shat bending motion and (e) – (f) clutch disc radial motion.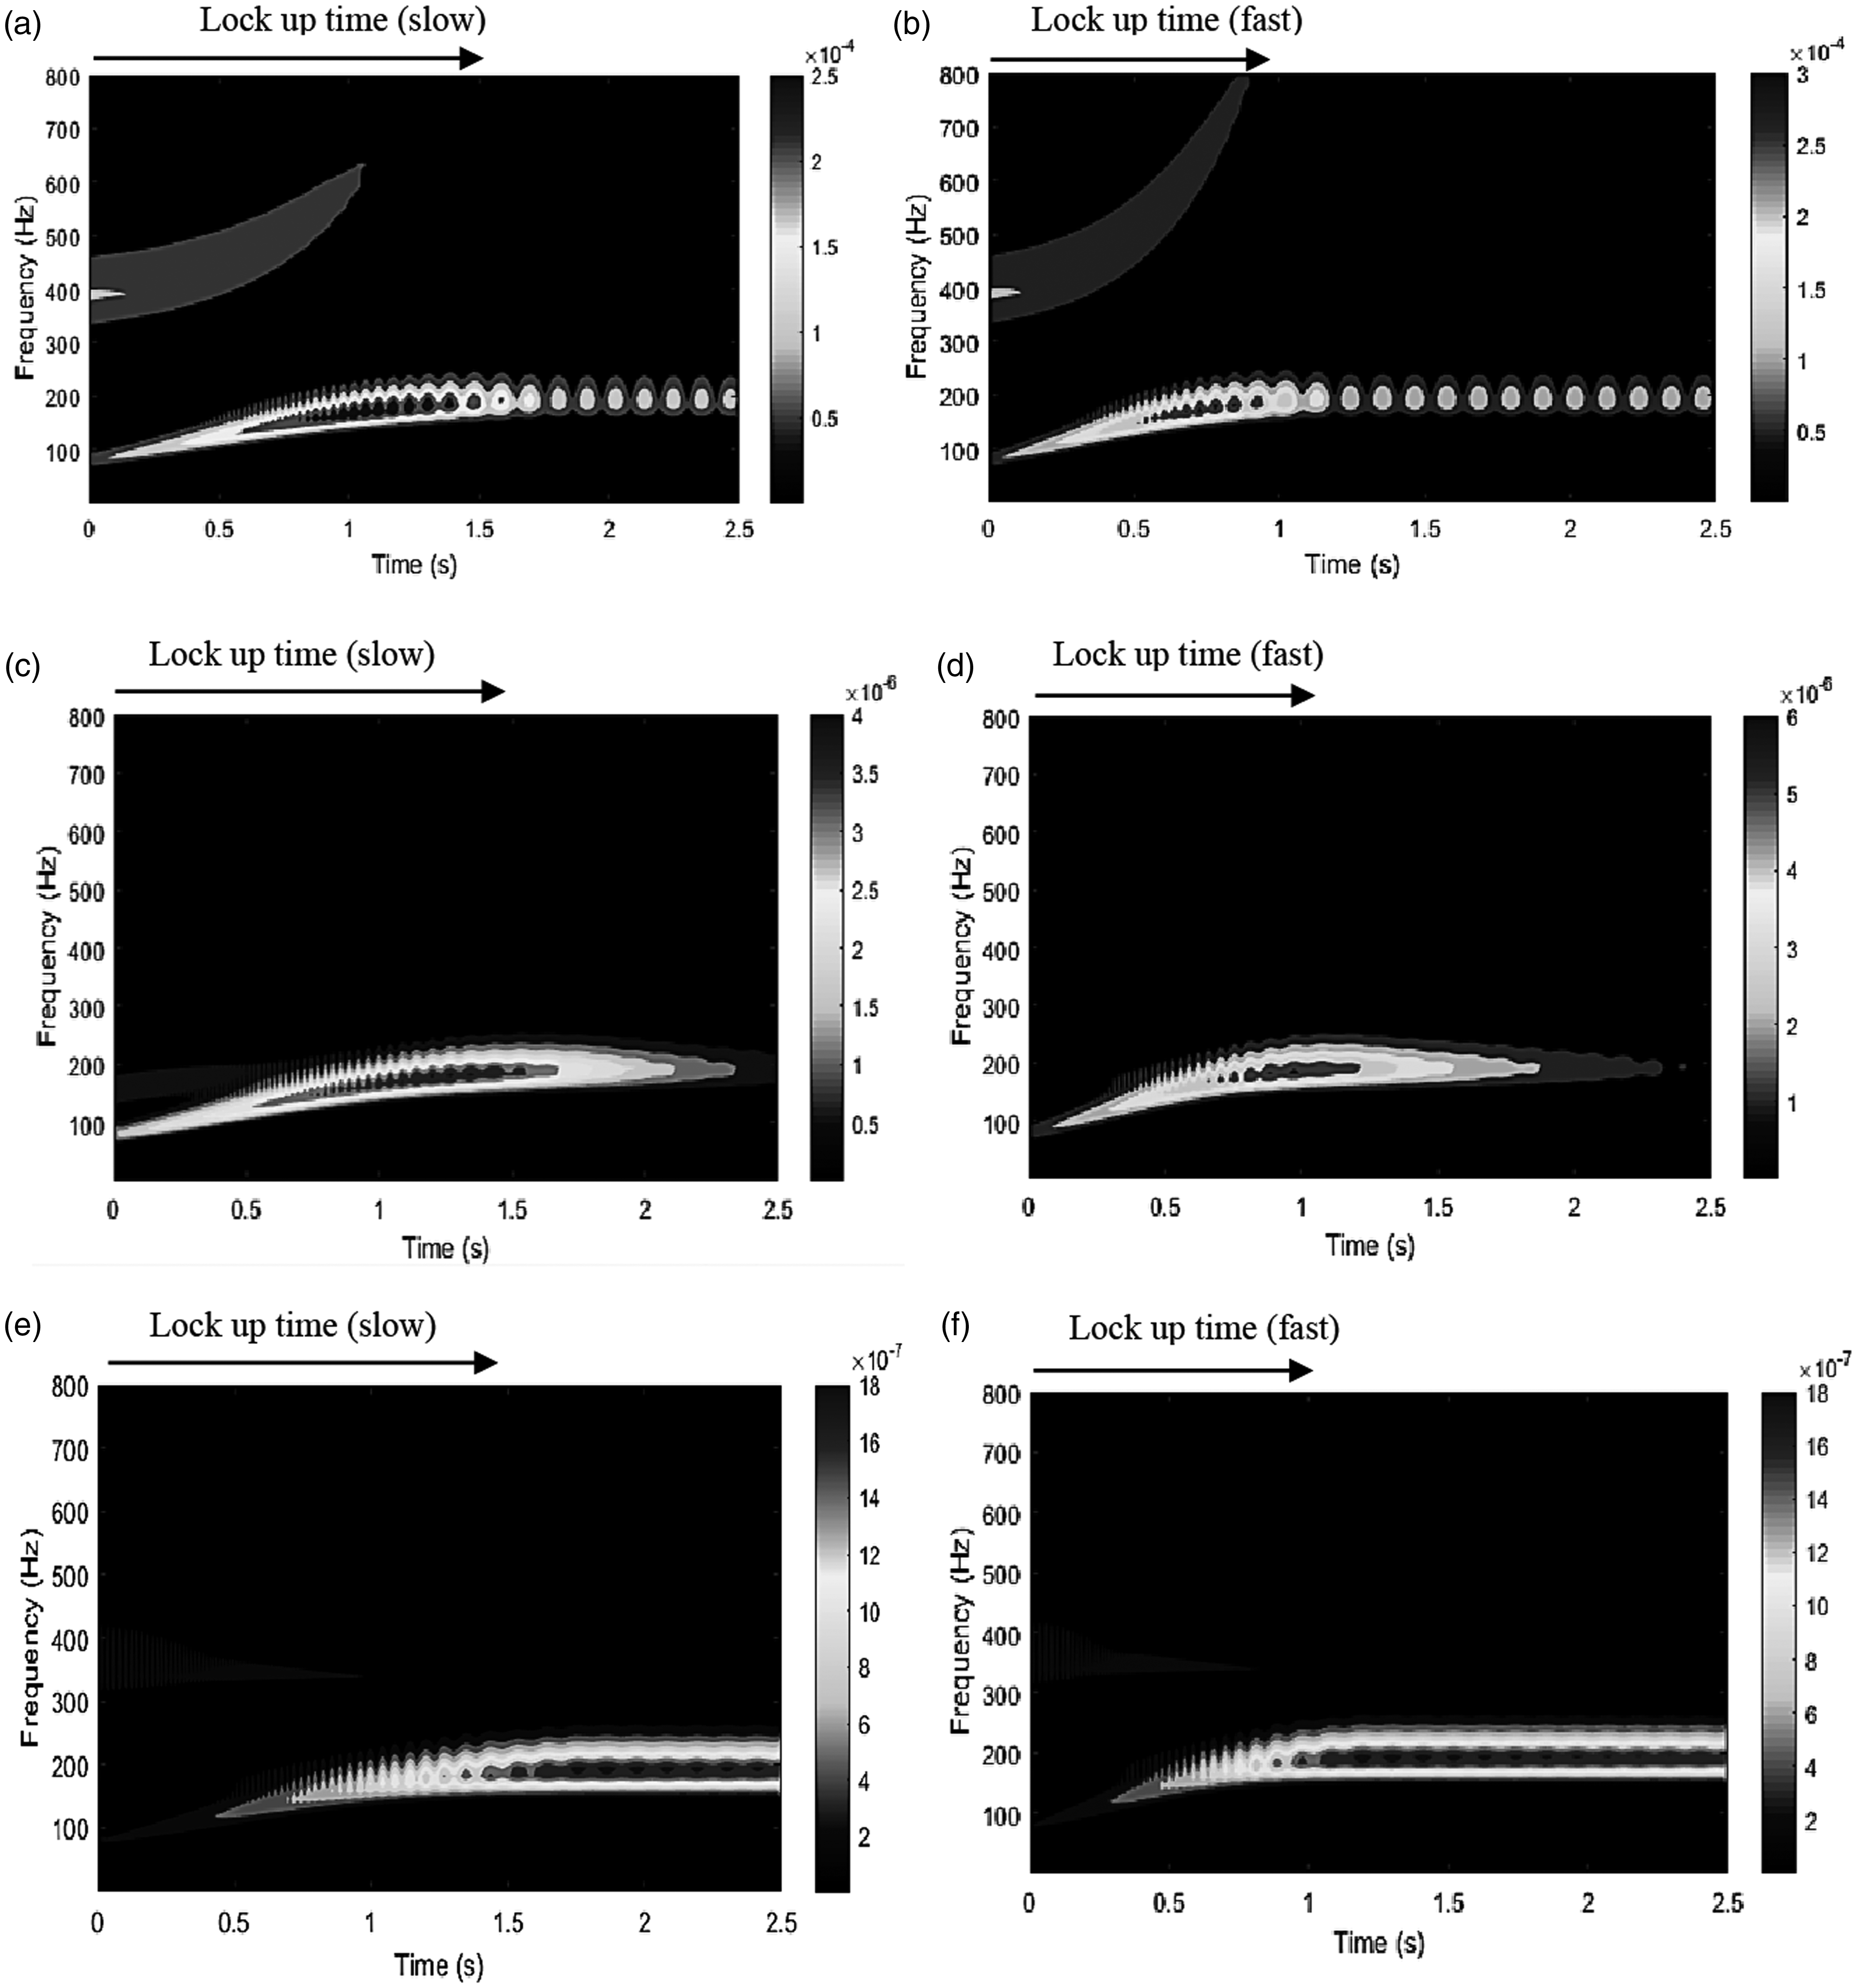
In order to determine the likelihood of the observed behaviour leading to NVH issues, a stability analysis is conducted. The dynamic friction coefficient for each manoeuvre was selected using the results of Figure 15. The corresponding clamp load for each case is utilised, thus the effect that the coefficient of friction and the engagement time along with clamp load have in the system stability will be determined by examining the real parts of the eigenvalues (Figure 18). The main instability presented in Figure 18 is related to the vibration mode with frequency of around 370 Hz, which corresponds to the radial motion of the clutch disc (Figure 17(e) to (f)). Instability is observed in both manoeuvres although the behaviour is different. Figure 18 shows that the real part of the corresponding eigenvalue is higher during fast engagement where the clamp load, the dynamic friction coefficient and consequently the friction force take higher values.
37
Moreover, it can be observed that the instability during fast engagement lasts until 1 s, which is close to the clutch system lock-up (1.1 s) compared to the slow engagement that the system becomes stable at 1.35 s. For the latter case the clutch lock-up takes place at 1.55 s. Consequently, it can be observed that in the slow engagement manoeuvre the unstable mode lasts for a shorter period during engagement (87% of the manoeuvre is unstable) compared to this of the fast engagement process (90% of the manoeuvre is unstable). Finally, the coefficient of friction during slow engagement has lower values. The main mode of vibration leading to system instability is related to the generated friction between the clutch components. So, the friction force may have key effects on the system stability.
Stability analysis for fast and slow engagement manoeuvres.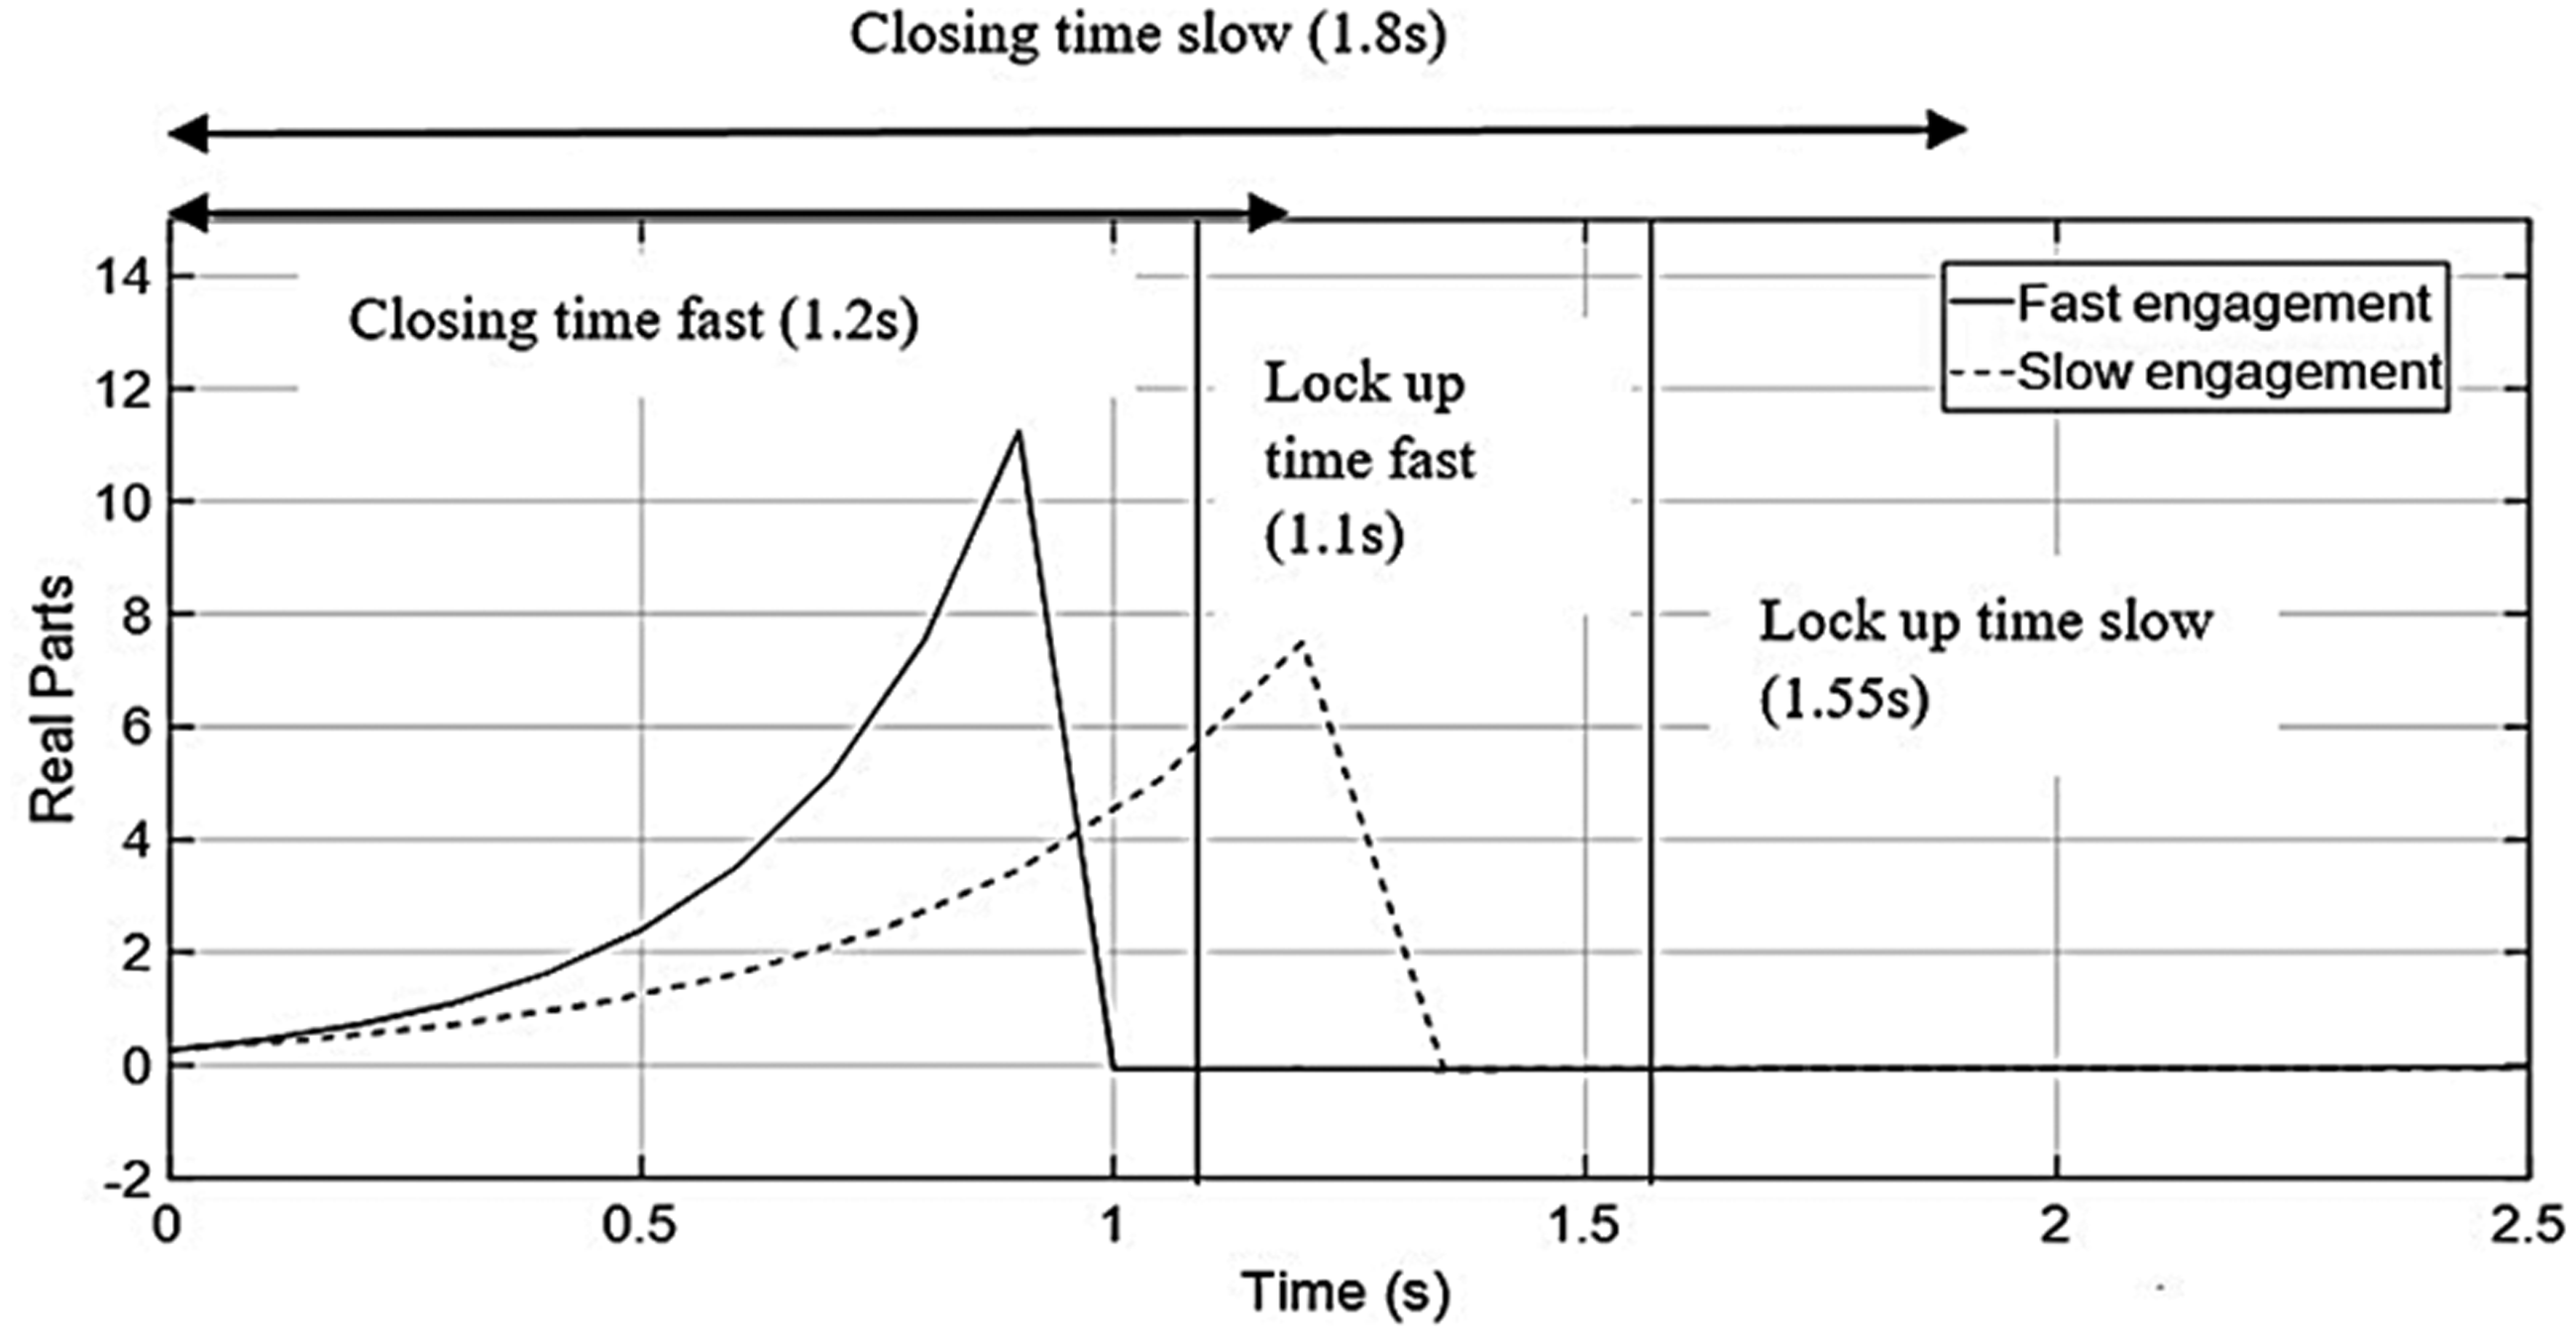
The results above are in good agreement with the findings presented by Chen et al. 24 Experimental measurements taken from a vehicle have identified aggressive clutch NVH behaviour within the region 330–410 Hz. Moreover, it was shown that the acceleration magnitude of the clutch disc in radial and tangential directions is higher than that of the axial motion.
Conclusions
The paper presents a validated three-DoF clutch torsional dynamic model. Additionally, a six-DoF clutch model (excluding torsional motion) is built to simulate the clutch engagement behaviour during various pull away manoeuvres. Measurements of the friction coefficient using clutch parts exhibiting a specific type of NVH behaviour were conducted and used as an input to both models. The generated friction on the clutch lining material was measured under various operating conditions, namely clamp loads and relative speeds between the clutch components. It was found that during more aggressive engagement manoeuvres, greater clutch pedal travel is required to synchronize the angular velocity of the flywheel and clutch disc. As a result, the clamp load and the friction force applied in the system obtain higher values. The two-dimensional six-DoF clutch model depicts the oscillatory behaviour of each component during different engagement manoeuvres. During a fast engagement manoeuvre the oscillations related to motion in the direction of friction generation are higher compared to those of a slow engagement manoeuvre. This is because during the clutch lock-up during fast engagement the clamp load and friction forces are higher compared to slow engagement. The vibrating mode around 370 Hz corresponding to the radial motion of the clutch disc was found to introduce instability to the system. For the slow engagement manoeuvre this instability lasts longer. Moreover, the friction coefficient and clamp load are shown to affect this instability, leading to potential NVH behaviour. Experimental validation of the current six-DoF model and the development of a three-dimensional clutch model constitute part of the future work. Coupling the clutch torsional motion with the bending motions is anticipated to affect the way that friction acts during engagement.
Footnotes
Acknowledgements
Thanks are extended to Ford Motor Company for the support that was provided for this research.
Declaration of Conflicting Interests
The author(s) declared no potential conflicts of interest with respect to the research, authorship, and/or publication of this article.
Funding
The author(s) disclosed receipt of the following financial support for the research, authorship, and/or publication of this article: The authors would like to express their gratitude to the Engineering and Physical Sciences Research Council (EPSRC) for the sponsorship of this research (EP/N509516/1).