
Abstract
This paper studies the prototype development of the vibro-impact capsule system aiming for autonomous mobile sensing for pipeline inspection. Self-propelled progression of the system is obtained by employing a vibro-impact oscillator encapsuled in the capsule without the requirement of any external mechanisms, such as wheels, arms, or legs. A dummy capsule prototype is designed, and the best geometric parameters, capsule and cap arc lengths, for minimizing fluid resistance forces are obtained through two-dimensional and three-dimensional computational fluid dynamics analyses, which are confirmed by wind tunnel tests. In order to verify the concept of self-propulsion, both original and optimized capsule prototypes are tested in a fluid pipe. Experimental results are compared with computational fluid dynamics simulations to confirm the efficacy of the vibro-impact self-propelled driving.
Introduction
A pipeline inspection gauge, normally known as PIG, is a device inserted into oil pipelines driven by the pressure of the product flow within the pipes. PIGs have been used for cleaning oil pipelines for many years, with newer generations of inspection PIGs which are equipped with a variety of tools, such as callipers, to measure the inner diameter and roundness of the pipeline in order to identify excessive wear or crushing. The development of inline intelligent PIGs, 1 now allows detailed inspection inside pipelines, without significantly interrupting product flow or requiring personnel to travel the length of the pipeline manually. Magnetic flux leakage or acoustic emission systems can be used to detect cracks or other defects within the pipe via a pigging capsule. 2 Combined with on-board position recording systems, intelligent PIGs can pinpoint both the location and severity of a defect with great accuracy, as well as providing the information of general condition of the pipe. 3 However, intelligent pigging is not always a viable option as the device is passively driven by fluid flow, i.e. it is only able to move in the direction and at the rate of product flow. Generally, it is not realistic to adjust the flow rate for inspection, and in addition, as the device can only travel in one direction, facilities must exist for PIG to enter the pipe at one end and be removed from the other end. Therefore, the development of the self-propelled PIG with bidirectional rectilinear movement, which is independent of product flow, is vital to address the bottlenecks encountered by the current pigging technologies.
The original idea of this paper came from intelligent PIGs, and the purpose of the study here is to develop a capsule PIG prototype for verifying the concept of the vibro-impact self-propulsion aiming for general pipeline inspections, including oil, irrigation, and sewage pipes. Pipeline inspection devices are capable of moving independently with or against product flow, which therefore yield significant advantages over traditional pressure-driven PIGs in certain situations. As a result, autogenously driven capsule systems4–7 have been an area of increasing scientific activity in recent years. The ability to move independently without any external mechanisms, such as wheels and arms, makes such a system ideally suited to move in harsh and complex environments where external moving parts may either pose a hazard to the surroundings or be broken, corroded or blocked up by the working environment. 8 The idea of self-propelled capsule was initially proposed by Chernous’ko, 4 who introduced the control forces between rigid bodies of a two-mass system to overcome dry friction and realize optimum rectilinear motion. Liu et al. 9 adopted the same idea to develop a pendulum-driven cart which can be driven in a two-dimensional plane through properly modulating the periodic motions of two inverted pendulums. Then, the periodic driving force was considered in the pulse-width periodic mode of a mobile capsule mechanism, 10 and the effects of magnitude and duty cycle of such periodic excitation on the motion of the capsule have been discussed. Zhan and Xu 11 studied the planar locomotion of the system actuated by three internal acceleration-controlled masses, which can follow desired oblique and curve trajectories by properly choosing system parameters. A similar system involving two inner masses was investigated by Chernous’ko,12,13 and a control strategy was proposed to move the rigid body to any given point in a two-dimensional plane. As a kind of self-propelled capsule, the vibro-impact capsule system has been mathematically modelled and numerically studied by Liu et al.6,14–19 Liu et al. 15 found that the parameter values of the vibro-impact capsule system for the fastest progression with and without considering energy consumption were different, and this conclusion has been verified experimentally by Liu et al. 17 Under different environmental resistances, various vibro-impact responses of the capsule system were investigated in Liu et al., 14 which revealed that the influence of friction mechanism became less important when the inner mass was very small. In Liu et al., 15 a position feedback control method suitable for dealing with chaos control and coexisting attractors was studied for enhancing the desirable forward and backward capsule motion. Recently, dynamical response of the capsule system was studied by means of path-following techniques 18 focusing on two practical problems, maximizing the rate of progression and directional control of the system, by following a typical period-1 trajectory. However, previous works have focused on mathematical modelling of the vibro-impact capsule by simply assuming the contact environment as a solid surface and without consideration of fluid environment, although the later scenario is much more realistic for engineering pipeline inspection 20 and medical endoscopic diagnosis. 21 Therefore, this paper will study the vibro-impact capsule system in a fluid pipeline by employing the computational fluid dynamics (CFD) modelling approach in order to optimize the geometry of the capsule for the fastest progression. For verifying the numerical optimization obtained from CFD analysis, wind tunnel tests and experiments using a fluid circulating pipeline system have been carried out to compare the performance of both original and optimized capsule prototypes.
The rest of this paper is organized as follows. The next section uses 2D CFD simulation to analyse the progression of a capsule prototype in fluid. The design is optimized geometrically to achieve the minimum drag and lift forces. Then, the 2D investigation is verified by 3D CFD analysis. Wind tunnel test is carried out in the following section to validate the CFD studies. In the subsequent section, the design is materialized by a 3D printed capsule housing a vibro-impact oscillator, and the prototype is tested in a pipeline with both dry and fluid conditions. Further discussions are then given and finally, some concluding remarks are drawn in the last section. In addition, a brief description of the fundamental principle of the vibro-impact capsule system is given in Appendix 1.
CFD – 2D analysis
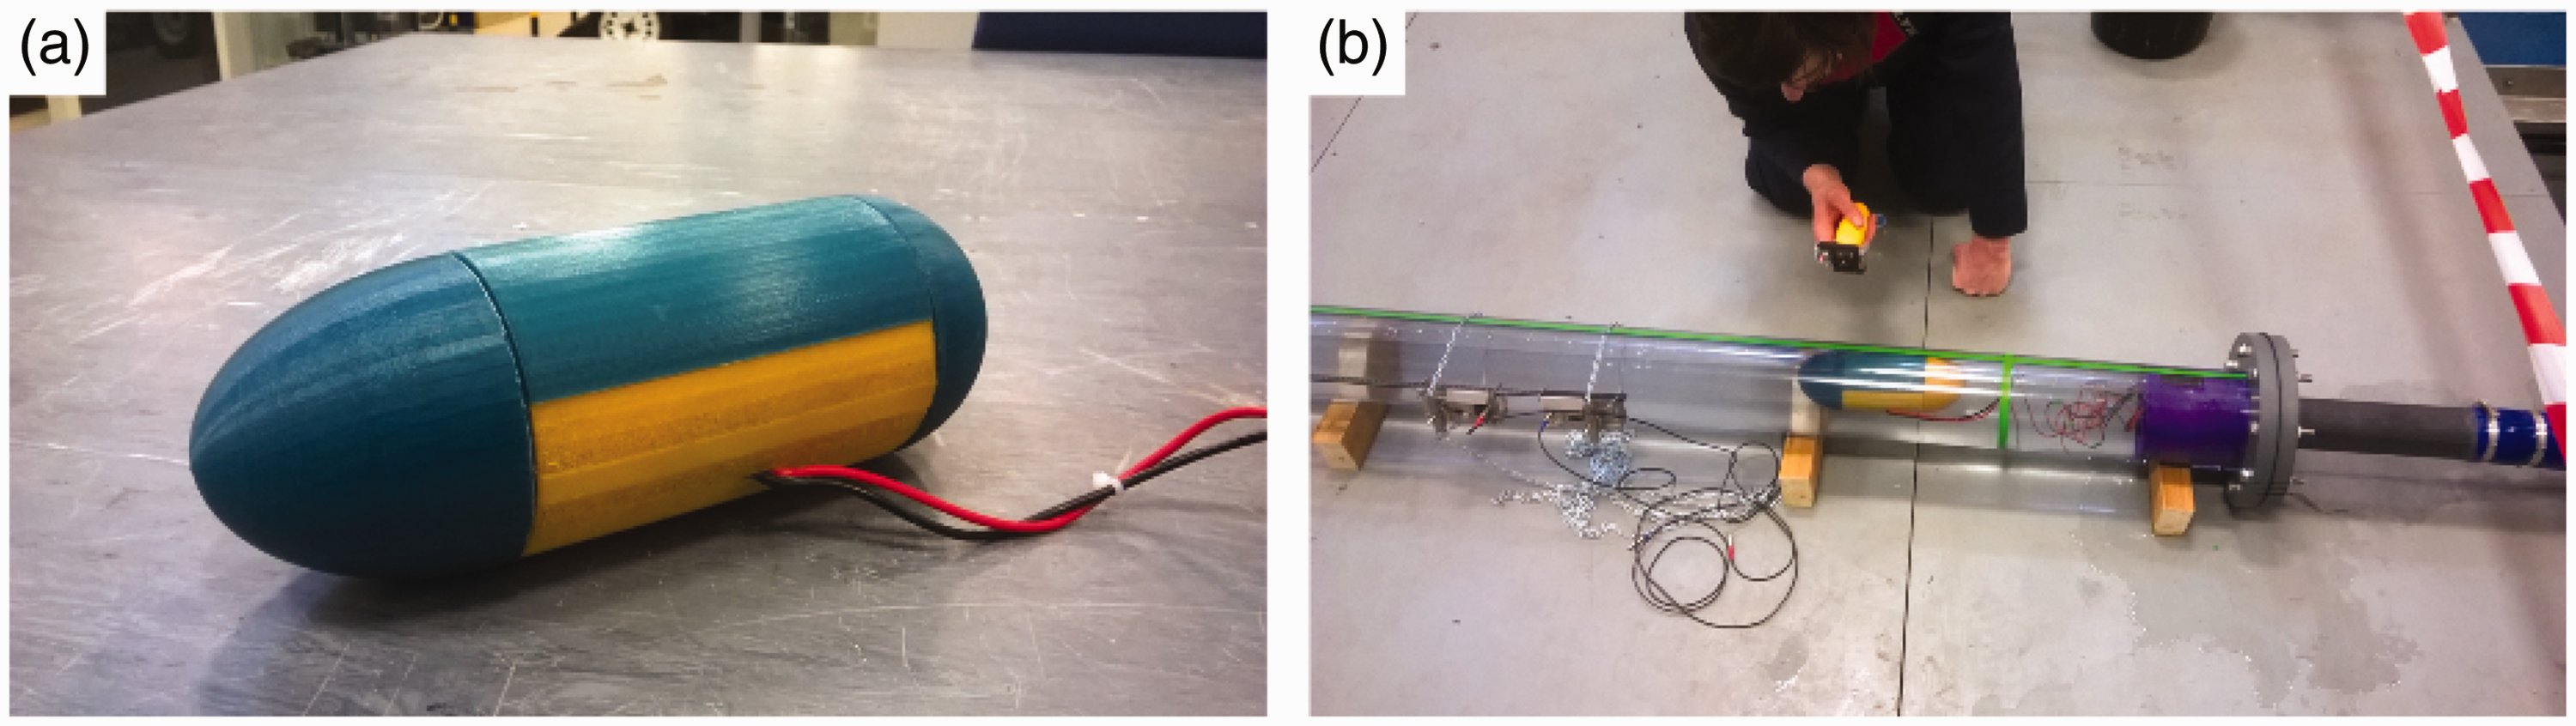
CFD modelling of inline pigging capsule gives an insight into how simulations can be employed during a design phase to determine the effect of geometry on the capsule performance and the changes required to achieve the optimum design. The pigging capsule shown in Figure 1 was chosen as an initial framework to develop the vibro-impact mechanism. The body was chosen based on a basic hydrodynamic shape and its sizing was altered to accommodate the internal vibro-impact oscillator and other components. In order to efficiently operate the vibro-impact system, the capsule geometry and pipe positioning were optimized with the help of CFD simulations and verified by wind tunnel tests.
(a) Model and (b) prototype of the vibro-impact capsule.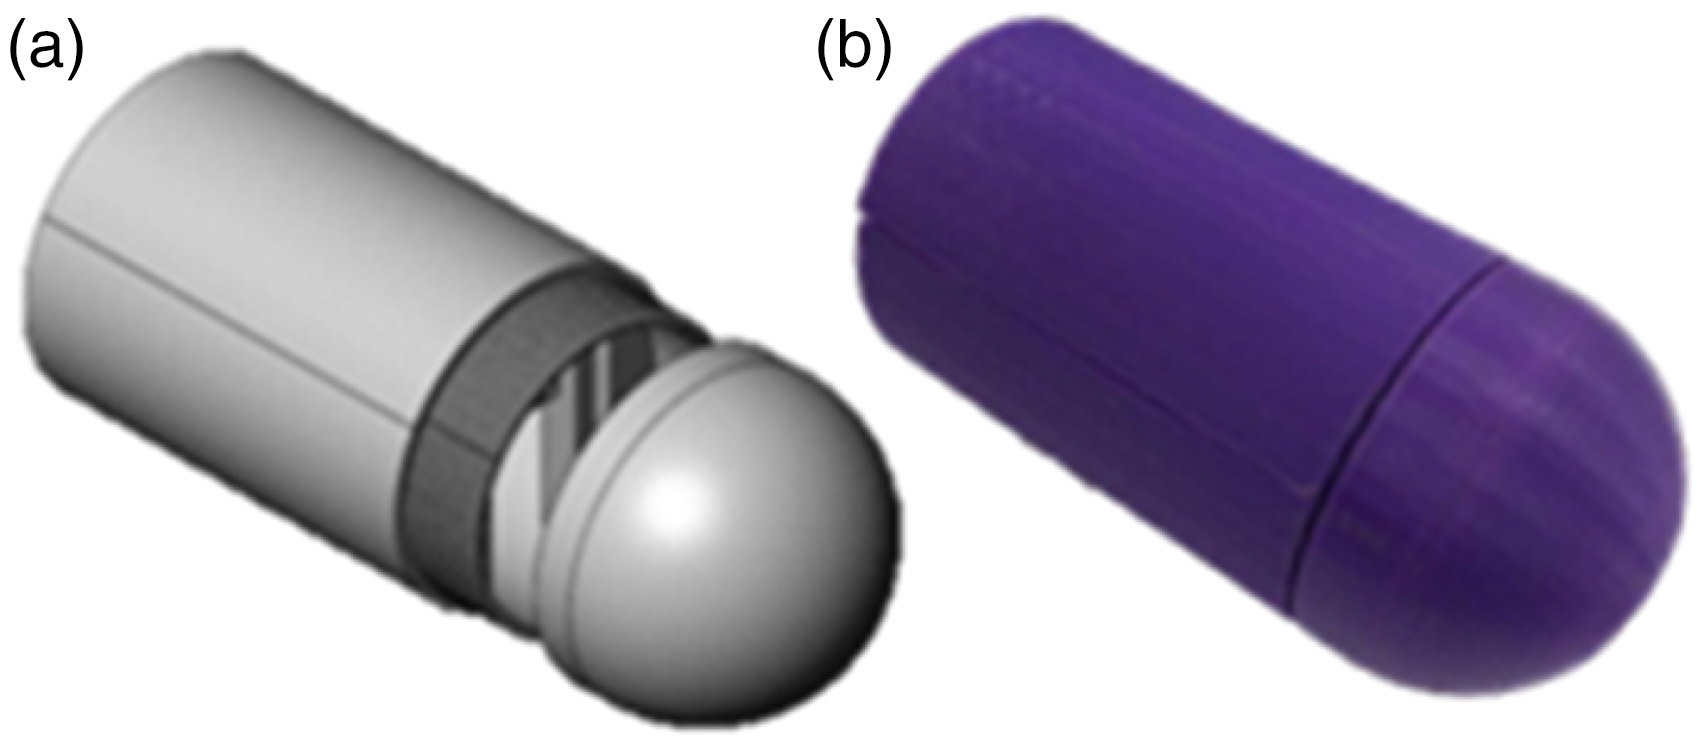
Modelling assumptions
Previous works on submerged capsule modelling22,23 deemed 2D simulations as an accurate predictor of flow mechanics. In these studies, the flow was assumed to be turbulent, which requires an enhanced wall function applied for an accurate prediction of fluid-wall interaction. Thus, to reduce the model complexity and simulation time, 2D simulations can be employed for the identification of important turbulent fluid characteristics.
As discussed by Khalil et al. 8 and Botros and Golshan, 24 the most effective meshing method for turbulent flow regimes within a pipeline is an unconstructed, exclusively quadrilateral element mesh with close wall biasing. The complexity of such a mesh setup requires the flow regime to be broken down into 24 individual faces using 40 projection lines. Additional geometry faces allow for a greater level of element position control and thus more element efficient mesh. Since the flow was identified as turbulent, a close wall bias was applied to each of the horizontal walls of the flow region for the enhanced wall function. A measurement known as Y-Plus check was also performed to make sure the mesh biasing is suitable for the close wall calculations required for turbulent flow. The resultant mesh had a total element count of 106,818 with a minimum element size of 0.89 mm. A grid sensitivity test using over 200,000 elements (achieved by halving the element size) confirmed that the 106,818 element mesh was sufficiently independent.
Governing equations
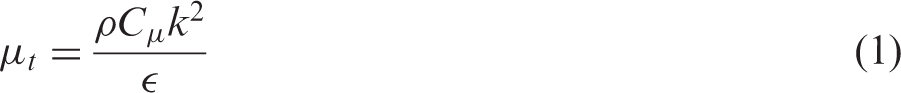
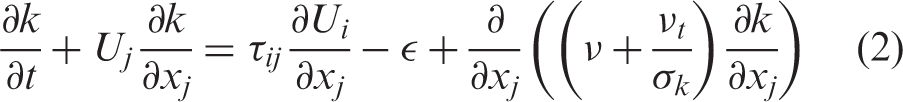
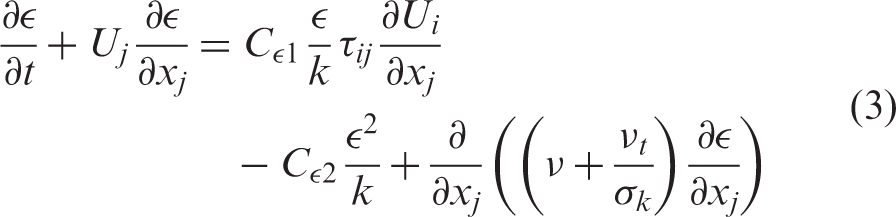
The nature of turbulent flow introduces fluctuations in fluid velocity fields which are unseen in laminar flows. These fluctuations are often accompanied with small amplitude and high frequency, which cannot be predicted by basic governing equations. In order to calculate these fluctuations in an accurate predictable manner, the simulation must introduce additional governing equations. More specifically, the
Boundary conditions
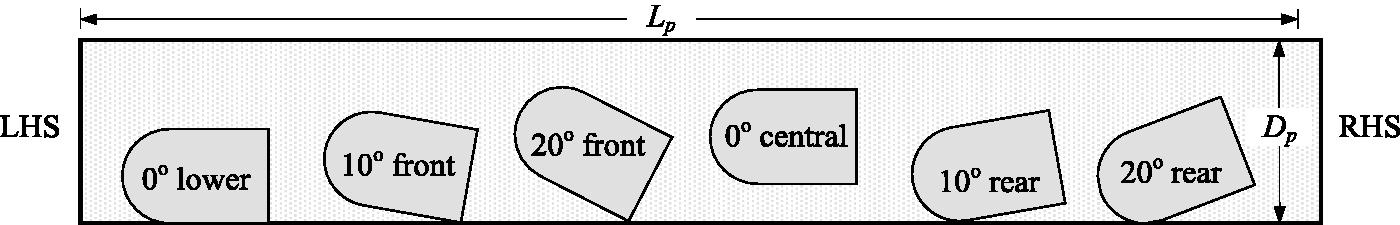
As seen in Figures 2 and 3, the flow regime was defined within a rectangular pipeline with the capsule outline positioned between the inlet and outlet. The left hand side (LHS) and right hand side (RHS) of the pipeline were defined as being a velocity inlet (set to a constant velocity of 0.5 m/s) and a pressure outlet, respectively. The capsule was placed approximately halfway of the pipeline to ensure a full development of the fluid prior to it reaching the capsule. The upper pipeline, lower pipeline and capsule outline were defined as standard walls with basic isothermal properties. The fluid was given the properties of water at 25 ℃ which comes as the pre-set option for ANSYS Fluent simulations. With an adaptable mesh, further 2D analysis was undertaken with varying capsule positions within the pipeline. Boundary conditions were correspondingly varied as seen from Figure 3, where angle and positioning of the capsule reached a maximum of 20° to the horizontal pipe edge.
Boundary condition of the 2D CFD model. CFD: computational fluid dynamics. 2D geometry setup for various capsule positioning.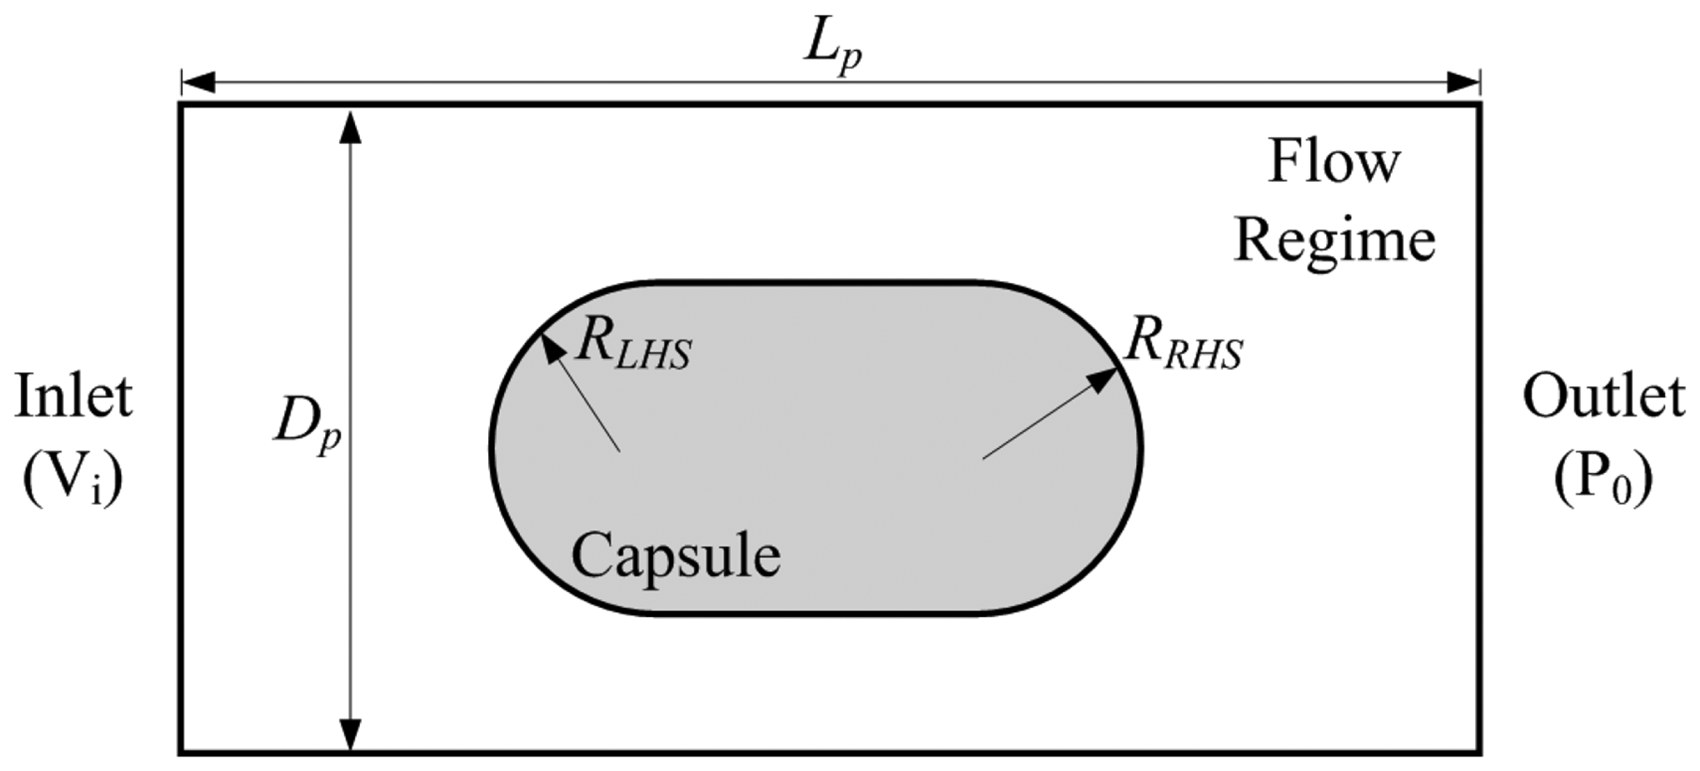
Computational procedure
The optimization focuses on the geometric design of the capsule. The capsule length (Lc) and both arc lengths (RLHS and RRHS) were designated as variables and their limits were defined based on the size limitation of the vibro-impact mechanism and manufacturing capabilities of the capsule. The goal of the optimization was to minimize the lift and drag coefficients of the capsule. A maximum of 50 sample simulations out of which 3 potential candidates were to be selected, before ANSYS identified one of the candidates as the best fit. Each simulation was ran for approximately 1800 iterations with an average convergence time of 20 min bringing the total simulation time up to 17 h. Post analysis of velocity contours, pathlines and pressure contours was achieved by ANSYS post processing. The simulation data were used to create a response surface plot for the lift and drag coefficients in comparison to the capsule geometry alterations. Steady state 2D simulations were implemented for original capsule design along with optimization giving results for various capsule positioning, including the lift and drag coefficients.
Optimization results
The goal-driven optimization studies identified the three best candidates for minimum drag and lift forces which vary with respect to the capsule geometry. It is shown in Figure 4 that the elongation of either RHS or LHS arc length reduces the drag force, but increases the lift coefficient. The final design was optimized with a compromise made to achieve both the lowest lift and drag coefficients, and the corresponding results are given in Table 1.
Drag and lift coefficients vary with respect to the geometry of the capsule frame. All parameters for final optimized design.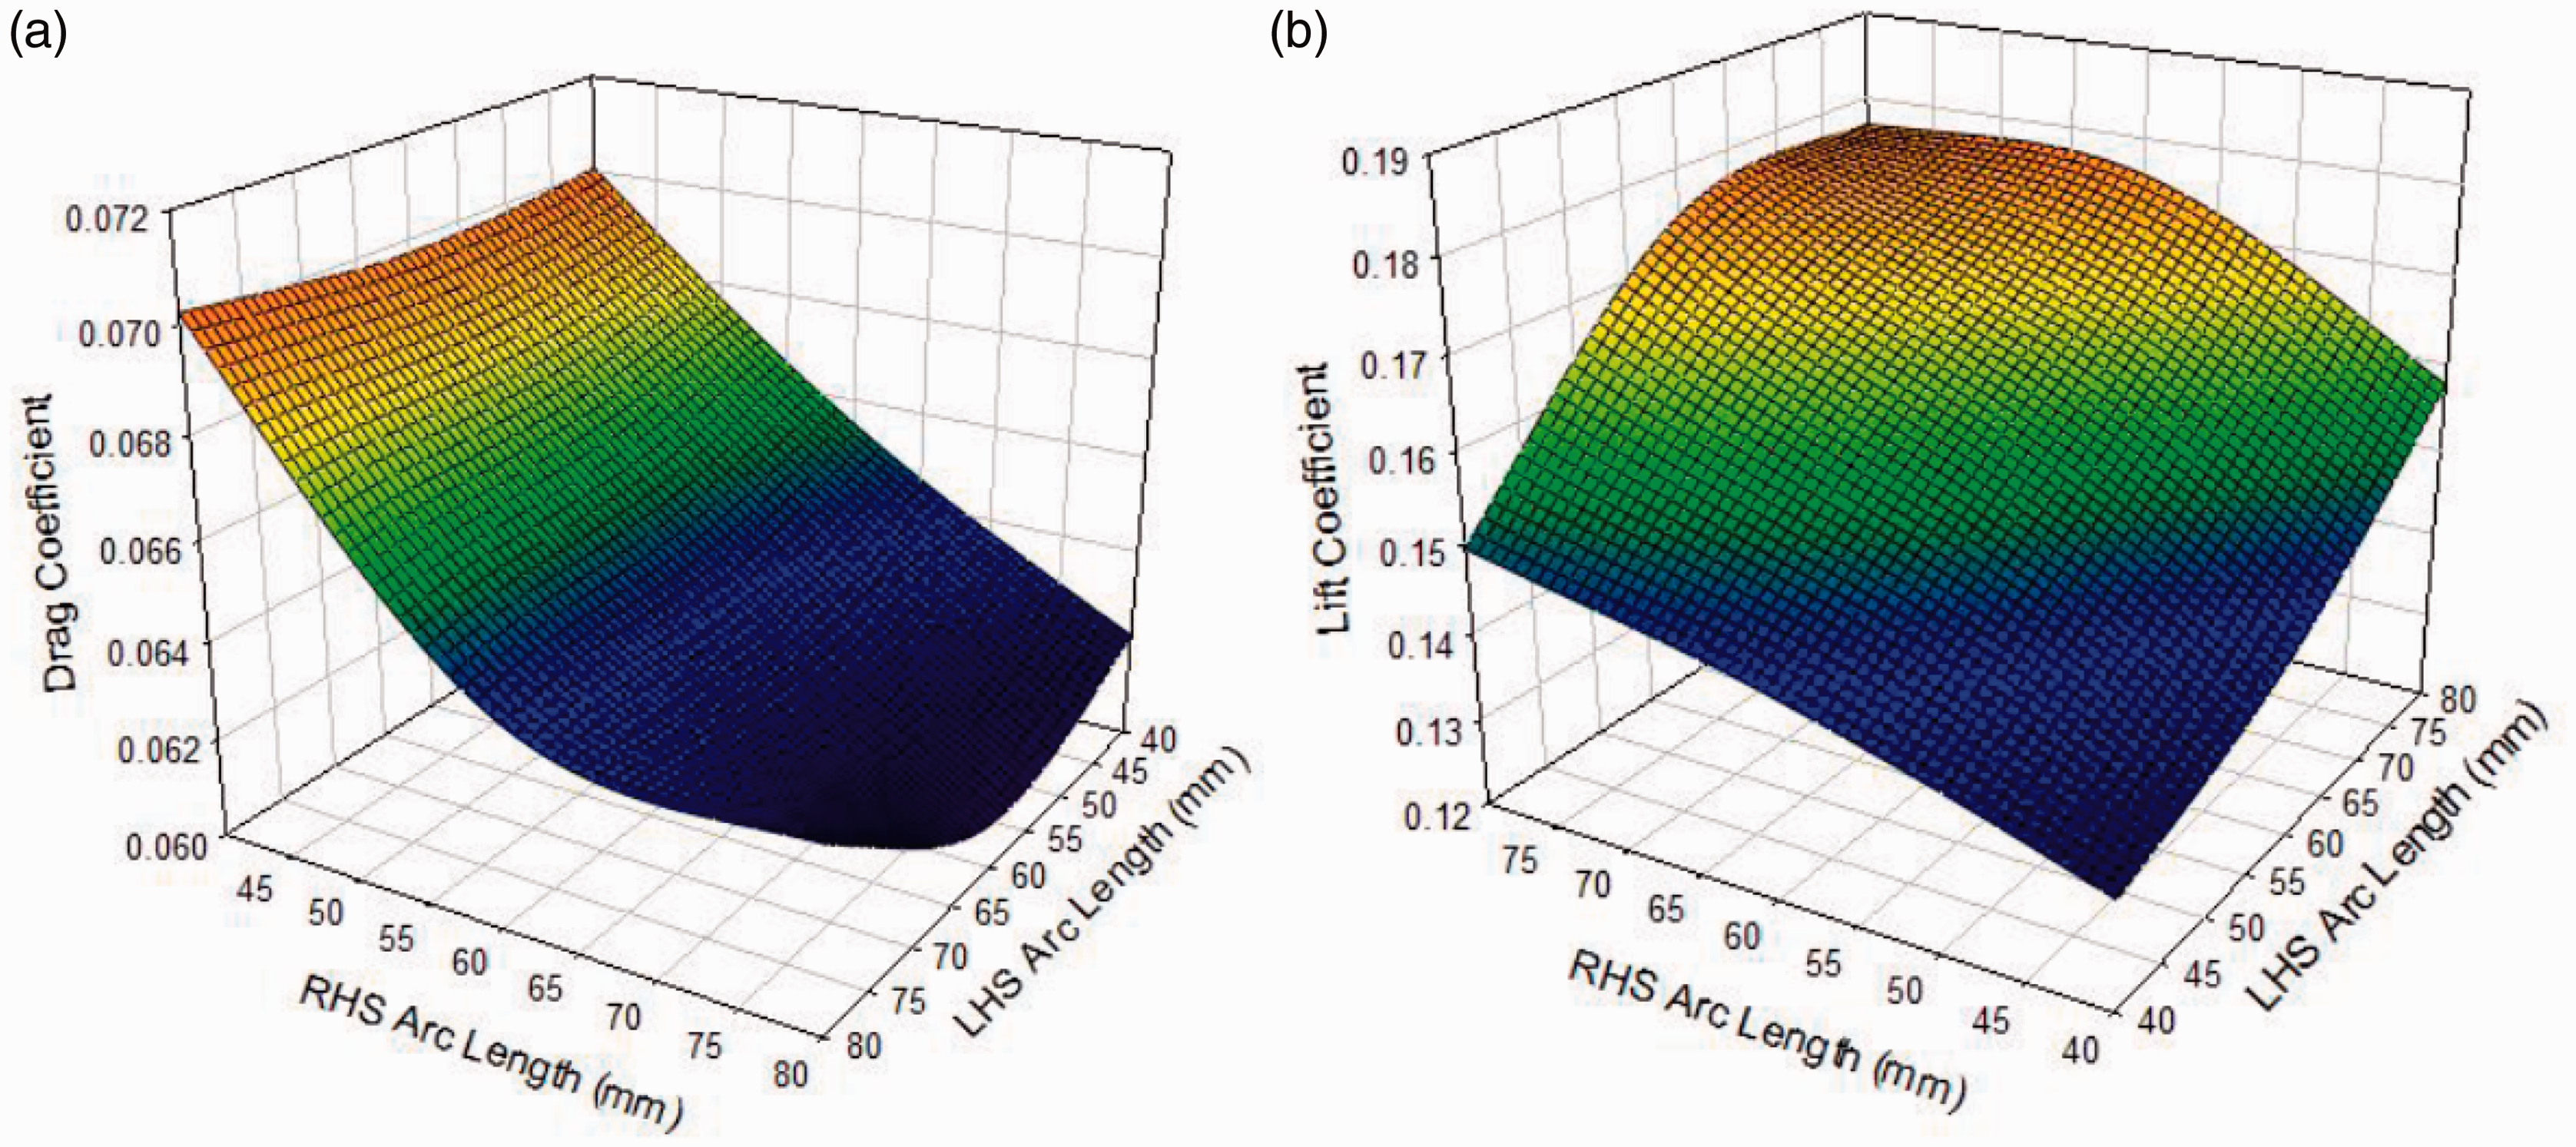

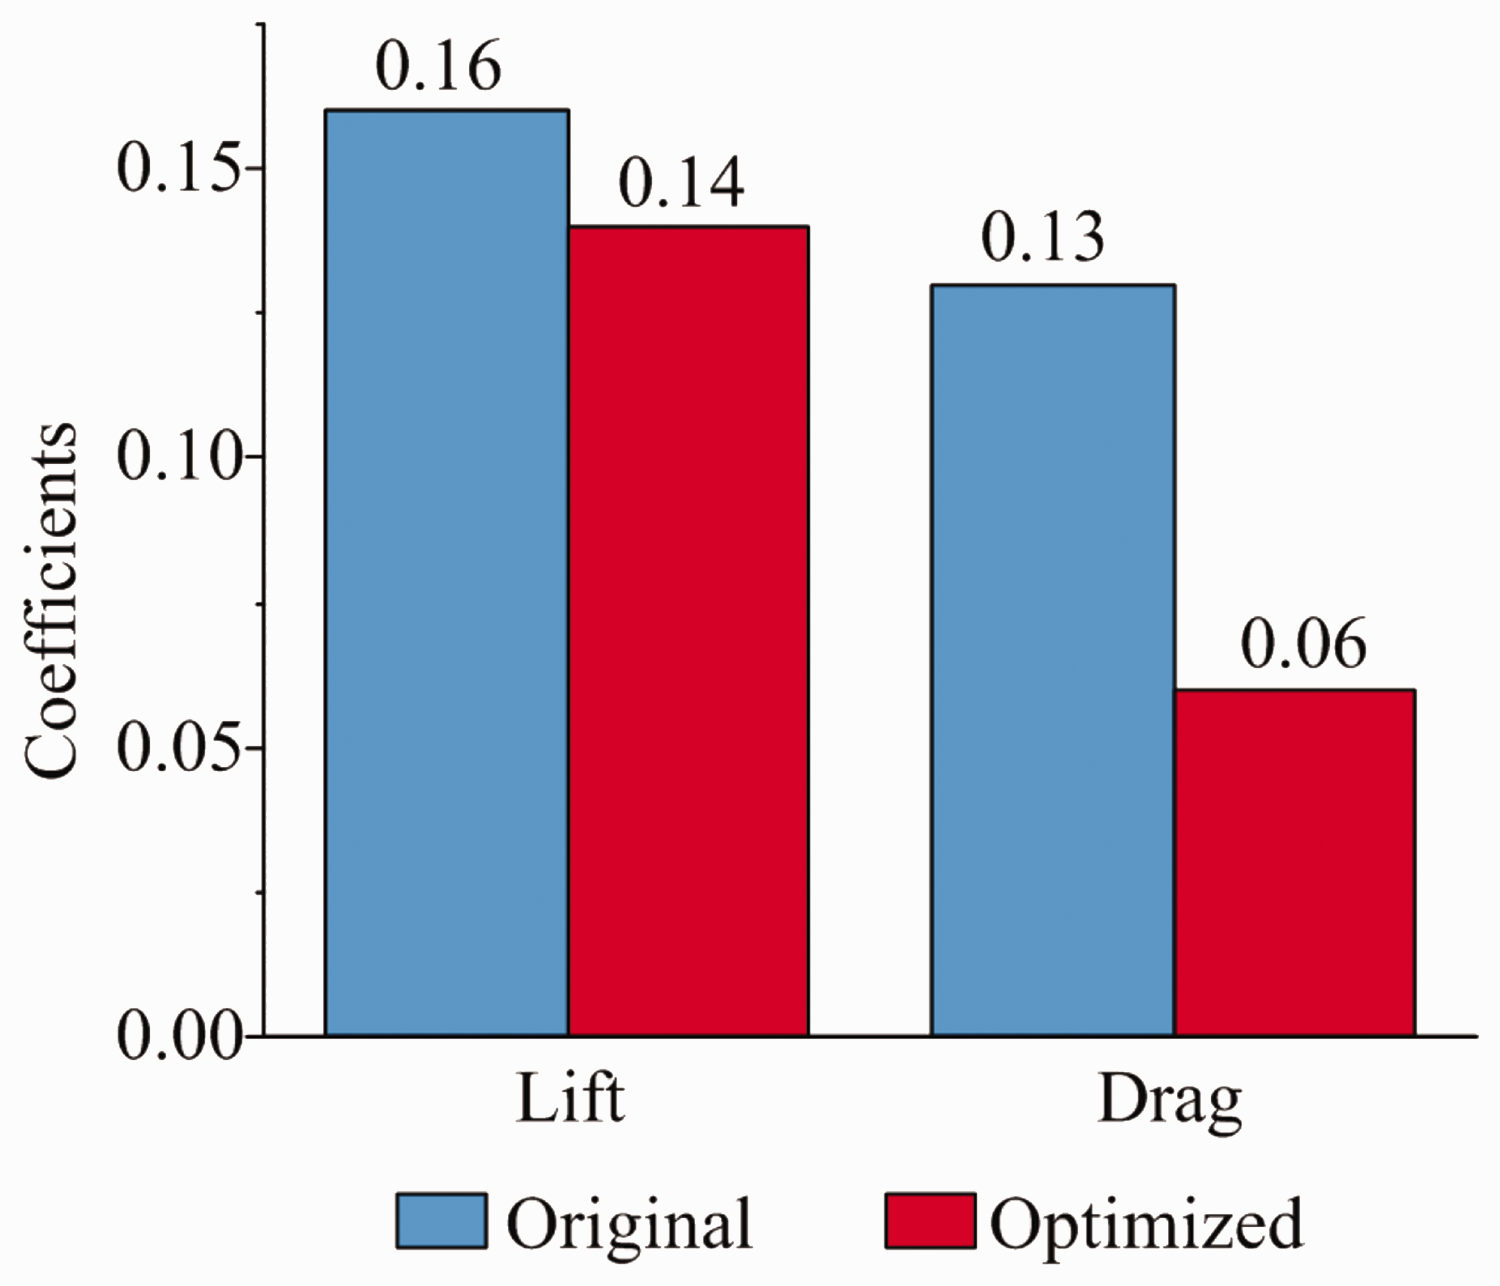
With the capsule opposing fluid direction, the optimization gives a drop in the pressure difference acting on the capsule of 23.7% as shown in Figure 5(b). The high and low pressure regions have been reduced by both the enlarged nose cone and the inclusion of a downstream nose cone. A reduction in the overall pressure difference acting on the capsule will allow it to travel upstream faster and with less energy consumption. A plot of velocity contours is presented in Figure 5(b) showing a slight reduction in passing fluid velocity by approximately 0.1 m/s (5.29%). The speed of vorticity within the downstream recirculation zone has been reduced thus producing a more desirable pressure region. This small variation significantly reduces the lift and drag coefficients by reducing the viscous interaction between the flow and the capsule’s surface. The optimized design given in Table 1 has a percentage reduction in drag and lift coefficients of 53.83% and 14.28%, respectively, and its graphic comparison is shown in Figure 6.
Comparison of 2D CFD (a) velocity and (b) pressure gradients for original (upper) and optimized (lower) designs. CFD: computational fluid dynamics. Comparison of the drag and lift coefficients between the initial and optimized designs.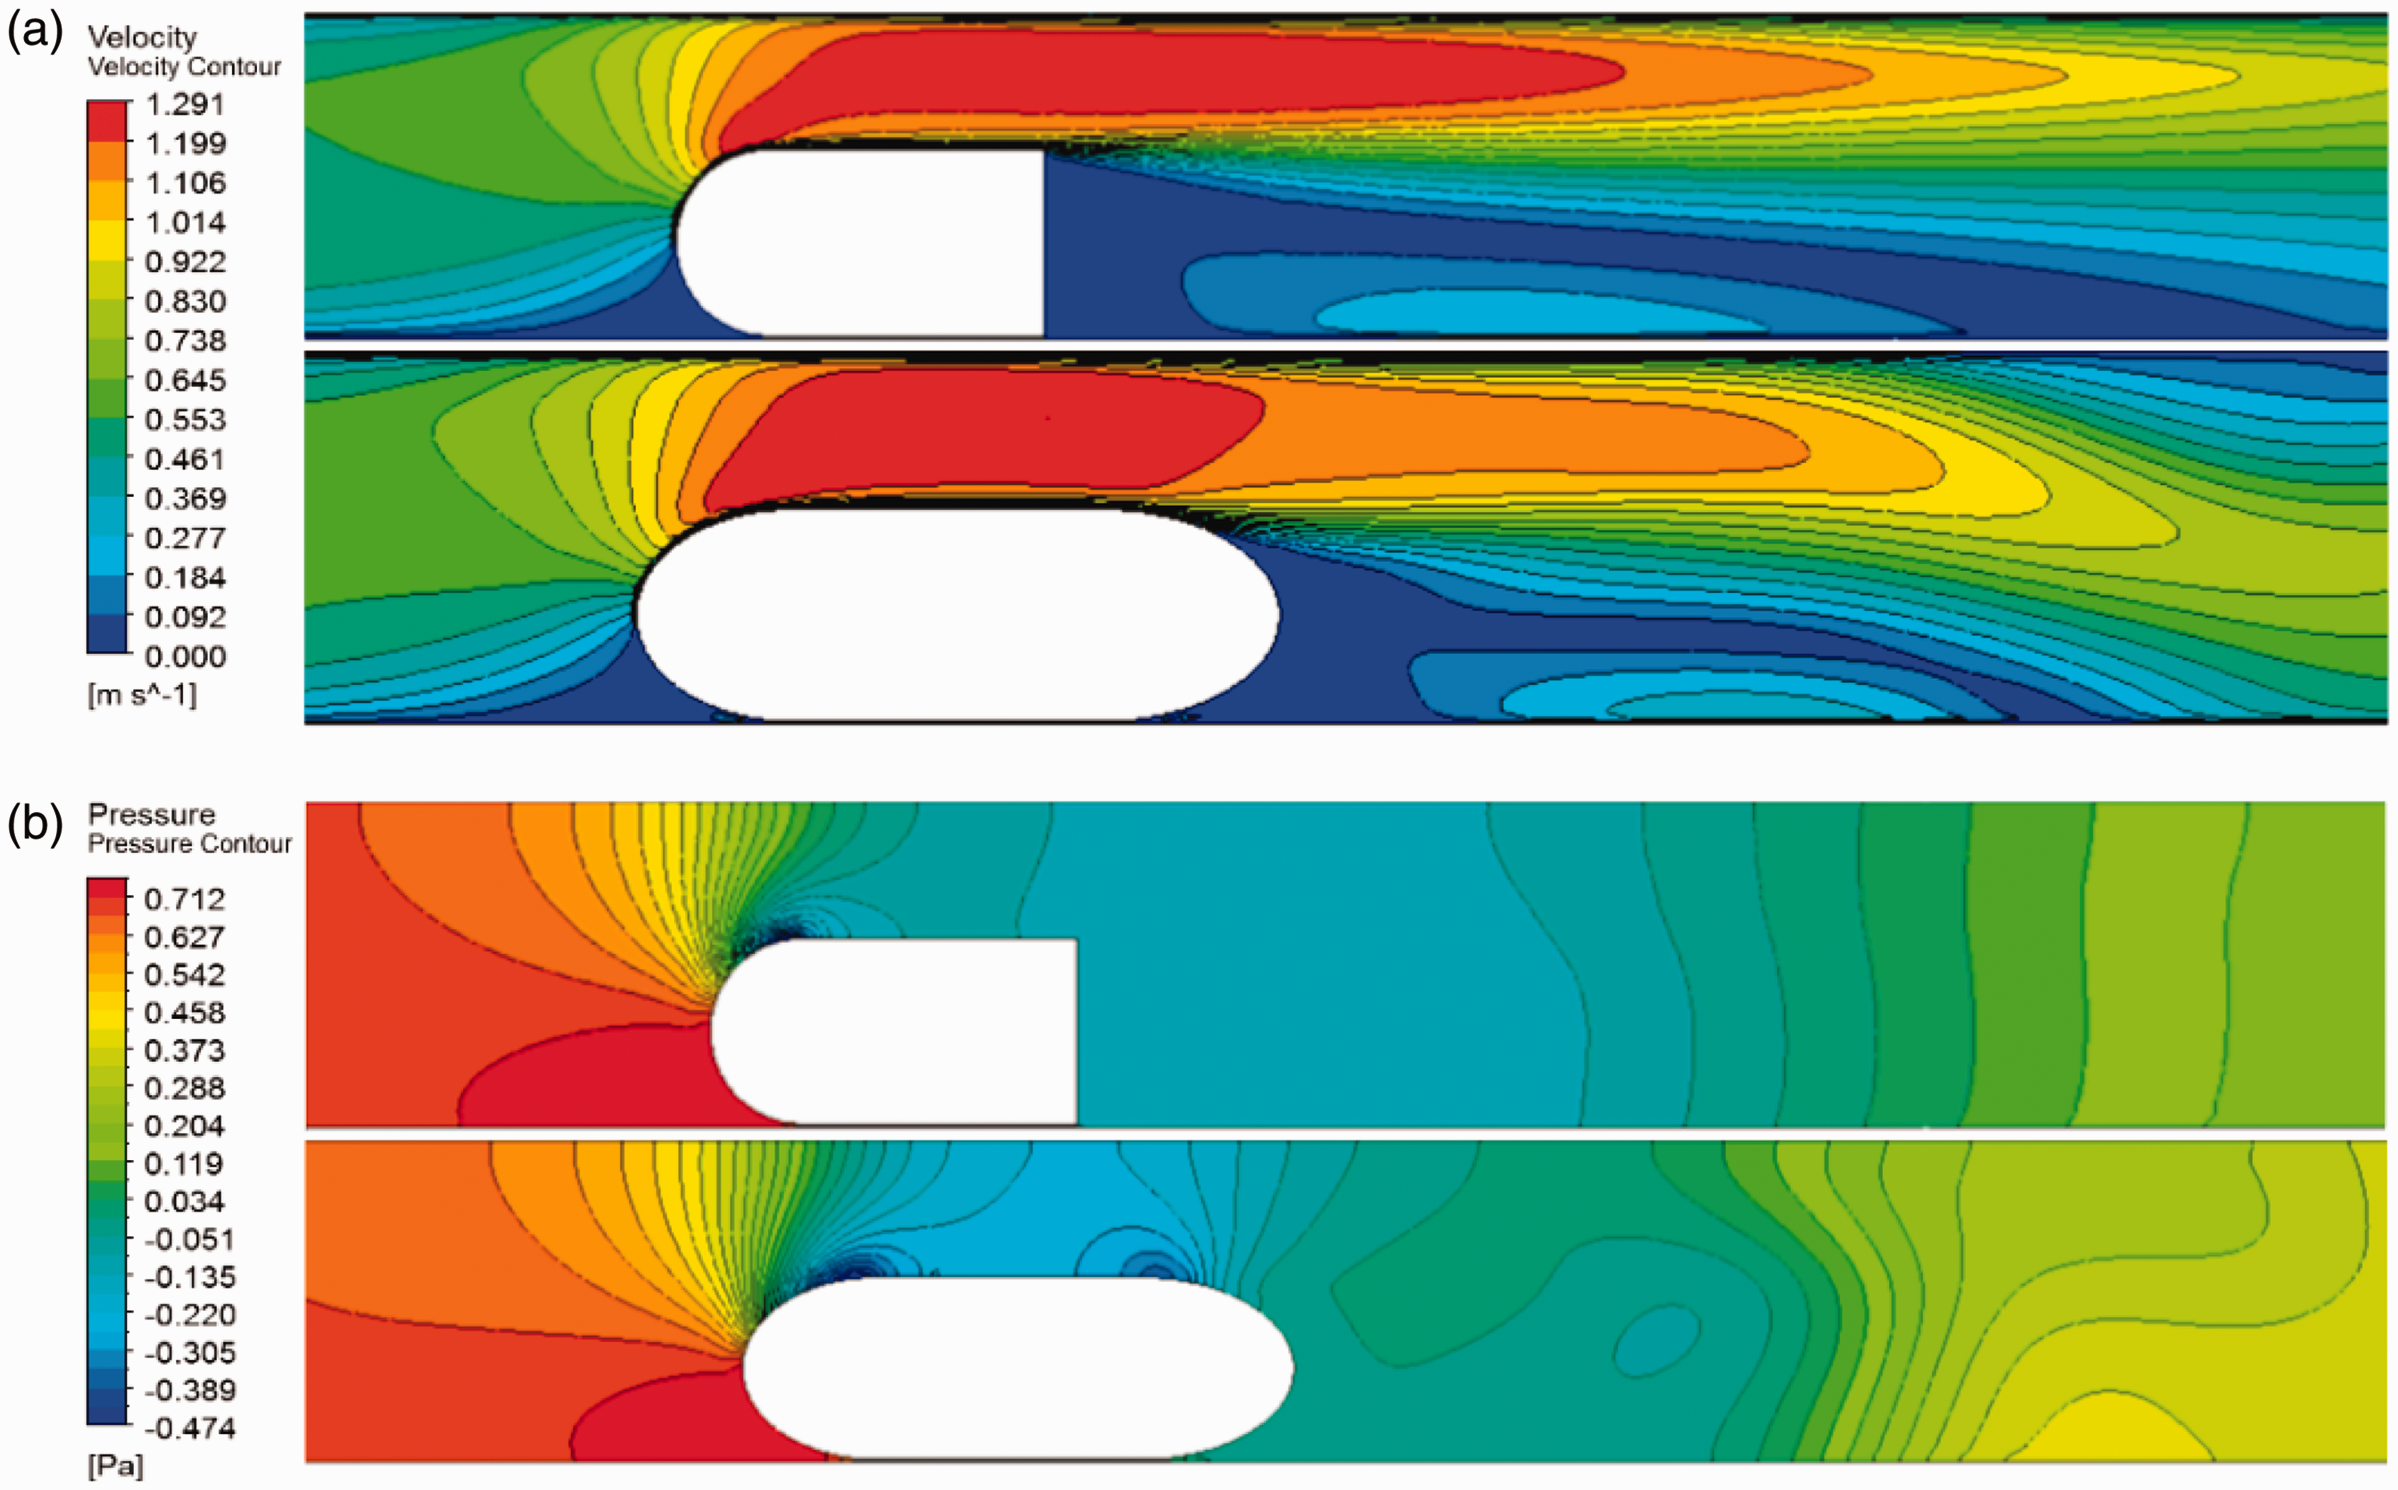
Capsule positioning
As the capsule cannot completely seal the inner diameter of the pipe, the body itself was presumed able to dip and rise. From Liu,22,23 four possible regimes were highlighted. Regime 1 concludes that a capsule with higher density than the fluid would rest on the bottom of the pipe (Figure 7(a)), whereas a buoyant capsule would rest against the top. Regime 2 suggests that as the fluid velocity increases in front of upstream surface, a lifting force would be induced (Figure 7(b)). Regime 3 then presumes that further growth of the flow velocity increases the pressure underside of the capsule and thus lifts it (Figure 7(c)). Finally, Regime 4 concludes that the fluid velocity is sufficient to lift the capsule entirely off the pipe wall becoming waterborne, and this allows pressure and velocity to act symmetrically around the capsules boundary (Figure 7(d)). With the concern being for the capsule body tilting upwards or downwards leading to equipment failure, damage or blockage within the pipeline each flow regime as discussed was simulated. Six typical scenarios were investigated, as seen from Figure 7. The purpose of this setup is to examine and compare each lift and drag coefficient acting on the capsules boundary in varying scenarios at a maximum fluid velocity of 0.4 m/s.
Velocities contours of various capsule positioning: (a) 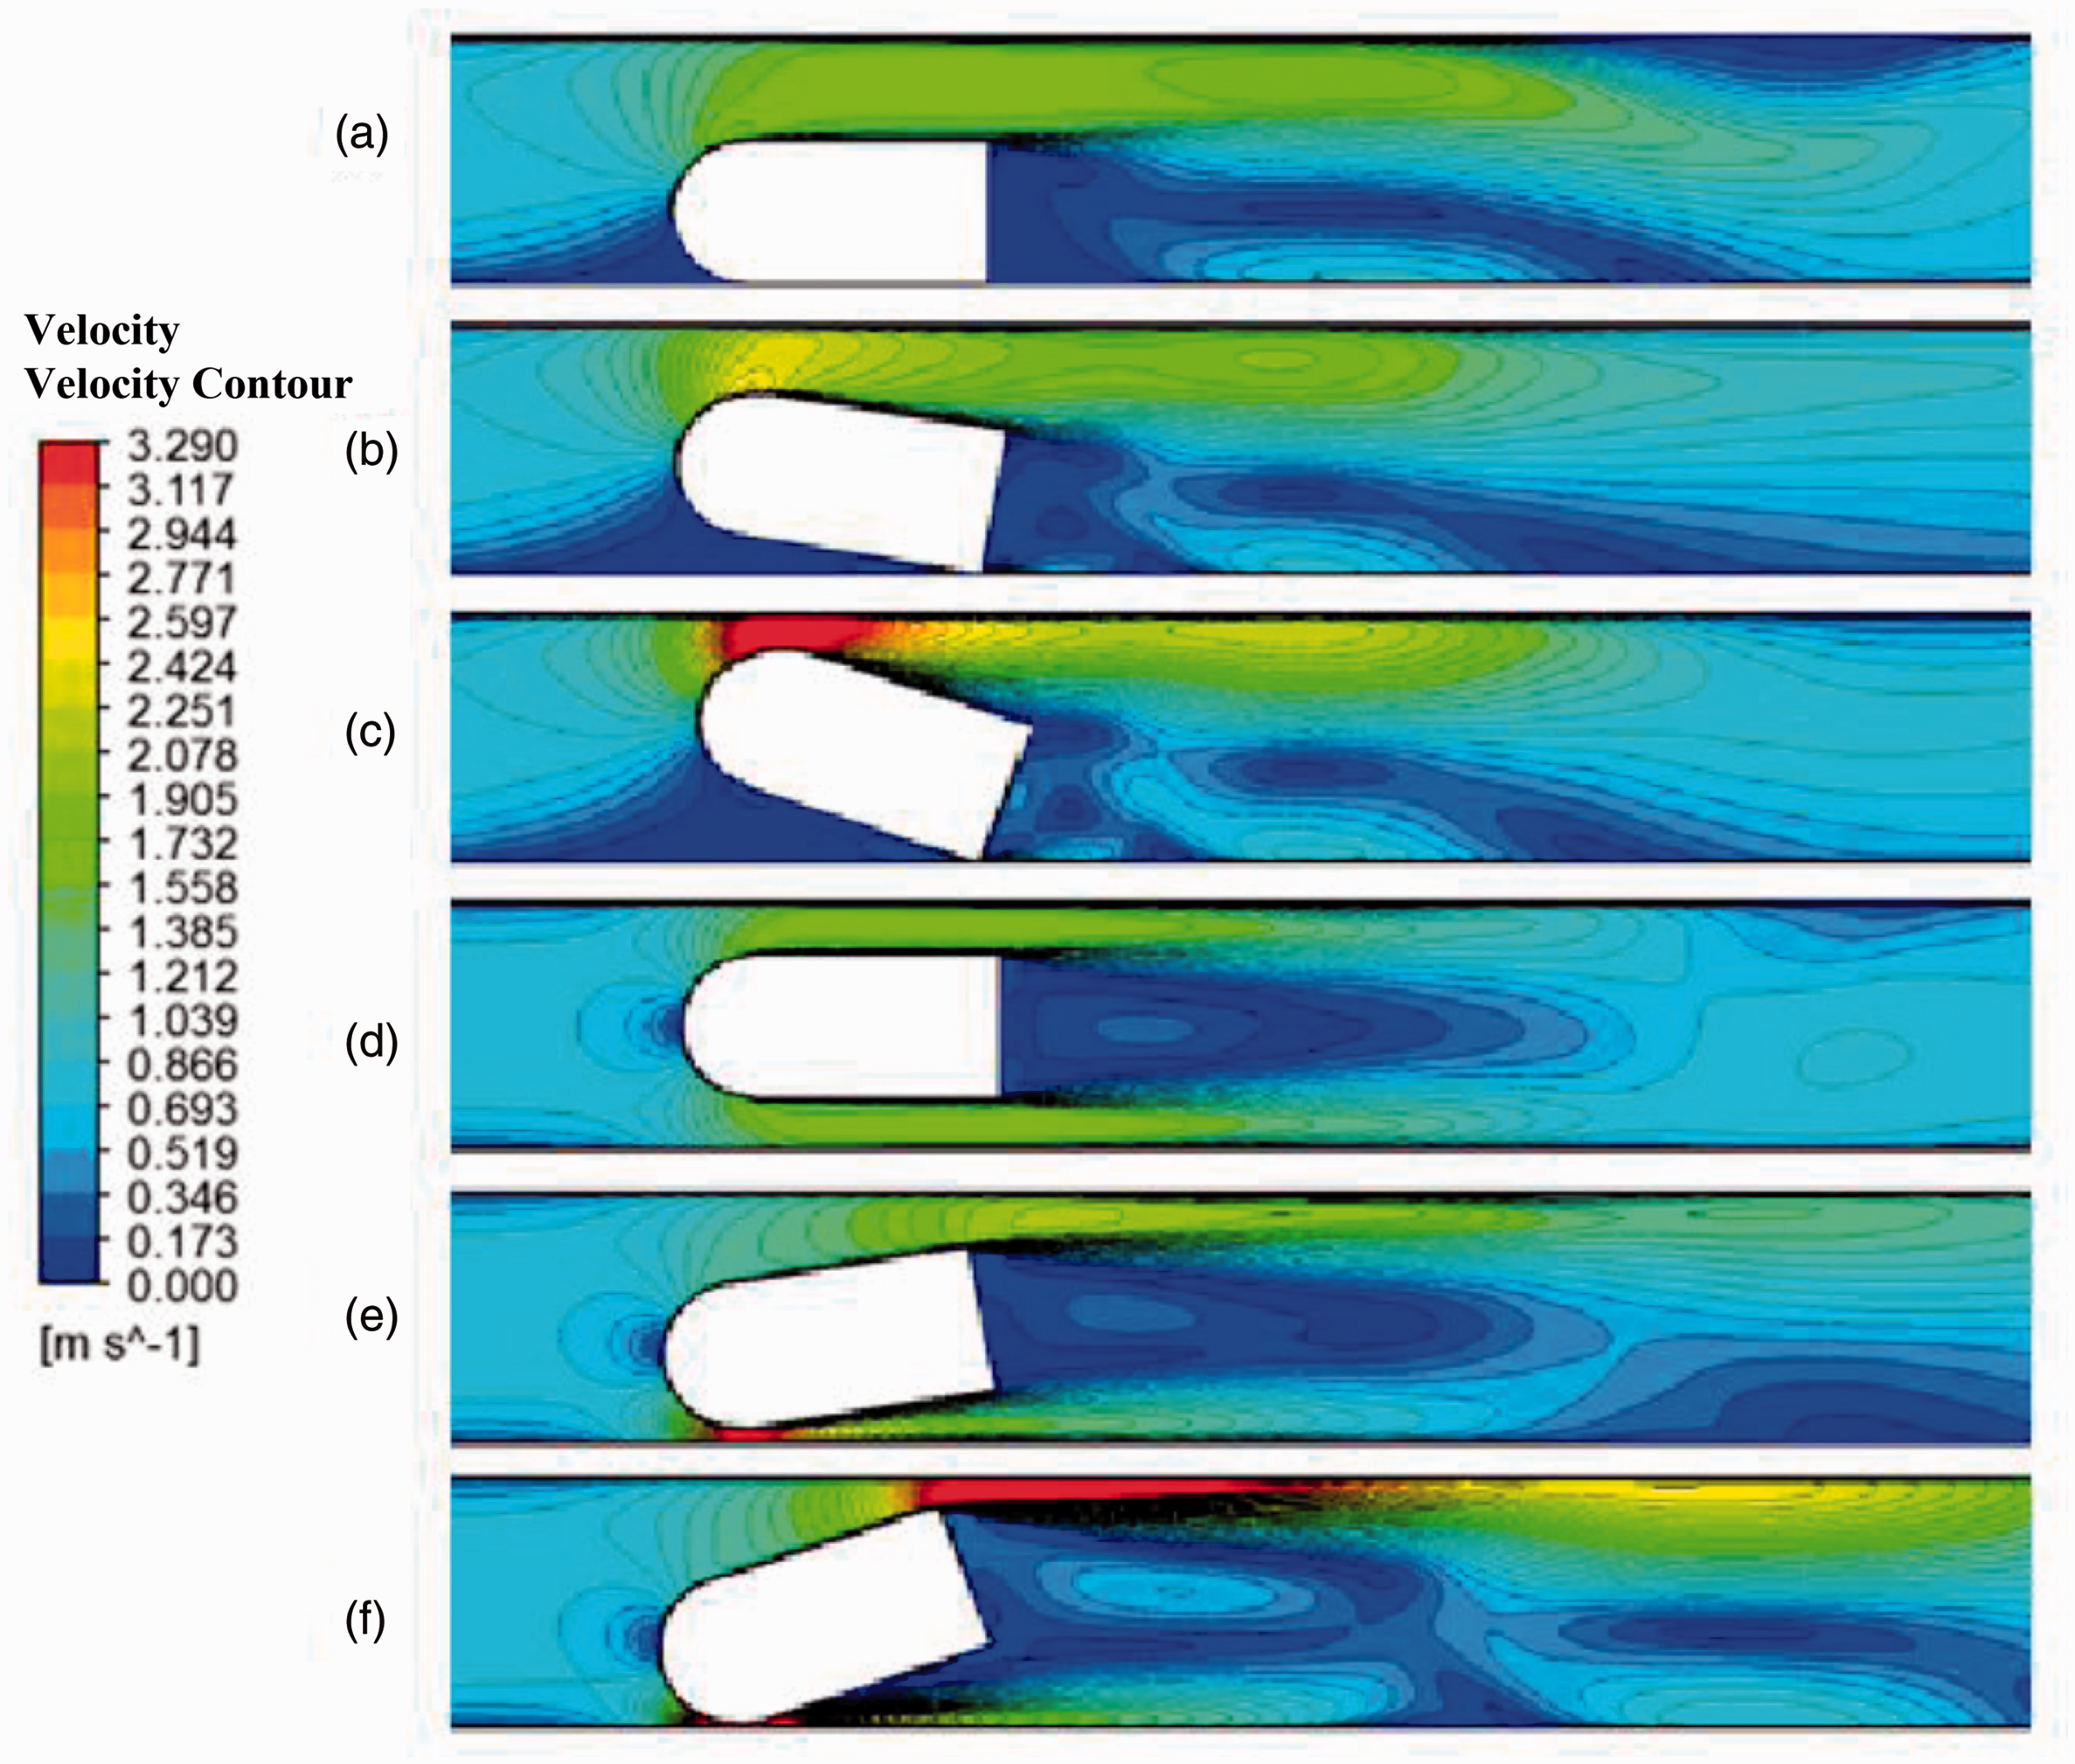
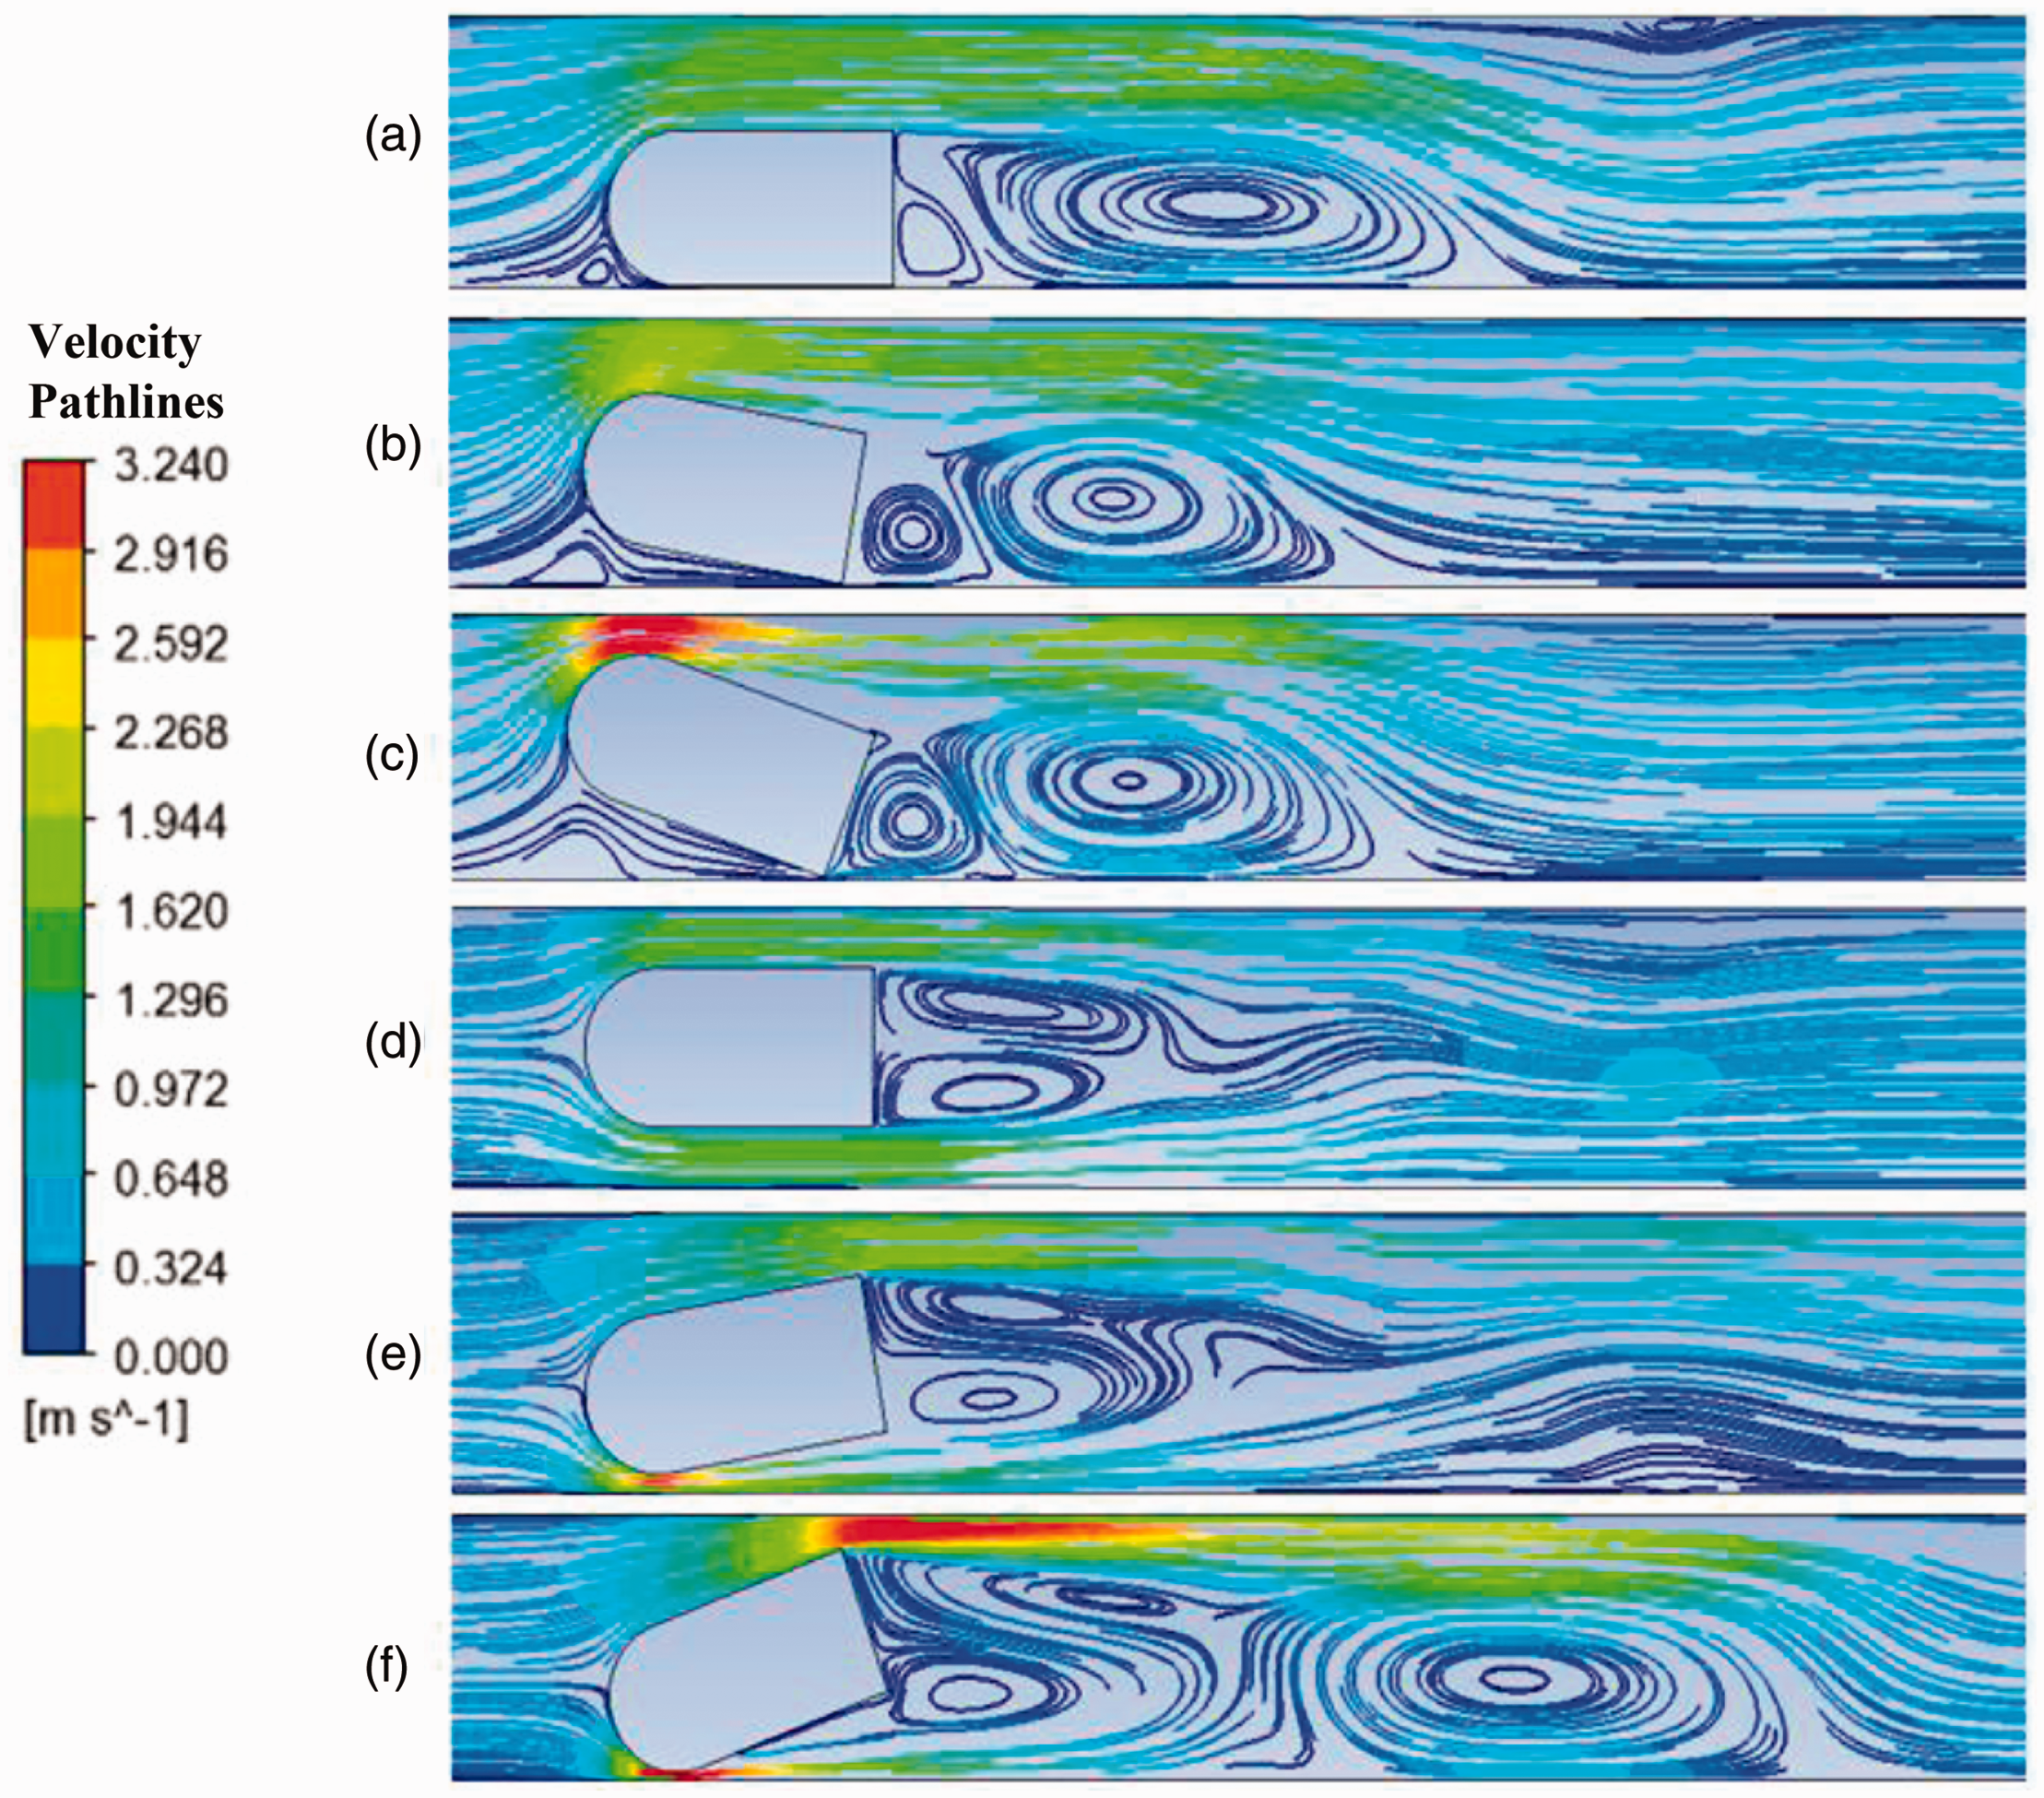
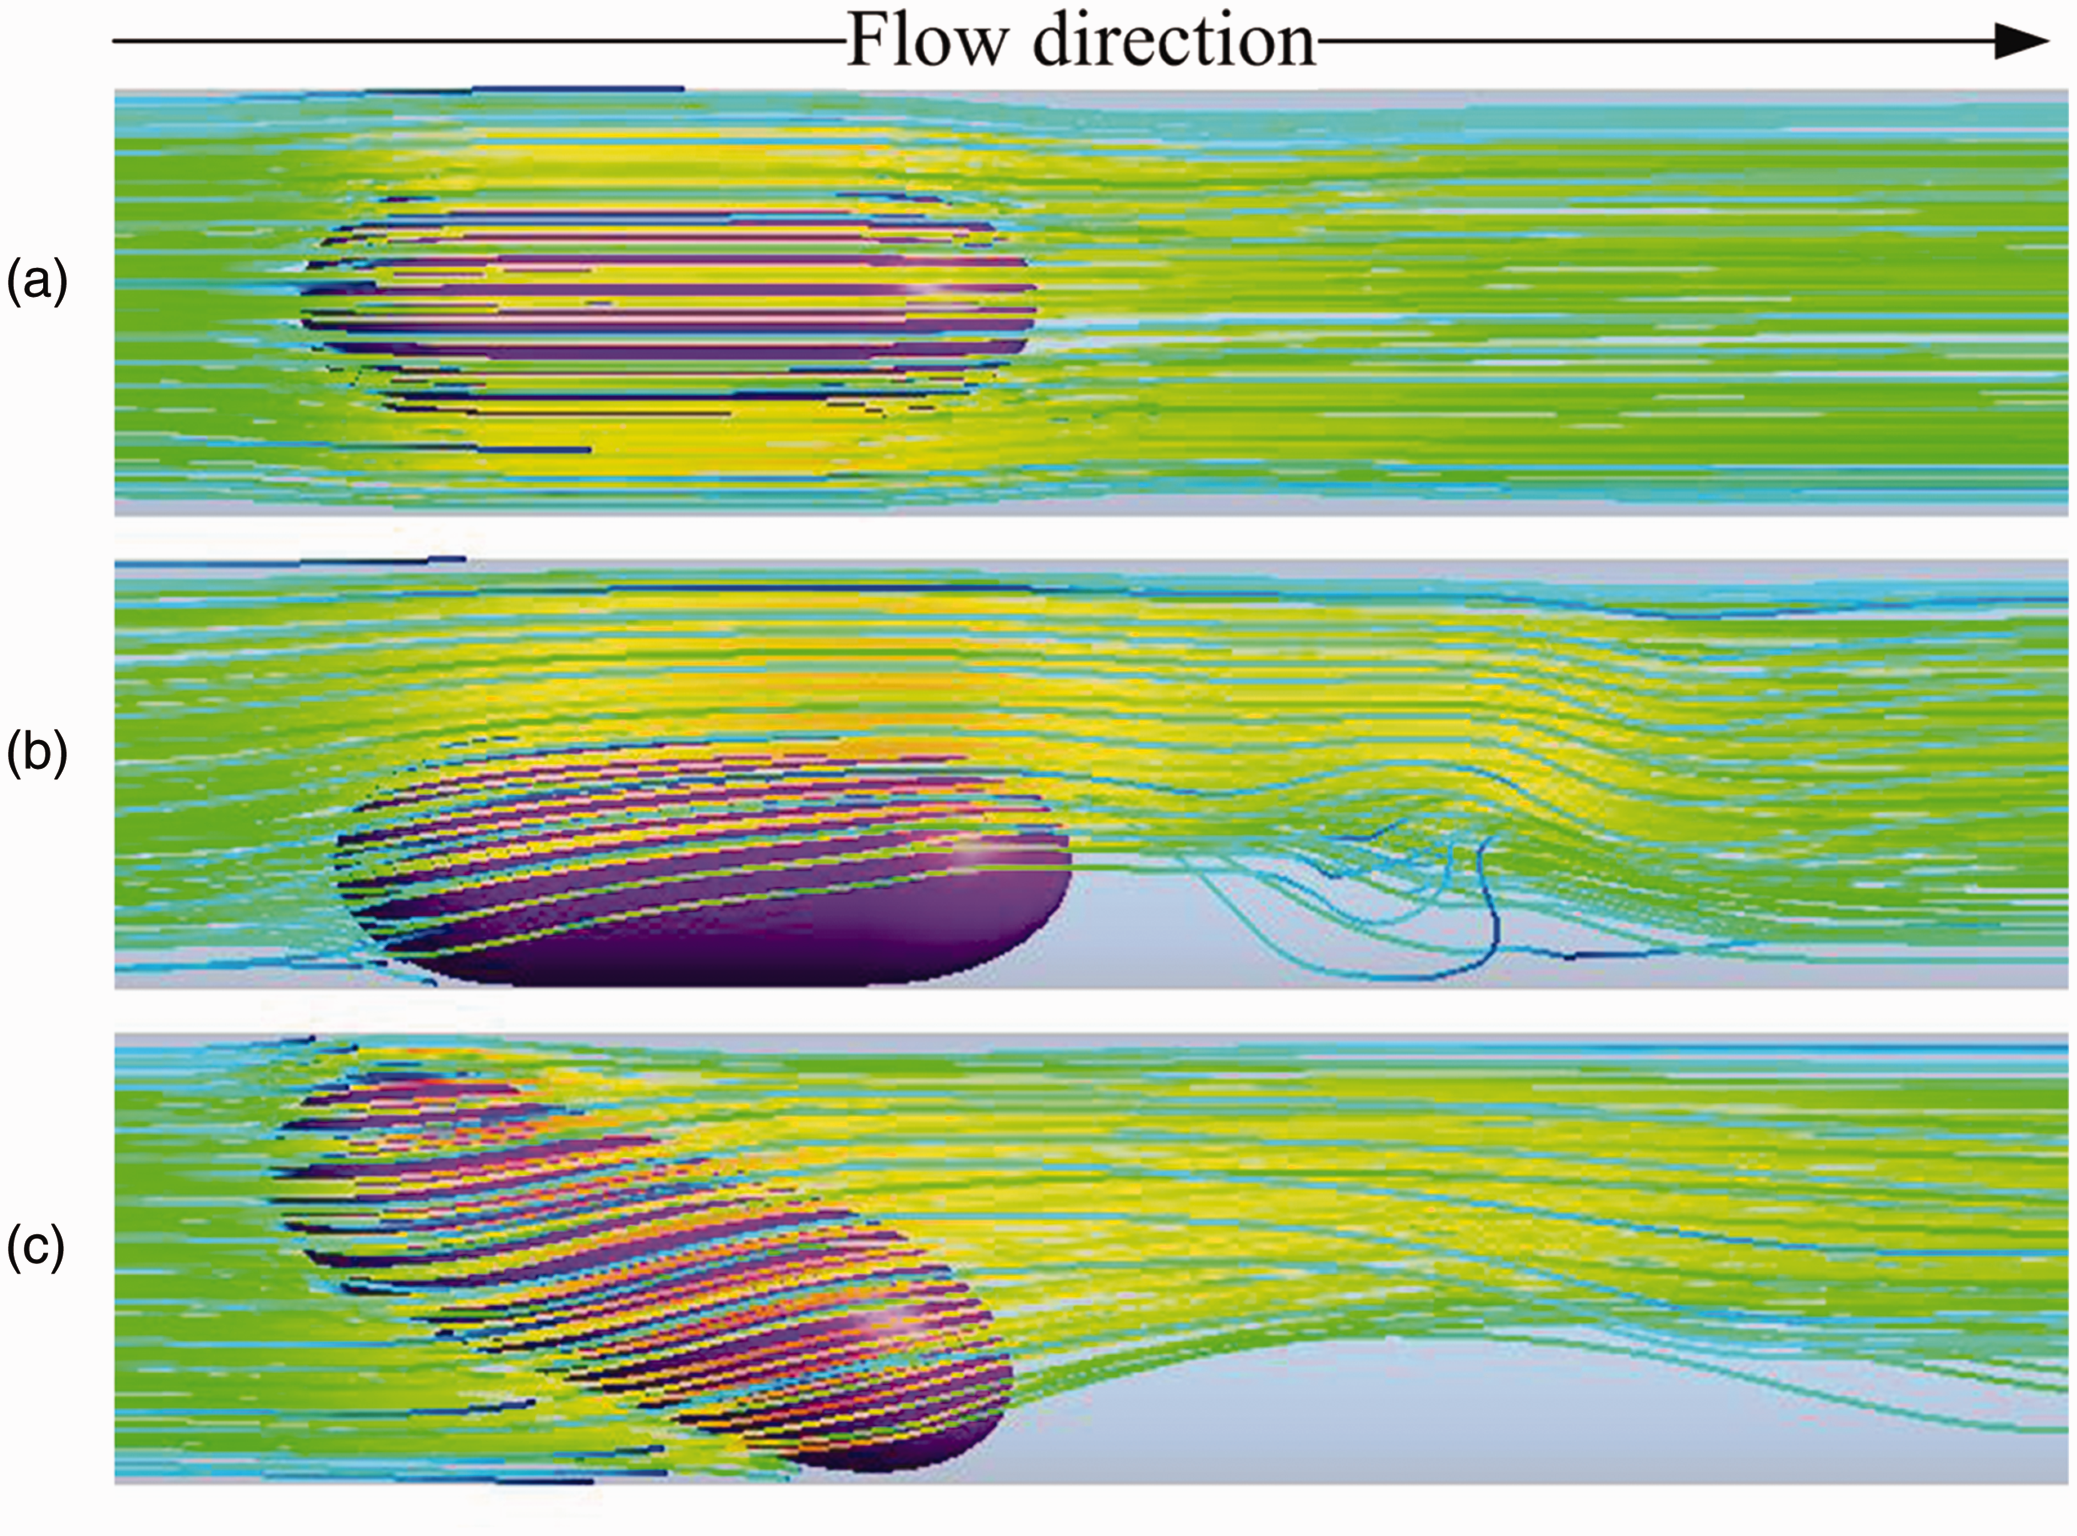
Further analysis simulating the initial capsule design was undertaken by assessing the pressure and streamlines acting over and around the capsule. Figure 8 shows the pressure distribution acting on the capsule, which can be compared with the results in Liu.22,23 Analysis suggests that increasing the capsules angle within the pipeline directly affects the pressure acting either underneath or over the top of the capsules body, which forces the capsule to tilt either upwards or downwards, depending on the regimes as discussed. As visualized from Figure 9, each model was seen to experience fluid vorticity as to be expected from the optimized investigations. The worst case, scenario (f), was seen to have the largest downstream turbulence and (c) the least.
Pressure contours of various capsule positioning: (a) Velocity pathlines of various capsule positioning: (a) 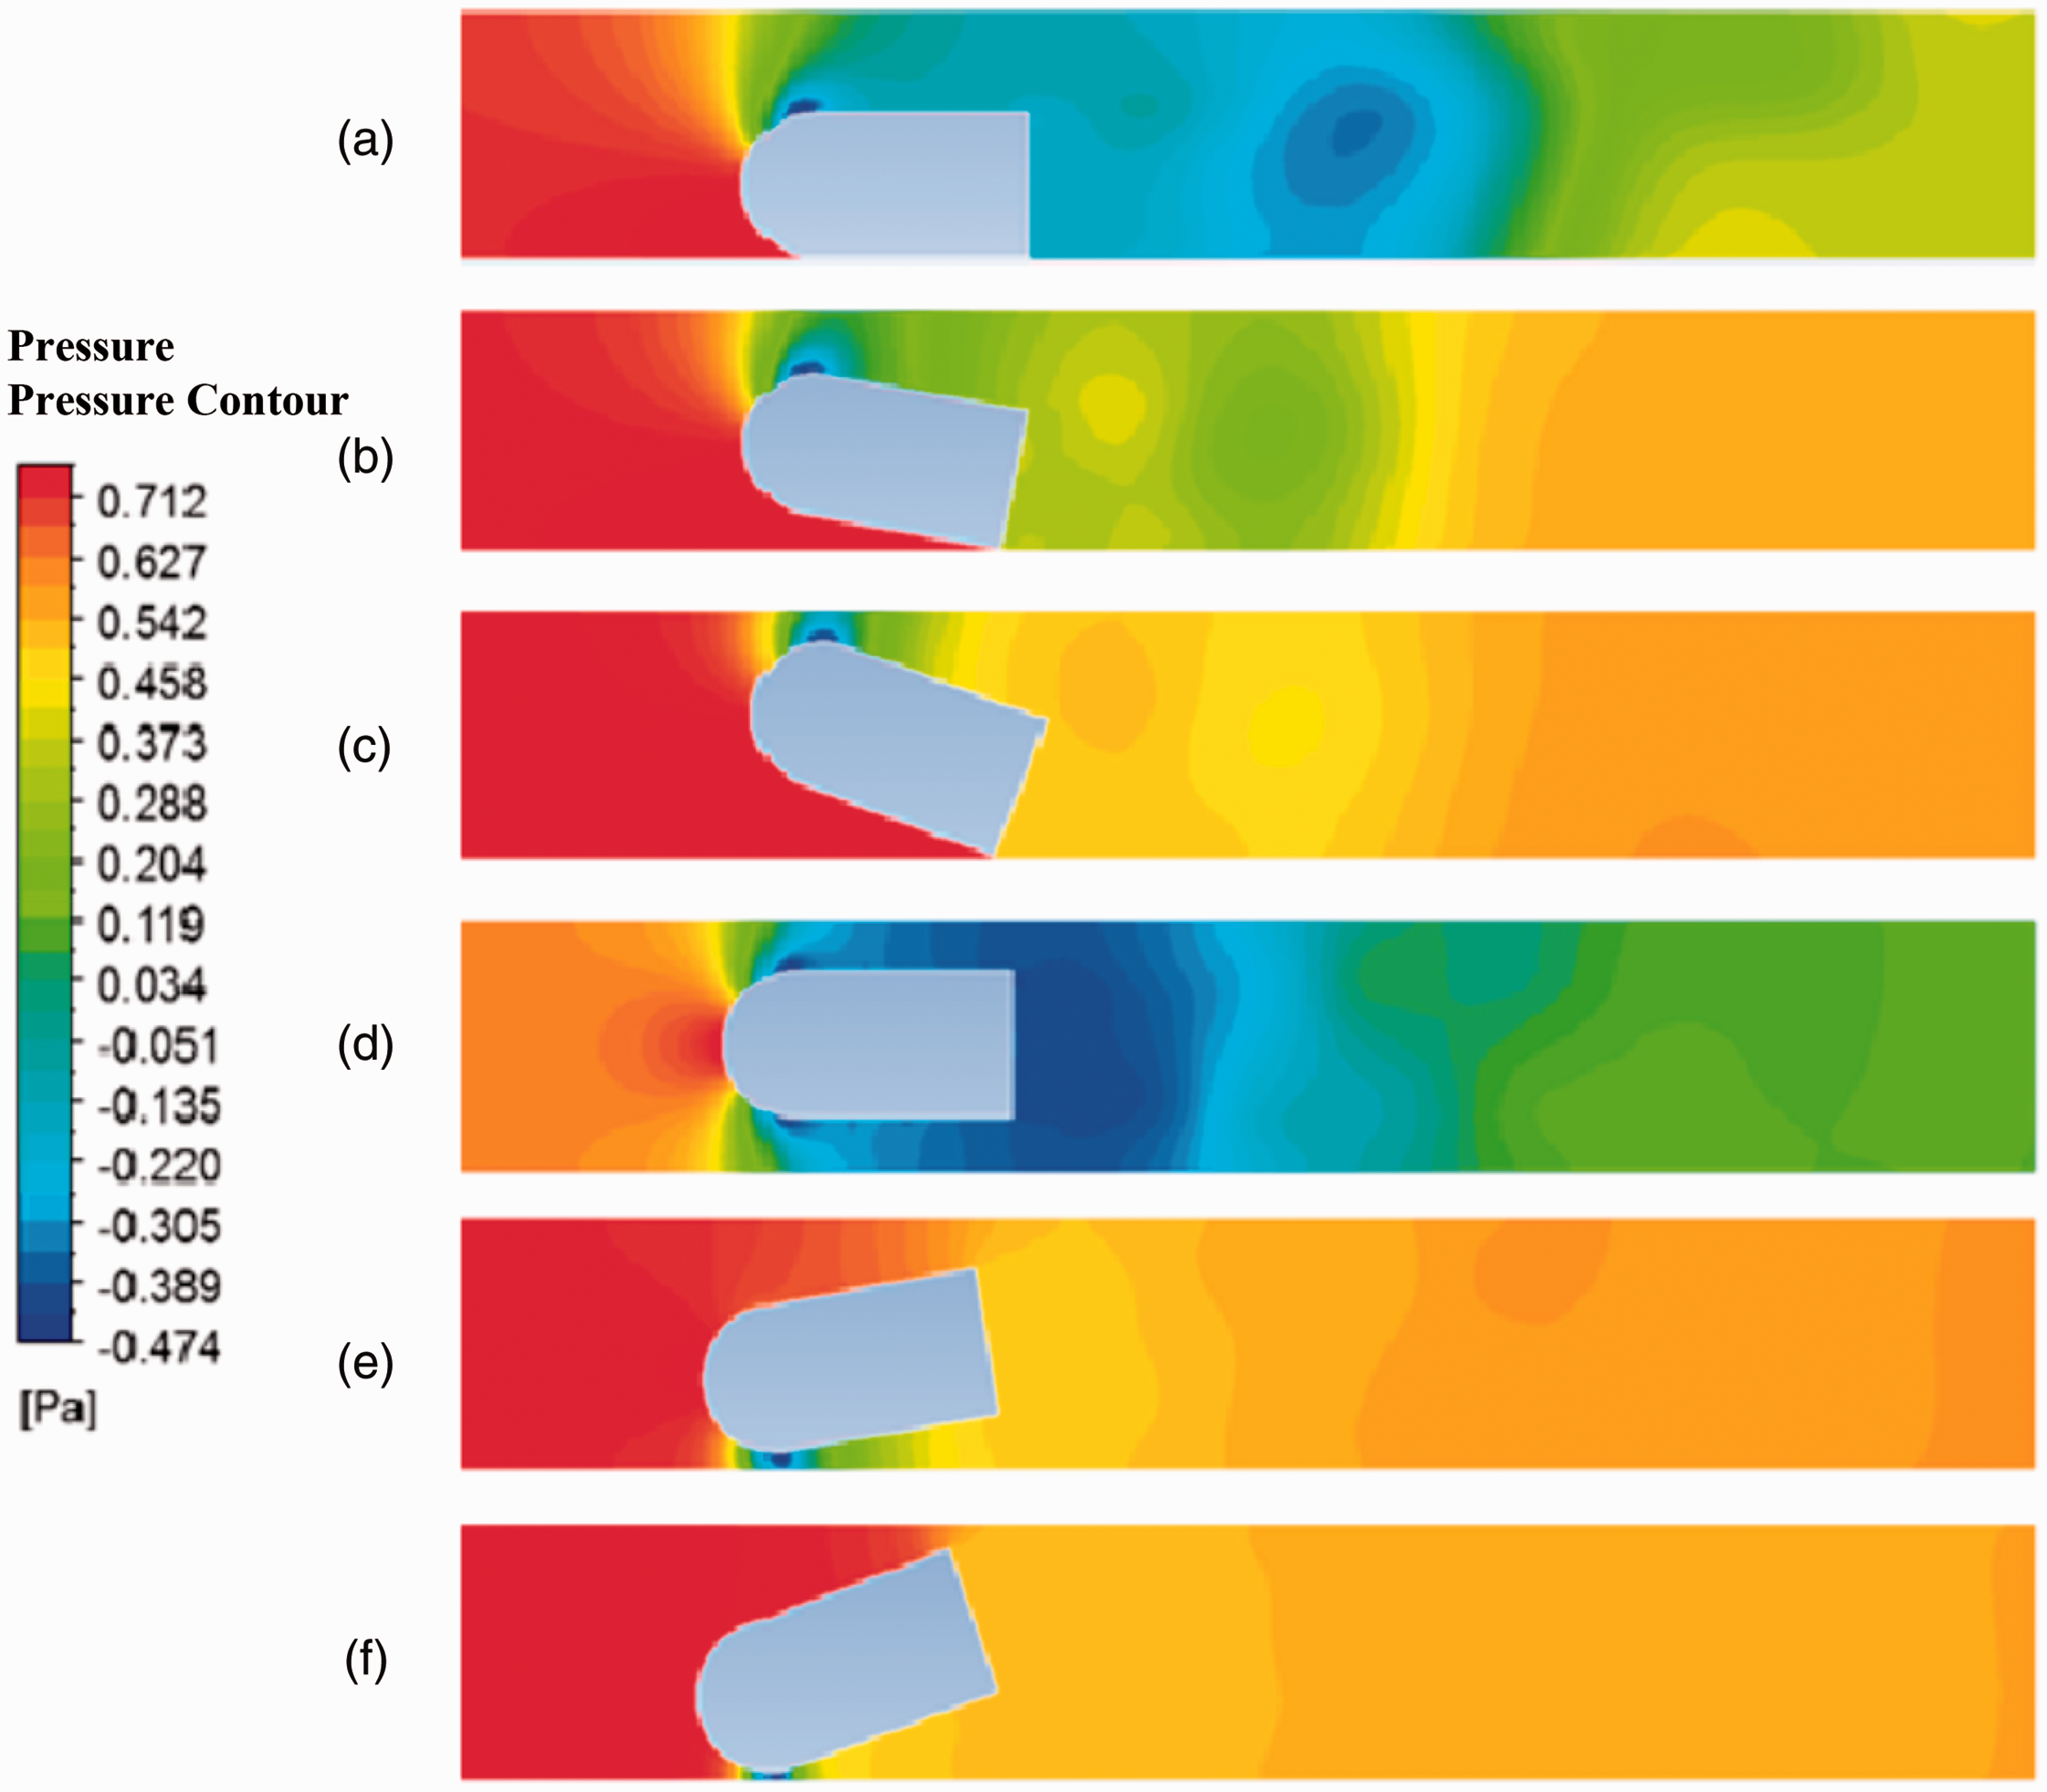
The results of the 2D analysis gave a clear conclusion as to which position the capsule would be best suited to. The optimum position allows the capsule to travel against flow with minimum fluid resistance and low drag coefficient. As seen from Figure 10, the maximum drag and lift coefficients were discovered for scenarios (c) and (f), and the results suggest that tilting the capsule in any manner up to 20° will negatively affect the forces acting on the capsules geometry. Further investigation discovered a significant reduction of 66.06% and 84.20% in the drag and lift coefficients, respectively, just from adjusting the scenario from (c) to (a). This positioning within the pipeline would minimize the resistance acting over the body.
Lift and drag coefficients corresponding to the scenarios (a–f) in Figure 7.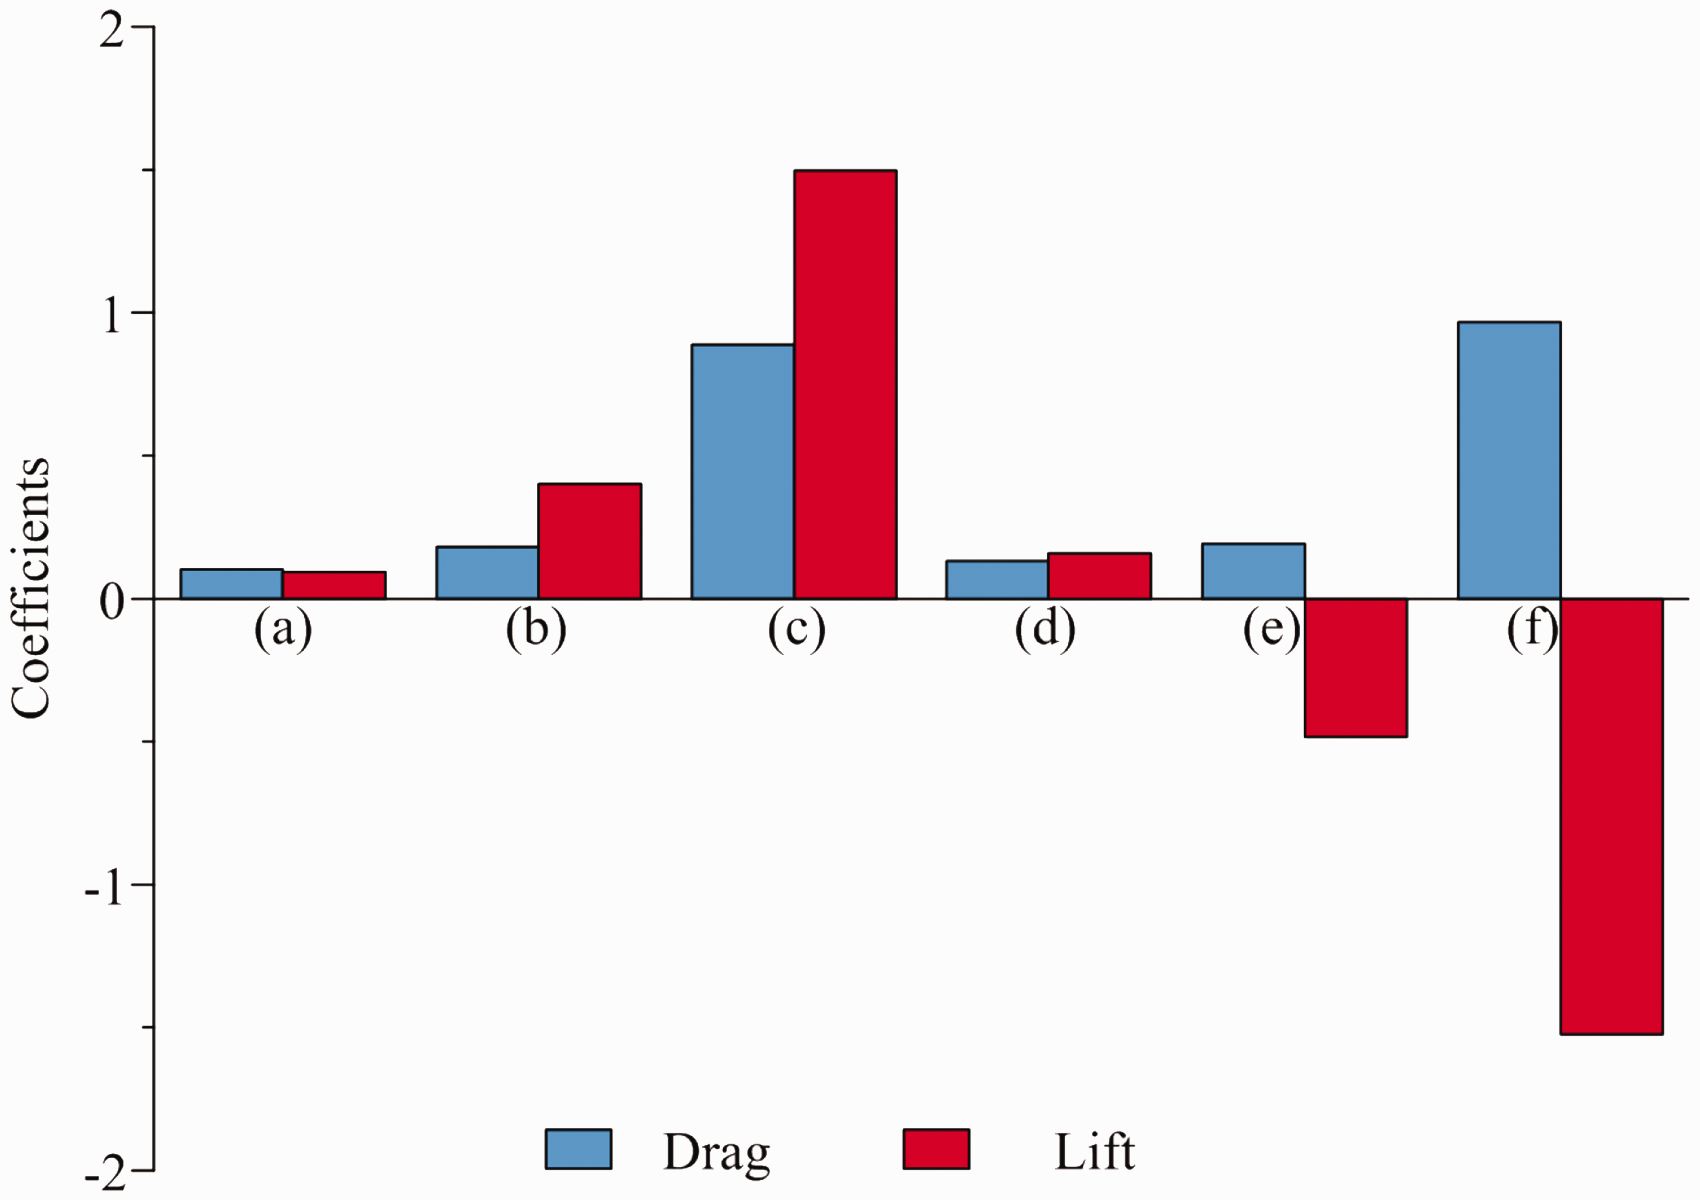
CFD – 3D analysis
3D Model development
Due to the simplification of simulating a three-dimensional (3D) model within a 2D representative geometry, the CFD could only provide results along a single centralised plane within the pipeline and thus can only provide limited information on the true flow behaviour. On the contrary, 3D simulations provide a snapshot of flow behaviour within the entire flow regime and thus be more useful in comparison with realistic experimental data. Therefore, 3D models were developed with two different capsule design geometries: the original and the optimized. The fluid domain was defined within a 3D representation of the pipeline given the same dimensions as with 2D simulations. Each of the 3D capsules were modelled in SolidWorks CAD software and imported into ANSYS Fluent.
3D Boundary conditions and meshing procedure
The boundary conditions adopted in the 2D simulation were also applied to the 3D model. Instead of selecting edges, however, the boundary conditions were applied through surface selection. The inlet and outlet faces were defined as such and the pipe wall and capsule surface were defined as walls with isothermal properties. The computational process still used the
Operational procedure
The ANSYS Fluent operational procedure for 3D CFD simulation follows the same steps employed in the 2D analysis. The turbulent
Comparison of CFD results
The 3D CFD results are displayed in Figures 11 and 12. In Figure 11(a), the pressure distribution data over the original and optimized capsule designs at the centralised position compare well with the 2D results. The maximum pressure region at the front of the capsule has been reduced by 2.58%, thus validating the assumptions made during the 2D optimization.
3D pressure contours of various capsule positioning: (a) Velocity streamlines of various capsule positioning: (a) 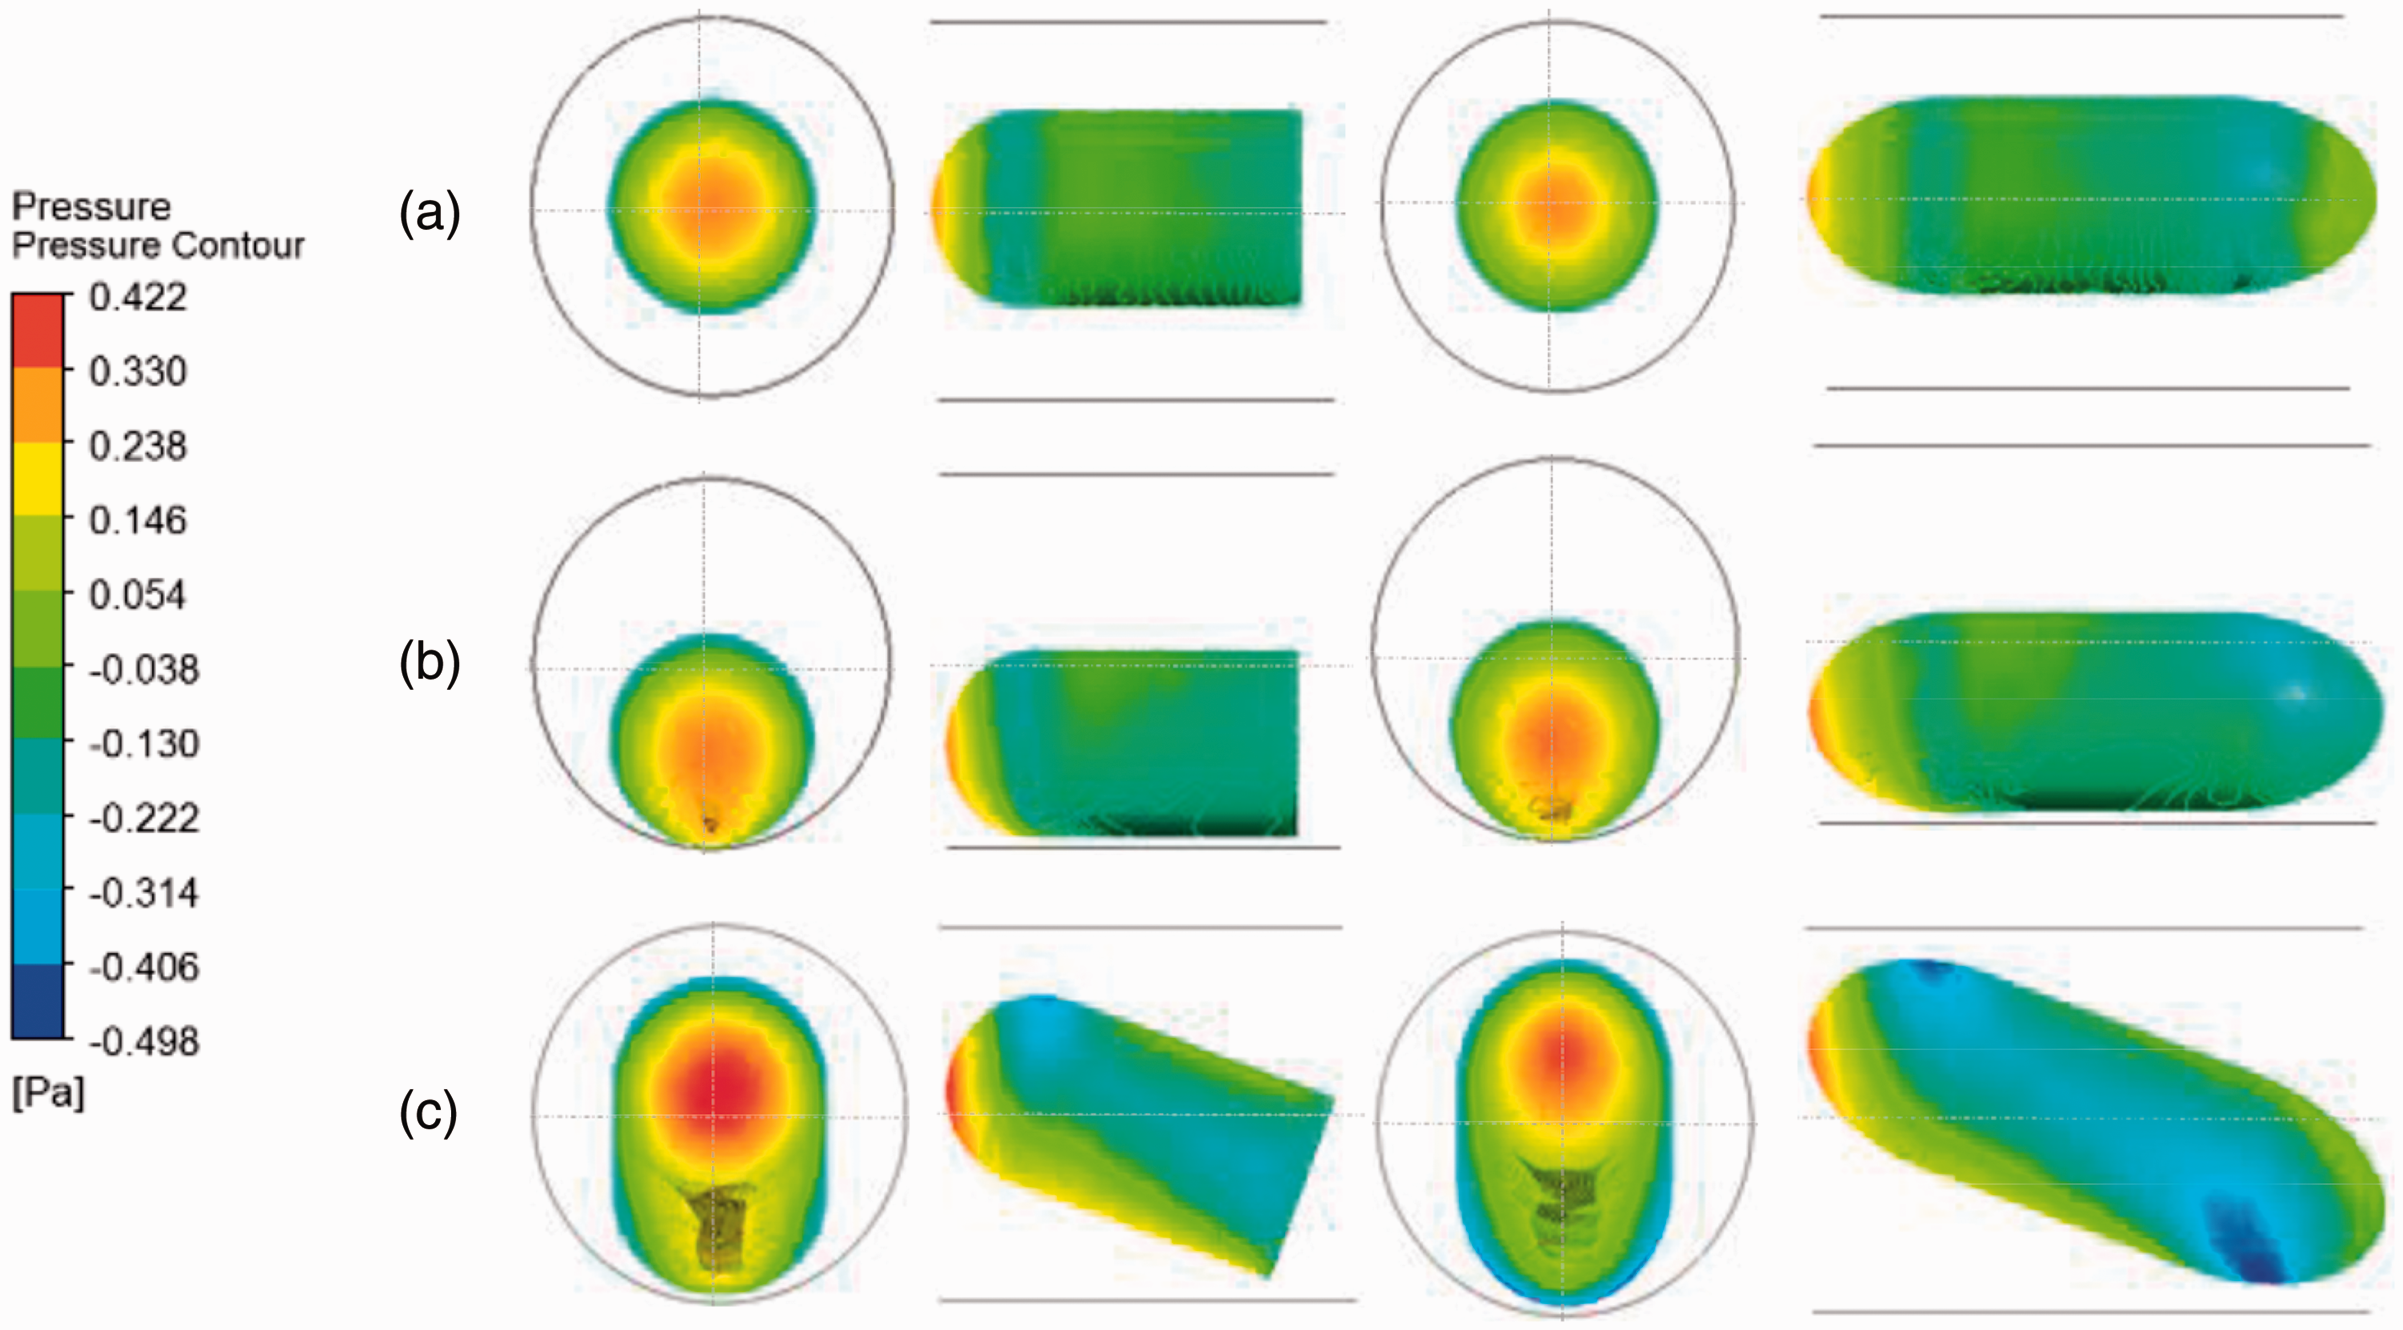
A similar observation is made when the capsules are located along the pipeline invert, giving a total pressure difference reduction of 1.78% (Figure 11(b)). The pressure results compare well to the 2D analysis but the flow behaviour around the capsule is now much more apparent. The streamlined capsule in Figure 12(b) allows the flow to pass around the capsule with far less resistance, thus lowering development of high- and low-pressure regions. Streamline data show that the optimized geometry contributes greatly to the reduction in both recirculation length and velocities, as well as the overall drag and lift forces.
Orientation simulations show significant performance decrease for both designs which mirrors earlier assumptions. At the worst case scenario (
Finally, overall performance of the capsule is weighted on the improvement of lift and drag coefficients. As shown in Figure 13, 3D simulations give the exact trend in terms of best and worst case scenarios when comparing with 2D analysis, and thus verify the analyses carried out in the previous discussion.
Lift and drag coefficients corresponding to the scenarios (a-f) in Figure 7, which were obtained by 3D CFD simulations. CFD: computational fluid dynamics.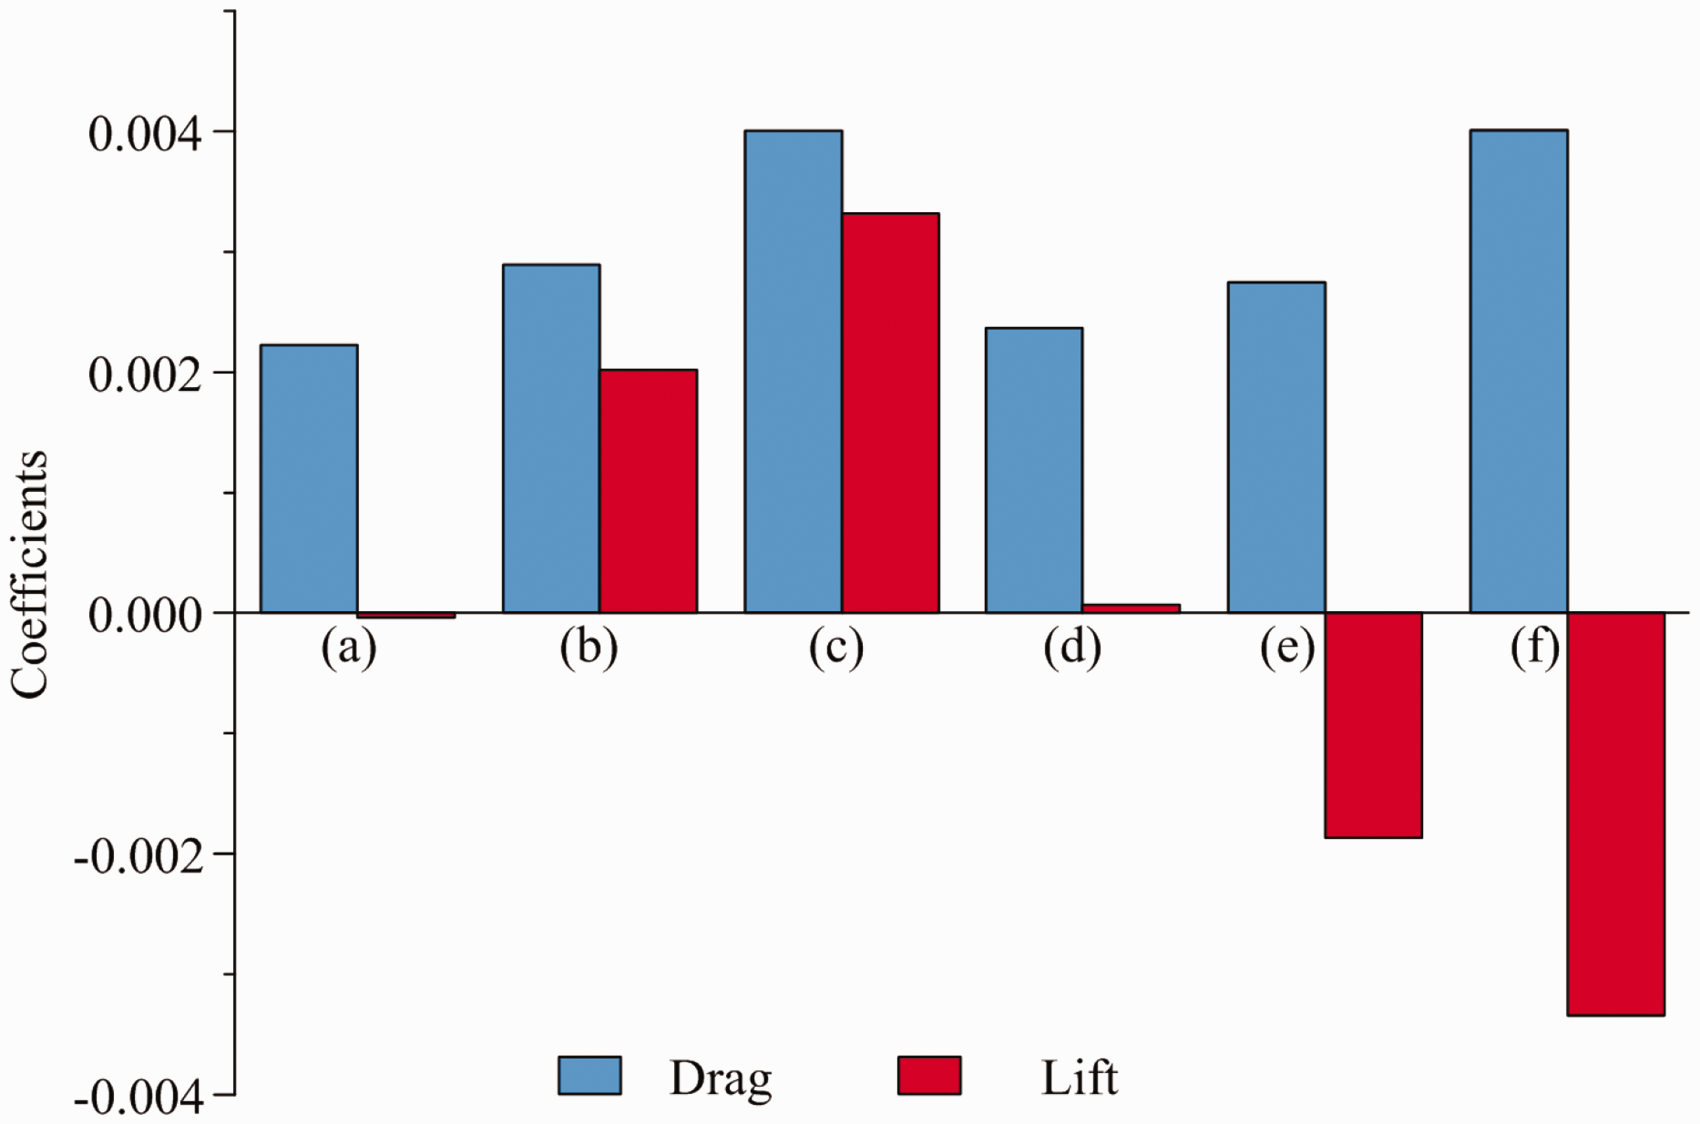
Wind tunnel validation
Beside the 3D CFD validation, wind tunnel testing of the pigging capsule prototype was carried out as well to validate the previous discussion. The results obtained from the tests give an indication of the aerodynamic forces that will be experienced by an object in its real environment, which is of significant importance in the design process. Validation of the 2D CFD model was based on the data trends and characteristics shown by the lift and drag coefficient results at an air speed of 10 m/s and angle of attack between 0 and 20°.
2D wind tunnel CFD setup
Both numerical and experimental analyses of the wind tunnel test were carried out simultaneously. Figure 14 illustrates the 2D flow regime developed for wind tunnel simulation of the original capsule design. The fluid was defined as the ANSYS pre-set material of air at 25 ℃. A similar simulation developed by Khalil et al.
8
recommended making the flow regime 16 times larger than the solid body in order to assure full development of inlet flow and turbulence downstream.
2D flow regime with respect to the wind tunnel test.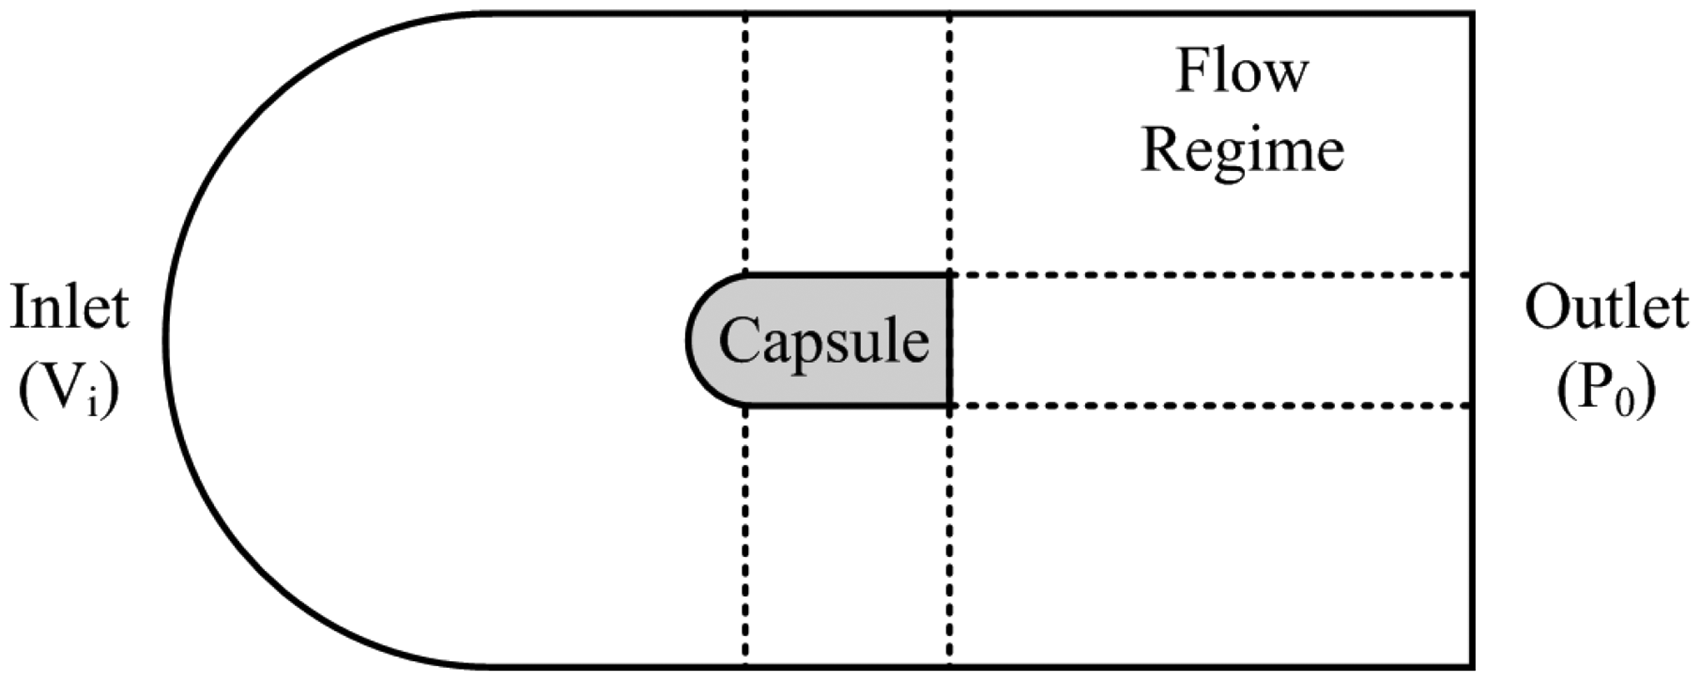
The flow regime was defined as a semi rectangular domain with a circular face at the inlet. The circular upstream face improves meshing quality around the curved face of the capsule and allows for alternate inlet directions to be applied without the need to manipulate the capsule orientation. The inlet velocity of 10 m/s was projected onto horizontal and vertical directions, thus be able to simulate different angles of attack for the capsule. With this simplification, the simulation setup time was greatly reduced and more simulations can be performed.
The meshing procedure used quadrilateral elements defined by edge sizing within the flow regime. Internal projection lines allowed for total control of element sizing and biasing over the entire domain. A biasing of 15 was applied around the capsule surface to allow for effective close wall turbulence calculations, similar to the 2D and 3D CFD models adopted above. The capsule head was meshed using a C-mesh configuration which evenly distributes element across the entire curved surface and maintains control over the element biasing. Mesh convergence testing showed that a mesh of 150,047 elements is enough.
The basic ANSYS CFD computational procedure applies as discussed above, including the turbulent
Wind tunnel experimental setup
A compact, subsonic, open-circuit suction wind tunnel shown in Figure 15(a) was used to experimentally verify the numerical results. A fan filled the large collection chamber with a fixed volume of air, which is ducted in such a way that a smooth flow exits through the 600 × 600 (a) Compact wind tunnel, (b) three-component balance and (c) capsule mounted in wind tunnel.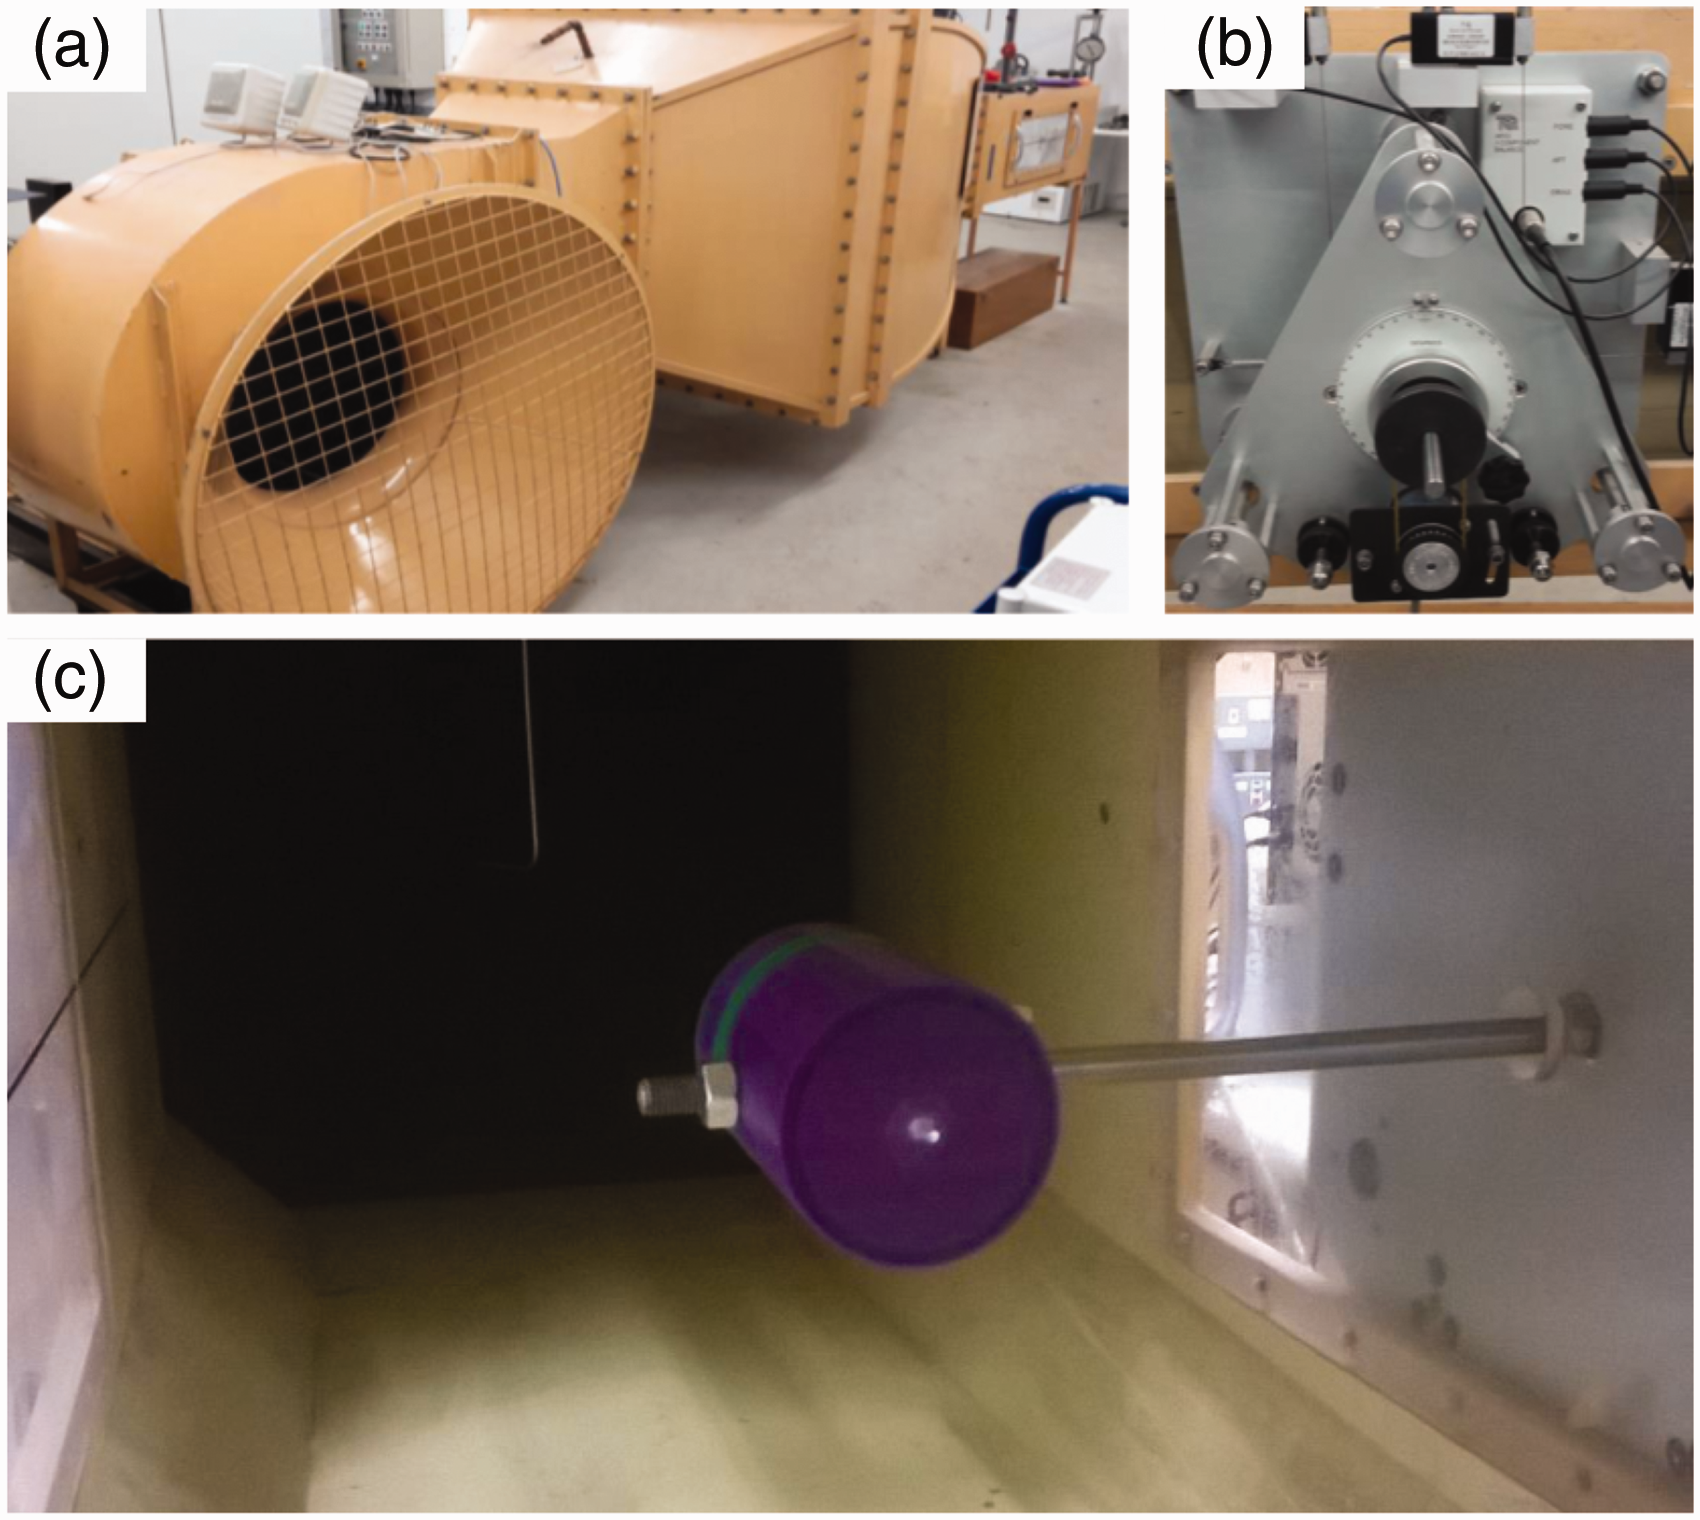
A three-component balance (see Figure 15(b)) which houses the bar with the specimen recorded drag, lift and pitching moments exerted on the object. The balance consisted of a mounting plate attached to the side of the outlet, and a triangular force plate that is constrained to moving in a plane parallel to it. It was free to rotate about a horizontal axis and records forces that are transmitted to strain gauged load cells through cables. The data were logged on a computer via TecQuipment’s Versatile Data Acquisition System. The software also allowed real-time data capture which could calculate, display and chart all relevant parameters.
For the purpose of wind tunnel testing, a new capsule body was 3D printed with a 12 mm bar through its center of mass. The capsule was fixed to the bar by a collar at one end and a nut tightened onto a threaded end of the rod. The specimen was introduced to the tunnel through a removable window on the left side, and secured in place in the 0° position. Figure 15(c) shows the capsule mounted on the bar in the outlet.
CFD and experimental results
For each test run, 10 lift and drag force readings were taken at 1 s intervals, producing a mean numerical result for each angle of attack. The forces were then transposed into coefficients using
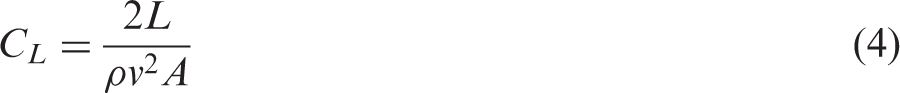
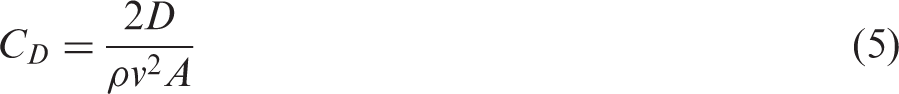
The coefficient results in Figure 16 highlight the reduction in lift and drag coefficients of the original and optimized capsule designs. The mean lift coefficient reduction stood at 19.9%, while the drag reduction was 25.2%. It is particularly visible in the experimental results that the lift coefficient of the optimized design reduces with increasing angle before they begin to rise at 15°, as opposed to 10° with the original design. This U-shaped curve is commonly witnessed with lift coefficient curves, usually a direct resultant of separation of flow.
26
Comparison of (a) lift and (b) drag coefficient obtained by 2D CFD analyses and wind tunnel test. CFD: computational fluid dynamics.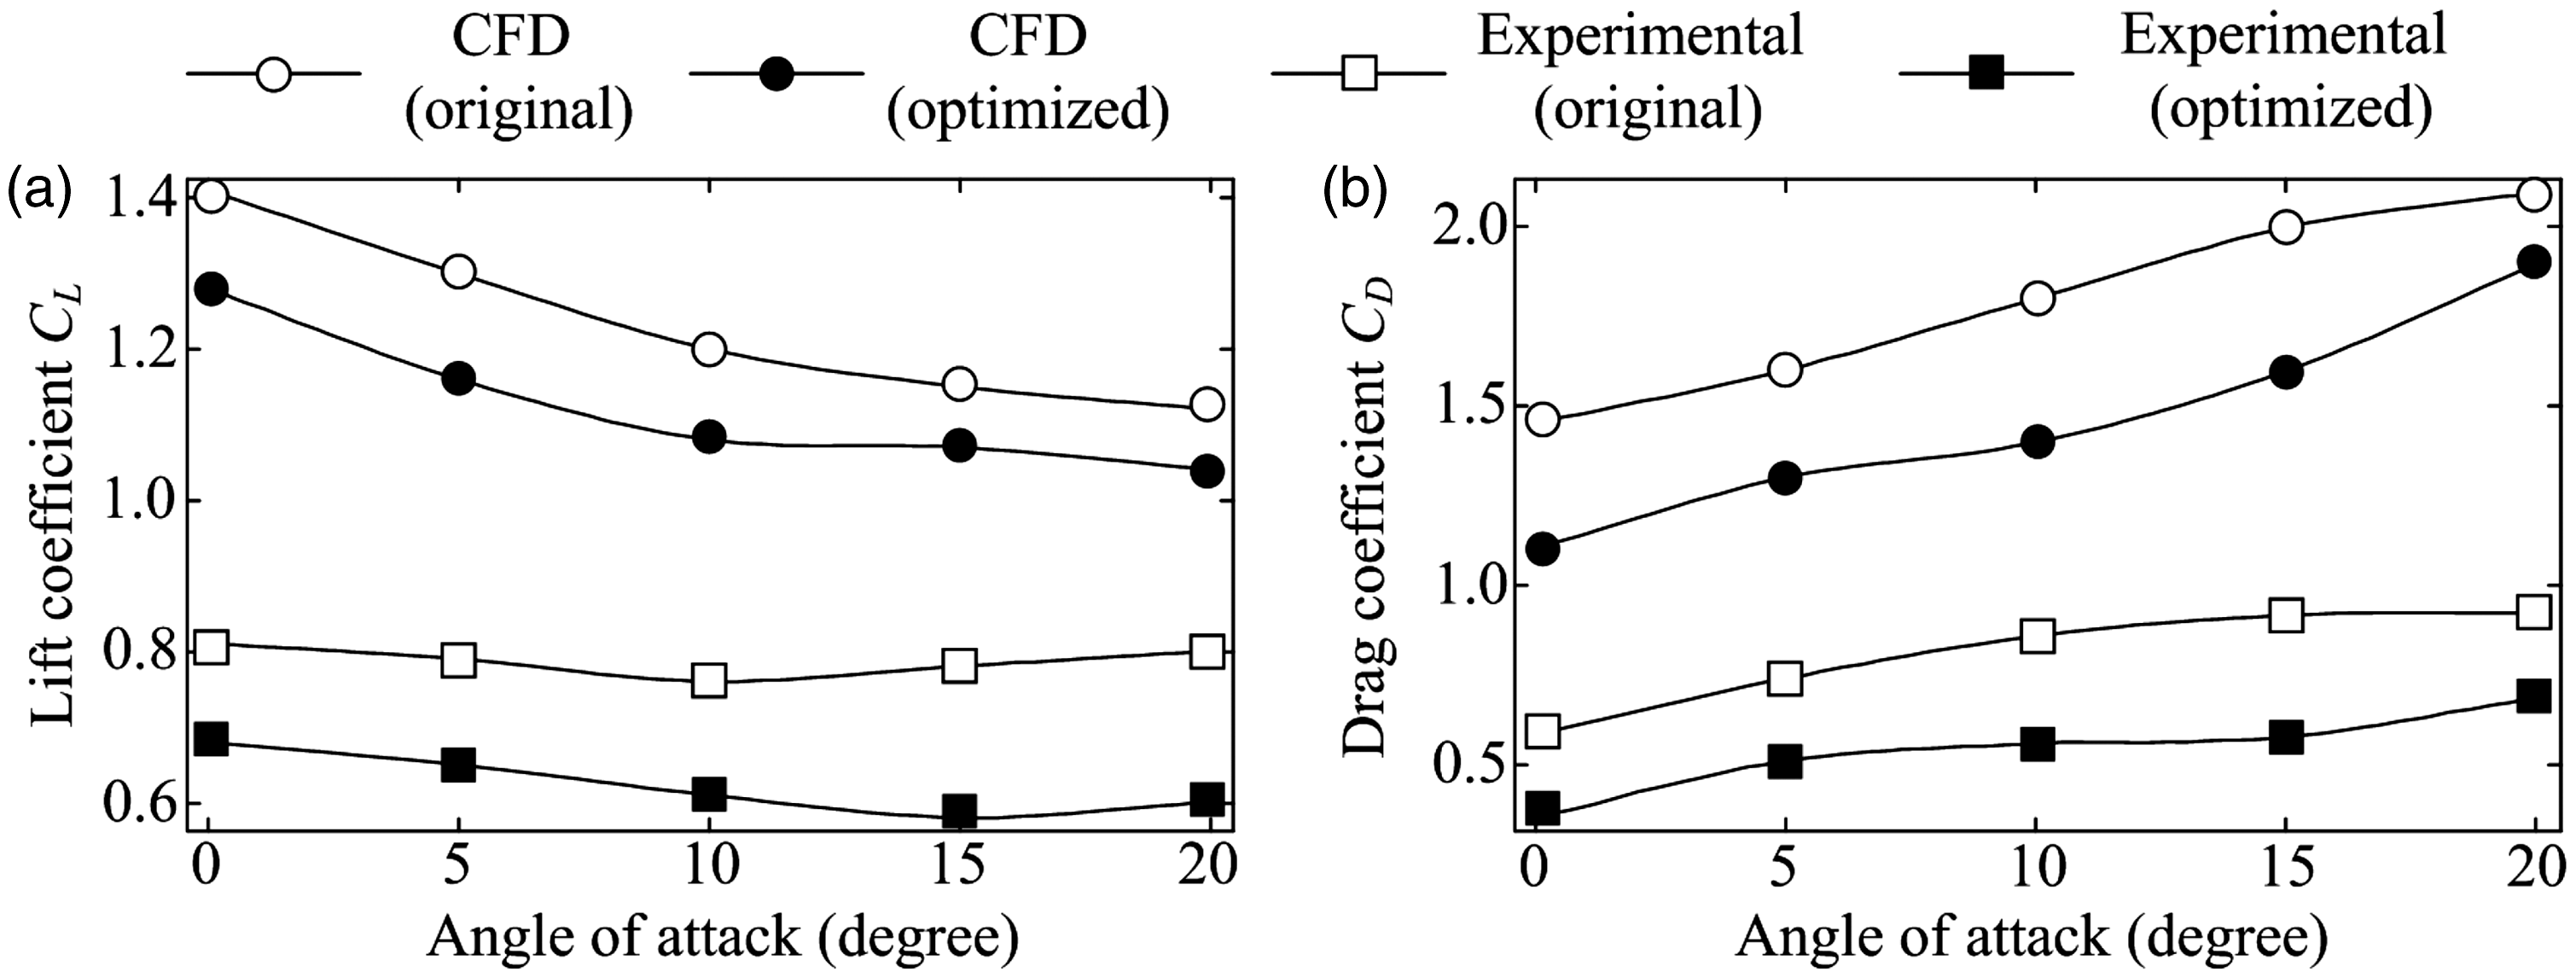
Comparison between the two sets of results shows good trend correlation with similar relationships being identified for both lift and drag coefficients. The basic shape of the lines obtained numerically and experimentally in Figure 16 is very similar, thus validating that CFD is able to accurately predict the effect of capsule positioning on the lift and drag coefficients.
Development of the capsule and the test rig
Capsule design
Based on the experimental study presented by Liu et al., 16 a prototype capsule has been developed to investigate the potential of the vibro-impact system used for pipeline inspection. The vibro-impact oscillator shown in Figure 23(a) provides the driving force for the capsule utilising a solenoid, with the moving rod impacting against a steel support spring. The solenoid body is bolted directly into the bottom of the capsule body, while the support spring is mounted to the capsule body via an adjustable height clamp. Adjustment of the clamp position varies the effective spring stiffness and thus alters the capsule dynamics.
The actuator is a 10 mm throw Push-type solenoid produced by Adafruit. 27 It has an operational range of 9–24 V and a coil resistance of 43 Ω. Control of the solenoid is handled using the open-source prototyping platform Arduino for actuation pulses. In the current prototype, the solenoid is housed in the capsule, while the control system is all located externally and connected to the capsule with power cables, which allows the capsule to be compact and lightweight, although it will be preferable for future prototypes to be wireless.
As shown in Figure 17, the original capsule body has been designed as a basic cylinder shape with a diameter of 80 mm and with one hemispherical end. This replaceable end is threaded onto the cylindrical section securing the two parts of this section together. Through CFD simulation, the optimized design was developed to use more streamlined end caps on the capsule.
Capsule and replaceable end caps.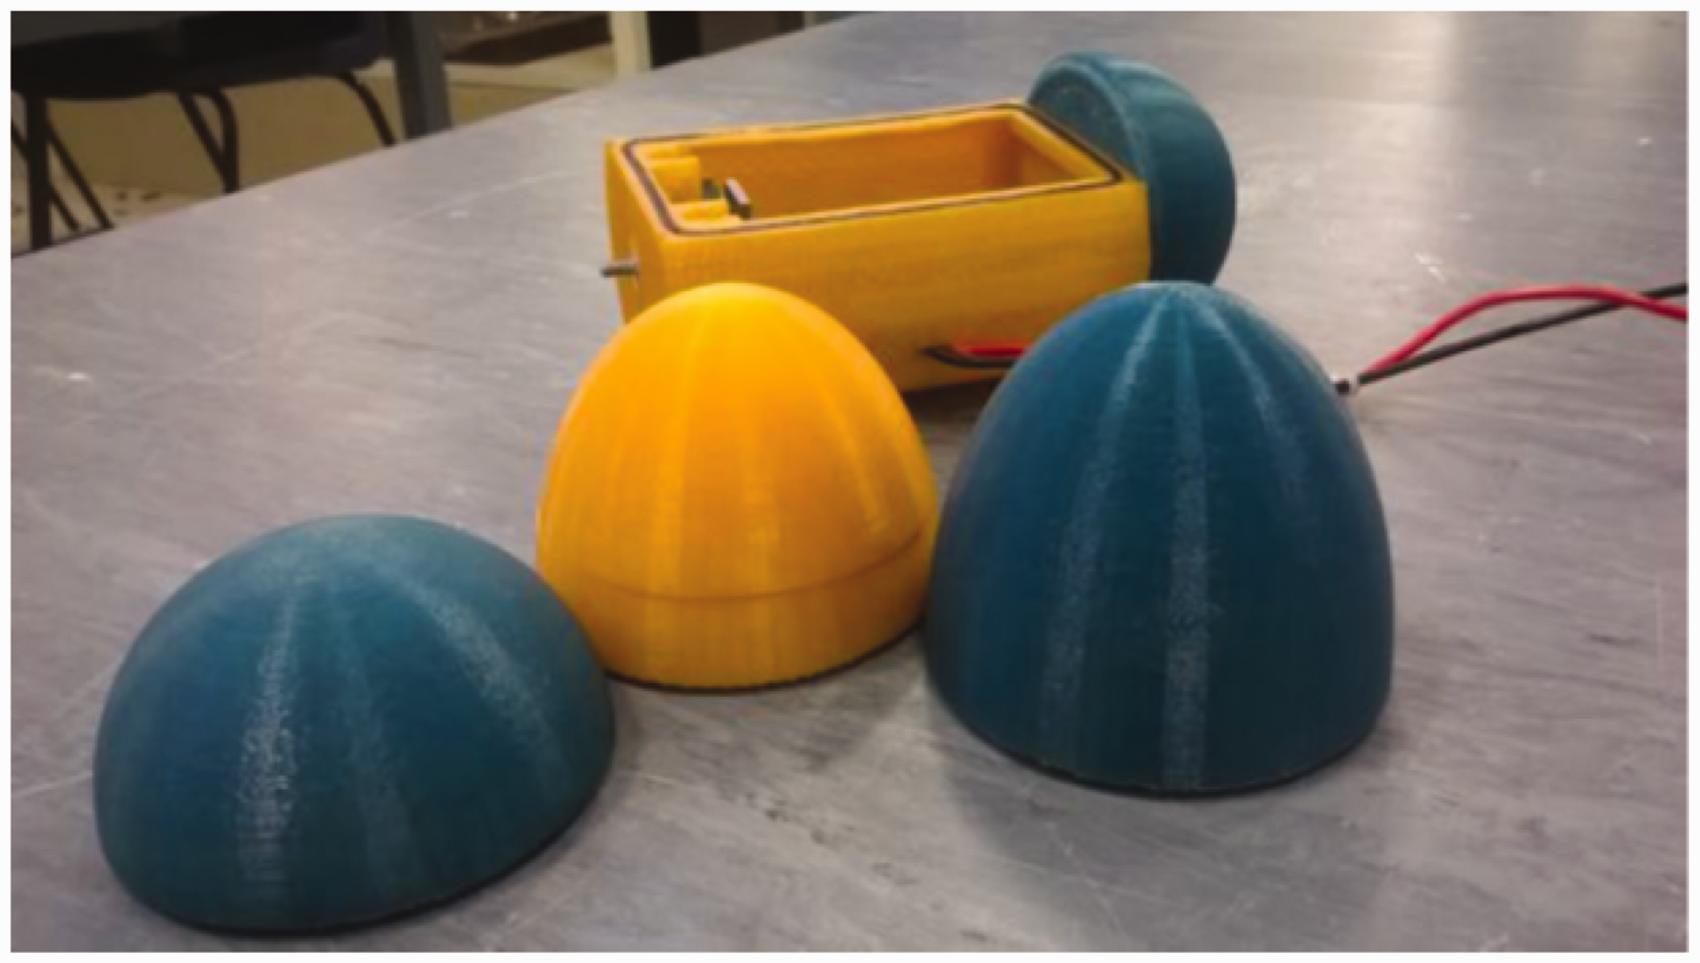
Test rig
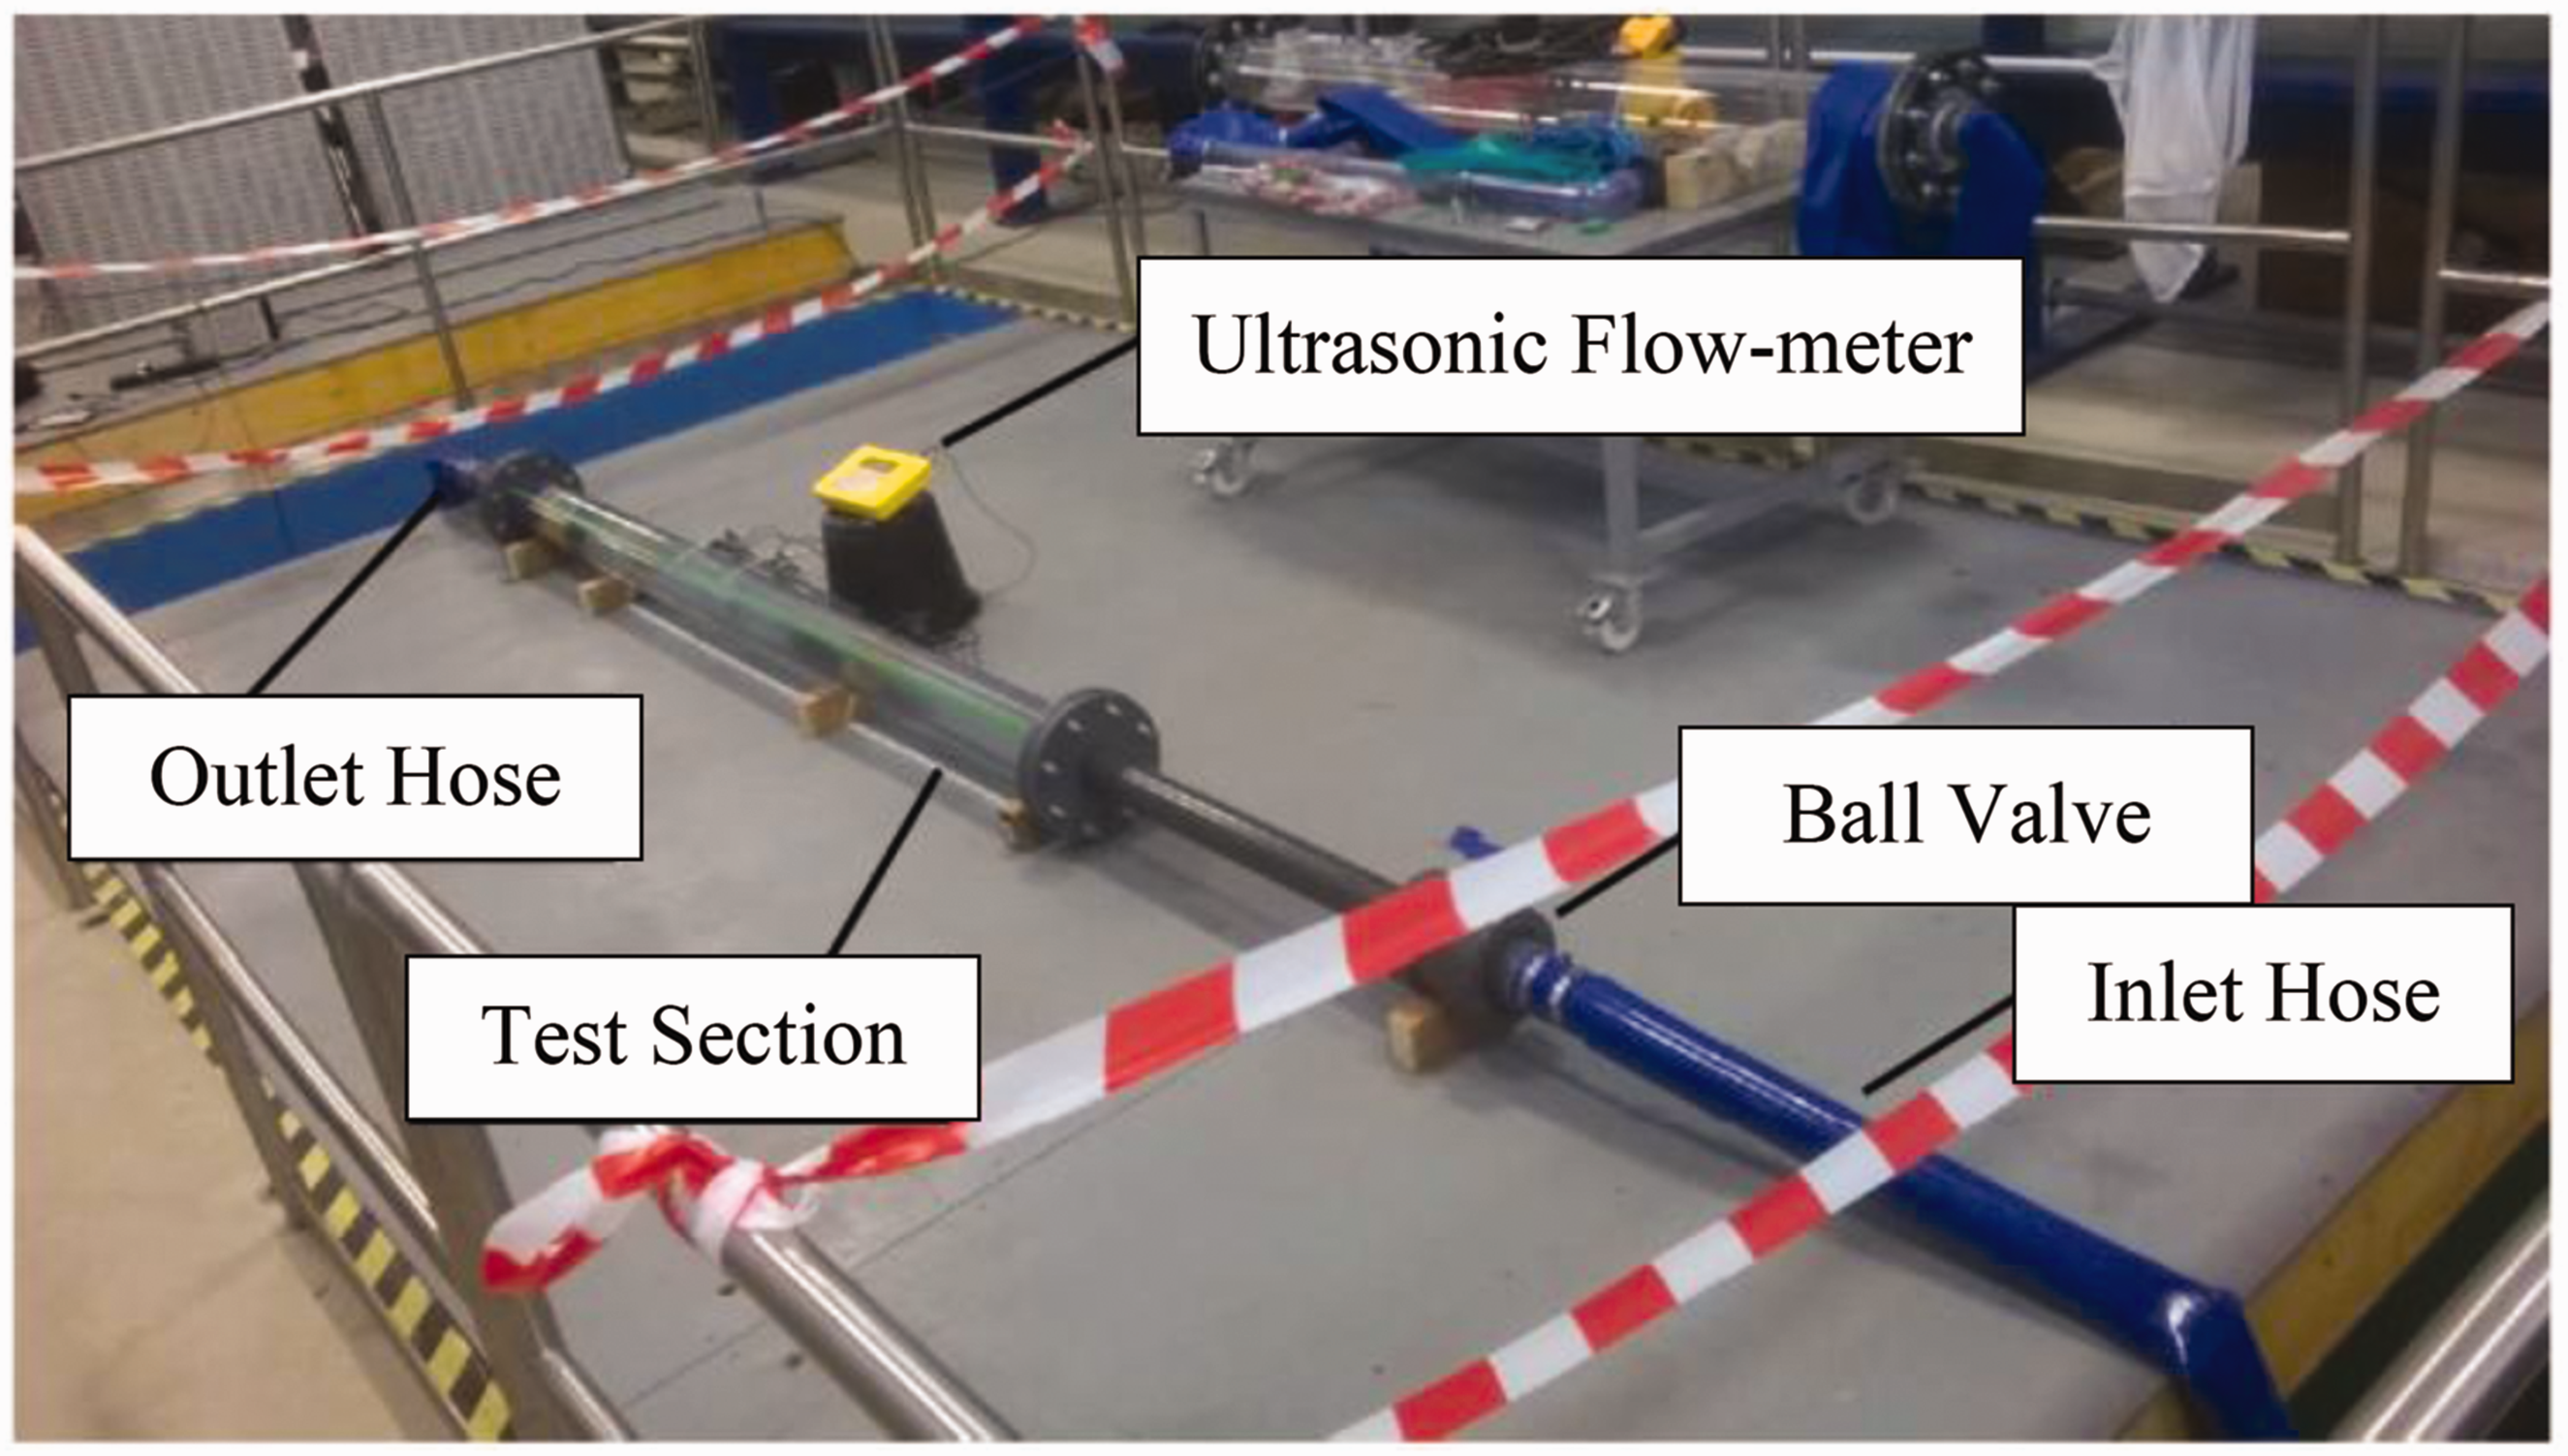
As illustrated in Figures 18 and 19, a test rig was designed to allow testing the capsule’s performance in both still and flowing water. This consisted of a transparent uPVC pipe of length 2.5 m and diameter 140 mm. Water taken from an underfloor pool was circulated through the pipe using a constant speed submersible pump, with flow velocity being controlled using a ball valve located on the inlet side of the test section. Flexible hoses were used to connect the pump to the test pipe and also for the return line to the tank. The flow velocity was monitored using a Micronics Portaflow 330 Ultrasonic Flowmeter mounted on the outside of the test section. The capsule progression was recorded by a video camera at 1080 p resolution and 30 fpd frame rate and marks made at every 50 mm on the pipe.
Schematic illustration of the test bed. Photograph of the experimental test rig.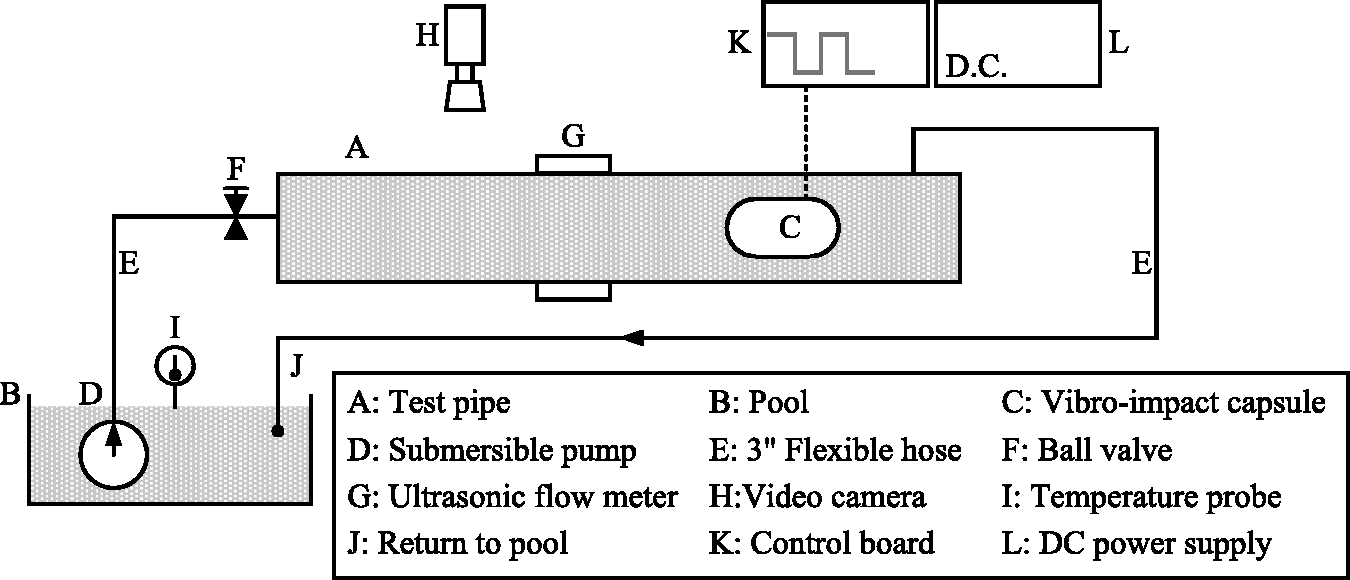
The capsule was inserted into the test pipe after removing the downstream end cap and exit hose from the main pipe, and then running the power cables all the way through the exit hose and back out of the water tank to be connected to the control board and power supply. When the end cap was replaced, an excess of cable was left loosely coiled inside the test section to allow the capsule to progress without dragging the full cable length. The test rig allowed the capsule to be tested in flow velocity up to 0.4 m/s.
Tests
Parameters and results of tests.
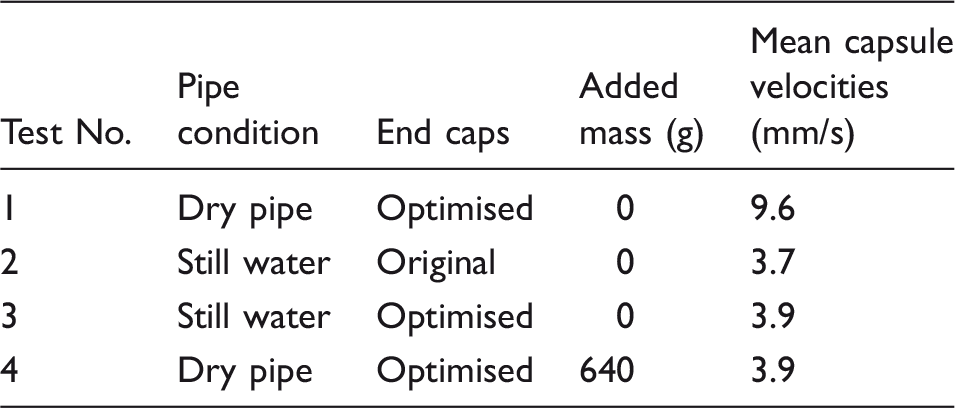
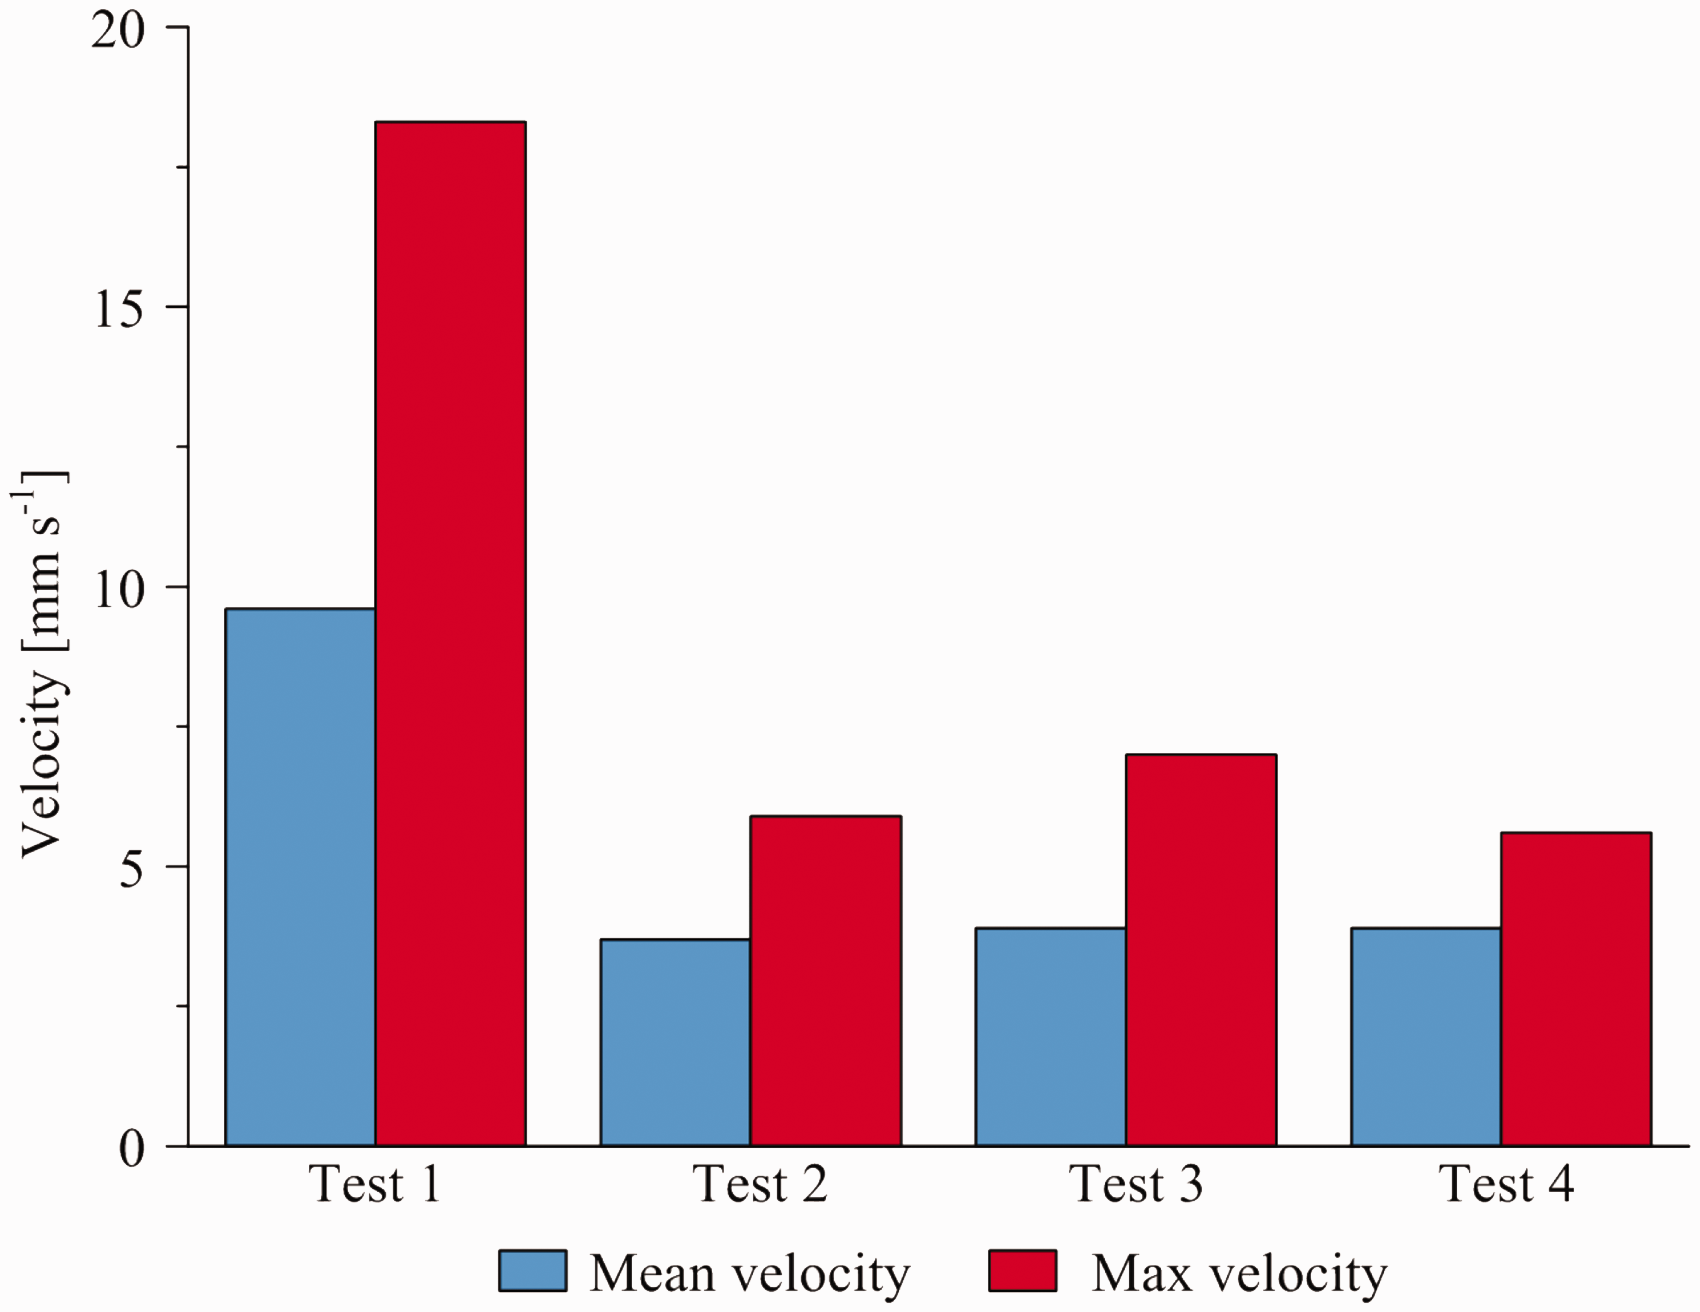
In dry and still water conditions, the capsule was found to perform as expected. Figure 20 presents the capsule progression for each test listed in Table 2. In general, it can be seen that the tests conducted in dry pipe resulted in a much higher velocity than those in water. Comparing the results of Tests 2 and 3, it reveals that the optimised capsule produced an increase in both the mean and the maximum velocity. However, it should be noted that in still water tests, the thick and stiff power cable shown in Figure 21 became a factor of interference. As it was tangled when the pipe was filled with water, the untangling cable generated extra pulling forces leading to the erratic motion of the capsule. This causes a mean velocity increase of about 5.4% between Tests 2 and 3, while the increase in the maximum velocity is 18.4%, as illustrated in Figure 22. It can be expected that without the tangled cable, the increase in the mean velocity should be closer to that of the maximum.
Comparison of different test results, where the capsule progression is realized in Tests 1 (dashed), 2 (solid), 3 (thick solid) and 4 (thick dashed). (a) Optimised capsule with power cable and (b) optimised capsule in fluid pipe. Comparison of mean and maximum progression velocities.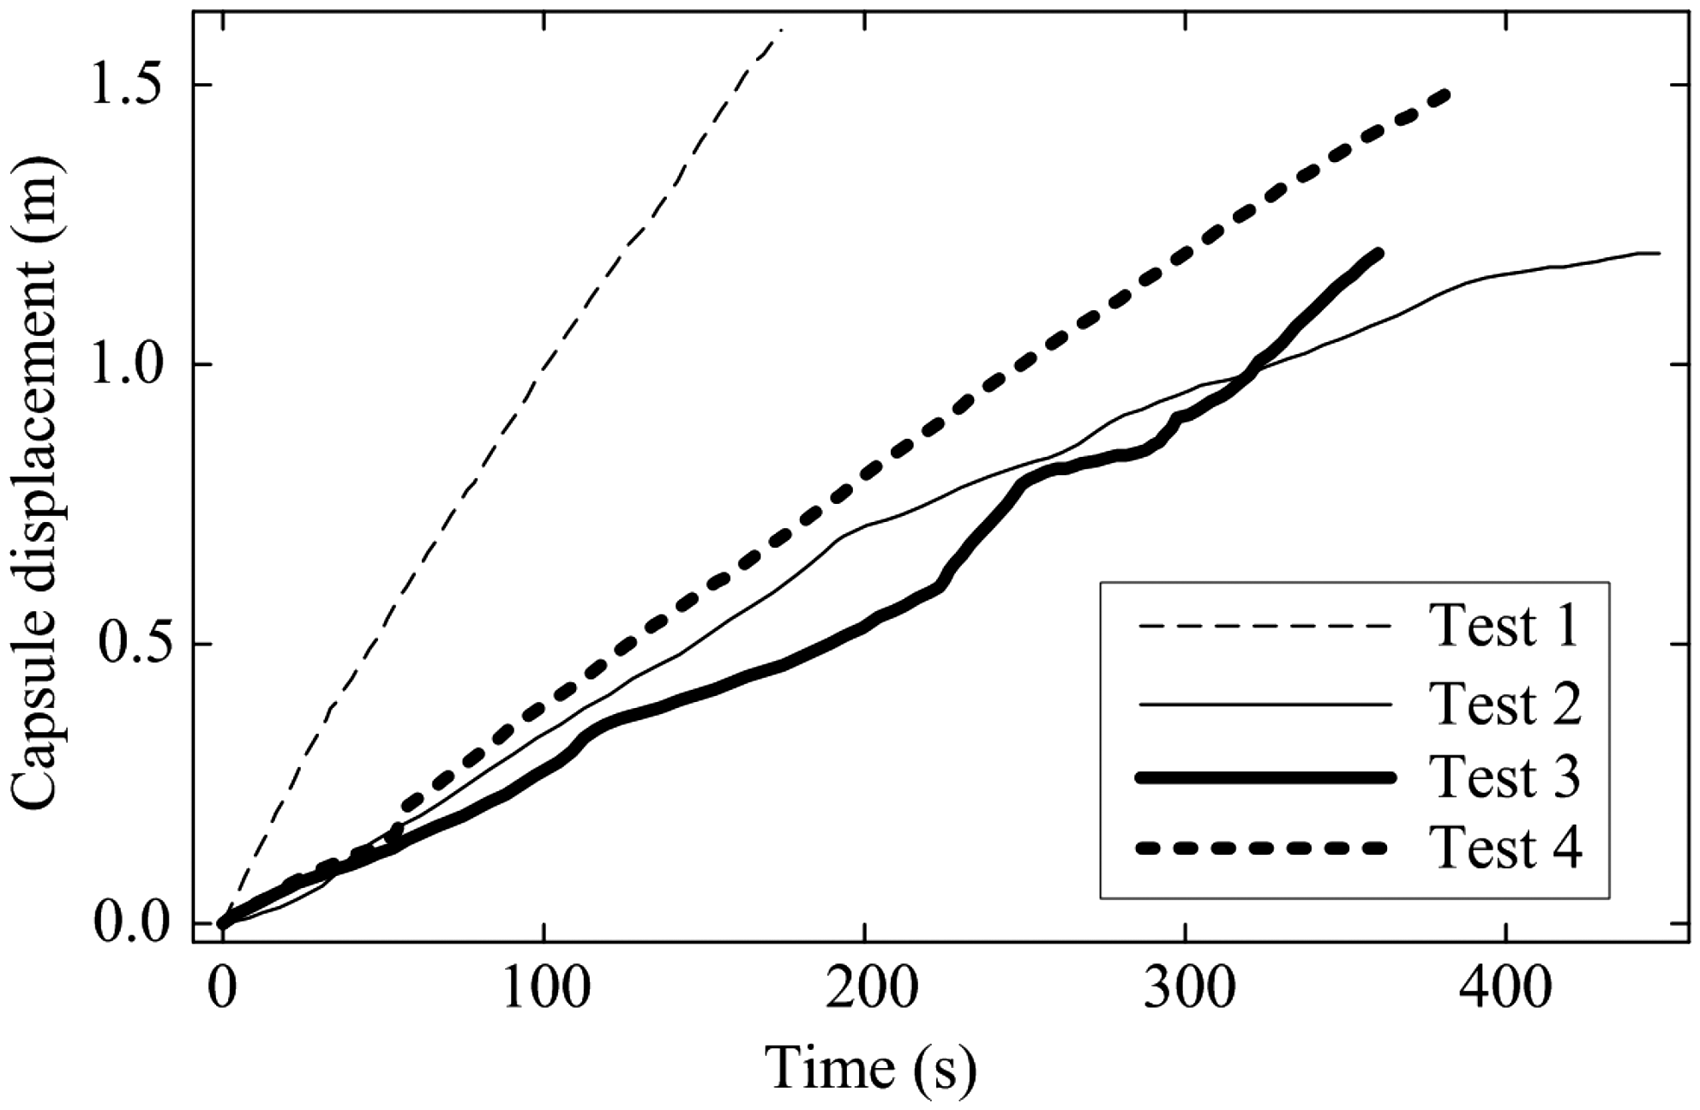
Discussion
There is a discrepancy between the simulated and experimentally recorded coefficient values as shown in both sets of data in Figure 16. The mean differences between the lift and drag coefficients are 39.53% and 59.21%, respectively. These inaccuracies could be caused by the simplification of the 2D CFD model. The numerical simulation for 2D analysis might exaggerate external forces acting on the capsule body, and hence the numerical results are greater than those observed in the wind tunnel tests. Another possible reason might be that the boundary layer was affected. The rough surface finishes in conjunction with the fluids viscosity resulting in air molecules sticking to the surface of the capsule which would have ultimately changed its shape. This would result in inaccurate readings for the reference areas obtained as the fluid flow would have reacted with this layer as if it were a solid. The flow in and near the boundary layer can often be unsteady, and it is also quite possible that the boundary layer may have even separated to create a much different shape. This is mainly witnessed with higher angles of attack due to opposing pressure gradients at the top and rear sections.
The tests have proven the capability of the vibro-impact capsule to operate in both air and water filled pipes and have verified the effectiveness of the CFD optimization carried out in this project. It has also highlighted the areas for future development: there is an urgent need to adopt a wireless system for the capsule as the cable is not only slowing the capsule down but also interfering with the results of testing other aspects of the design. The other issue is an increase in the velocity of the capsule to make it commercially viable. Its current maximum velocities are 0.0183 m/s in air and 0.007 m/s in water. This could be increased significantly with the implementation of a wireless system, a further investigation into the actuation parameters of the solenoid, and an upgrade to a more powerful vibro-impact system. These changes will hopefully not only allow the capsule to move faster in still water but will also allow it to move against a flow.
The experiments correspond with what would be expected based on the CFD results, i.e. reduced drag of the optimized design and increased capsule velocity in still water tests. Another feature indicated by the CFD simulation which was also observed during testing was that, during the filling of the pipe for the tests of the weighted capsule, at a flow rate of around 0.2 m/s, the front end of the capsule started to lift up towards the centre of the pipe indicating the presence of a high-pressure zone under the front of the capsule, pushing it away from the wall and tilting it. This instability was however not observed during actual testing as the capsule and flow velocities were too low for this effect to be noticeable.
The diameter ratio between the capsule and pipe is crucial for the performance of the vibro-impact capsule system in terms of fluids dynamics and capsule progression. Our study has employed fixed diameters for the capsule and pipe in order to compare their computational and experimental results. For the detailed analysis of this size issue, readers can refer to Risso et al. 28 and Queguiner and Barthes-Biesel 29 for a discoidal bioartificial capsule in a narrow tube and 30 for a variable-diameter capsule with radial clearance compensation. As this paper has focused on geometric optimization and experimental verification, the detailed study of such size effects on the vibro-impact capsule system will be carried out and reported in a separate publication in due course.
Concluding remarks
2D CFD models and optimization of the vibro-impact capsule have been developed, considering varieties of frame geometry and positions within the pipeline. Moreover, the predicted lift and drag characteristics of the capsule have then been validated through full scale wind tunnel testing. Simulation data reveal a correlation between the capsule profile and pressure difference measurements. The simulations confirm that an optimized capsule design requires additional streamlining properties as explored within the optimization process that reduce high and low pressure regions. The resultant effects of the optimized design decreased drag and lift coefficients by 53.83% and 14.28% respectively, thus potentially improving the capsule’s performance.
3D CFD simulation was then used to validate the 2D CFD simulations. The 3D simulation model allowed for a more accurate, realistic representation of the experimental rig. The results confirmed that the optimized design is significantly more efficient than the original one, thus potentially increasing the capsule performance
An experimental setup has also been developed allowing investigation of the capsule performance in real world operating conditions and validation of performance improvements yielded by CFD optimization. Tests have been carried out to investigate the effects of the optimized capsule design and the addition of mass, on capsule velocity in a variety of environmental conditions. It was determined that, operating in still water conditions, the use of the optimized end caps resulted in a 4.75% increase in mean velocity and an 18.6% increase in maximum velocity when compared to the original capsule design, thus meaning the experimental results are in line with the CFD predictions.
Footnotes
Declaration of Conflicting Interests
The author(s) declared no potential conflicts of interest with respect to the research, authorship, and/or publication of this article.
Funding
The author(s) disclosed receipt of the following financial support for the research, authorship, and/or publication of this article: The authors would like to acknowledge the Robert Gordon University School of Engineering that provided the facilities and funding for this work. The authors would also like to acknowledge the Pathfinder Awards funded by the Agri-Tech in China: Newton Networkþ (Grant No. PF002). Yao Yan was supported by the National Natural Science Foundation of China (Grant Nos. 11502048 and 11572224) and the Fundamental Research Funds for the Central Universities (Grant No. ZYGX2015KYQD033). Yang Liu would like to acknowledge the financial support from EPSRC for his First Grant (Grant No. EP/P023983/1). Haibo Jiang was supported by the National Natural Science Foundation of China (Grant Nos. 11672257, 11402224 and 11401543). Zhike Peng was supported by the National Natural Science Foundation of China (Grant No. 11632011).