
Abstract
3D scanning has become an essential tool for industrial inspection, yet no standardized framework exists to classify the complexity of scanned geometrical features. This study develops a quantitative complexity classification model to systematically evaluate inspection difficulty. Using a comparative SWOT analysis of major scanner types (structured-light, laser, and contact CMM), the study integrates product design parameters, geometric characteristics, and inspection constraints into a five-level framework: basic, simple, medium, complex, and high complexity. Each level is defined by measurable indicators such as feature count, surface topology, hole depth-to-diameter ratios, and free-form surface presence. Case studies using an Artec Leo scanner demonstrate that scanning effort, viewpoint planning, and data processing time increase predictably with complexity level. Quantitative results confirm this trend: Levels 1–2 required minimal scanning and exporting time (≈ 4.5 min), whereas Levels 4–5 required multiple rescans and extended post-processing. These findings demonstrate the predictive power of the framework for estimating inspection effort, guiding viewpoint planning, and optimizing cycle time. The proposed framework improves alignment between scanner capability and product requirements, enabling more efficient inspection planning, hybrid measurement strategies, and digital quality control workflows. This work provides a reproducible foundation for future research on automated complexity-aware inspection in Industry 4.0 environments.
Keywords
Introduction
3D scanning technology is now widely applied across diverse fields including geomorphology, medicine, cultural heritage, forensics, film production, and industrial design.1–3 In manufacturing, it plays a critical role in reverse engineering, quality control, and product inspection. Despite its widespread adoption, there remains no standardized framework for classifying product complexity in the context of inspection. This lack of a systematic approach limits the ability to align scanner capability with product requirements, often resulting in over- or under-specified inspection workflows.
Conventional inspection methods rely on manual measurement, optical systems, or CCD-based imaging. 4 Although 3D scanning offers a flexible and efficient alternative, the diversity of geometrical features poses significant challenges. Products with high surface counts, deep holes, or free-form geometry require more scanning viewpoints and complex data processing, increasing both time and uncertainty in inspection results. Thus, a formalized definition of inspection complexity is needed before evaluating scanner performance or planning metrological workflows.
Several researchers have examined complexity from the perspective of design and manufacturing. Greco et al. 5 proposed a geometrical complexity index for product design, while Clemente and Niknam 6 linked design complexity metrics to post-processing costs in additive manufacturing. Other studies have explored assembly-related complexity, using expert-based evaluation 7 or physiological response metrics 8 to assess task difficulty. Shape analysis initiatives such as SHREC’21 have advanced quantitative methods for measuring geometric complexity, 9 and reviews such as Haleem et al.10,11 have underscored the potential of 3D scanning in Industry 4.0 environments. However, these contributions primarily address product geometry, assembly operations, or manufacturing processes. Few studies have explicitly classified complexity in the context of 3D inspection tasks, leaving a research gap at the intersection of design complexity, geometric feature measurement, and inspection automation.
To address this gap, this paper proposes a five-level complexity classification framework for product inspection using 3D scanning. The framework integrates literature synthesis, a comparative SWOT analysis of scanner types, and empirical demonstrations using a structured-light scanner. Quantitative criteria—such as feature count, surface topology, and hole depth-to-diameter ratios—are introduced to make the classification reproducible. The proposed approach supports inspection planning, scanner selection, and standardization of quality control procedures. Unlike prior studies that focus on individual geometric descriptors or measurement uncertainty, this work contributes a structured classification framework that consolidates numerical, structural, and variational geometric characteristics into a unified inspection-oriented taxonomy. The objective is not to predict measurement accuracy, but to support early-stage inspection planning and qualitative workload estimation.
Section 2 introduces 3D scanning principles and presents a comparative analysis of major scanner types. Section 3 defines the dimensions of product complexity and details the proposed classification framework. Section 4 provides case studies illustrating each complexity level. Section 5 discusses challenges and opportunities, and Section 6 concludes with contributions and directions for future research.
3D scanning technologies and their relationship to geometrical complexity
Three-dimensional (3D) scanning technologies are increasingly employed in industrial inspection due to their ability to rapidly acquire dense geometric data from physical components. However, different scanning modalities exhibit fundamentally different sensitivities to geometric complexity, occlusion, and surface topology. Understanding these limitations is essential for motivating a geometry-based complexity classification framework.
Principles of non-contact 3D scanning technologies
Non-contact 3D scanning systems commonly used in inspection can be broadly categorized into structured-light scanners, laser scanners, and photogrammetric systems. Each technology reconstructs geometry based on different physical principles, resulting in distinct performance characteristics when confronted with complex product geometries.
Structured-light scanners project known fringe or pattern sequences onto an object surface and reconstruct geometry through triangulation based on pattern deformation captured by one or more cameras. These systems can produce dense point clouds with high local accuracy, making them particularly suitable for small- to medium-sized parts with fine geometric detail. 11 However, their performance degrades in the presence of deep cavities, sharp undercuts, or closely spaced features due to line-of-sight constraints and self-occlusion. 12 As geometric complexity increases—particularly in terms of feature count and inter-feature dependency—structured-light inspection typically requires a larger number of viewpoints and more complex scan planning strategies. 13
Laser scanning systems, including triangulation-based and time-of-flight variants, measure distance using laser emission and reflection principles. These scanners are robust for capturing large objects and complex external surfaces and are less sensitive to ambient lighting than structured-light systems. 14 Nevertheless, laser scanners generally offer lower spatial resolution for small features and experience difficulty when measuring narrow slots, sharp edges, or high-curvature regions where beam incidence angles become unfavorable. 15 Consequently, increasing numerical and variational complexity often leads to reduced local accuracy and increased uncertainty in feature reconstruction.
Photogrammetry reconstructs 3D geometry by identifying and matching features across multiple overlapping images captured from different viewpoints. Its primary strength lies in large-scale measurement capability, scalability, and low hardware cost. 16 However, photogrammetry relies heavily on surface texture and lighting consistency; smooth, repetitive, or reflective surfaces significantly reduce reconstruction fidelity. 17 From a complexity perspective, photogrammetry is particularly sensitive to structural complexity, as highly interdependent features and occluded regions often require extensive image networks and manual intervention to achieve acceptable completeness. 18
Impact of geometrical complexity on scanning performance
Despite the advantages of optical scanning, practical measurement tasks often reveal performance constraints that directly relate to geometric complexity:
Surface accessibility and occlusion: Optical scanners rely on line-of-sight measurements; features in deep cavities, undercuts, or occluded zones are difficult to capture without additional viewpoints or auxiliary fixtures. This issue is particularly acute for disjoint or internally complex surfaces, which often require many viewpoints to mitigate shadowing. 19
Material and texture effects: Both structured-light and photogrammetric systems struggle with shiny, transparent, or featureless surfaces. Structured light can lose pattern contrast on highly reflective materials, while photogrammetry lacks reliable keypoints on featureless areas, leading to incomplete or distorted reconstructions.20,21
Environmental dependencies: Photogrammetry critically depends on consistent lighting, camera calibration, and sufficient contrast between images; structured light is less lighting-agnostic but still requires controlled illumination to avoid pattern washout. These dependencies increase operational complexity during scanning and post-processing. 21
Data processing burden: High-resolution captures from either modality produce dense point clouds requiring significant computational resources for registration, alignment, and mesh generation. Such burdens impact turnaround time and may amplify noise for geometrically intricate models. 22
Comparative strengths, weaknesses, opportunities, and threats (SWOT) analysis and motivation for a complexity classification framework
To systematically evaluate how different scanning technologies respond to increasing geometrical complexity, a comparative SWOT analysis was conducted for structured-light scanners, laser scanners, and photogrammetric systems. Unlike a general technology survey, this analysis specifically emphasizes how geometric characteristics—such as feature count, feature interdependence, and surface irregularity—affect inspection performance. By mapping technology-specific strengths and limitations to these characteristics, the critical factors influencing inspection effort can be identified and the need for a complexity classification framework can be justified.
This analysis demonstrates that inspection difficulty is not determined solely by individual features but is also influenced by their spatial arrangement, interdependencies, and accessibility. Deep holes, overlapping elements, and free-form surfaces disproportionately increase scanning effort, irrespective of the individual feature’s geometric simplicity. These insights provide a clear rationale for a structured complexity classification, linking geometric characteristics to anticipated scanning workload and inspection planning.
Table 1 summarizes the SWOT analysis with an emphasis on the relationship between scanner capabilities and geometrical complexity. This table provides a practical reference for selecting suitable scanning strategies based on part complexity.
SWOT analysis of major 3D scanning technologies in relation to geometrical complexity in inspection.
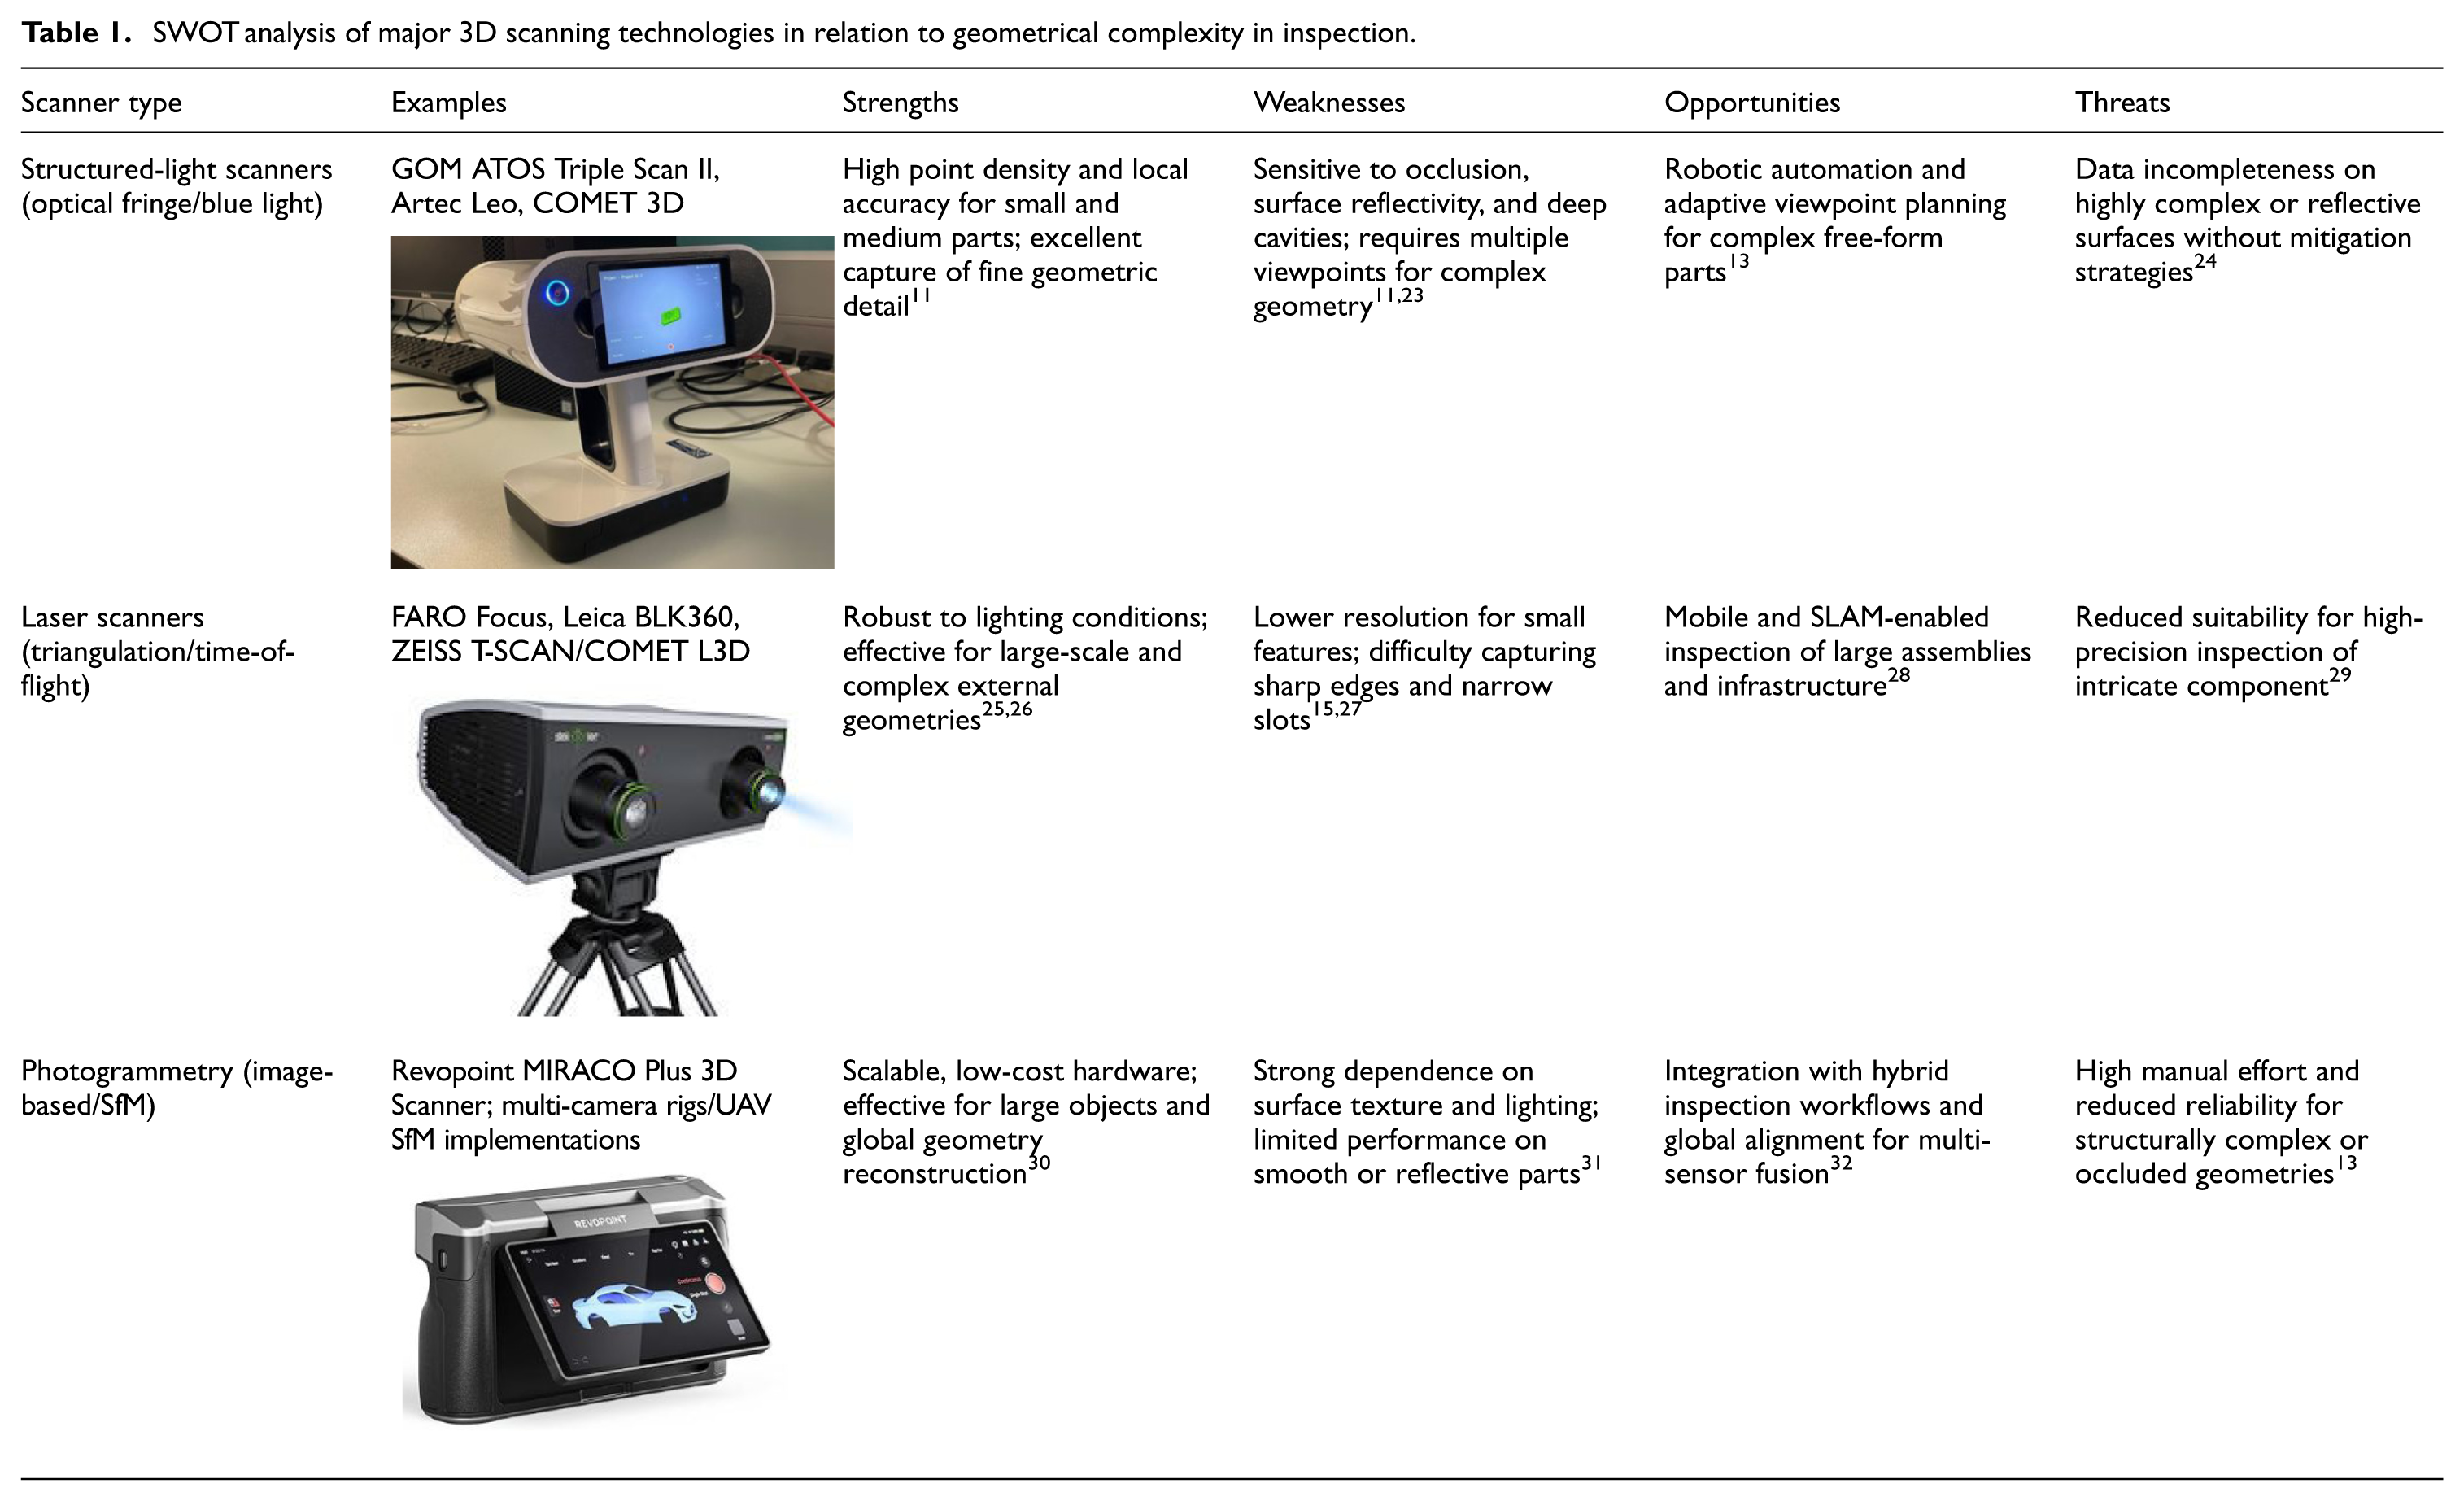
The SWOT analysis reveals that inspection difficulty increases primarily due to occlusion, feature interdependence, and free-form surfaces rather than scanner resolution alone. These limitations motivate the need for a geometry-driven complexity classification, where higher complexity levels correspond to increased viewpoint planning, rescanning, and post-processing effort. In the following section, these scanner constraints are translated into three inspection-oriented complexity dimensions.
Defining product complexity
The scanner comparison highlights that technology choice must be driven by the geometric and functional attributes of the part. As product complexity increases, scanning effort grows, often necessitating additional viewpoints, denser sampling, or hybrid measurement approaches. A formal definition of complexity is therefore required to enable consistent planning, benchmarking, and scanner selection.
This section formalizes inspection complexity by identifying three dimensions that capture the relationship between product geometry and measurement effort. Building on previous studies in design and manufacturing complexity,5,29 the focus here is on inspection-specific drivers that directly influence point-cloud completeness, processing time, and measurement uncertainty.
Complexity dimensions
Three dimensions are considered particularly relevant for inspection (Figure 1):
Numerical complexity—the count of geometric entities (faces, holes, slots, mesh triangles), which drives data volume and algorithmic load.9,33
Structural complexity—the interdependence and topological relationships between features, influencing registration, and their spatial arrangement and accessibility during inspection and tolerance analysis. 34
Variational complexity—the presence of free-form or irregular surfaces that require denser sampling and advanced reconstruction methods.11,35
In practical inspection scenarios, geometrical features may be individually simple yet collectively difficult to measure due to occlusion, limited line-of-sight, or restricted probe or sensor access. For optical scanning systems, these limitations persist regardless of scanner orientation, particularly in the presence of deep cavities, overlapping features, or closely spaced elements.
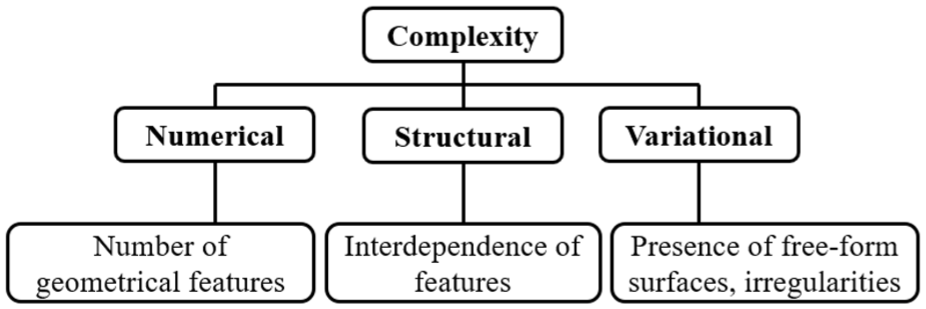
Three dimensions of product complexity are considered in this study: numerical, structural, and variational.
Several studies have shown that inspection difficulty increases significantly when feature layout induces self-occlusion or shadowing, even when the underlying geometry consists of basic primitives. 13 In such cases, additional viewpoints, part reorientation, or hybrid measurement strategies are required to achieve acceptable data completeness. 36 Consequently, structural complexity in this framework explicitly accounts for feature positioning, mutual visibility, and inspection accessibility, rather than treating complexity as a function of feature count alone. This distinction is critical for inspection planning, as accessibility constraints often dominate scanning effort and data quality more strongly than individual feature geometry. 37
Geometrical features
Geometries vary in complexity. Forrest 38 and Shikhare 39 classified models by geometric (planes, curves, free-form) and combinatorial (edges, surfaces) complexity, as shown in Figure 2. And Figure 3 shows four types of chairs with different design complexity and geometric complexity, and to make the chair more comfortable to sit on, manufacturers have added more ergonomic curves to the design of the chair, which makes the geometric features of the chair more complex. Free-form surfaces present persistent difficulties for 3D scanning because their complex, continuously curved geometry creates frequent occlusions (deep undercuts, tight slots, and self-shadows) and highly variable local surface reflectance that produces irregular specular highlights and low-contrast regions. These effects lead to incomplete point clouds, outliers, and noisy depth estimates: occluded regions are simply not observed from a given viewpoint and require many more views or sensor repositioning to cover, while specular reflections violate basic sensor assumptions (Lambertian reflectance) used by structured-light, laser-triangulation and photogrammetric pipelines, producing missing data or false correspondences. Experimental metrology work on handheld and structured-light scanners shows that measurement uncertainty increases on highly curved or shiny surfaces and that scan orientation and surface properties strongly affect outlier formation and data completeness.15,24,27
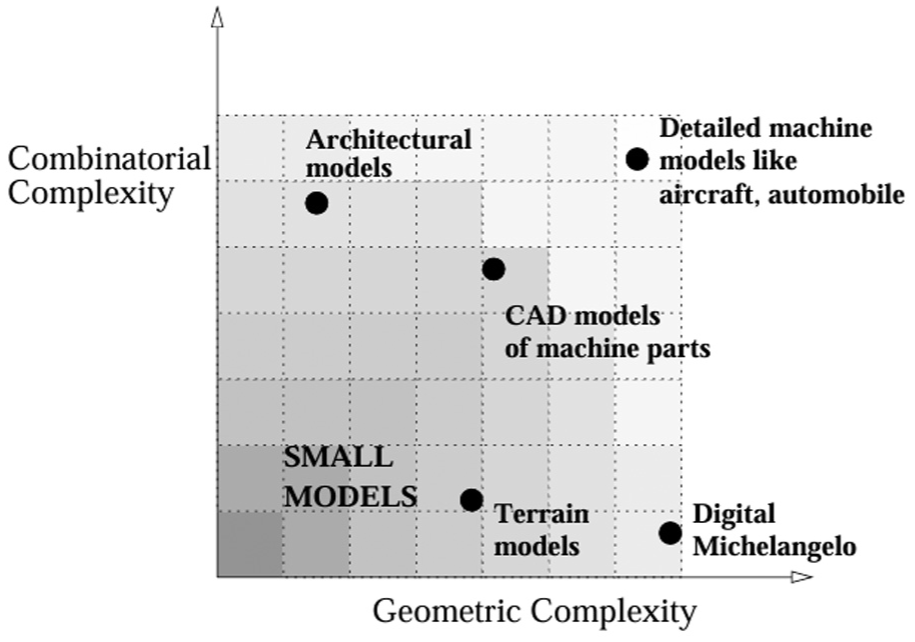
Classification of 3D models by geometric and combinatorial complexity. 39
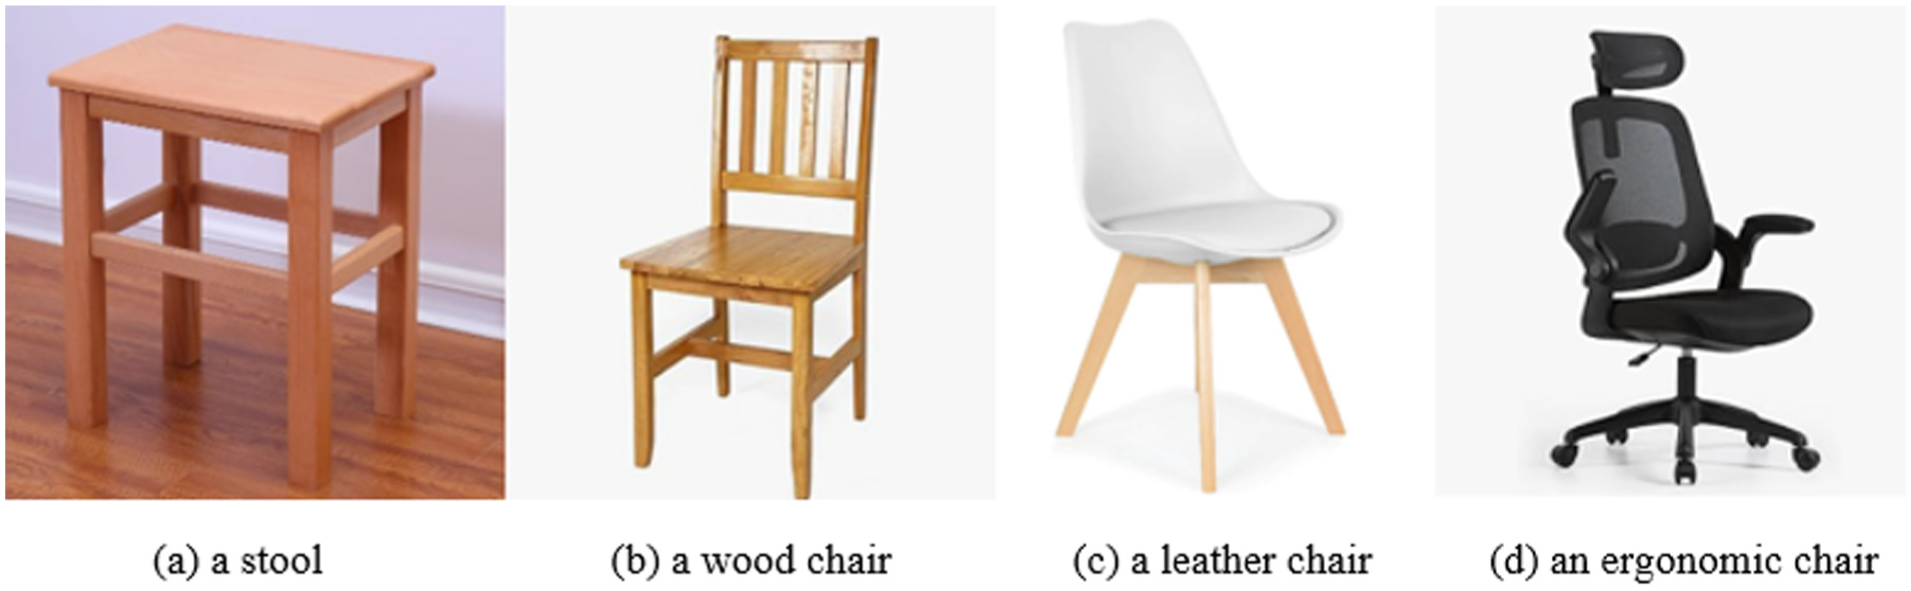
Example of chair designs with different geometric complexities: (a) A stool with flat surfaces and simple structure, (b) A chair with flat surfaces and a backrest, (c) A leather chair with a curved surface, and (d) An ergonomic chair with armrests, backrest, headrest and different surface curvatures for each part.
Product inspection complexity
Inspection complexity is governed by three interacting factors: scanner–material interaction, feature visibility, and tolerance requirements. Scanner–material interaction matters because surface optical properties (specularity, translucency, roughness) directly affect whether active or passive sensors produce valid measurements; highly reflective or glossy materials often break the Lambertian assumptions used by photogrammetry and structured-light/triangulation methods and therefore require alternate capture strategies (e.g. deflectometry or reflectance-aware reconstruction). 40 Feature visibility drives coverage and completeness: complex free-form geometry and deep undercuts produce occlusions that can only be resolved by planning many viewpoints, repositioning the sensor (or part), or fusing multiple scan modalities to fill holes and reduce registration error. 41 Finally, tolerance requirements determine how much missing data, noise, or local bias the inspection workflow can tolerate—tighter GD&T tolerances force denser sampling, more careful view planning, and sometimes the use of contact metrology or specialized optics to meet uncertainty budgets. 41 Because of these interactions, free-form and reflective surfaces substantially increase inspection complexity: they both reduce first-pass completeness and increase measurement uncertainty, and therefore often require mitigation such as temporary matte coatings or scanning sprays, multi-view and multi-sensor fusion, deflectometric capture for specular regions, or tailored calibration/processing pipelines to meet metrological tolerances. 42
Proposed framework
Figure 4 presents a five-level classification scheme linking product complexity to inspection planning:
Level 1—basic: <6 surfaces; regular primitives only.
Level 2—simple: 6–15 surfaces; minor holes or slots present.
Level 3—medium: 15–50 surfaces; multiple holes/slots; shallow free-form features.
Level 4—complex: 50–100 surfaces; interdependent arcs, multiple constraints, deep holes.
Level 5—high complexity: >100 surfaces; irregular free-form geometry, overlapping features, and significant occlusions.
The numerical thresholds defining each complexity level are intentionally defined as inspection-oriented heuristics rather than absolute or universal limits. In the present study, threshold values were selected based on a synthesis of prior geometrical complexity metrics, 43 empirical inspection experience reported in metrology literature, 15 and observed changes in scanning effort, such as the need for additional viewpoints or rescans. The intent is not to define fixed complexity laws, but to provide operational categories that support inspection planning and scanner selection.
This framework provides a reproducible reference for classifying parts by inspection complexity and supports selection of appropriate scanning strategies. Sensitivity to these thresholds is acknowledged, and future work will focus on refining them through larger datasets and statistical analysis across multiple scanners and industrial components.
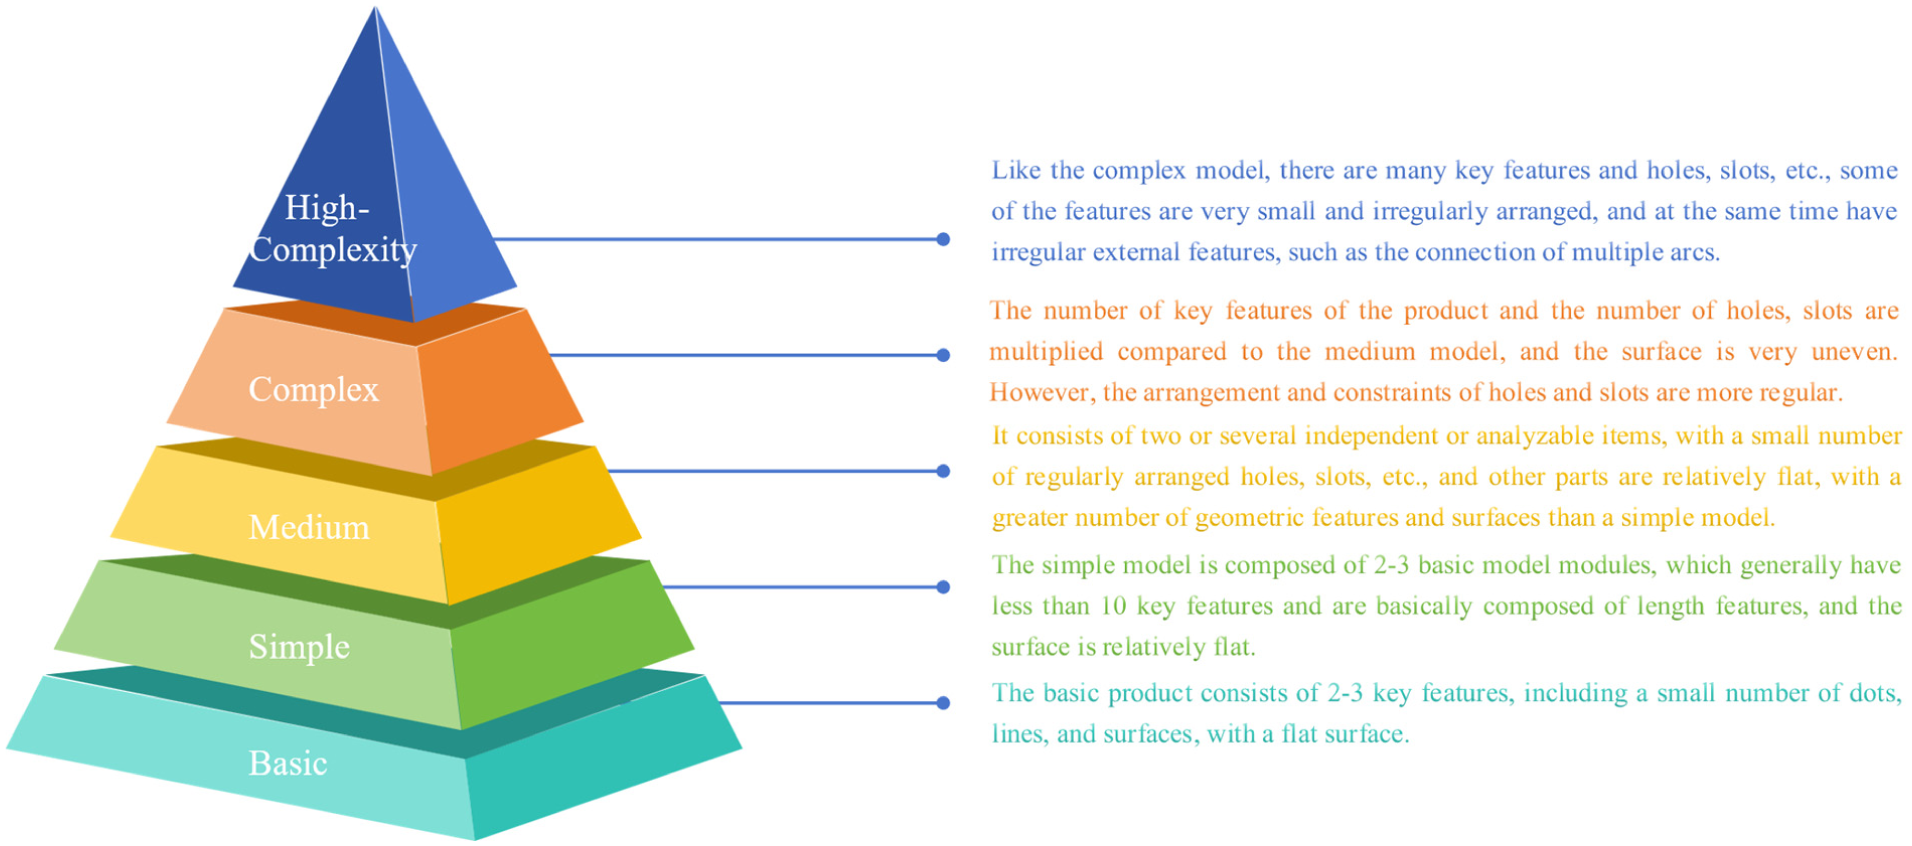
Proposed five-level complexity classification framework linking product geometry to inspection planning.
Case demonstrations
The case demonstrations presented in this section are intended to illustrate the operational implications of increasing geometrical complexity, rather than to provide statistically representative performance metrics. All examples were scanned using the same structured-light system under controlled conditions to isolate the effect of morphological complexity on inspection effort. Factors such as material properties, surface finish, and environmental variability were intentionally excluded to avoid confounding effects, consistent with prior studies that investigate geometric influences in isolation. 15
Level 1: Basic model
The complexity of a product is directly proportional to the total number of design decisions. 44 Fewer design decisions result in a simpler product. As the simplest 3D product, a cube (shown in Figure 5) requires only two decisive design parameters: the length and the chamfer. These two features were captured from the scanned model and compared with the original CAD data to verify accuracy.
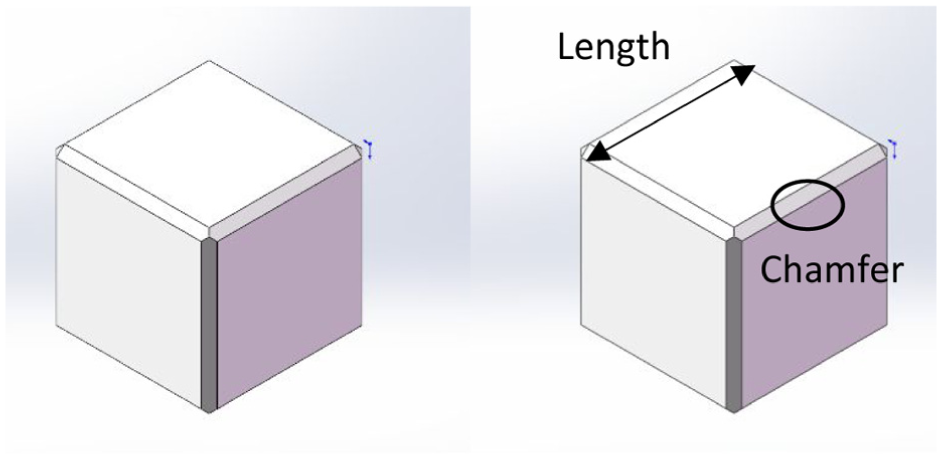
CAD model of the cube used as the Level 1 (basic) case study.
Because the cube surfaces are flat, complete coverage is achieved with a single scan. Figure 6 illustrates the resulting scan model, confirming that full surface reconstruction was achieved without noise or missing data. 27
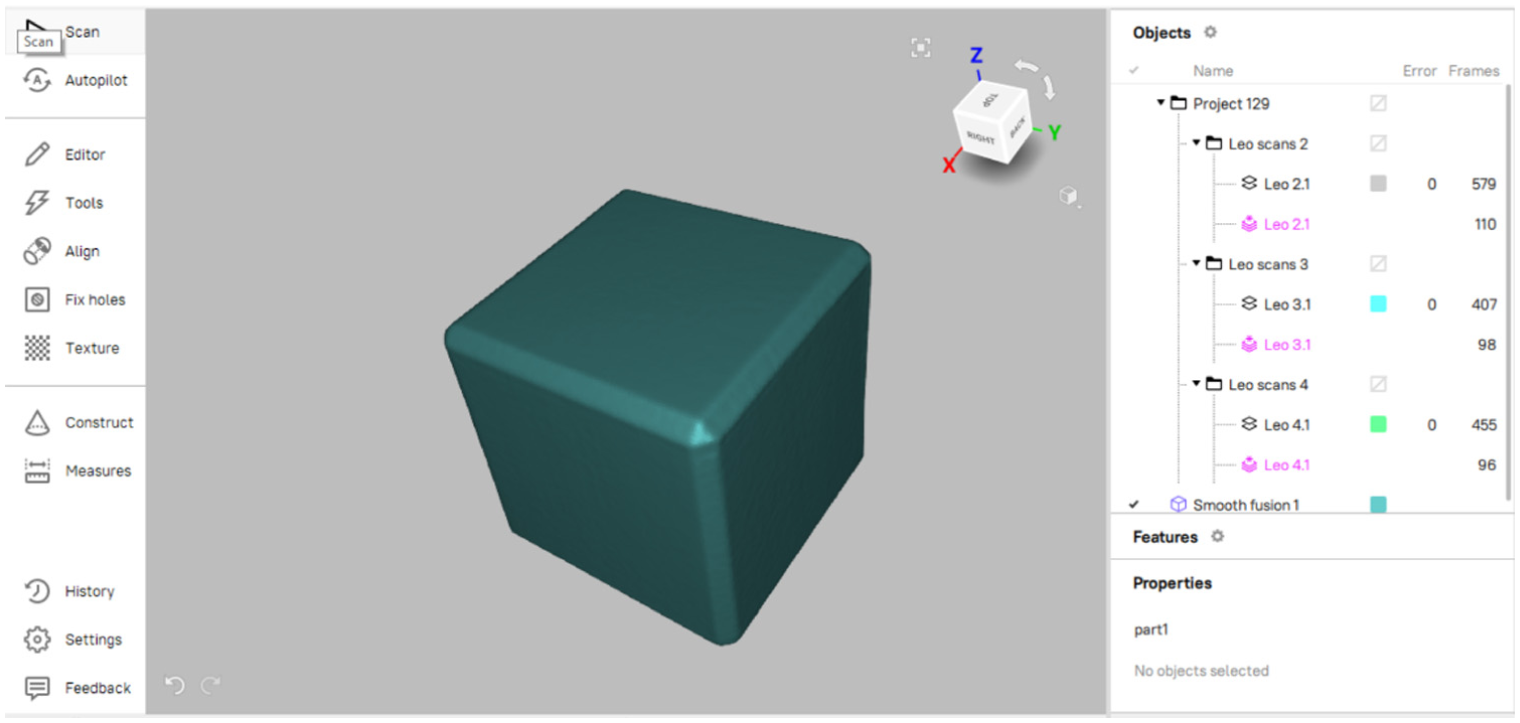
Reconstructed scan model of the cube showing complete surface coverage achieved in a single scan pass.
Since 3D scanning is a process of surface reconstruction, the number of surfaces directly affects scanning complexity. 3 The cylinder shown in Figure 7 contains three surfaces (excluding chamfers) and three key features: diameter, height, and chamfer. It is also relatively simple to scan, as demonstrated in Figure 8, where the entire geometry was captured in a single pass. 27
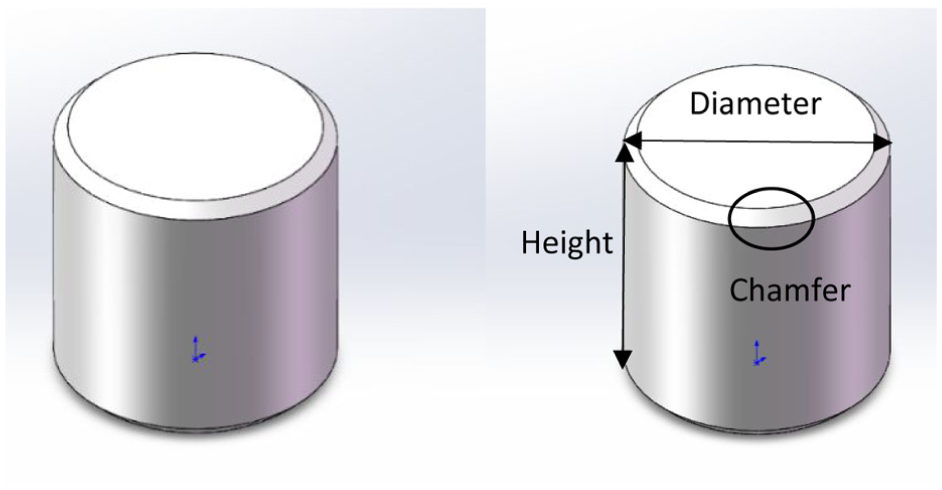
CAD model of the cylinder used as part of the Level 1 (basic) case study.
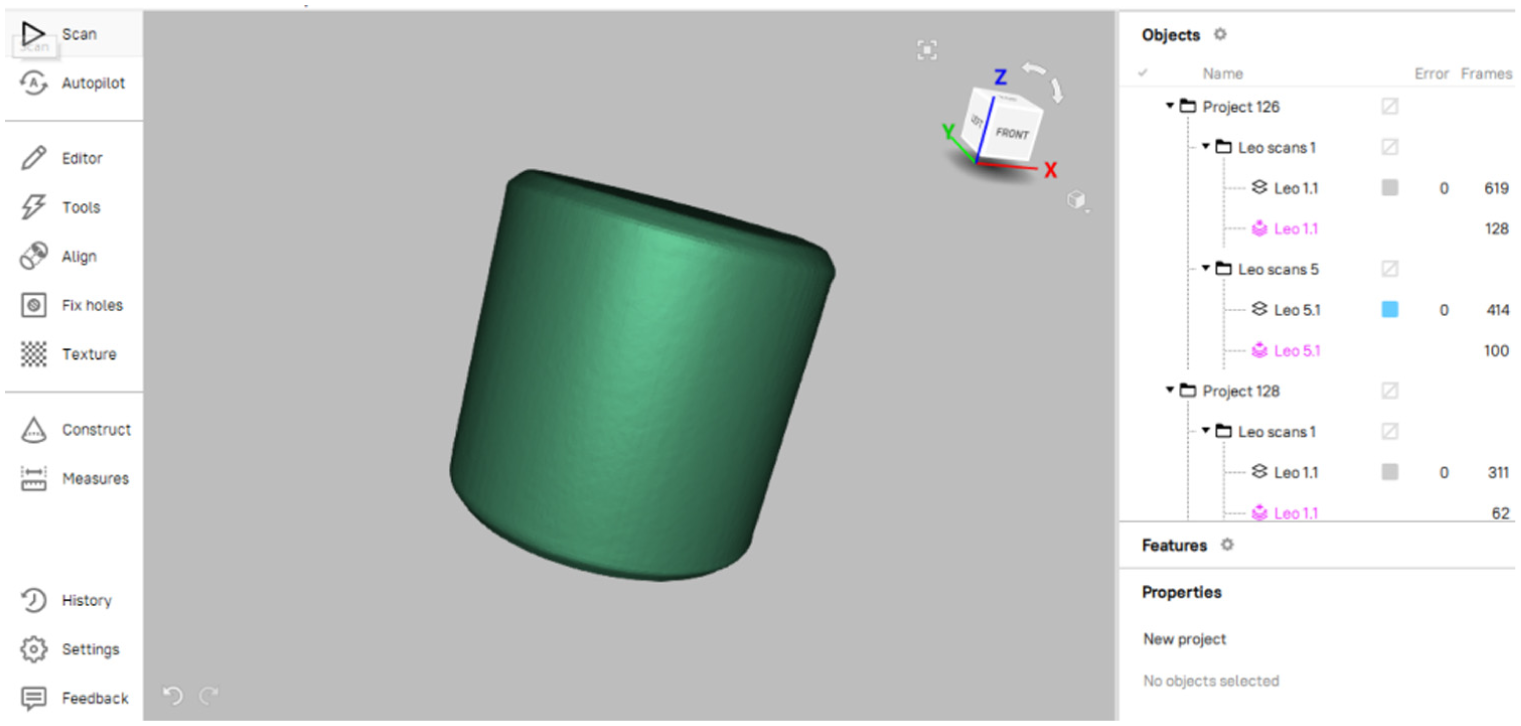
Reconstructed scan model of the cylinder confirming full geometric capture in a single pass.
Level 2: Simple model
The complexity of a product is closely related to the number of components. 5 The block shown in Figure 9 is composed of two simplest models (approximate two cuboids), which is generally considered more complex than a single cuboid. 45 There are three key features (height, length, width) to be captured to inspect each cuboid. Figure 10 shows the corresponding scan model, confirming that while the number of measurable features increases, coverage remains complete with minimal repositioning.15,27 Compared with Level 1, Level 2 introduces a modest increase in surface count without significantly altering feature accessibility, resulting in similar scanning effort.
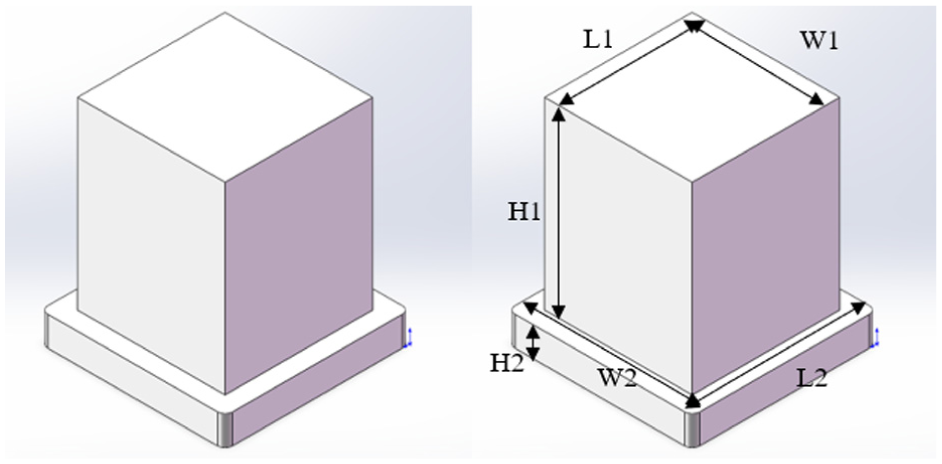
CAD model of the block composed of two cuboids used as the Level 2 (simple) case study.
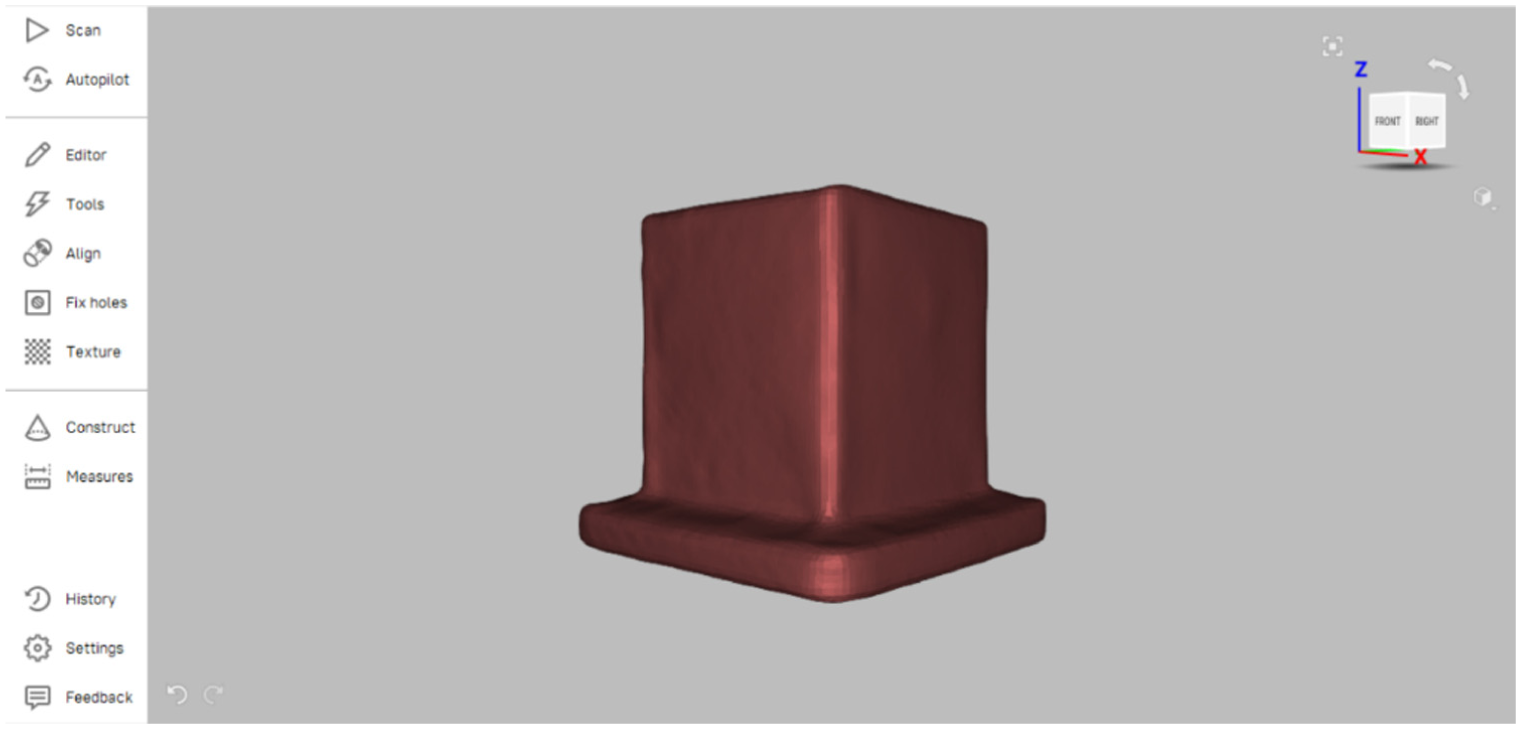
Scan model of the block showing full surface coverage with minimal repositioning required.
Level 3: Medium model
As a medium complexity product, it is generally a mass or state of being composed of two or several separate analyzable items, parts constituents, or symbols. 45 The fixture shown in Figure 11 requires inspection of at least 15 main features, which include eight lengths, four heights (including hole depths), one diameter and two radii. Figure 12 shows the reconstructed scan model, where the hole depths were initially under-represented and required additional angled scans to improve data completeness.15,24,27
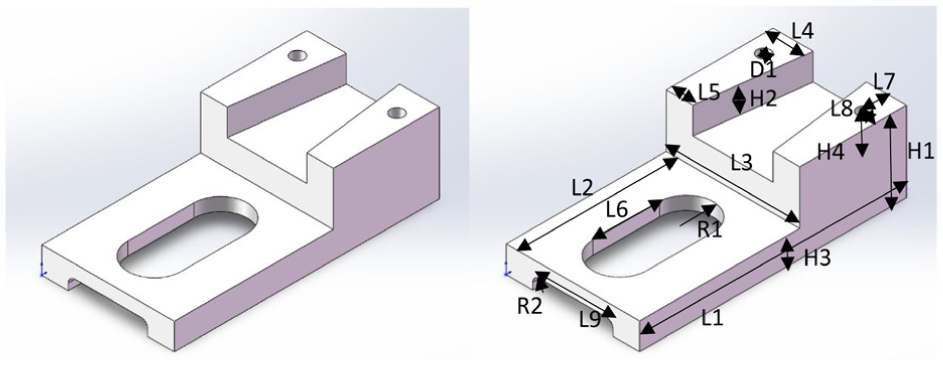
CAD model of the fixture used as the Level 3 (medium) case study, containing multiple lengths, holes, and radii.
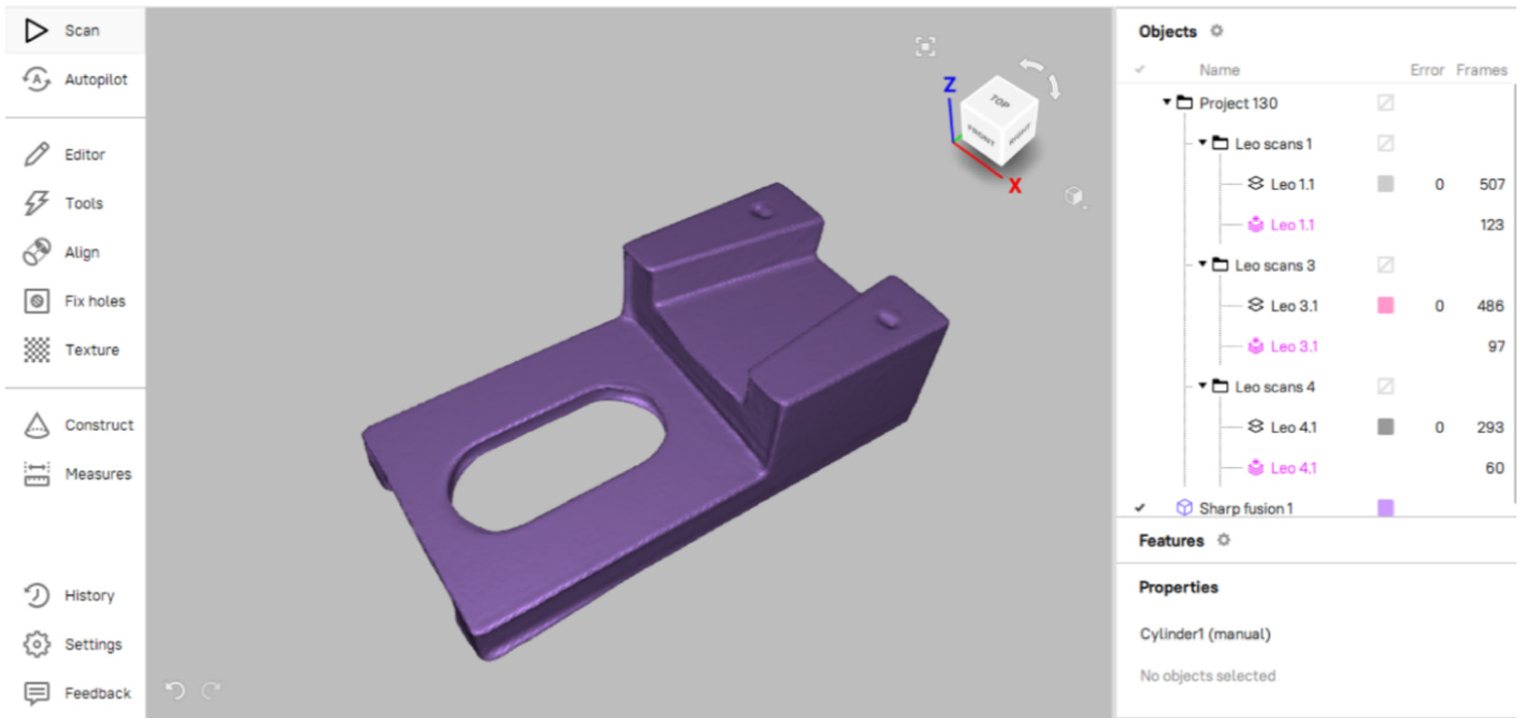
Reconstructed scan model of the fixture showing partial hole depth coverage before additional angled rescans.
This comparison highlights that it has many more surfaces than the earlier examples, which makes it more difficult to scan. 3 Furthermore, complexity is influenced not only by hole count but also by hole diameter and depth. 15 Larger diameters and shallower depths produce clearer reconstructions, whereas deeper holes require multiple scans and merged data sets.24,27
Level 4: Complex model
Eglese, Mercer, and Sohrabi mention that the complexity of a product is related to the constraints required at the time of product design. 46 The more constraints represented in a product, the more complex it is. In standardized model creation, the constraints or relationships associated with the geometric mechanism are tied to the number of possible solutions for generating the model. 47
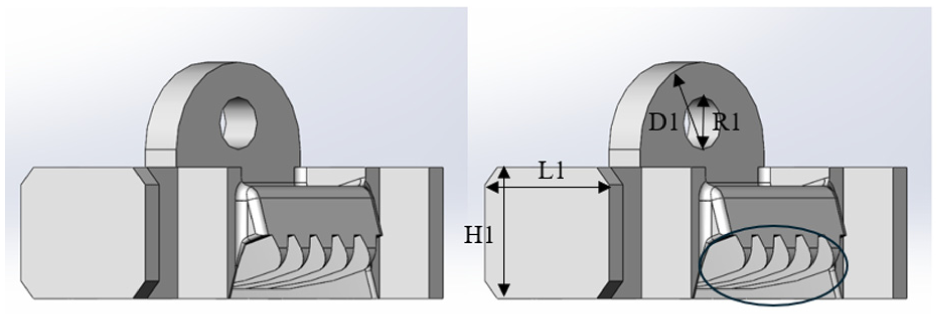
The fastener shown in Figure 13 involves five lengths, four heights, four diameters, and two radii, with additional constraints from hole position and mutual relationships. 47 Figure 14 presents the resulting scan model, highlighting the need for post-processing to isolate and measure overlapping geometries.22,25 Multiple arcs overlap within the frame, so a more complex analysis process is required after scanning, separating arcs and measuring their radii individually. 46
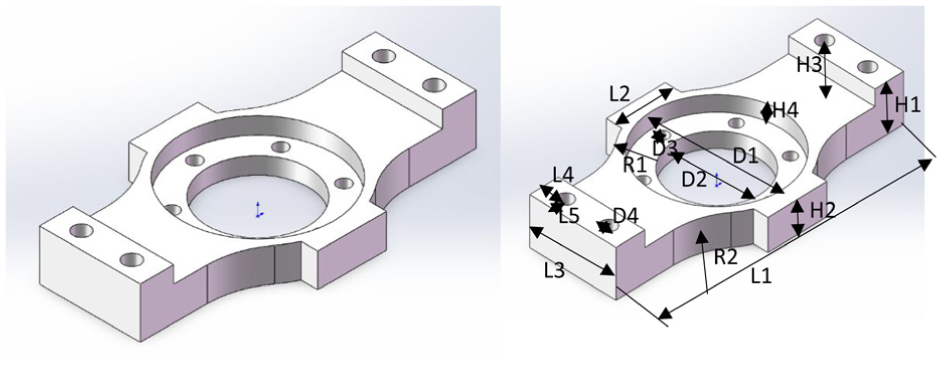
CAD model of the fastener used as the Level 4 (complex) case study, illustrating multiple arcs, holes, and constraints.
Scan model of the fastener requiring post-processing and CAD construction lines for radius measurements.
Inspection required multiple scan positions and additional CAD post-processing, with a total scanning and processing time of ∼4 min.
Level 5: Highly-complexity model
Highly complex products typically have many varied parts or elements, making them challenging to inspect and analyze comprehensively. They are characterized by a high involvement of features, aspects, and functional relationships, requiring careful study to understand and verify. 48 Camba et al. analyzed various metrics for quantifying CAD model complexity and concluded that the number of faces, edges, and vertices provides a reliable indicator of geometric complexity. 49
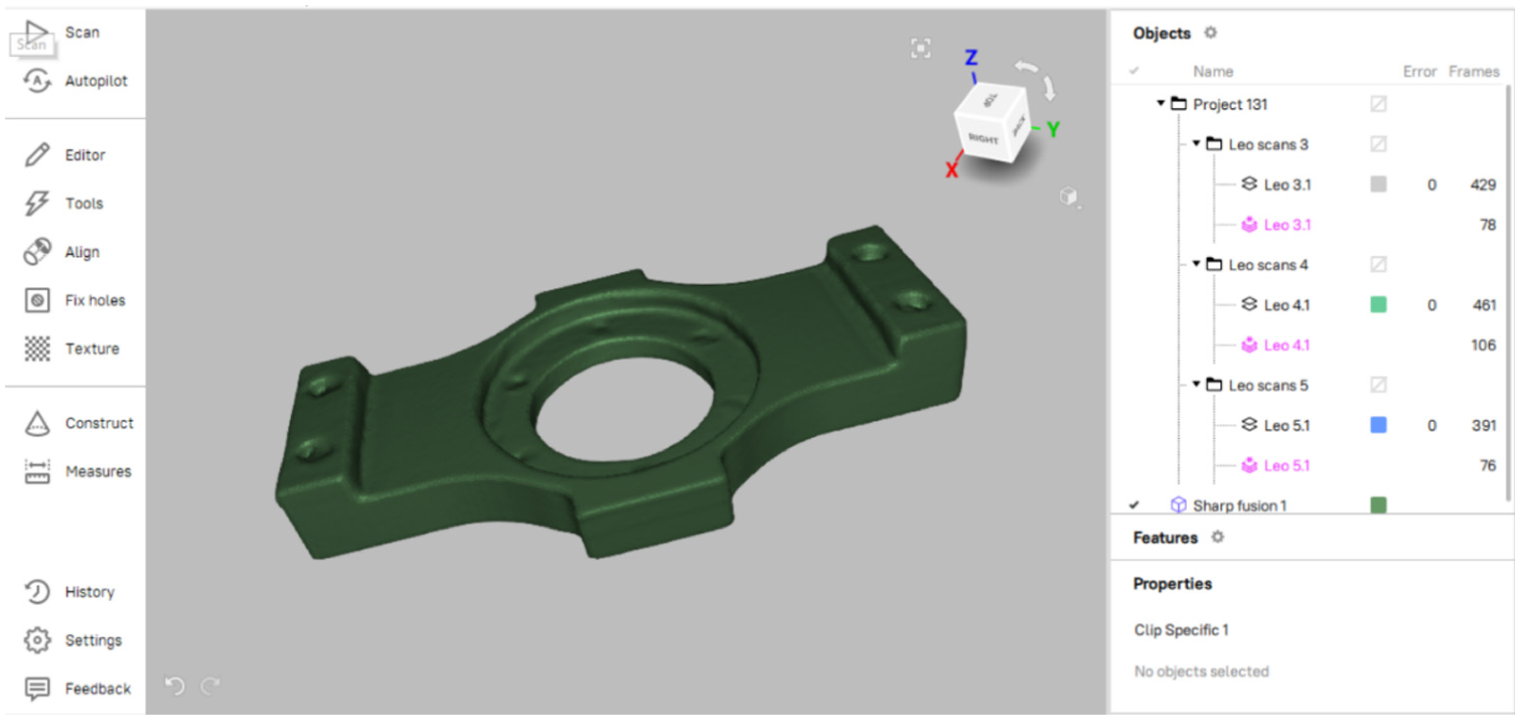
As shown in Figure 15, the tread model contains a much higher count of faces, edges, and vertices compared with lower-complexity examples. In addition to multiple lengths, heights, and radii, it includes irregular elements such as the circled blade, which is formed by overlapping cuts. These irregular curvatures elevate the classification to Level 5 and require very detailed scanning and computer-aided measurement to ensure complete capture.
Reconstructed scan model of the tread used as the Level 5 (high-complexity) case study, requiring multiple scan angles and rescans for full data completeness.
The exterior surface contains grooves between blades, creating occluded and recessed regions that are easily missed during a single-pass scan. Multiple scan angles and orientations are therefore required, often with repeated rescans to achieve data completeness. 27 The model is parametric, and the combination of high-level geometric elements increases functional dependencies, further complicating post-processing and feature verification. 50
During inspection, scan planning must balance completeness and efficiency: it is essential to capture all necessary dimensional details while avoiding redundant measurements that could prolong processing time. This confirms that inspection effort grows disproportionately at the highest complexity level, not only in data acquisition but also in subsequent CAD-based analysis.49,50
Summary of case demonstrations
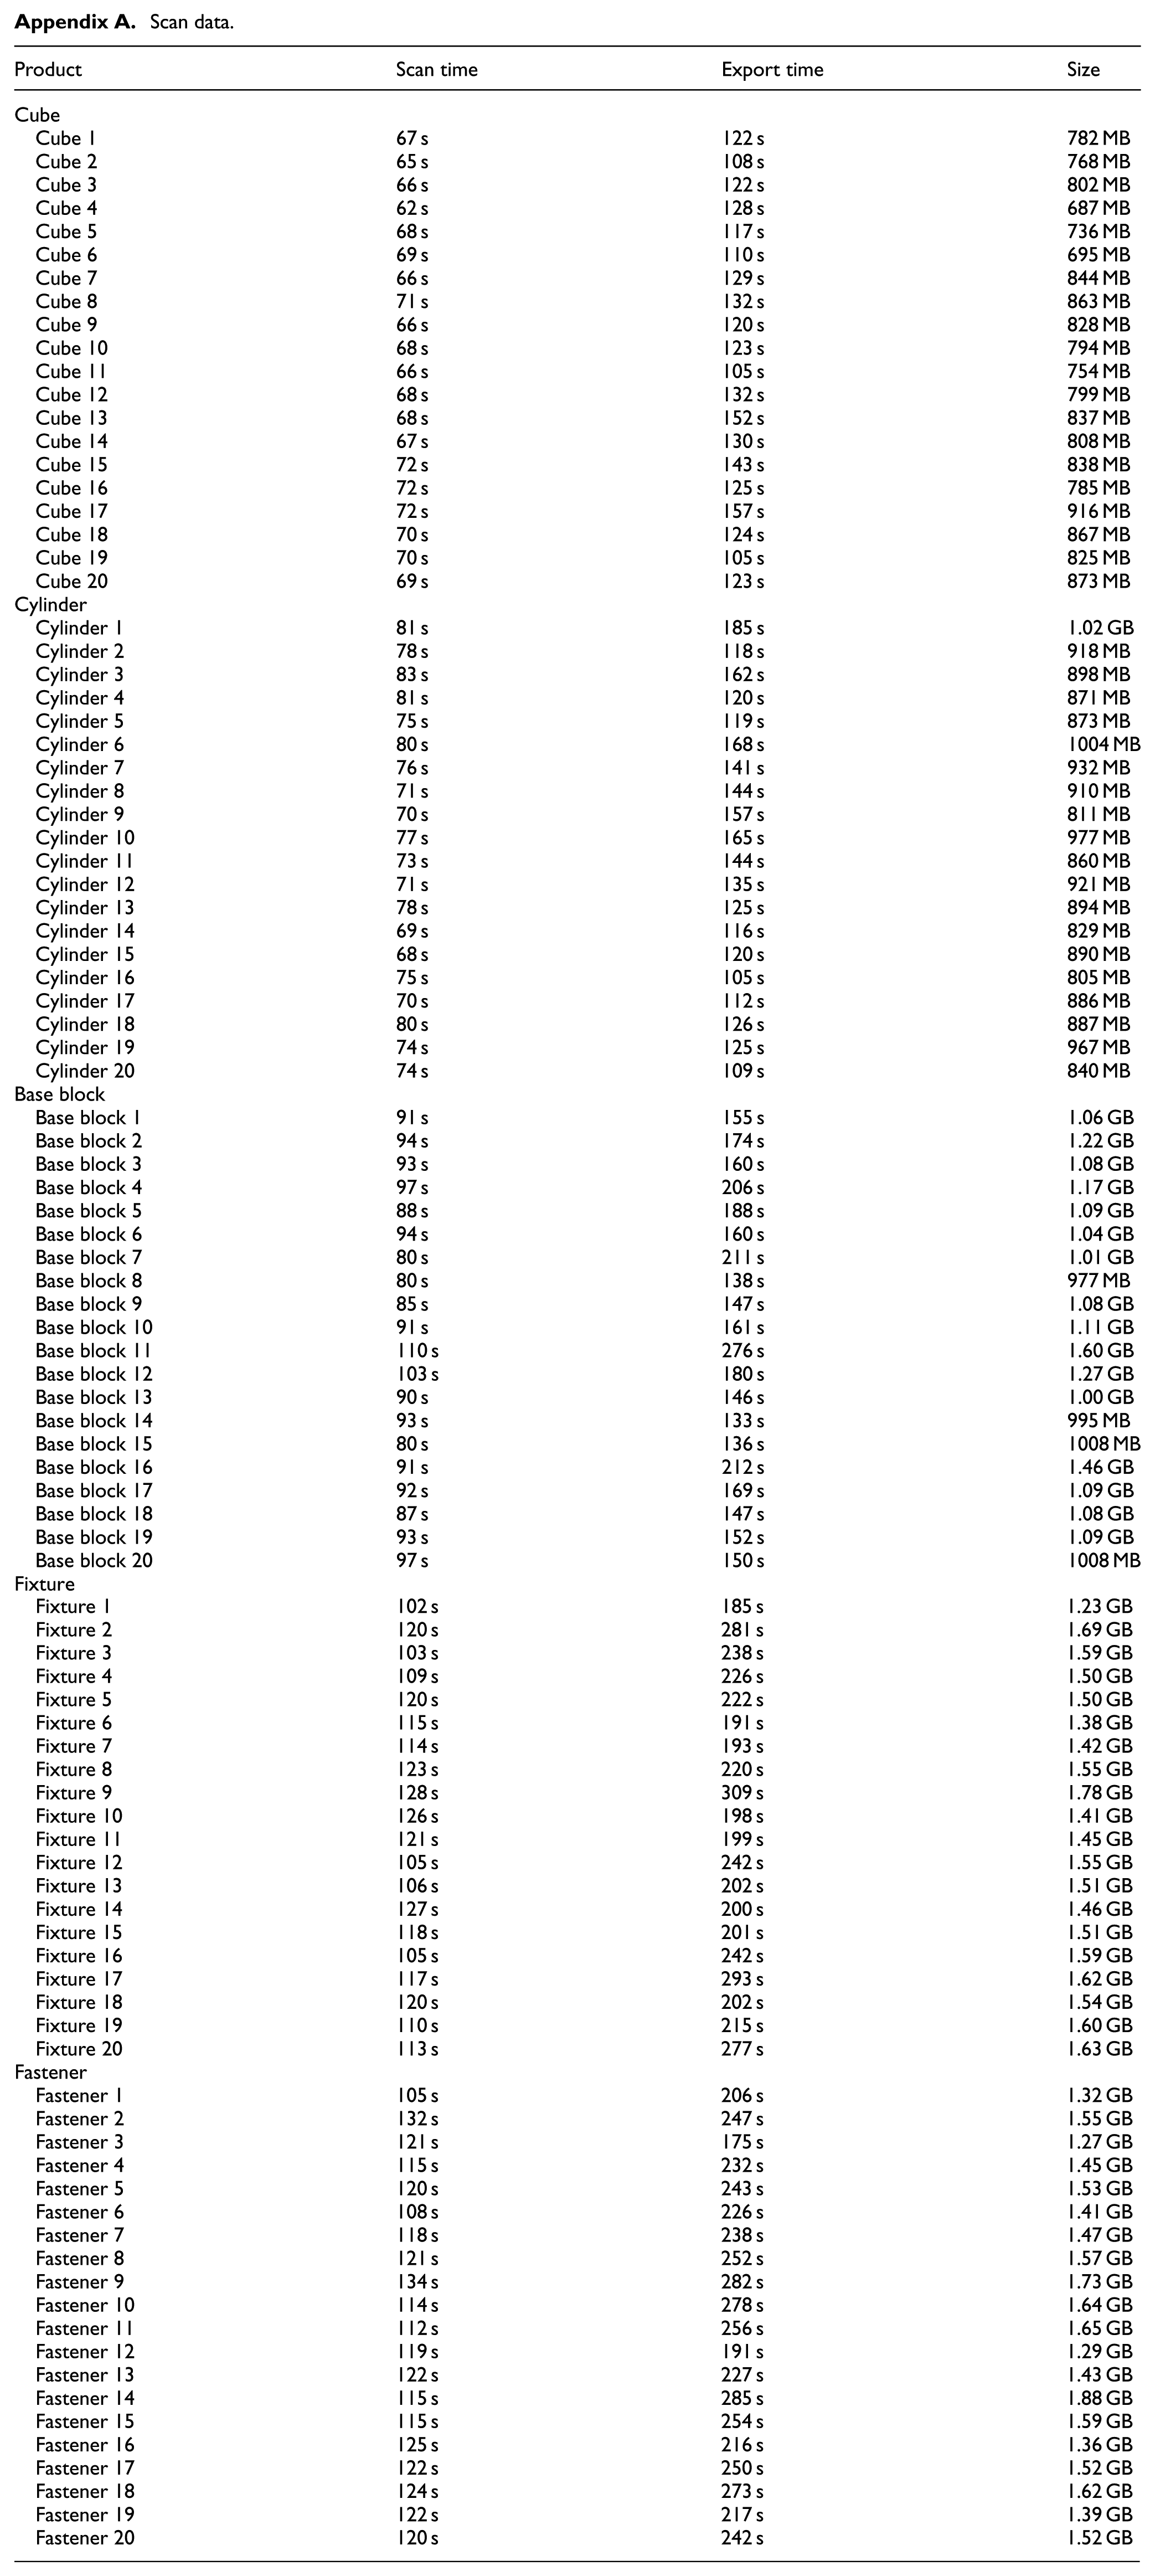
Table 2 consolidates the key observations for all five complexity levels, combining qualitative descriptions with quantitative results. The table summarizes the example parts, key geometric features, and scanning effort required at each level, and the average time to scan each sample part and the average time to export the scan model for further processing is recorded (each scan’s scan time and export time is available in Appendix A). All figures and detailed references for each case study are provided in Sections 4.1 to 4.5, ensuring full traceability of the data presented here.
Summary of case demonstrations with corresponding scanning effort and quantitative results.
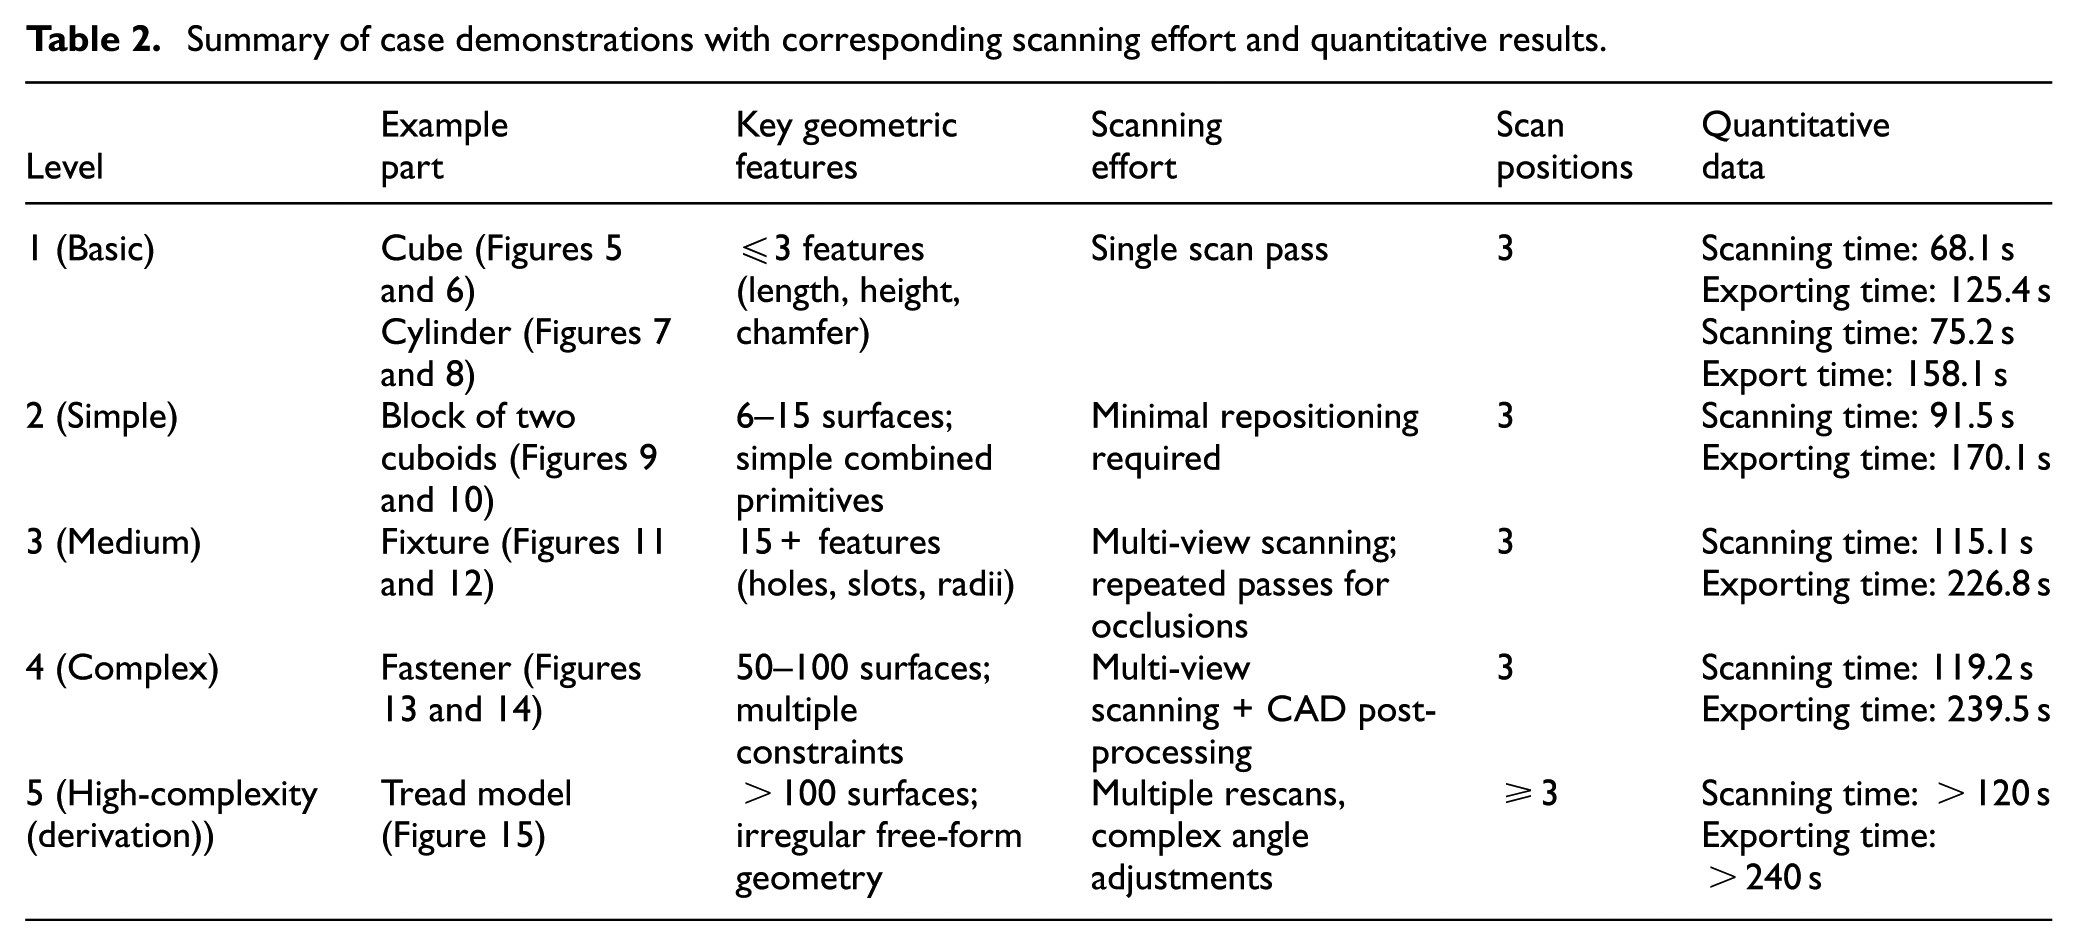
As seen in Table 2, scanning effort grows non-linearly with part complexity. Levels 1–2 required under 4.5 min, while Levels 4–5 exceeded 5 min totally and needed multiple rescans. This confirms the predictive value of the proposed classification framework.
Challenges, limitations, and opportunities
The application of 3D scanning for industrial inspection presents both technical and operational challenges that must be addressed to achieve robust and repeatable measurements. The experimental case demonstrations provide qualitative evidence that inspection effort increases with geometrical complexity as defined by the proposed five-level classification. Specifically, parts categorized at higher complexity levels required a greater number of scanning viewpoints and exhibited increased post-processing time, primarily due to feature interaction and occlusion rather than individual feature shape. This observation directly supports the structural complexity dimension of the framework, where closely positioned or mutually occluding features dominate inspection difficulty.
For example, while Levels 1 and 2 differ in numerical feature count, their similar feature accessibility resulted in comparable scanning effort. In contrast, Levels 4 and 5 introduced intersecting and nested features that significantly increased occlusion severity, requiring additional rescans to achieve acceptable coverage. Similar relationships between feature interaction and inspection effort have been reported in optical measurement planning studies, where geometric accessibility is identified as a primary driver of measurement uncertainty and effort. 51 However, the present results should be interpreted as illustrative rather than predictive, as no statistical repetition or cross-scanner comparison was conducted.
Technical challenges and limitations
One major source of difficulty lies in the scanner–surface interaction. Reflective, translucent, or highly textured surfaces often violate the Lambertian reflectance assumption on which structured-light and photogrammetric reconstruction pipelines rely. 40 This can result in missing data, specular highlights, or false correspondences. Mitigation strategies, such as applying matte coatings or using scanning sprays, introduce additional preparation steps and may not be suitable for delicate parts.11,26
Another challenge is feature visibility and occlusion. Deep holes, slots, or free-form undercuts frequently require multiple viewpoints and repositioning to achieve full coverage. 41 This increases scanning cycle time and data registration effort. In addition, highly detailed models result in large point clouds, which raise demands on memory, storage, and processing power. 27 For high-volume production inspection, computational bottlenecks can delay feedback to manufacturing operations.
A primary limitation of this study is the reliance on a single structured-light scanner and a limited set of demonstrative parts. While this controlled setup enables clear observation of how morphological complexity influences inspection effort, it restricts the generalizability of the findings across different scanner architectures, operators, and industrial environments. Previous studies have shown that scanner type, measurement strategy, and operator decisions can significantly affect point-cloud completeness and uncertainty, even for identical geometries. 23
And although metrological X-ray computed tomography (CT) is increasingly used in industrial inspection for components with inaccessible internal features, the drivers of inspection complexity in CT differ fundamentally from those of surface-based optical scanning. In CT-based metrology, measurement difficulty is primarily governed by material density, wall thickness, and X-ray attenuation behavior, which influence penetration depth, noise, and reconstruction artifacts, rather than feature visibility or line-of-sight accessibility.52,53 As a result, geometrically simple parts may present significant challenges for CT inspection, while highly occluded surface geometries that are difficult for optical scanners may be comparatively straightforward to reconstruct volumetrically. 54 Since the present study focuses on industrial surface-based inspection planning, where inspection effort is dominated by geometric accessibility, occlusion, and surface topology, CT-based inspection is considered outside the scope of this work.
Finally, in this study, only morphological geometric complexity was considered. Factors known to affect the reliability of optical measurements, such as material properties, surface treatments, and environmental conditions, are intentionally excluded to maintain attention to geometric accessibility and feature interaction. While these factors are critical in industrial practice, their inclusion would obscure the geometric effects that the proposed framework seeks to isolate.
Human and process-related challenges
Operator skill and decision-making significantly influence data quality. Choices such as scan angle, focal length, scanner trajectory, and fixture arrangement determine the completeness and repeatability of point clouds.51,55 Inconsistent workflows risk introducing systematic errors or leaving unmeasured regions. Such human-in-the-loop effects complicate the definition of universal thresholds for complexity levels, reinforcing that the current framework should be interpreted as a guideline rather than a standardized rule set.
Environmental conditions also play a non-negligible role. Ambient light, background contrast, vibration, and temperature variation can all affect scanner performance.26,29 For instance, structured-light systems are particularly sensitive to stray illumination, while laser scanners can be disrupted by airborne particulates or reflective floor surfaces. 34
Data management and integration challenges
As scanning resolution increases, point clouds and mesh models become significantly larger, introducing challenges for data storage, transmission, and real-time visualization.10,27 In a production setting, these large datasets must be efficiently managed to avoid inspection becoming a throughput bottleneck. Moreover, scanned data often lacks parametric feature history, requiring reverse engineering or CAD reconstruction for full feature-based inspection.49,50 Integration of scan data into PLM, MES, or QMS systems is still limited in many industries, leaving a gap between digital capture and actionable process improvement. 10
Opportunities for advancement
These challenges open several promising research and industrial opportunities.
Automation and robotics: Robotic arms combined with structured-light scanners can automate viewpoint planning and reduce operator variability. 51 Adaptive path planning can dynamically adjust scanning strategy based on occlusion detection. 35
Multi-sensor and hybrid approaches: Combining optical scanning with CMM measurement enables traceable, high-accuracy inspection for critical features while retaining speed for free-form surface capture. 56 Multi-sensor fusion (e.g. integrating photogrammetry for global alignment) can reduce registration error and improve completeness. 41
AI and data-driven inspection: Machine learning can be leveraged to automatically identify missing coverage, predict occlusions, and filter noise. 33 AI-assisted feature extraction may eventually support real-time GD&T compliance checks.
Digital twin integration: Linking scanned data with digital twin models enables automated deviation analysis and process feedback, closing the loop between design, manufacturing, and inspection. 10
Standardization of complexity metrics: The proposed five-level classification can serve as a foundation for industry standards, supporting benchmarking and enabling meaningful comparisons across scanners, workflows, and production sites.5,9
Role of complexity classification
The results of this study suggest that complexity classification can act as a decision-support tool for aligning scanner selection, inspection planning, and resource allocation. By categorizing parts according to numerical, structural, and variational complexity, manufacturers can:
Choose the appropriate scanner type or combination of modalities.
Estimate scanning cycle time and post-processing effort more accurately. 27
Optimize inspection cell layout and fixture design. 51
Balance cost and accuracy by applying high-precision methods only where required. 56
This structured approach supports more predictable inspection performance and helps manufacturers transition from manual, ad hoc scanning to fully integrated, digitally managed inspection processes. 10
A key limitation of the proposed framework lies in the context-dependent nature of geometric complexity. Feature accessibility, occlusion severity, and scanning difficulty depend not only on geometry but also on scanner type, measurement strategy, and operator decisions. As a result, parts located near classification boundaries may shift between complexity levels under different inspection conditions. This behavior is consistent with prior findings that inspection complexity cannot be fully decoupled from process context. 36
Accordingly, the framework should be interpreted as a decision-support tool rather than a rigid classification standard, intended to guide inspection planning rather than replace expert judgment.
Conclusion
This study has developed and validated a five-level complexity classification framework for product inspection using 3D scanning. By integrating insights from literature, a comparative SWOT analysis of major scanner types, and empirical case demonstrations, the framework provides a reproducible method for categorizing inspection complexity based on geometric features and their interrelationships.
The proposed classification defines complexity along three primary dimensions: numerical, structural, and variational, allowing a systematic mapping between product characteristics and inspection requirements. Quantitative data from the case studies (Table 2) confirm that scanning effort increases non-linearly with complexity level: Levels 1–2 required <2 min with minimal repositioning, while Levels 4–5 required multiple scan positions, rescans, and significant post-processing to achieve over 95% data completeness.
These findings demonstrate that the framework not only provides descriptive classification but also serves as a predictive tool for estimating scanning workload, planning viewpoints, and anticipating data processing effort. Importantly, the framework supports informed scanner selection, inspection strategy development, and cycle-time estimation, helping manufacturers strike a balance between inspection accuracy, throughput, and cost.
Beyond its immediate application, this work contributes to the broader effort of standardizing inspection workflows within the context of Industry 4.0. Complexity classification offers a decision-support tool for hybrid inspection strategies, automated path planning, and resource allocation in smart manufacturing environments.
Future work will include multi-scanner experiments comparing structured-light, laser triangulation, and photogrammetric systems across identical geometries, with repeated measurements to quantify variability. Regression analysis will be used to correlate complexity indicators with scanning time, completeness, and uncertainty. And will also focus on refining the quantitative metrics underpinning each complexity level, including surface curvature indices, hole aspect ratios, and mesh density requirements. Broader validation will be performed across a more diverse set of industrial parts, materials, and scanning modalities, including laser and photogrammetric systems. Additionally, integration of the classification framework into automated inspection planning and digital twin systems will be explored, with the goal of enabling real-time complexity-aware scanning workflows.
Footnotes
Appendix
Scan data.
| Product | Scan time | Export time | Size |
|---|---|---|---|
| Cube | |||
| Cube 1 | 67 s | 122 s | 782 MB |
| Cube 2 | 65 s | 108 s | 768 MB |
| Cube 3 | 66 s | 122 s | 802 MB |
| Cube 4 | 62 s | 128 s | 687 MB |
| Cube 5 | 68 s | 117 s | 736 MB |
| Cube 6 | 69 s | 110 s | 695 MB |
| Cube 7 | 66 s | 129 s | 844 MB |
| Cube 8 | 71 s | 132 s | 863 MB |
| Cube 9 | 66 s | 120 s | 828 MB |
| Cube 10 | 68 s | 123 s | 794 MB |
| Cube 11 | 66 s | 105 s | 754 MB |
| Cube 12 | 68 s | 132 s | 799 MB |
| Cube 13 | 68 s | 152 s | 837 MB |
| Cube 14 | 67 s | 130 s | 808 MB |
| Cube 15 | 72 s | 143 s | 838 MB |
| Cube 16 | 72 s | 125 s | 785 MB |
| Cube 17 | 72 s | 157 s | 916 MB |
| Cube 18 | 70 s | 124 s | 867 MB |
| Cube 19 | 70 s | 105 s | 825 MB |
| Cube 20 | 69 s | 123 s | 873 MB |
| Cylinder | |||
| Cylinder 1 | 81 s | 185 s | 1.02 GB |
| Cylinder 2 | 78 s | 118 s | 918 MB |
| Cylinder 3 | 83 s | 162 s | 898 MB |
| Cylinder 4 | 81 s | 120 s | 871 MB |
| Cylinder 5 | 75 s | 119 s | 873 MB |
| Cylinder 6 | 80 s | 168 s | 1004 MB |
| Cylinder 7 | 76 s | 141 s | 932 MB |
| Cylinder 8 | 71 s | 144 s | 910 MB |
| Cylinder 9 | 70 s | 157 s | 811 MB |
| Cylinder 10 | 77 s | 165 s | 977 MB |
| Cylinder 11 | 73 s | 144 s | 860 MB |
| Cylinder 12 | 71 s | 135 s | 921 MB |
| Cylinder 13 | 78 s | 125 s | 894 MB |
| Cylinder 14 | 69 s | 116 s | 829 MB |
| Cylinder 15 | 68 s | 120 s | 890 MB |
| Cylinder 16 | 75 s | 105 s | 805 MB |
| Cylinder 17 | 70 s | 112 s | 886 MB |
| Cylinder 18 | 80 s | 126 s | 887 MB |
| Cylinder 19 | 74 s | 125 s | 967 MB |
| Cylinder 20 | 74 s | 109 s | 840 MB |
| Base block | |||
| Base block 1 | 91 s | 155 s | 1.06 GB |
| Base block 2 | 94 s | 174 s | 1.22 GB |
| Base block 3 | 93 s | 160 s | 1.08 GB |
| Base block 4 | 97 s | 206 s | 1.17 GB |
| Base block 5 | 88 s | 188 s | 1.09 GB |
| Base block 6 | 94 s | 160 s | 1.04 GB |
| Base block 7 | 80 s | 211 s | 1.01 GB |
| Base block 8 | 80 s | 138 s | 977 MB |
| Base block 9 | 85 s | 147 s | 1.08 GB |
| Base block 10 | 91 s | 161 s | 1.11 GB |
| Base block 11 | 110 s | 276 s | 1.60 GB |
| Base block 12 | 103 s | 180 s | 1.27 GB |
| Base block 13 | 90 s | 146 s | 1.00 GB |
| Base block 14 | 93 s | 133 s | 995 MB |
| Base block 15 | 80 s | 136 s | 1008 MB |
| Base block 16 | 91 s | 212 s | 1.46 GB |
| Base block 17 | 92 s | 169 s | 1.09 GB |
| Base block 18 | 87 s | 147 s | 1.08 GB |
| Base block 19 | 93 s | 152 s | 1.09 GB |
| Base block 20 | 97 s | 150 s | 1008 MB |
| Fixture | |||
| Fixture 1 | 102 s | 185 s | 1.23 GB |
| Fixture 2 | 120 s | 281 s | 1.69 GB |
| Fixture 3 | 103 s | 238 s | 1.59 GB |
| Fixture 4 | 109 s | 226 s | 1.50 GB |
| Fixture 5 | 120 s | 222 s | 1.50 GB |
| Fixture 6 | 115 s | 191 s | 1.38 GB |
| Fixture 7 | 114 s | 193 s | 1.42 GB |
| Fixture 8 | 123 s | 220 s | 1.55 GB |
| Fixture 9 | 128 s | 309 s | 1.78 GB |
| Fixture 10 | 126 s | 198 s | 1.41 GB |
| Fixture 11 | 121 s | 199 s | 1.45 GB |
| Fixture 12 | 105 s | 242 s | 1.55 GB |
| Fixture 13 | 106 s | 202 s | 1.51 GB |
| Fixture 14 | 127 s | 200 s | 1.46 GB |
| Fixture 15 | 118 s | 201 s | 1.51 GB |
| Fixture 16 | 105 s | 242 s | 1.59 GB |
| Fixture 17 | 117 s | 293 s | 1.62 GB |
| Fixture 18 | 120 s | 202 s | 1.54 GB |
| Fixture 19 | 110 s | 215 s | 1.60 GB |
| Fixture 20 | 113 s | 277 s | 1.63 GB |
| Fastener | |||
| Fastener 1 | 105 s | 206 s | 1.32 GB |
| Fastener 2 | 132 s | 247 s | 1.55 GB |
| Fastener 3 | 121 s | 175 s | 1.27 GB |
| Fastener 4 | 115 s | 232 s | 1.45 GB |
| Fastener 5 | 120 s | 243 s | 1.53 GB |
| Fastener 6 | 108 s | 226 s | 1.41 GB |
| Fastener 7 | 118 s | 238 s | 1.47 GB |
| Fastener 8 | 121 s | 252 s | 1.57 GB |
| Fastener 9 | 134 s | 282 s | 1.73 GB |
| Fastener 10 | 114 s | 278 s | 1.64 GB |
| Fastener 11 | 112 s | 256 s | 1.65 GB |
| Fastener 12 | 119 s | 191 s | 1.29 GB |
| Fastener 13 | 122 s | 227 s | 1.43 GB |
| Fastener 14 | 115 s | 285 s | 1.88 GB |
| Fastener 15 | 115 s | 254 s | 1.59 GB |
| Fastener 16 | 125 s | 216 s | 1.36 GB |
| Fastener 17 | 122 s | 250 s | 1.52 GB |
| Fastener 18 | 124 s | 273 s | 1.62 GB |
| Fastener 19 | 122 s | 217 s | 1.39 GB |
| Fastener 20 | 120 s | 242 s | 1.52 GB |
Acknowledgements
Special thanks Queen’s University kind contributions of the workpieces, which was critical to the success of the project.
Funding
The authors received no financial support for the research, authorship, and/or publication of this article.
Declaration of conflicting interests
The authors declared no potential conflicts of interest with respect to the research, authorship, and/or publication of this article.