
Abstract
In this research, forming limit diagram (FLD) of aluminum alloy 1050 (AA 1050) sheet produced by Accumulative Roll Bonding (ARB) is investigated numerically and experimentally. The Gurson-Tvergaard-Needleman (GTN) ductile damage model is used to predict sheet failure and obtain its FLD using numerical simulation in Abaqus/Explicit. Nucleation and growth of voids in the material during the deformation is the basic concept of the GTN damage model. This damage model has nine basic parameters that obtaining through experimental tests is time-consuming and costly, and in some cases, impossible. Thus, the present study tries to obtain the above parameters for fine-grained aluminum 1050 fabricated by ARB using the finite element method. Therefore, after considering each parameter’s interval, numerical simulation and the anti-inference method are used in the uniaxial tensile test to identify GTN parameters for the AA 1050 sheet using FEM. The optimum parameters of the GTN model are used in the FEM of the Nakazima test for FLD prediction. Also, The FLD of the fine-grained aluminum sheet is obtained experimentally using the Nakazima test. Finally, the numerical and experimental FLDs are compared for validation.
Keywords
Introduction
The properties of metals and alloys are affected by material and alloy composition and depend on their internal structure dimensions. Due to fine-grained materials’ unique properties, such as high strength at ambient temperature and excellent corrosion resistance, human beings have always sought to produce materials with fine structure and grains.
First, a definition of ultrafine-grained material (UFG) is provided. Due to polycrystalline materials’ properties, UFG refers to materials with a medium-sized grained less than 1 µm. For bulk UFG materials, there are other conditions, such as the relative uniformity of microstructure, co-orientation, and the majority of fine-grain boundaries having high angles of dislocation. 1
The severe plastic deformation (SPD) approach is one way to produce fine-grained materials that have been considered in recent decades. In these methods, by applying severe plastic deformation to the metal, they cause microstructural changes and change the material’s structure to the nanometer scale. 2 The SPD methods can be classified into two categories depending on the product geometry of this process. These two involve severe deformation of bulk and sheet materials. Although these processes are not significantly different from the microstructural changes, and they all undergo SPD, they will differ in terms of the distribution of stress and strain fields in the metal, which is under deformation.
Since the present study focuses on fine-grained sheets, the fabrication of fine-grained sheet metals is briefly discussed. These methods can be noted as equal channel angular rolling (ECAR),3,4 accumulative roll bonding (ARB),5–8 repetitive corrugation and straightening (RCS),9,10 constrained groove pressing (CGP),11,12 differential speed rolling (DSR).13,14
Fine-grained aluminum alloy sheets, as lightweight metals, are widely used in various industries such as aerospace and automotive industries. Therefore, this sheet’s formability and fracture prediction are essential and remarkable for researchers in this field. Whereas the fracture of the aluminum alloy sheet in the forming processes is ductile, the GTN damage model is a useful fracture prediction model. The GTN model is based on the nucleation and growths of voids in the sheet metals during the deformation.
Kami et al. 15 used the response surface method (RSM) and the GTN damage model to predict the FLD of Bondal sheets. They used a bulge test to calibrate these parameters. The results indicated that the GTN method could reasonably predict the FLD of a bonded sheet. Wcislik 16 used a scanning electron microscope (SEM) and tensile test to obtain the final void volume fraction (f_f) of S355J2G3 steel. Then, by simulating the tensile test and using the GTN model, a good match was obtained between the numerical and experimental results. Safdarian 17 used the GTN model for FLD prediction of the 6061 aluminum sheet. The results indicated that the numerical results are very close to the experimental ones for punch’s load-displacement and FLD. Peng et al. 18 used various methods to predict sheet failure in the hydroforming process. Comparing the results shows the superiority of M-K and GTN-Thomason methods in predicting the first failure’s final pressure and height. Safdarian 19 used the GTN damage model to predict the FLD of AISI304-St12 tailor-welded blanks. Experimental tests of FLD were done based on the Nakazima test to verify the numerical results. The GTN parameters were identified for both sides of TWBs (AISI304 and St12 sheets). Wang and Li 20 used the GTN method to predict fracture in BR1500HS steel. They obtained the GTN parameters for this steel by using the RSM method and the tensile test simulation. Finally, a comparison of simulation results and SEM observations showed a good correlation between experimental and numerical results. Safdarian 21 used the RSM and anti-inference method and numerical simulation of the uniaxial tensile test to identify the GTN parameters of AA 1050. Then, the GTN damage model was used for fracture prediction of AA1050 sheet in the single point incremental forming process. Safdarian22–24 used the GTN model to predict the tube fracture in the FEM of the rotary draw bending (RDB) process. The results showed that the GTN model had good accuracy in predicting the fracture location in the RDB process’s numerical simulations. The GTN damage model was used in Kami et al., 25 Gholipour et al., 26 and Abbasi et al. 27 for fracture prediction as well as FLD prediction in various sheet metal forming processes. Other damage criteria such as Lemaitre damage model was used by other researchers for fracture prediction in sheet metal forming. Kumar et al. 28 used Lemaitre damage model for failure prediction in Single Point Incremental Forming (SPIF). Fracture in this process was predicted by Lemaitre damage model in the numerical simulation using Abaqus/Explicit. Amaral et al. 29 used three different damage models of Lemaitre, GTN and Johnson-Cook models for fracture prediction of 5182 aluminum alloy sheets in the metal forming process. The results indicated that GTN and Lemaitre had a good agreement with the fracture location observed in the experimental samples. Zhang et al. 30 used the GTN damage model in the hydro-forming of the rectangular tube to predict damage evolution. The effect of friction coefficient on the corner filling was studied using experimental and numerical tests.
In this research, forming limit diagram (FLD) of aluminum alloy 1050 (AA 1050) sheet produced by Accumulative Roll Bonding (ARB) is investigated numerically and experimentally. The Gurson-Tvergaard-Needleman (GTN) ductile damage model is used to predict sheet failure and obtain its FLD using numerical simulation in Abaqus/Explicit. The RSM is coupled with the FEM to identify the GTN parameters. Therefore, different sets of GTN parameters are used in the numerical simulation of the uniaxial tensile test in the Abaqus/Explicit. Then, the optimum parameters of GTN which are extracted from the comparison of numerical and experimental stress-strain curves are used in the numerical FLD tests The ARB process is a subset of severe plastic deformation (SPD) methods, so it is associated with a sharp reduction in formability. On the other hand, the significant increase in strength has attracted more attention from researchers and craftsmen. Therefore, a proper understanding of the formability of these materials produced with ARB by performing standard and practical tests such as FLD for using in various industries seems necessary. The next challenge is the problems of experimental test that can be solved by considering numerical methods with high accuracy. In this research, both methods have been investigated for the first time.
Research methodology
Raw materials
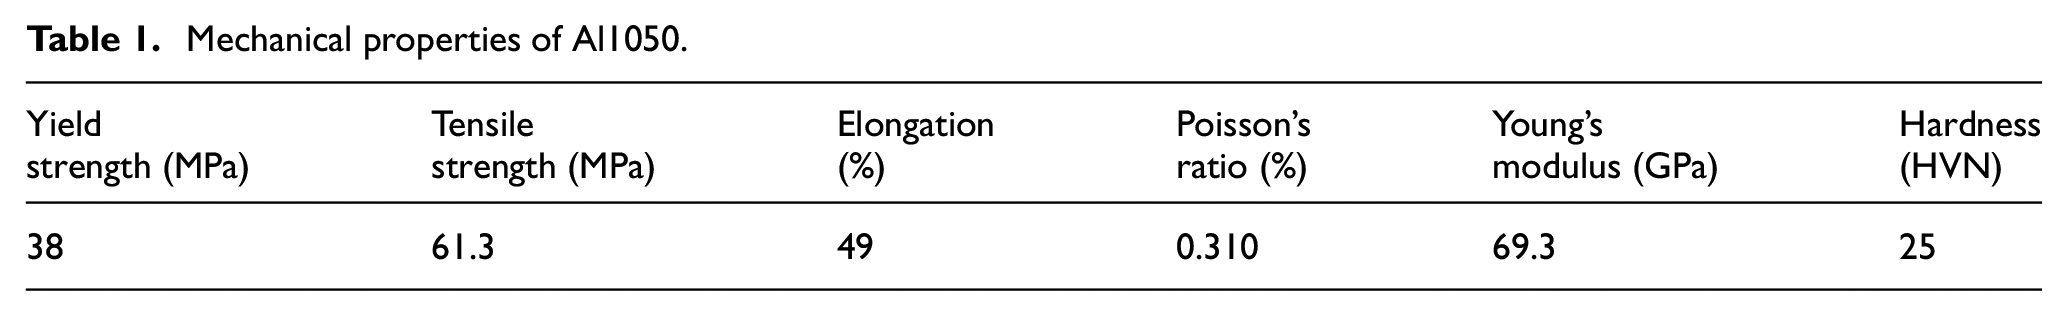
The 1050 aluminum alloy sheet with mechanical properties presented in Table 1 is used in this study. Before the accumulative roll bonding process, the aluminum samples were first treated for an hour at 380°C under annealing treatment and cooled in the furnace by air.
Mechanical properties of Al1050.
Accumulative roll bonding
In this study, the ARB process was used to produce a fine-grained aluminum sheet. Figure 1 shows the ARB process’s schematic. Two similar sheets were first prepared by surface treatment to perform each pass, including brushing (using a stainless steel wire brush) and degreasing (by acetone). The two prepared sheets were stacked on each other and roll bonded. After roll bonding, the thickness was reduced by 50%. After each pass, the sheet in the rolling direction is cut into two equal pieces, and the ARB process is repeated. Rolling operations were carried out in seven passes, and fine-grained AA1050 was produced. Because of the creation of deep cracks in the sheet’s edges at the eighth pass, just seven passes were used for ARB. The reason for these cracks was the increase in strength and work-hardening.
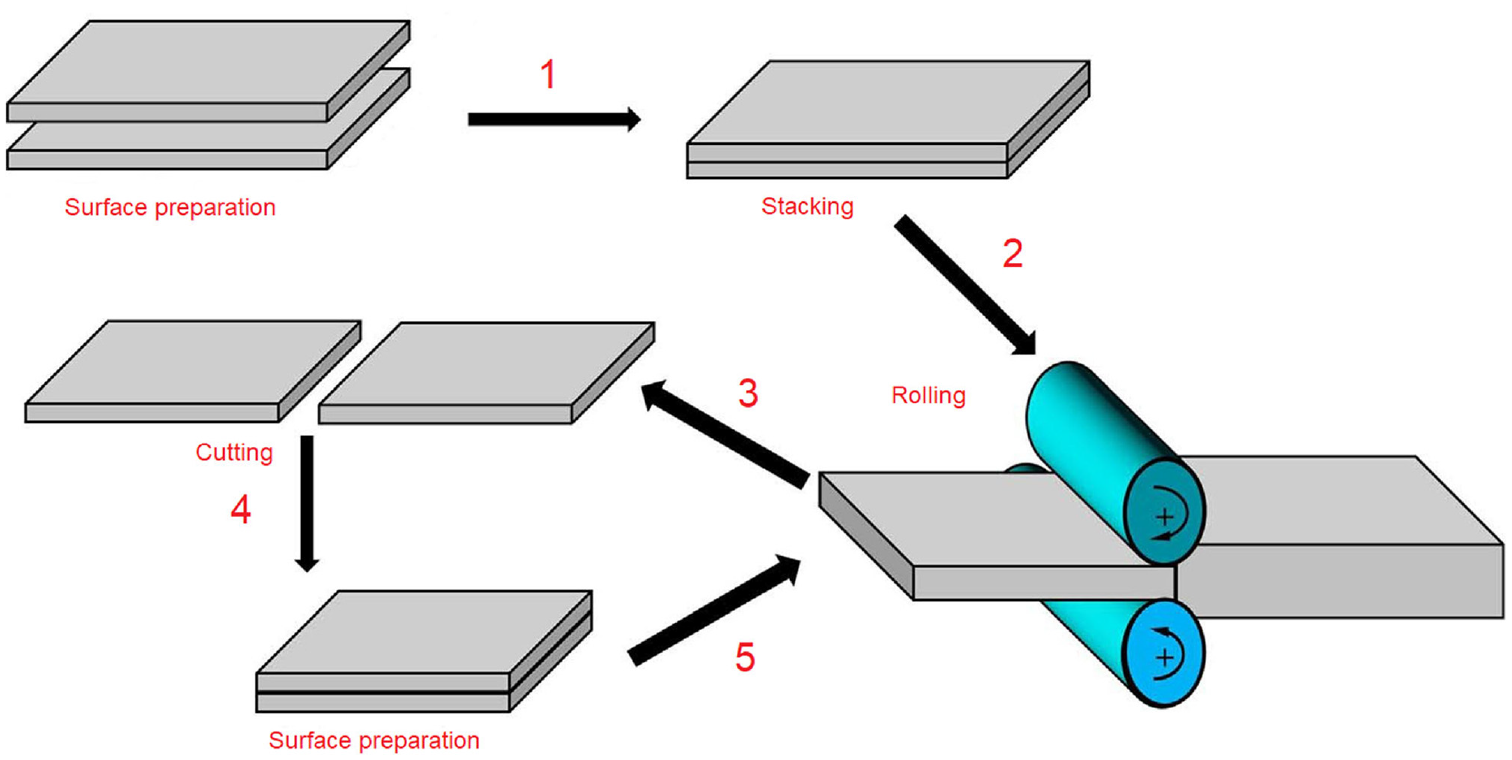
Schematical presentation of ARB process.
Then, the tensile test samples were cut according to the ASTM E8/E8M-9 standard with a wire-cut machine. Tensile tests were performed by SANTAM-STM50 machine at room temperature with displacement rate of 0.5 mm/min and a stress-strain curve was extracted for each sample.
Experimental tests for FLD
The FLD samples (eight samples) were cut from the ARB sheets in the rolling direction based on the dimension of Figure 2. According to Figure 2, four rectangular specimens are used to obtain the right side of the curve, and dumbbell specimens are used to determine the curve’s left side.
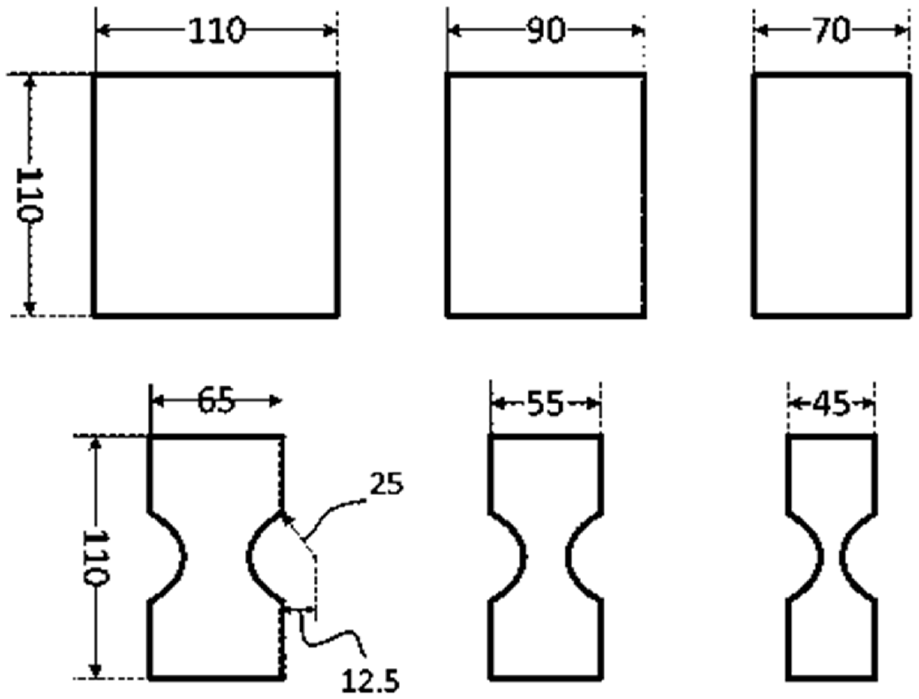
FLD samples with a quarter ratio (all dimensions are in mm).
The FLD samples were grid marked with circles (2.5 mm diameter) by the electrochemical etching method before the FLD test to measure the surface strains after forming test and after the test, the large and small diameters of the formed ellipses were measured using a traveling microscope.
First, the prepared sheet sample was placed on the die and was fixed between the die and blank holder. Then, the sheet was placed on the SANTAM S20, which is equipped with a load-displacement acquisition system. In the next step, after the punch was tangential to the sheet’s surface, the punch was moved downward and stretched the sheet. This process continued until the fracture happen in the sheet. The sheet failure can be detected by a drop in the load-displacement diagram. In this case, the test must be stopped. This method was used in all the FLD tests.
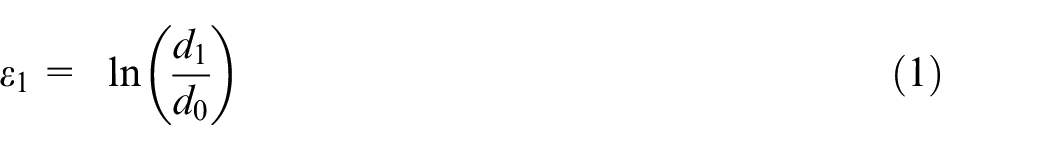
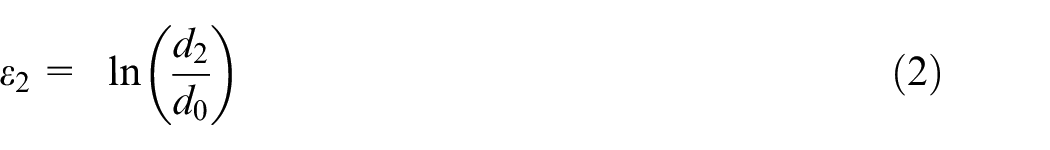
As mentioned before, to plot the FLD, minor and major strains must be measured from the sample surface near the fracture area. These strains were measured by a vernier microscope for all eight samples. The circular grids that were etched on the specimen before the FLD test were converted to the ellipse (e.g. after the forming process). The major and minor strains can be calculated by measuring the large and small ellipse diameters, which are
The GTN damage model
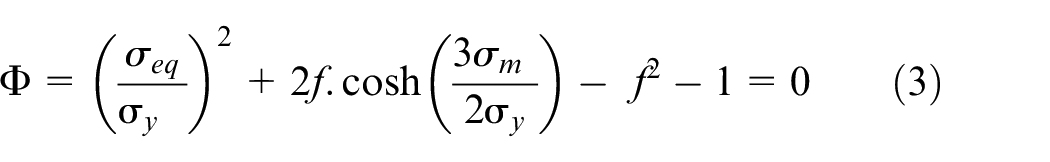
There are different models of material degradation called damage. When a material is subjected to an increasing uniform loading, and the material undergoes plastic deformation, ductile damage occurs. Ductile damage begins mainly with the nucleation of micro-cavities, mostly in weak areas such as grain boundaries. With the growth and coalescence of these voids, cracks are formed. One of the models that can predict the fracture of such materials is the GTN model. Gurson 31 first simulated a spherical void in a unit cell. He came up with the following equation by considering the impact of these voids on the yield surface:
where
The relation between
where

The plastic incompressibility of circumambient matrix of the voids based on the mass balance in representative volume elements is used to specify the void growth rate.
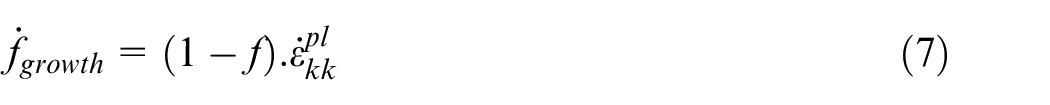
where
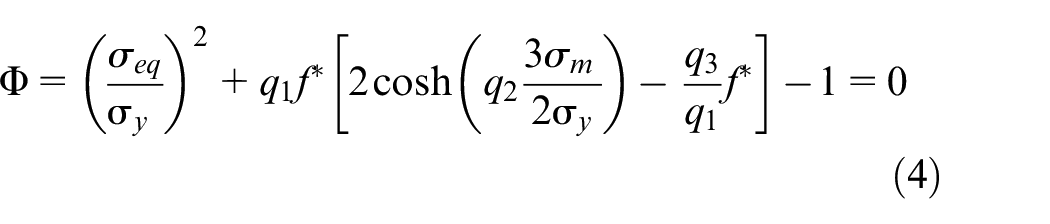
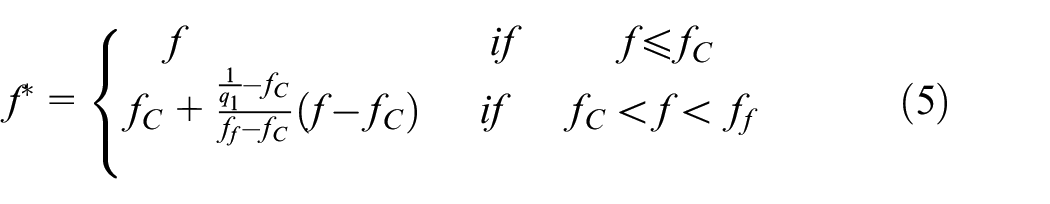
Chu and Needleman 34 also found the following equation by considering the relationships between the growth and coalescence of voids:
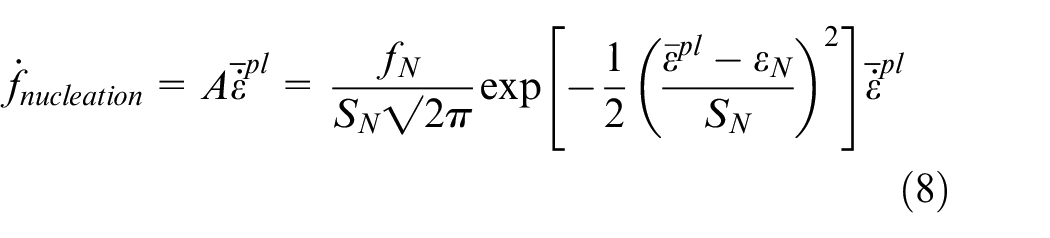
where
Numerical simulation
Due to the unknown GTN parameters for the fine-grained AA1050 sheet, the approximate values for these parameters are required. The results of Kacem et al. 35 research were used as the baseline values. These results are presented in Table 2.
GTN parameters of AA1050. 35
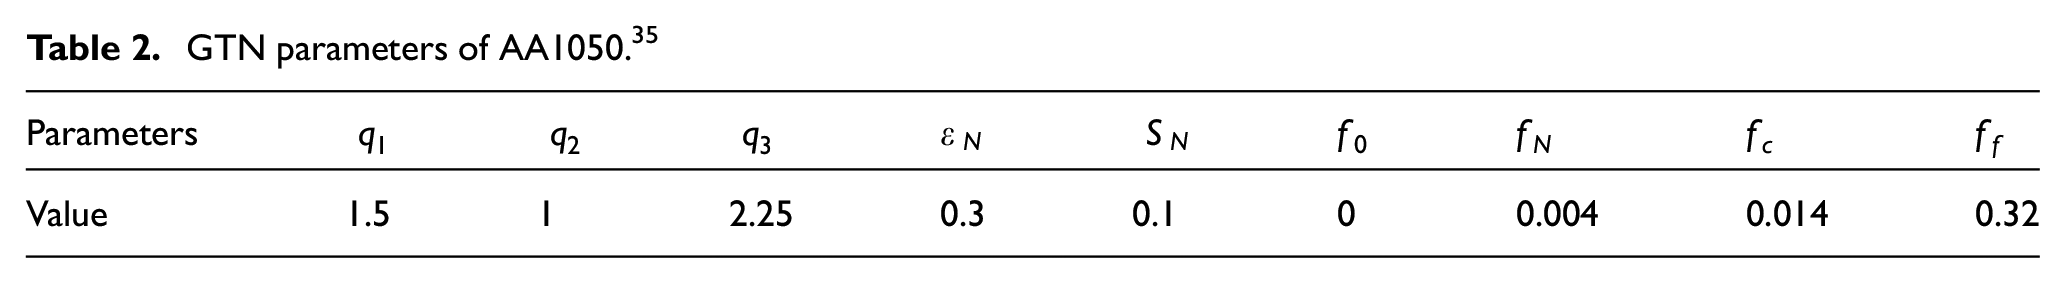
Because of differences in the structure of the AA1050 and the fine-grained AA1050, it is clear that the presented parameters in Table 2 are not suitable for fine-grained AA1050. The Design of Experiments (DOE) based on the RSM and numerical simulation of the tensile test was used to estimate the unknown parameters of GTN damage model. Therefore, according to Table 2 and Safdarian’s research,
21
an interval has been determined to predict the unknown parameters. It is necessary to mention that in this study,
The range specified for unknown parameters.
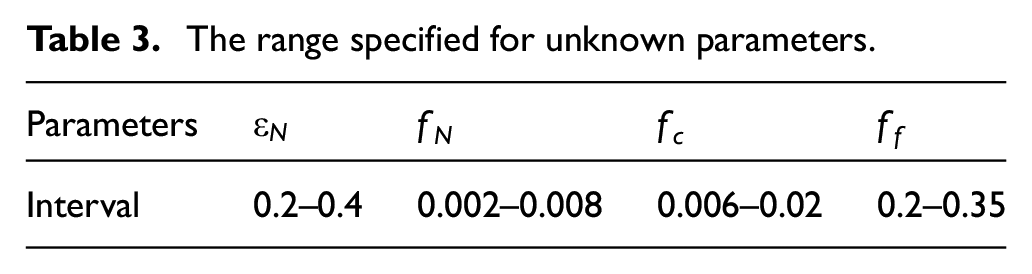
As Table 4 shows, 30 runs were prepared based on the information in Table 3 and using the RSM. The tensile test is one of the mechanical tests used to estimate the GTN damage model’s parameters. For this purpose, the tensile test sample is modeled in the Abaqus/Explicit. As shown in Figure 3, because of the tensile test sample’s symmetrical geometry just half of the sample was modeled to speed up the analysis. A dynamic/Explicit solution was used to simulate this test. The shell element S4R was used to me the tensile sample.
DOE for tensile test simulation.
Numerical sample of tensile test.
According to Table 4, 30 uniaxial tests were modeled and simulated in the Abaqus software. The aim is to find the first element which starts to damage in each numerical simulation. When VVF exceeds the ff for one of the elements of the sample, the element is damaged. The stress-strain curve of the fractured element was compared with the experimental result for all 30 numerical tests. The optimum GTN parameters were extracted from any test in which the difference between the experimental and numerical stress-strain curves was minimum.
After simulating the tensile test and obtaining the GTN damage model’s parameters for the fine-grained aluminum 1050 sheet, it is time to obtain the FLD by simulating the Nakazima test. As Figure 4 shows, the Nakazima die was modeled in the Abaqus/explicit.
The experimental (a) and numerical (b) model of Nakazima test in Abaqus/explicit.
It should be noted that punch, blank holder, and die were considered analytical rigid bodies because their deformation was negligible. The sheet was modeled as a deformable part using C3D8R (An 8-node linear brick). The friction coefficient in the punch-sheet contact was 0.08, in the die-sheet and blank holder-sheet contact was 0.1. According to related research, there are two approaches to applying friction coefficient between the sheet and forming components. In the first approach, a similar friction coefficient is considered between sheet surface and punch, sheet surface and blank holder, and sheet surface and die. In the second approach, because the punch surface is smoother than the surface of other forming components (die and blank holder), the friction coefficient between the sheet and punch is a little lesser than the friction coefficient between the sheet and other components.36,37 In the present study, because the punch surface was well polished, the second approach was used.
The FLD test was simulated in two steps. In the first step, the blank-holder moved downward by 2.5 mm and pressed the blank into the draw-bead. This prevents the sheet from slipping into the die during the deformation. In the second step, the punch starts to move downwards with a speed of 1000 mm/s and stretches the blank. This value was selected for punch speed based on the quasi-static condition of the metal forming process in the Abaqus to decrease the simulation time. Based on the quasi-static condition the ratio of kinetic to internal energy should be less than 5%.
Results and discussion
Parameter identification of GTN model
Figure 5 shows the comparison of the engineering stress-strain curve of the fine-grained sample (1, 5, and 7 rolling cycles) and the original AA-1050 sheet. As this figure shows, the tensile strength is significantly increased by increasing the number of rolling passes of the aluminum sheet in the ABR process. The strain hardening rate of ductile metal and its constituent phases’ properties affect the tensile properties of multilayer metals. Therefore, it can be said that these changes in the tensile strength that occur after the severe plastic deformation are due to two reasons for the work-hardening caused by dislocations and grain refinement.
Stress-strain comparison of original AA1050 sheet and different passes of ARB process.
Various sets of GTN parameters were used in FE simulations, and their effects on ultimate stress and corresponding strain were investigated. The VVF criterion was considered for all elements. The first element in which VVF = ff is the first damaged element based on the GTN model. The stress-strain diagram of that element was extracted, and the ultimate stress and corresponding strain were compared with the experimental ones. Table 5 shows the error values of stress and strain comparison of numerical and experimental results. Information in Table 5 shows that the change in GTN parameters has minimal effect on the final stress, and the ultimate stress is not sensitive to the change in GTN parameters. This small error also indicates a good agreement between experimental and numerical results. A review of Table 5 shows that strain is more sensitive to changes in GTN parameters.
Comparison of numerical and experimental stresses and strains.
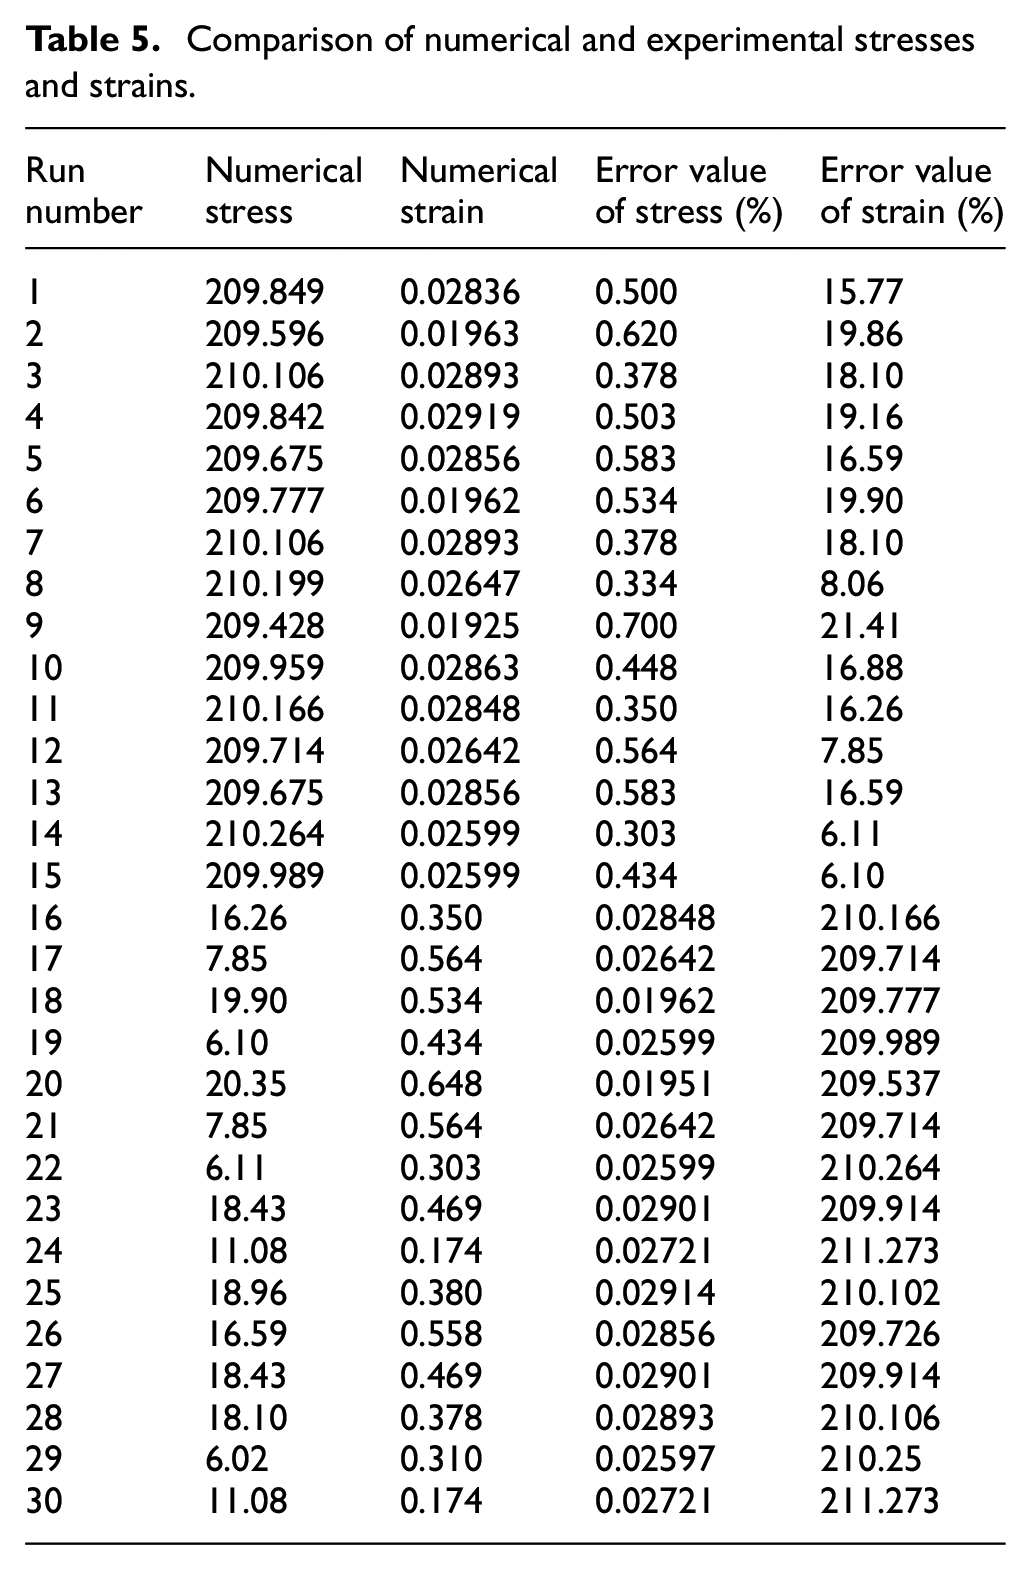
Figure 6 shows the influence of GTN parameters on the numerical strain. As this figure shows, the strain error decreases by increasing of
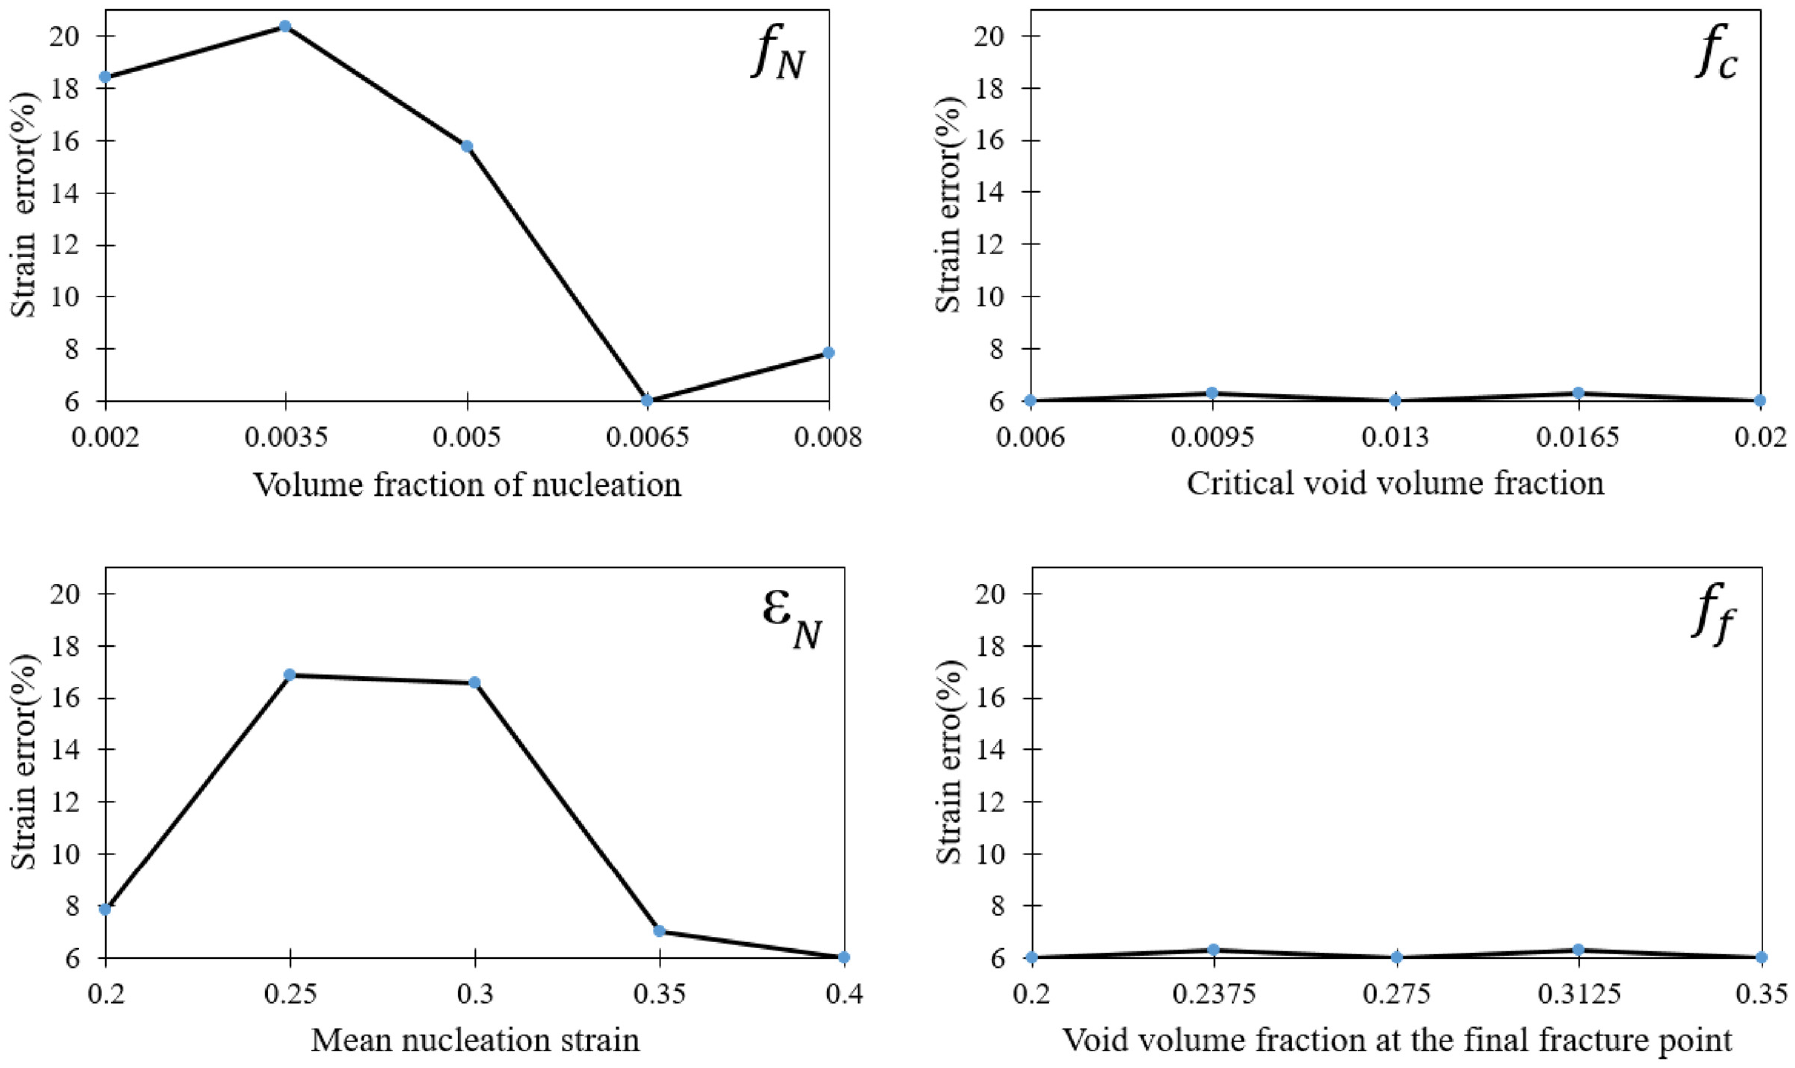
The influence of GTN parameters on the error value of numerical strain.
The error values of Table 5 show that run 29 has minimum strain error, so the parameters of this run are the best GTN parameters for fracture prediction of fine-grained AA1050. Table 6 shows the optimum GTN parameters of fine-grained AA1050.
The GTN parameters for fine-grained aluminum 1050.
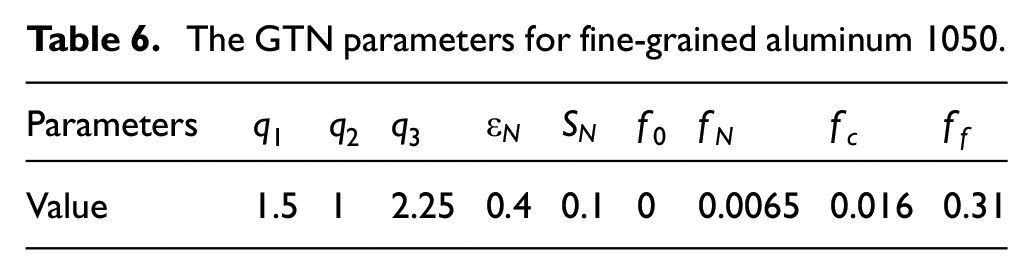
Figure 7 shows a comparison between the tensile test’s stress-strain curve’s numerical simulation using the best GTN parameters and experimental one. The figure shows that the numerical curve is very close to the experimental one.
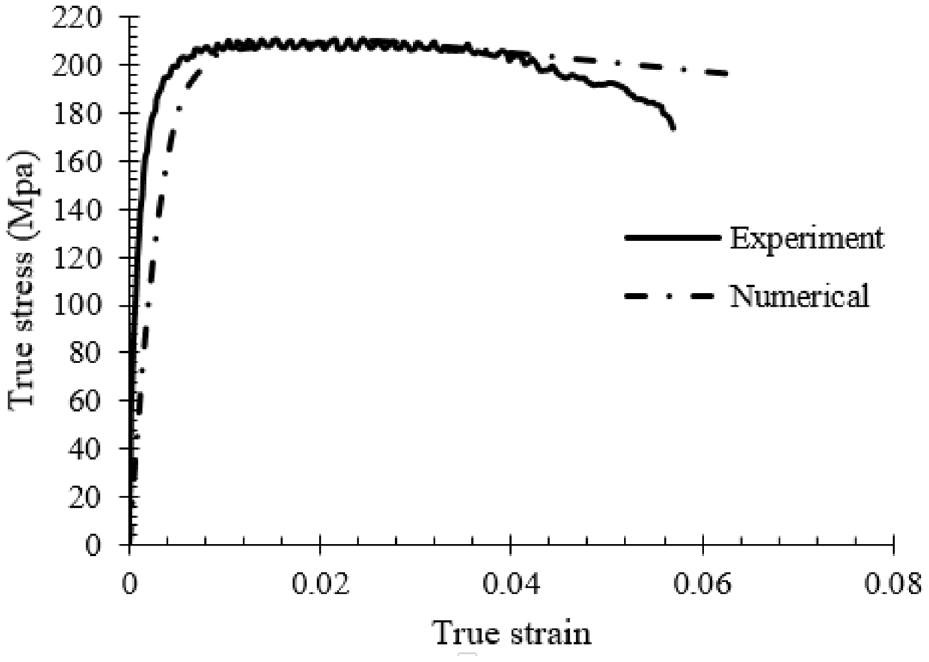
Comparison of the experimental and numerical stress-strain curve extracted from tensile test.
Forming limit diagram (FLD)
The FLD of the fine-grained sheet was extracted using the Nakazima experimental test. Samples of the sheet after the Nakazima test can be seen in Figure 8. FLD samples’ minor and major strains were obtained by reading the ellipses’ large and small diameters near the fracture zone. The FLD was drawn using minor and major strains of these samples.
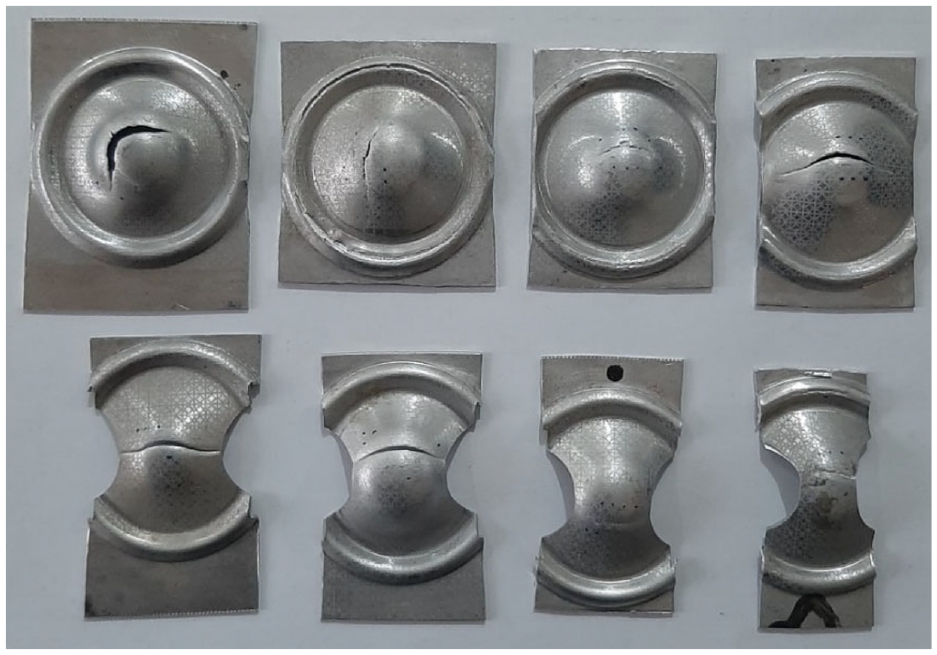
Aluminum samples after Nakazima test.
The Nakazima test was modeled and simulated in the Abaqus/Explicit to predict the FLD of the aluminum sheet. The GTN damage criterion with optimum parameters was used in the numerical tests of FLD. Therefore, the first element whose VVF exceeds ff was determined, the minor and major strains of that element in one step before the damage were read and considered as a point of FLD. This method was repeated for every eight FLD samples, and 8 points were obtained. The FLD was drawn by passing a curve through these 8 points.
Figure 9 shows the comparison of the numerical and experimental FLDs. According to this figure, the maximum difference between the numerical and experimental FLD is in the plane strain position of curve. The value of FLD0 for the experimental curve is 0.145, and for the numerical curve is 0.1687, which causes near 15% error. The numerical FLD improves in the biaxial tension and uniaxial tension parts of FLD and error value decreases in these parts to less than 10%.
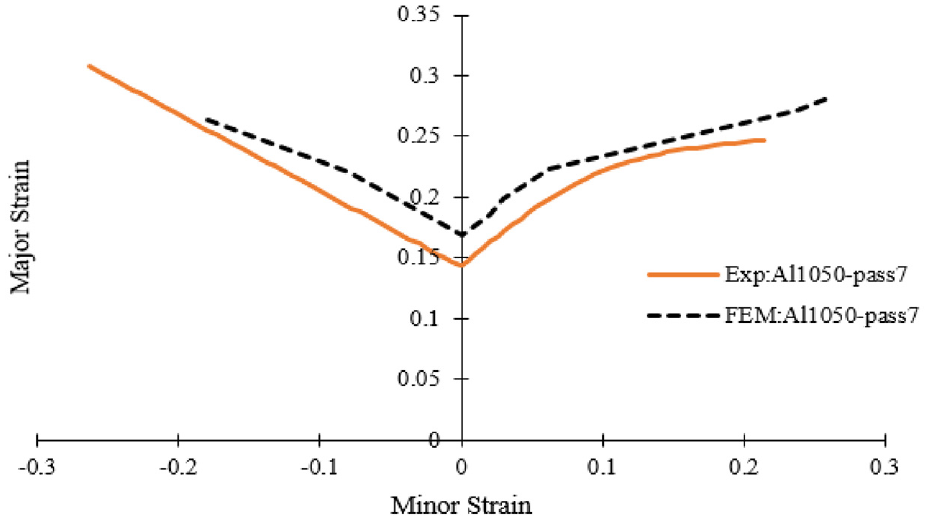
Comparison of the numerical and experimental FLD.
Prediction of fracture position
Fracture position was predicted by the GTN damage model in the numerical simulations. For this purpose, the VVF contour was extracted from all numerical samples used for FLD prediction. Fracture in the numerical samples located in the area which VVF = ff = 0.31. Figure 10 shows the comparison of the fracture location for numerical and experimental samples with different widths. As this figure shows, fracture of numerical samples happened in the area near the sample pole same as the experimental ones which shows a good agreement between numerical and experimental samples for fracture prediction. Since the friction coefficient in the punch and sheet contact area play an active role in the fracture position of numerical samples, these results indicate that friction coefficient was selected correctly in the numerical analysis. Low friction between the punch and sheet in the contact area leads to more deformation in this area and consequently fracture will happen in the sample pole. The obtained results indicate that the GTN damage model is a reliable method for predicting fracture time and location in the numerical simulation of forming process of two-layer sheets produced by ARB.
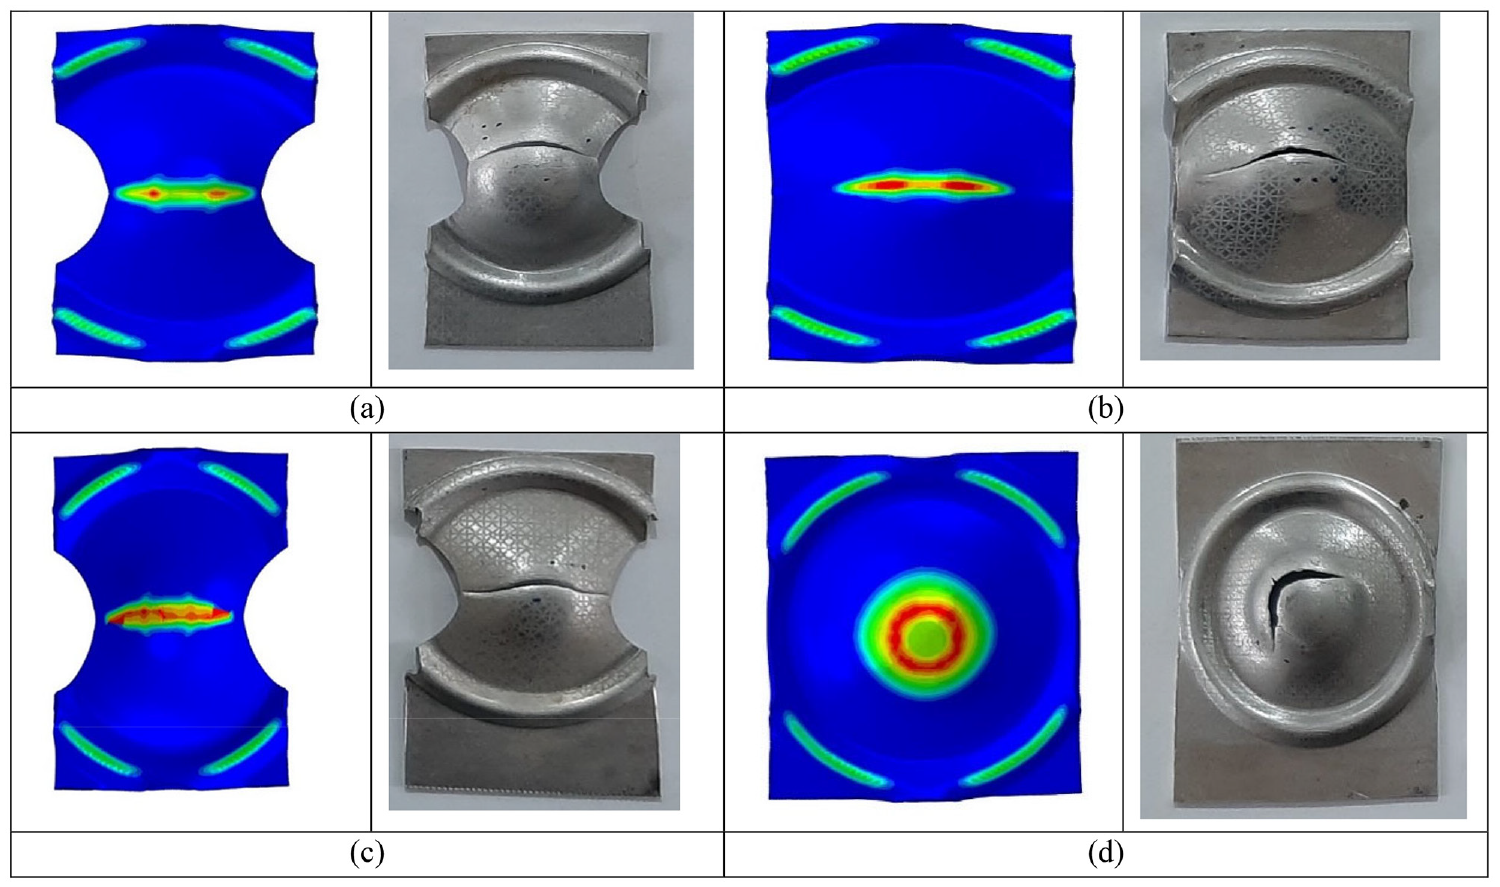
Comparison of fracture position of numerical and experimental samples with different width of (a) 31 mm (dumbbell), (b) 31 mm (rectangle), (c) 37.5 mm, (d) 50 mm.
Conclusion
In the present study, the GTN damage model was used to predict the FLD of fine-grained aluminum 1050 fabricated by ARB. After considering the interval for each parameter of the GTN model, the numerical simulation and anti-inference method of the uniaxial tensile test was used to identify the GTN parameters for the AA 1050 sheet. The GTN model’s proper parameters were imported to the FEM of the Nakazima test to predict the FLD and the following points are achieved in this study:
The results showed that the fine-grained sheet had higher tensile strength and less elongation than the original (non-rolling) sheet.
The numerical results indicated that GTN parameters’ variations did not significantly influence the ultimate stress of the stress-strain curve from the tensile test. However, the difference between numerical and experimental strains (strain error) decreases by increasing
Comparison of experimental and numerical FLDs showed a good agreement between these two curves in the simple tension and biaxial tension parts. However, the numerical results are a little far from the experimental results in FLD’s plane strain mode (FLD0).
A comparison of experimental and numerical results of the Nakazima test displayed that the GTN damage model with identified parameters had good accuracy in predicting the damage position of samples.
Since the presented GTN damage model in this research uses the isotropic yield criterion of von Mises, using advanced yield criteria with considering the effect of anisotropy is suggested for future works. Moreover, it is possible to change the rolling direction after each step of ARB and consider its effect on the formability and FLD of samples.
Footnotes
Authors contributions
The authors’ contributions are as following: A. Barfeh, R. Hashemi, and R. Safdarian conceived, planned, and carried out data curation, methodology, software, formal analysis, and writing the original manuscript; D. Rahmatabadi contributed actively in data curation, developing methodology, experimental and numeric analyses, and writing the manuscript; Ahmad Aminzadeh and Sasan Sattarpanah Karganroudi contributed in supervision, writing, review, and editing the manuscript; all authors provided critical feedback and helped shape the research, analysis, and manuscript.
Declaration of conflicting interests
The author(s) declared no potential conflicts of interest with respect to the research, authorship, and/or publication of this article.
Funding
The author(s) received no financial support for the research, authorship, and/or publication of this article.
Ethical approval
This article does not involve human or animal participation or data, therefore ethics approval is not applicable.
Consent to participate
This article does not involve human or animal participation or data, therefore consent to participate is not applicable.
Consent to publish
This article does not involve human or animal participation or data, therefore consent to publication is not applicable.
Availability of data and materials
All data, material, and codes used in this paper are available.