
Abstract
In this study, a new method is proposed to determine limit strains at the onset of localized necking for ductile materials that show post-uniform elongations. The new method is first applied for AA 5754-O using the ISO 12004-2 forming limit diagram determination standard. The method is also applied for ductile materials of 7114 steel, 304 stainless steel, and CuZn37 brass and finally for AA 2024-T4 having brittle fracture behavior. The results indicate that the new proposed method is quite successful, easy, and accurate for ductile materials that show post-uniform elongations.
Introduction
Forming limit diagram (FLD) is widely used in sheet metal industry to determine workability of sheet metals and to diagnose production problems. It is basically a combination of major and minor strains at the onset of localized necking. 1 The FLD is the most important tool to determine formability of sheet materials.2,3 It is also used for the majority of sheet metal finite element software in order to evaluate stamping operation.
The FLDs can be determined by using theoretical and analytical models and experimental methods. However, neck initiation under various sheet metal forming conditions is a complex process and there are no well-known procedures for its determination. 4 Although the experimental FLD is a tedious and time-consuming task that also requires special equipment, it is still mostly used for the FLD determination.
Experimental FLDs are usually determined by using two types of tests. The first one is the Marciniak in-plane test and the other one is out-of-plane test (hemispherical punch). The out-of-plane formability (Nakajima test) test is most extensively used to determine experimental FLDs due to its simplicity and easiness.5 –9 Basically, surface strains are measured applying grids or speckles on sheet surfaces. Many automatic measurement systems are commercially available in the market for the purpose of surface strain measurements. The most commonly used FLD determination method is the Nakajima test (out-of-plane test), which uses a hemispherical punch to deform the test specimens. In the Nakajima test, specimens with different widths are formed until fracture by a hemispherical punch using a circular female die. The left and right sides of the FLD are constructed using various specimen widths and lubrication conditions. Forming limit curves (FLCs) are generally constructed according to the American Society for Testing and Materials (ASTM) E2218-02 10 and the International Organization for Standardization (ISO) 12004-2 11 standards. Before the ISO standard was introduced in 2008, it was not required to reduce the friction between the sheet and the punch to nearly zero. Thus, the failure occurred far from the apex of the dome. Additionally, a double necking problem occurs in the formed specimens.
A reliable FLD depends on the accuracy of the limit strain determinations. The onset of a visible neck should be used as the forming limit. 12 For this reason, the limit strains values should be determined at the incipient necking. 13 However, it is quite difficult to determine a neck initiation. In most cases, the tests can only be stopped after either localized necking or fracture. Eventually, the limit strain cannot be predicted correctly in both situations. Hecker and Siefried 14 measured the limit strains around the center of the fracture, while Smith and Lee 15 measured them on the opposite side of the fracture area. In these cases, the limit strain values are scattered, and hence, the accuracy and repeatability of the FLD are considerably reduced. Consequently, it is difficult to decide which strain values should be taken as limit strain values. In order to overcome discrepancies, some procedures have been developed to determine the limit strains. In 1968, Takashina et al. 16 developed a method called the “three circle method.” In their study, the elongations of three overlapped circles near the fracture are measured. The method is fairly coarse for finding limit strains. In 1972, Bragard et al. 17 presented an interpolation-based method. In the method, strains are measured along a line perpendicular to the fracture, and a parabolic curve is fitted through the values obtained for the major strain. The maximum value of the parabola is the major limit strain. The corresponding value of the minor strain is taken from the same position as the major limit strain. Janssens et al. 18 conducted a study on the uncertainty of the Bragard method and constructed a forming limit band (FLB), which contains all of the limit strains. The constructed FLB had a range of 9% strain. As a result, the accuracy and repeatability of the method are found to be poor. Hecker 19 recommended another method in 1972 that could determine the necking, safe, and fractured strains by observing the grid shapes around the fracture area and show them on the FLD. The FLC is drawn between the point corresponding to the grids affected by necking and the safe ones. Although the method has been used on a large-scale application because of its simplicity, the values of the FLCo varied by 5%, and the major strain value for a given minor strain varied by as much as 11% strain. 15
In the last decades, video measurement methods have been introduced to measure limit strains. In 1997, Marron et al. 20 presented a time function method that could evaluate the strain rate during the formability process. In this method, it was assumed that incipient necking can be found from increasing the strain rate. Lewison and Lee 21 studied the neck initiation by examining carefully captured images of the deformed sheets. In their method, for every specimen, approximately 100 photographs must be analyzed to detect incipient necking. Geiger and Merklein 22 applied the Lewison and Lee 21 method, and they found that the repeatability of the FLC becomes 0.7% strain. Although the repeatability was sufficient, the application of the video-based methods was quite difficult and time consuming. However, in recent years, these difficulties were overcome by new optical three-dimensional (3D) deformation analysis systems. Situ et al. 23 determined the localized necking from the strain history of the specimens obtained by optical 3D deformation analysis systems. By taking first- and second-order derivatives of major and minor strains to obtain strain rate and strain acceleration, a major strain rate curve is obtained. A peak in the major strain acceleration is considered as the onset of localized necking. A new method similar to the Bragard et al.’s 17 method was developed called “in-process measurement” method. 24 A revision was made to the ISO 12004 standard based on the “in-process measurement” method. The geometry of the tools, the geometry and number of the specimens, the testing conditions such as the punch velocity, blank holder force and lubricant as well as the measurement and mathematical analysis of the deformed specimen to calculate limit strains are described in the standard. Thus, the repeatability and the reproducibility of FLDs are increased. In this method, the measured strain distributions along predefined cross-sections are analyzed. The strain points in the neck area are determined by an objective mathematical criterion. By removing these strain points, a new strain distribution is reconstructed, and a second-order parabola is fitted to the remaining part of the strain distribution. The resulting value at the crack position indicates the limit strains. This method is called the “cross-section method” in the standard. Three-dimensional deformation analysis systems that can measure the strain distributions and calculate the limit strains according to the ISO standard automatically were developed but these systems are quite expensive.
In this study, a method capable of determining incipient necking for the materials which show post-uniform elongations is developed regardless of material types. In this new method, the limit strains can be obtained from the area where the failure ends up to the unaffected zone. This new method does not require complicated mathematical analysis or expensive deformation analysis systems.
Experimental work
In this research, AA 5754-O, 7114 steel, 304 stainless steel, and CuZn37 brass materials, which show ductile fracture behavior, and AA 2024-T4 aluminum material, which shows relatively brittle behavior were studied. Material thicknesses are 1 mm. Mechanical properties of materials were determined by Shimadzu Autograph 100 kN testing machine with the data acquisition maintained by a digital interface board utilizing a specialized computer program. Material deformation was measured with a video-type extensometer. The FLDs were constructed with the Nakajima test according to the ISO 12004-2 (2008) standard. FLDs were determined using the two-limit strain determination methods in order to evaluate the new method. The Nakajima standard test geometries for the FLD are given in Figure 1.
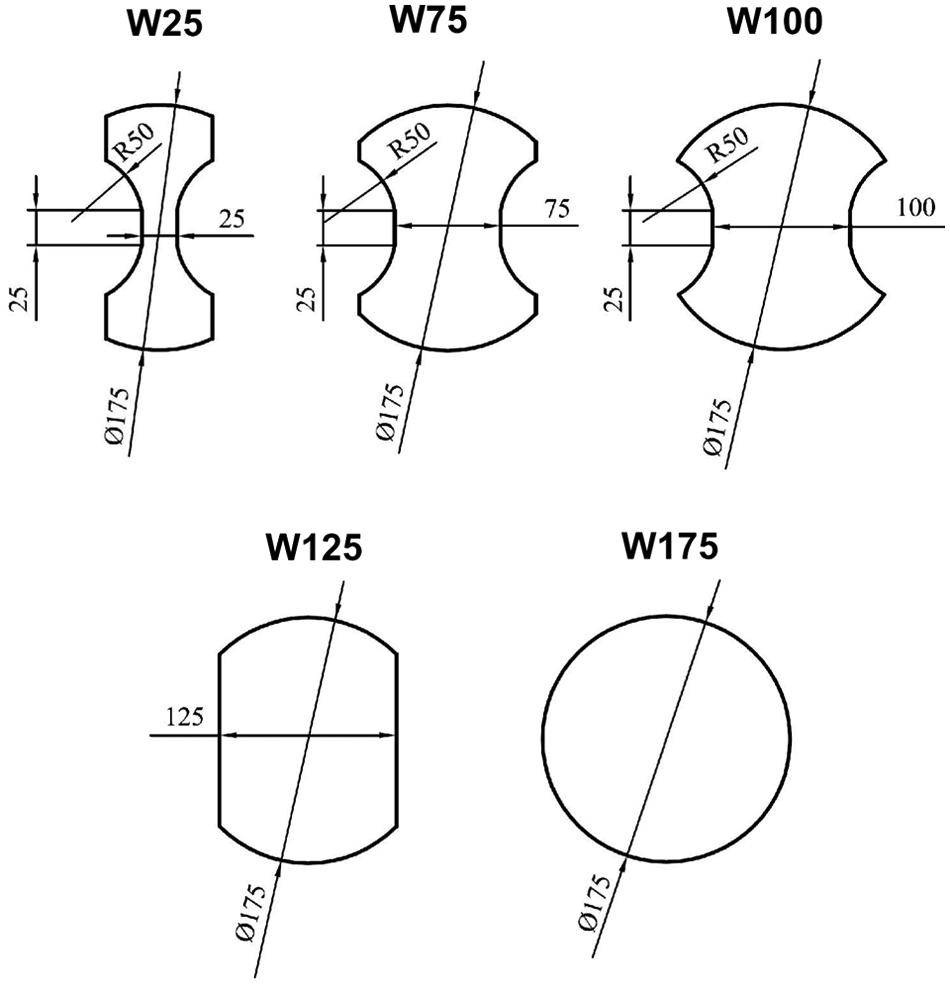
Nakajima test specimens used in the ISO standard.
In the ISO 12004-2 standard, it is mandatory that the fracture distance from the apex of the dome does not exceed a maximum 15% of the punch diameter. Therefore, all of the specimens were lubricated by paraffin and polyethylene film to obtain fracture near the apex of the dome. For strain measurements, a 2.5-mm square grid pattern was applied on the specimens by the serigraphy method. The accuracy of the grids is 0.28% with a repeatability of 0.8%. 25 These values are below the accuracy limit of 1% specified in the ISO standard. The accuracy of the Automated Strain Analysis and Measurement Environment Software (ASAME) system is 0.38%, 25 whereas its repeatability in this study was found to be 0.26%. The repeatability was found with a confidence of 95%. The punch velocity was adjusted to be 1 mm/s. The specimens were formed using Metal Testing System (MTS) formability machine, which is a double acting press shown in Figure 2.
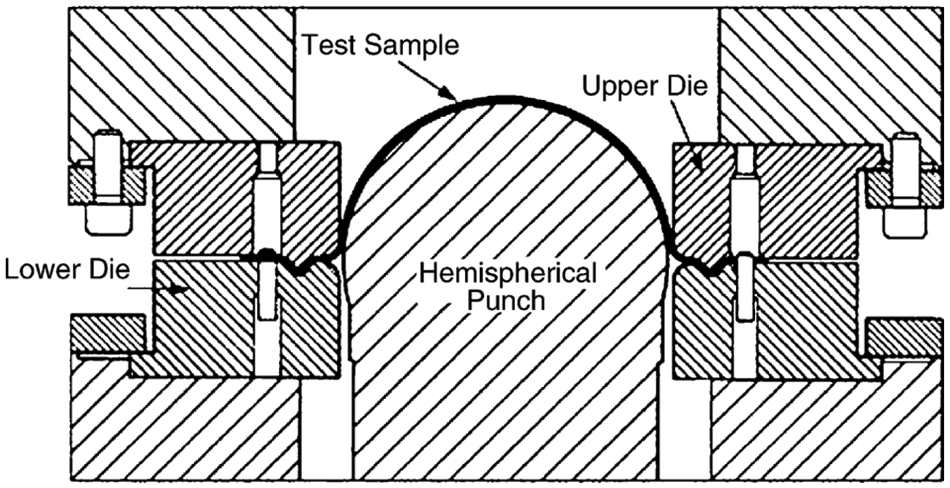
MTS formability system (out-of-plane test setup). 5
The MTS formability system has a sensor which stops the machine when necking or fracture occurs. The specimens were clamped between lower and upper dies. The blank holder force is applied to hold the specimen in place. All specimens were formed until necking or fracture occurred. The measurement of the strains and the determination of the limit strains were performed by the ASAME software.
New proposed method for limit strain determinations
The strain distributions of the specimens at the crack zone should be measured in order to determine the limit strains and to construct the FLD. The ASAME software requires at least 2 photographs of the measurement area on the specimens at different angles for strain measurements. In this study, the limit strain values were calculated with both the cross-section method mentioned in the ISO standard and the new proposed method. In the cross-section method, the measured strain distributions along predefined cross-sections are analyzed. Therefore, three cross-sections are drawn perpendicular to the crack. For every section, the fit windows that contain the strain values that will be used for fitting an inverse parabola are constructed. The strain points in the neck area and those out of the fit window are determined with an objective mathematical criterion. The construction of the fit windows is performed by removing these strain points. A second-order inverse parabola is fitted to the remaining part of the strain points. With the value of the inverse parabola at the crack position, the limit strain values are calculated. These complicated calculations were performed by a subroutine, which was written in Microsoft Excel software.
In the new proposed method, it is assumed and finally proved that there must be an incipient necking region between the localized necking or fracture and the undamaged area. In almost all of the tests conducted on the materials showing ductile fracture behavior, regardless of the types of failures, it was found that there was an incipient necking on either side of the damaged area (Figure 3). Therefore, a method is proposed to predict the limit strains in these regions. This method is only valid for ductile materials which show post-uniform elongations. Brittle materials absorb relatively little energy prior to the fracture. For this reason, they do not show any incipient necking.
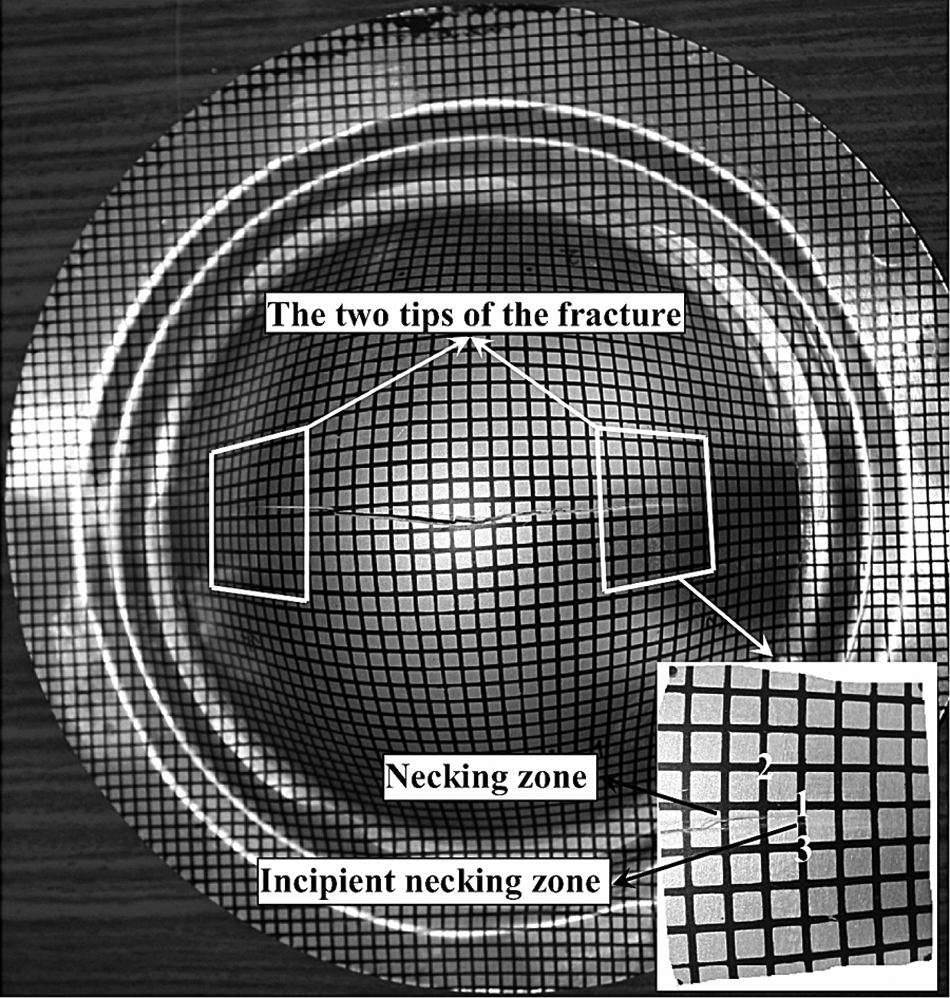
The two tips of the fracture and incipient necking zone.
When predicting limit strains with the new proposed method, the following steps should be considered:
First, the two tips of the fracture are investigated, and then the minimum three points with major strain values that are very close to each other are taken from both sides of the fracture to help find the major limit strain. The major limit strain for a specimen is calculated by averaging these totally six strain values. These points are selected from an incipient necking zone, which is the area next to the tips of the fracture (Figure 4). For instance, in Figure 4, these major strain values were labeled as 22.41, 21.76, and 21.84 only for a fracture tip.
Minor strain values belonging to these points taken from both sides of the fracture area can sometimes show 5% difference from the average strain. For this reason, a color distribution based on the major strains is obtained, and a cross-section along a color line that indicates the average values of the selected major strain is used. Then, the average major and minor limit strain values on this line are found. In the given example, the cross-section value was given as 22.00 (Figure 5).
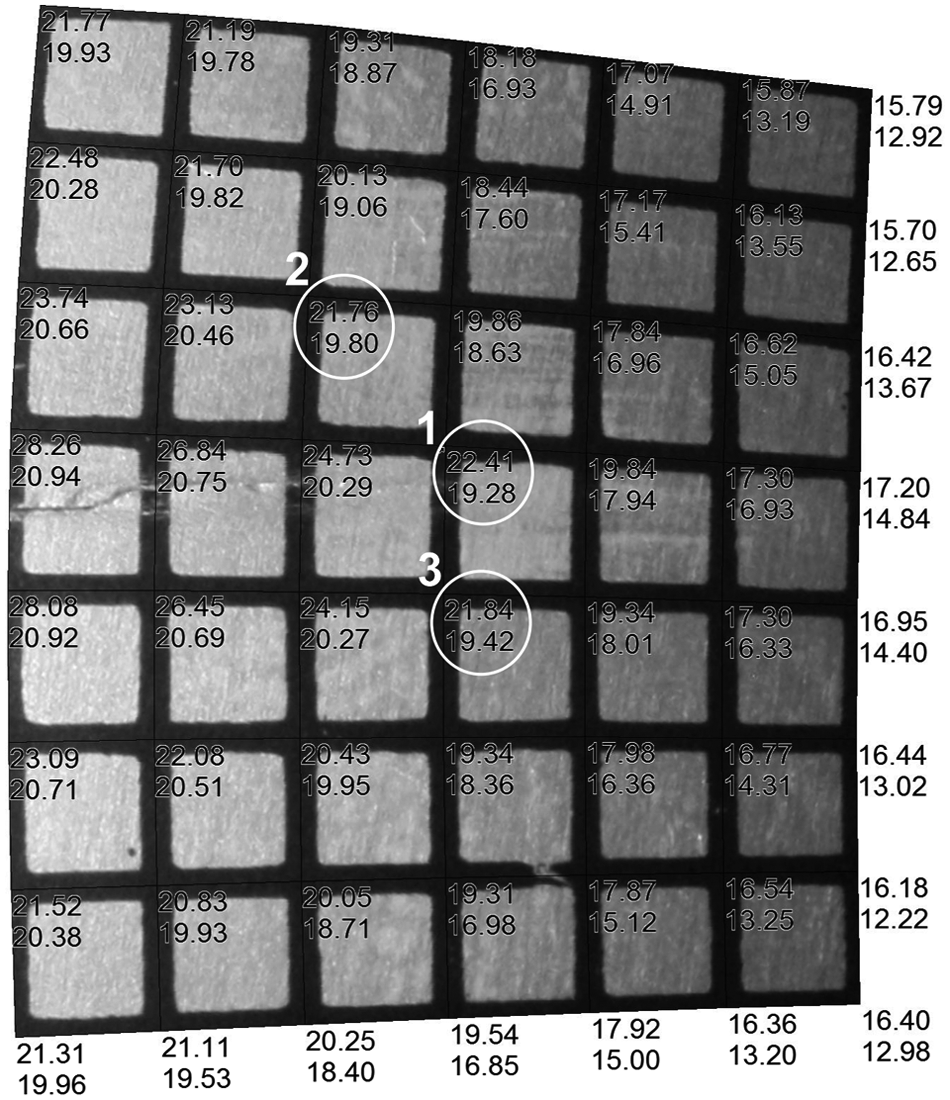
Strain distributions of the tip of the fracture (upper ones are major and lower ones are minor strains).
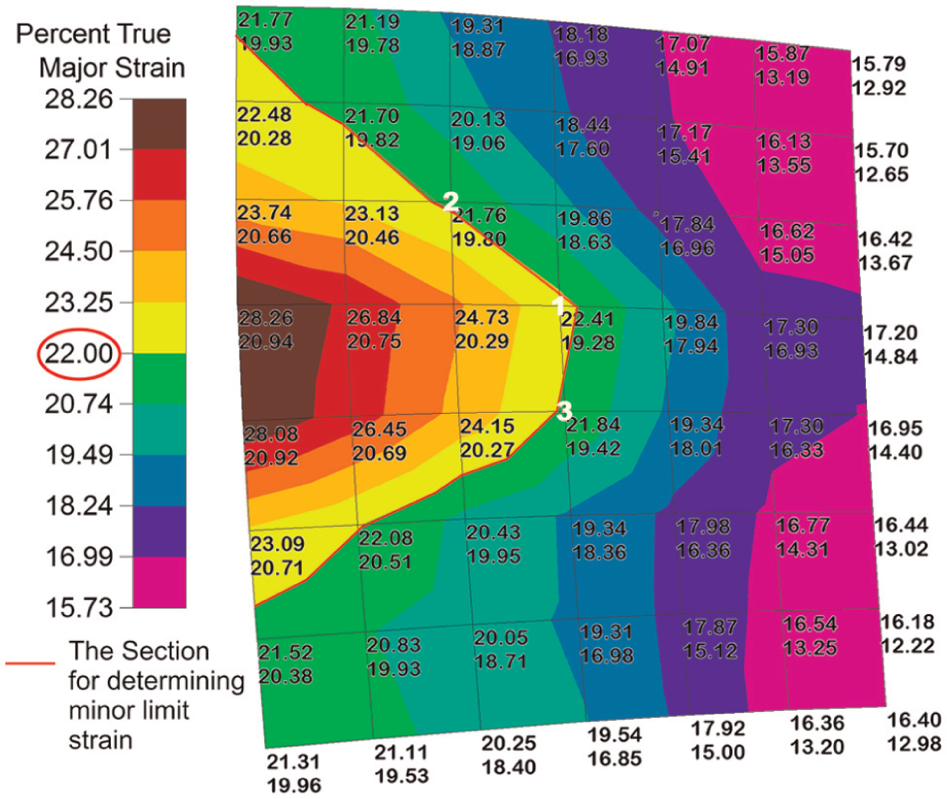
Contour plot of major strain distribution.
After finding the limit strain values from the specimens formed according to the ISO standard by the cross-section method and the new proposed method, the values were marked on a graph, and then a FLC is formed by the least-squares method. The best curve was fitted to the strains obtained from all the widths and repeats using the Microsoft Excel software. The repeatability of the two methods was determined by measuring the shortest distances between the limit strain points and the FLC (fitting curve) and then calculating the standard deviation of these values.
Results and discussion
Comparison of the limit strain determination methods
The comparison of the FLDs of the AA 5754 sheet metal that were determined by the new proposed method and the cross-section method is shown in Figure 6. The repeatability of the methods was calculated to be 0.58% and ±0.50% strain, respectively, for the cross-section method and the proposed method. These values were less than the repeatability of ±2% designated in the ISO standard. The repeatability of the method was also demonstrated on the FLCs up to the strain values of the repeatability. While the left sides of the FLCs were near each other, the difference increases gradually on the right of the FLCs. Both of the lowest major strain values of the FLCs were obtained on the right side of the plane strain (FLCo) as expected in aluminum alloys. Drawn by the cross-section method, the lowest point of the FLC was found as the major strain was 2% higher and the minor strain was 5% higher on the right when compared to the other method. The difference between the FLCs was 10% for the major strain and 7% for the minor strain at the right tip.
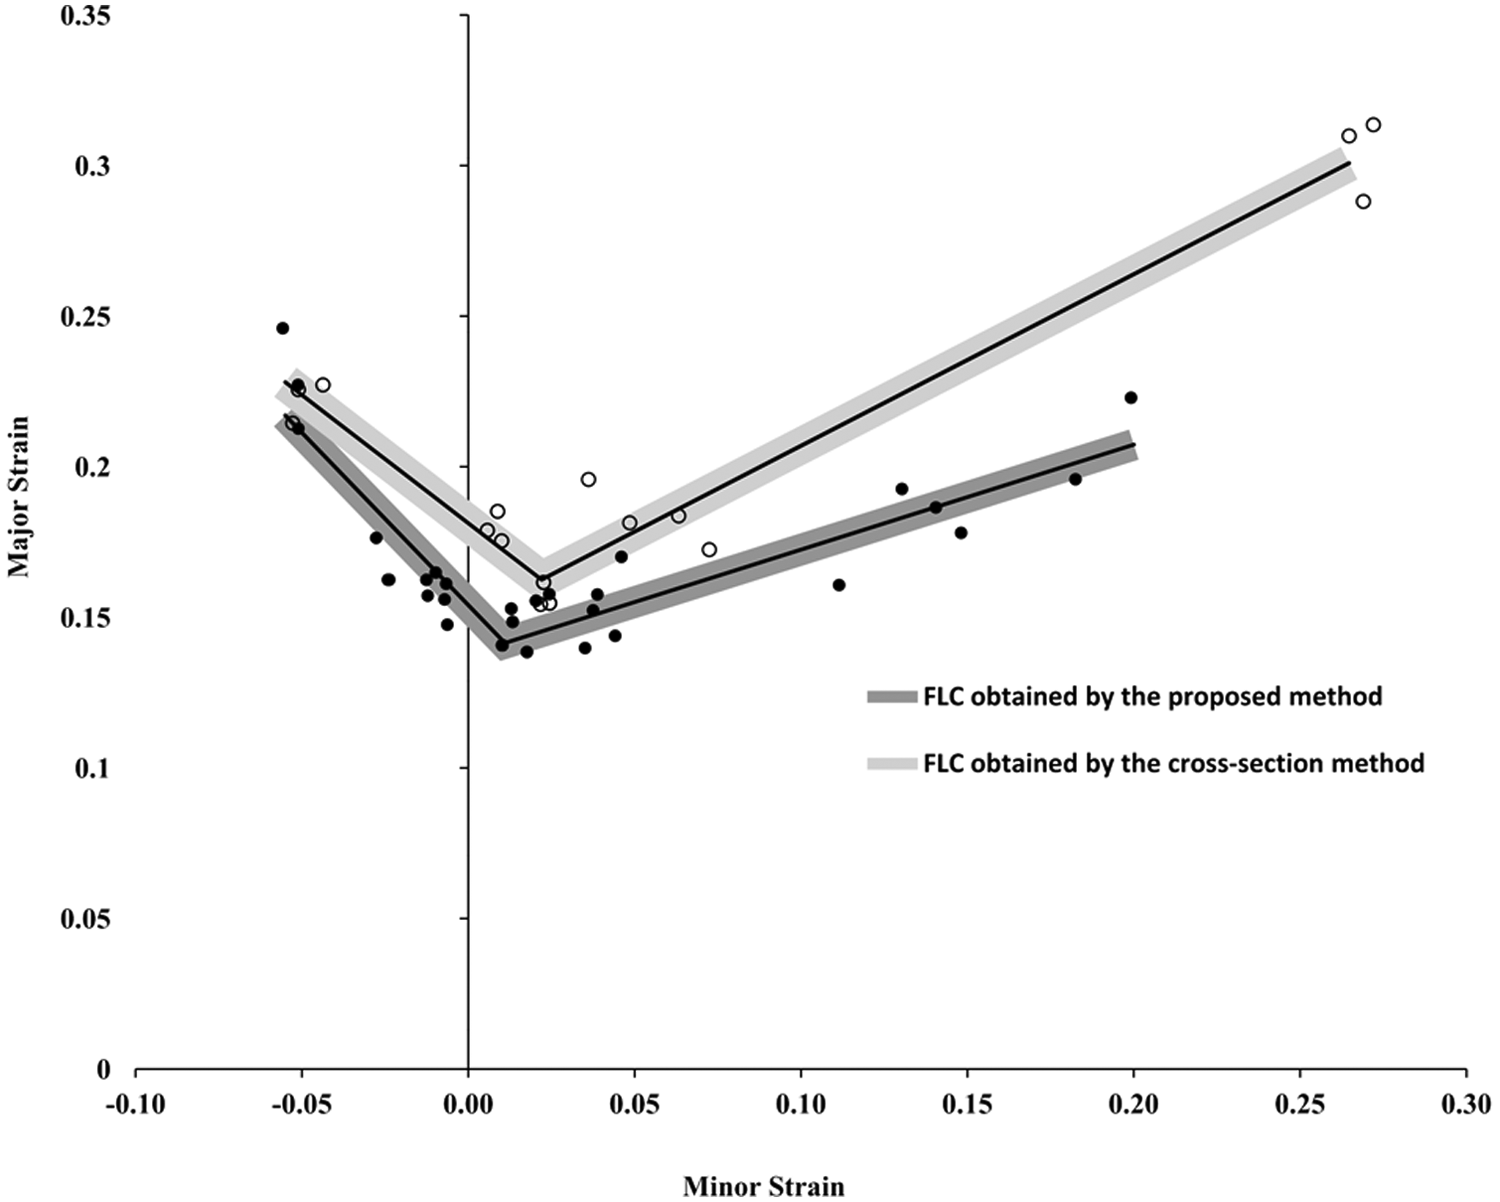
The comparison of the FLDs.
Furthermore, case studies were conducted in order to see the accuracy of the two strain determination methods. Different parts were formed with the same AA 5754 material until just before and just after a failure occurred by deep drawing and hydraulic bulging processes with three repeated tests. The limiting drawing ratio (LDR) of the AA 5754 sheet was determined to be 2.13 by using a punch with a 40.8 mm diameter for the deep drawing process, and the bursting pressure of the same material was determined to be 18.8 MPa for the hydraulic bulging process. After the parts were formed, the maximum strains occurred on the non-fractured parts, and the strains just near the fracture on the fractured parts were measured by the grid analyzing system. The maximum strains on the non-fractured parts and the strains just near the fracture on the fractured parts and the FLCs of the material were compared in Figure 7. Although a large area was measured on the parts to prevent melding of the strain points, the nearest values on the FLCs were demonstrated on the graph. The strain points measured from the fractured parts were designated by hollow markers, and the non-fractured points were designated by solid markers.
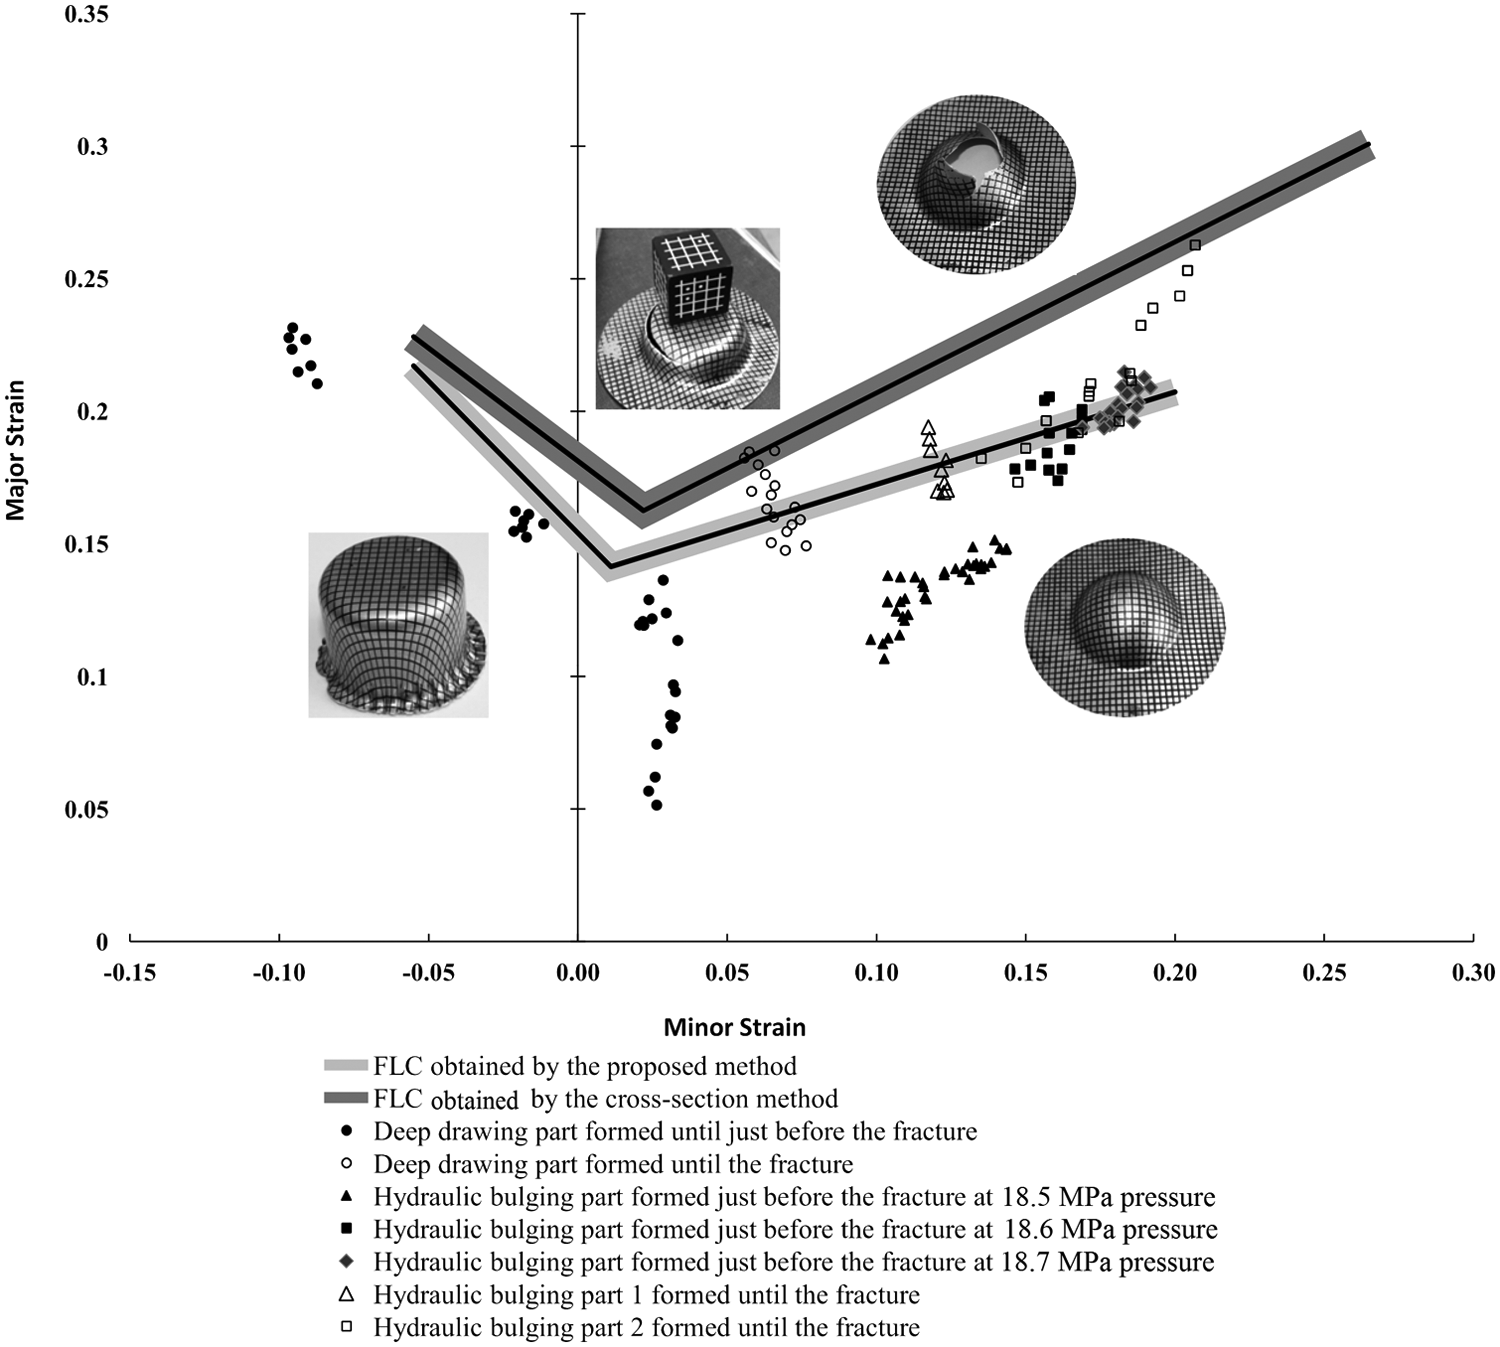
Comparison of the strain distributions and FLDs.
The strain distribution of the non-fractured deep drawing part (solid circles) that was formed just before the fracture is close to the FLC obtained by the new proposed method. However, the strain points measured from the fractured deep drawing part (hollow circles) exceeded the FLC and converged to the FLC obtained by the cross-section method. Thus, the new proposed method could predict the forming limit more reliably. In particular, the results obtained from the fractured hydraulic bulging specimen (hollow triangle) supported the decision because the cross-section method predicted that the part is non-fractured. However, the proposed method predicted that the part was fractured. The strain values of the hydraulic bulged part, which was formed until its forming limit at a pressure of 18.5 MPa, were well below the FLC of the proposed method. When the forming pressure increased somewhat, the strain values also increased considerably and converged with the FLC of the new proposed method at 18.6 and 18.7 MPa of pressure. It was assumed that the increase of the strain values by so much was based on diffused necking that occurred in these specimens. To show the diffuse necking behavior of the non-fractured hydraulic bulging specimens, the thickness distributions of the specimens were also measured and compared with each other. The results of the comparison are shown in Figure 8. To show the diffuse necking behaviors of the parts, trend lines were fitted to the thickness strains in Figure 9. As shown in the figure, the strain gradient of the 18.6 MPa and particularly the 18.7 MPa curves was much higher than that of the 18.5 MPa curve. Thus, the diffuse necking behavior can be addressed for the parts bulged up to pressures of 18.6 and 18.7 MPa. When the forming pressure was increased slightly, the thickness reduction increased rapidly for the parts bulged up to pressures of 18.6 and 18.7 MPa when compared to the part bulged up to a pressure of 18.5 MPa. Although no localized necking and fracture were observed in these parts, the parts should be assumed as fail. However, according to the cross-section method, the parts can be used safely. Thus, it can be concluded that the new proposed method is safer than the other method. When the strain measurements were performed on the fractured hydraulic bulging specimen (hollow squares), it was observed that the strain values attained the FLC obtained by the cross-section method. Thus, the method could predict the fracture successfully. Therefore, it can be concluded that while the FLC obtained by the cross-section method predicts the localized necking or the fracture strain values, the FLC obtained by the new proposed method also predicts the incipient or diffused necking strain values.
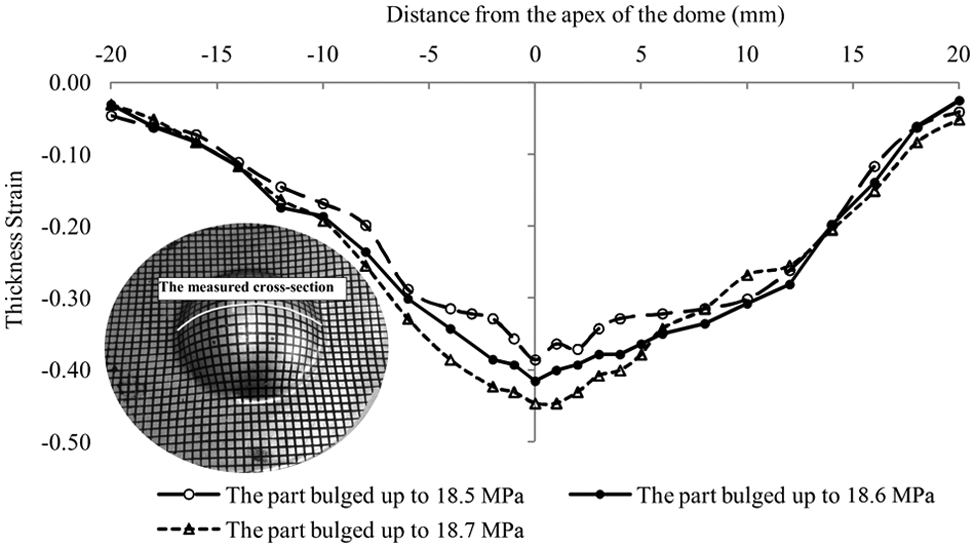
The thickness reduction of the hydraulic bulged parts.
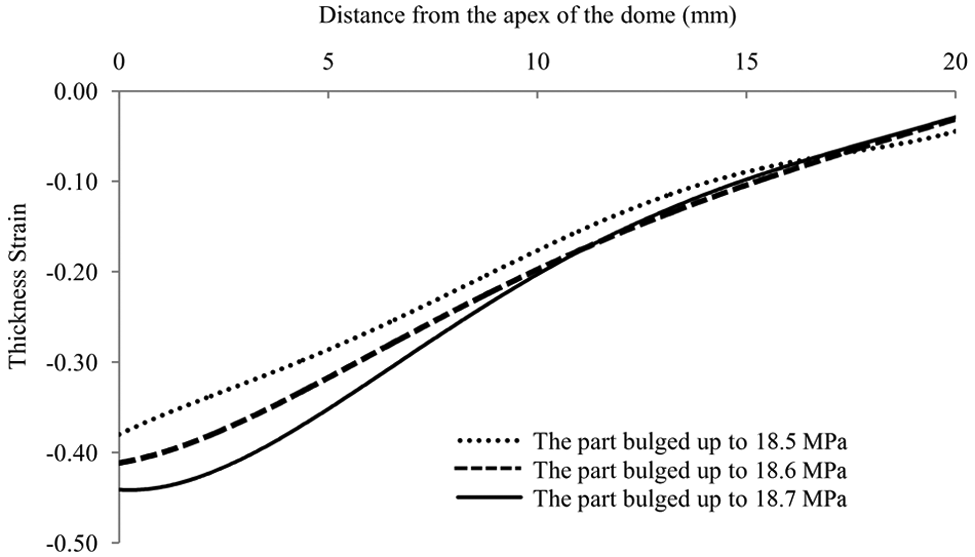
The trend lines of the thickness reductions of the hydraulic bulged parts.
The validity of the proposed method
The validity of the new proposed method was tested for various ductile materials of 7114 steel, 304 stainless steel, and CuZn37 brass. The method was also evaluated for AA 2024-T4 material that shows brittle fracture behavior. The limit strains were determined for a single geometry (W100) by the new proposed method to verify the repeatability. The results are summarized in Table 1.
Repeatability of the limit strain values of various ductile materials.
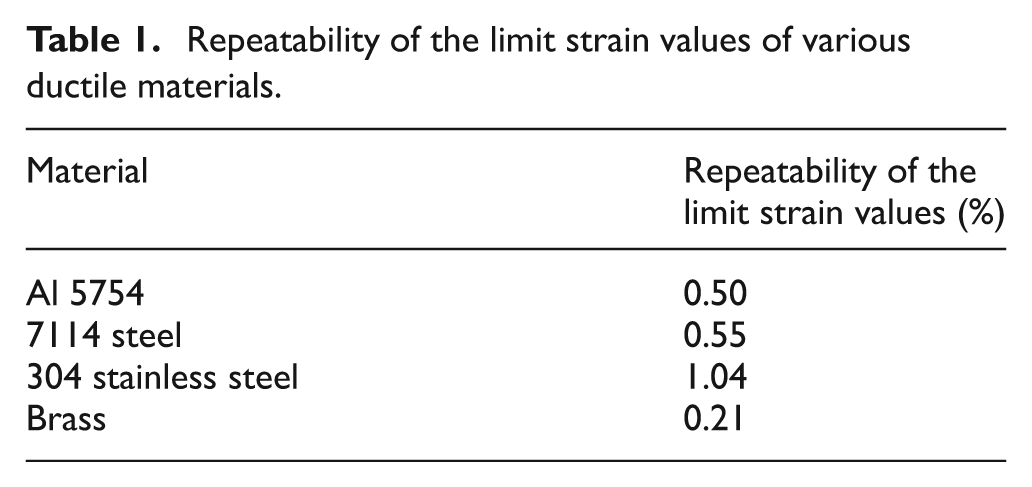
The results indicate that the values were smaller than the repeatability value designated in the ISO standard. It means that the new proposed method could be successfully applied to all materials which show ductile fracture behavior. The flow curves for the materials used in this study are also determined as shown in Figure 10.
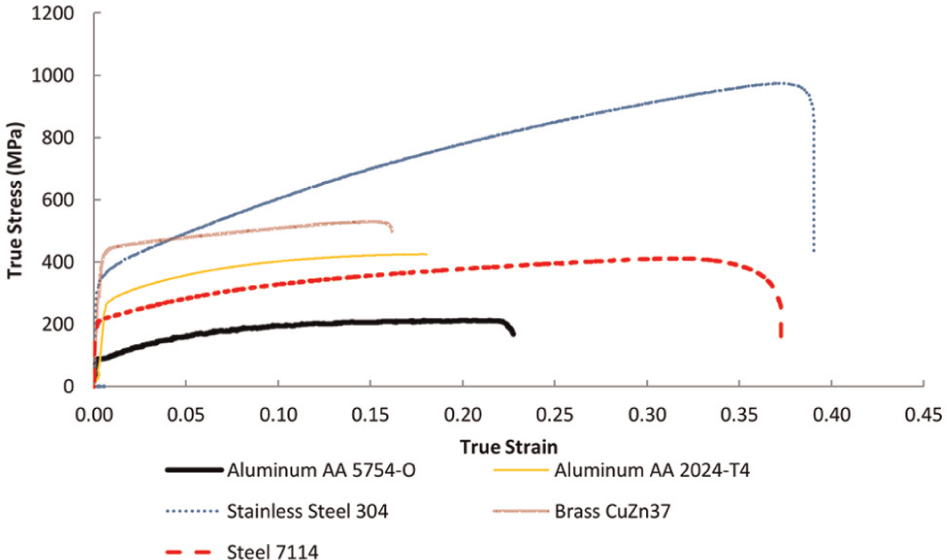
Flow curves of the materials.
The proposed method is not valid only for AA 2024-T4, which shows relatively brittle fracture behavior. It is almost impossible to see any indication of incipient necking prior to fracture.
As a conclusion, the new proposed method worked quite well for ductile materials with a post-uniform elongation.
Conclusion
In this study, a new limit strain determination method was proposed for ductile materials that show post-uniform elongations. The new proposed method was also compared with the cross-section method, which is designated in the ISO standard. Several case studies were performed to see the performance of the proposed method and compared with the cross-section method. The results reveal that there was a significant difference between the FLCs, particularly on the right side. According to the results of the case studies, the proposed method could predict the forming limit more reliably. In addition, it was observed that while the FLC obtained by the cross-section method predicts the localized necking or fracture strain values, the FLC obtained by the proposed method also predicts incipient or diffused necking strain values. The major advantage of the proposed method is that it does not require complicated mathematical analysis or expensive deformation analysis systems and can be applied easily with adequate accuracy.
Footnotes
Declaration of conflicting interests
The authors declare that there is no conflict of interest.
Funding
This work was supported by The Scientific and Technological Research Council of Turkey (TÜBİTAK) (Project number: 108M516. Project Title: “Adding drawbead to the blank holder for enhancing formability of aluminum alloy sheets with hydroforming process”). Specifically Mevlut Turkoz would like to thank TÜBİTAK-BİDEB for financial support during his MSc studies. This work was also supported by the BAP office of Selcuk University. TÜBİTAK and BAP supports are profoundly acknowledged. This work has been extracted from Mevlut Turkoz’s MSc thesis.