
Abstract
Fe-Cr-Co is a typical spinodal decomposition type magnetic alloy. FeCrCo alloys being highly workable are important for slender feature designs and ductile applications. However, due to the rising prices of cobalt, research is increasingly being focused toward reducing the amount of cobalt in FeCrCo semi-hard magnetic alloys, without compromising on their magnetic properties. Silicon is ferrite stabilizer and therefore, can be utilized as a potential alloying element. Few researchers have reported work on addition of silicon in FeCrCo alloys, especially on the double isothermal magnetic field annealing. In this work, FeCrCo alloy with 2% silicon addition was produced and subjected to different heat treatments. An electromagnetic setup equipped with a tube furnace was designed based on Finite Element Method (FEM) analysis, and developed for thermomagnetic treatments. An increase in remanence for double thermomagnetic treatment was noted. This improvement could be attributed to the transformation of retained α phase into α1 phase. It was also observed that the squareness of the M-H curve improved with the double treatment.
Keywords
Introduction
Hard magnets, also commonly known as permanent magnets, are used for generating magnetic fields. 1 Hard magnetic alloys possess higher resistance to demagnetization as compared to semi-hard magnetic alloys. FeCrCo magnetic alloys are classified as semi-hard magnetic materials that exhibit ductility in combination with superior magnetic properties. As a result, in comparison to other permanent magnet alloys, FeCrCo possesses good machinability and mechanical workability to desired shapes. It is also possible to fabricate thin wires (up to 0.1 mm diameter), thin strips (up to 0.05 mm), and bars and pipes from FeCrCo alloys.
While comparing with Alnico magnets, one of the advantages of FeCrCo magnets is that their mechanical strength is higher while the Curie temperature is comparable. With Curie temperature of around 640°C, working temperature up to 500°C is possible. Due to high reversible temperature coefficient, magnetic stability is better which makes this alloy suitable for high-precision components. Major applications include magnetic devices like brakes, relays, tooling, chucks, flip signs, anti-theft tags, stirrers, sensors micro motors, speakers, and speedometers. Due to high hysteresis energy and mechanical strength, FeCrCo magnetic alloy is suitable for miniature devices.2–5 Miniaturized micro-electromechanical systems (MEMS), micro-reactors, and micro-mechanical devices have applications in automobiles, aircrafts, telecommunication, mobiles, computers, laptop computers, home appliances, and medical devices. 6 High end applications in aviation, railway transport, and shipbuilding require magnetic materials that possess combination of good machinability as well as good mechanical and magnetic properties. Currently, 70% of the permanent magnets produced are being utilized for manufacturing of permanent magnet motors and generators.7,8 With increase in electric vehicle market, especially solar electric vehicles,9,10 the challenge for producing large quantities of magnets for traction motors would also increase both in terms of raw materials and technological capabilities. Due to cost limitations, alternatives to the expensive high energy rare earth permanent magnets are being investigated. 11 Alnico and FeCrCo magnetic alloys are the potential rare earth free materials for this purpose. Hard magnetic materials with low cobalt are increasingly in the focus of research due to economic considerations that arise from increasing prices of cobalt. FeCrCo is the only economical and deformable hard magnetic alloy that combines high magnetic hysteresis properties with superior mechanical strength properties, as shown in Table 1.
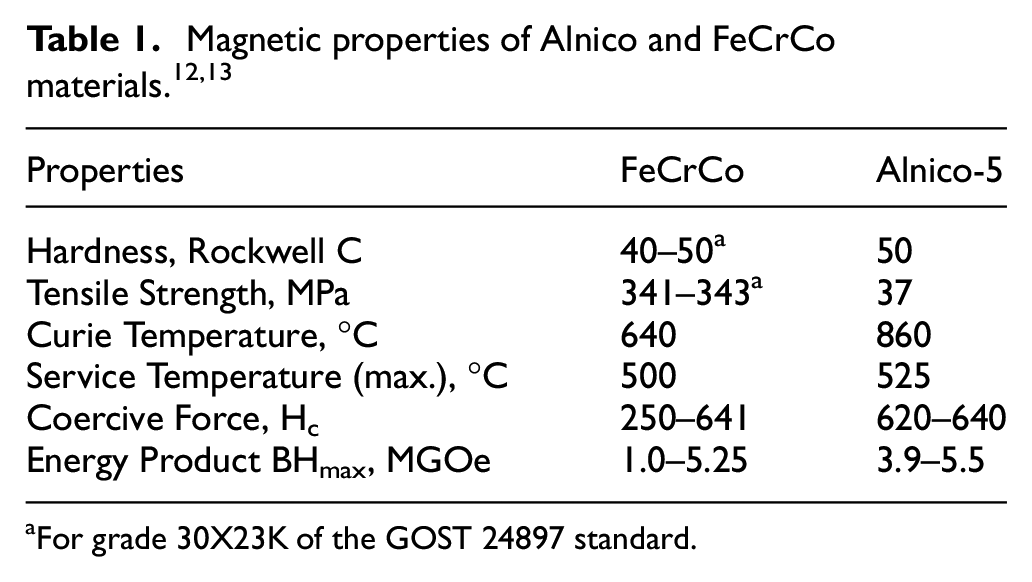
For grade 30X23K of the GOST 24897 standard.
Russian metallurgical industry is mass producing FeCrCo sheet and rods from hard magnetic alloy FeCrCo containing low cobalt content around 15 weight percent. Lowering cobalt content is being investigated to reduce the cost of the product. 14 Alloys with 9–10% cobalt possess high values of residual induction. 14 Another advantage is its high corrosion resistance, making it suitable for devices working at temperature up to 550°C, especially in corrosive environments. For similar level of magnetic properties, FeCrCo offers a more economical alternative to Alnico alloys, 15 SmCo, and NdFeB alloys, 16 since low cost manufacturing with high quality standard remains the primary aim of the industry. 17 By decreasing the amount of cobalt, the cost of alloy decreases. FeCrCo alloys are also known to possess a unique combination of magnetic and mechanical properties used in rotor rings for hysteresis motors. 18 Magnetically hard FeCrCo based alloys possess a combination of improved properties. Magnetic properties of FeCrCo permanent magnets with Si-addition investigated by Szymura 19 revealed stable magnetic properties at high temperatures. Si-addition was reported to prevent α to γ phase transformation. Silicon was reported to react with oxygen and develops oxides which significantly reduce the critical cooling rate that prevent α to γ transformation. 19 Silicon also increases the magnetic moment, by filling voids in 3d subshells of the alloy with valence electrons of silicon, thereby increasing remanence (Br) and energy product (BHmax) of the alloy.
In this work, systematic investigation of FeCrCo-Si alloy system was carried out in order to study the effect of process parameters especially two-stage thermomagnetic treatment along with step aging treatments on the phases, microstructure, and magnetic properties.
Experimental
FeCrCo magnetic alloy with minor additions of silicon, vanadium, titanium, and aluminum elements was produced using the manufacturing steps shown in Figure 1.
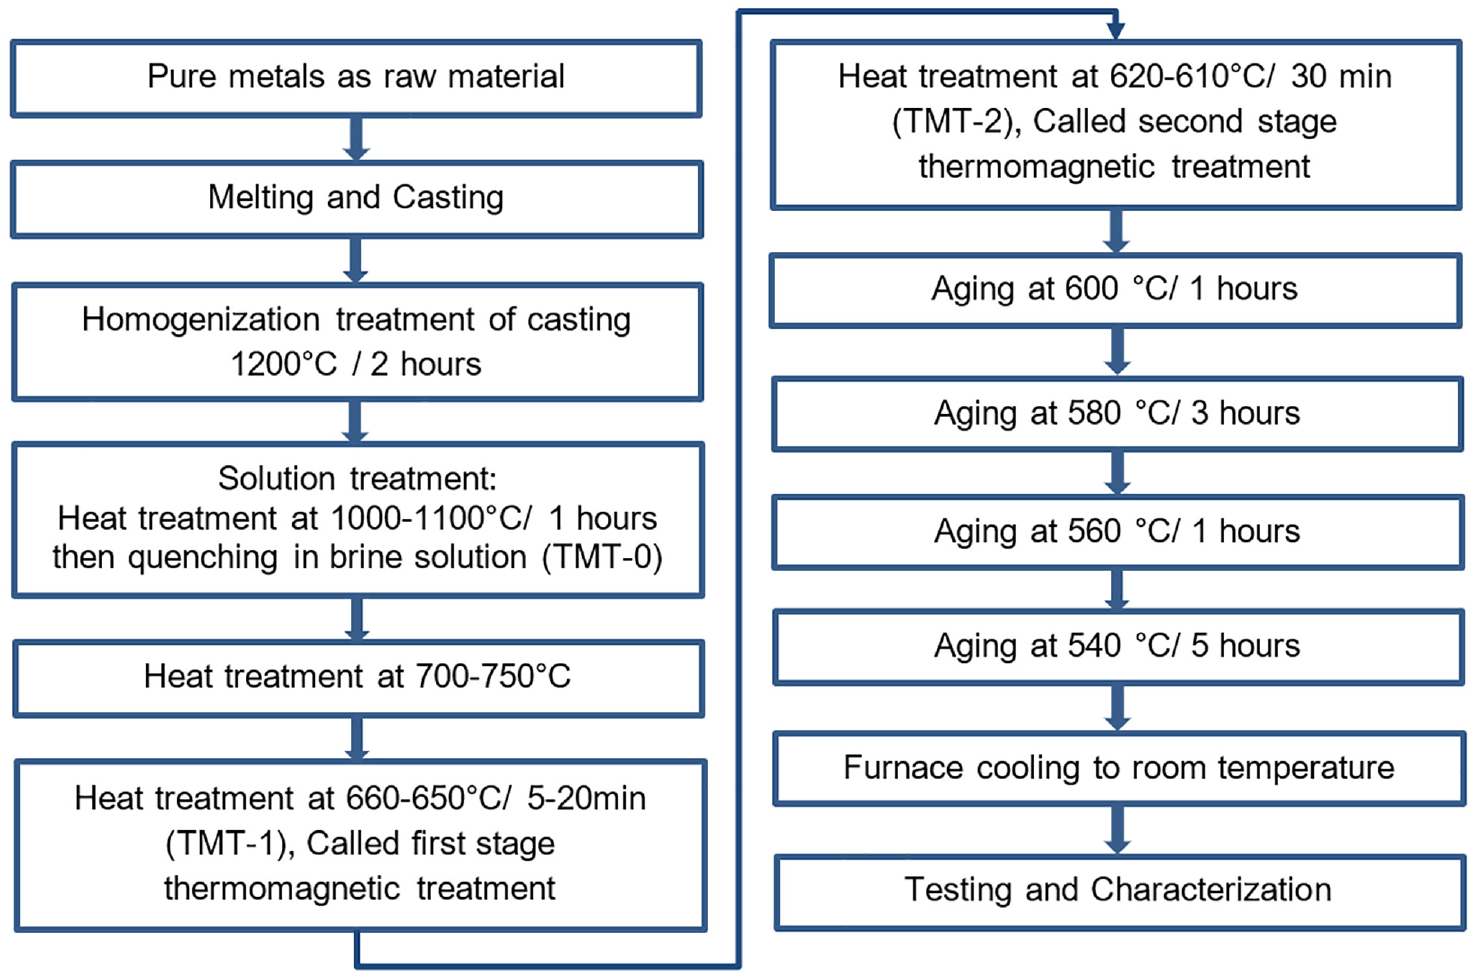
Sequence of steps involved in the manufacturing of magnetic samples.
Melting and casting
The required alloy composition was melted in vacuum induction furnace. For this purpose, pure metals, having purity ≥99.90%, were utilized. Before melting, the furnace was evacuated to 10−6 mbar and then argon gas was purged to 700 mbar. The cycle of evacuation and argon purging was performed three times to eliminate the presence of oxygen. Final melting and casting was performed in an inert argon atmosphere. After melting, the molten alloy was poured into a thin walled ceramic shell mold to obtain a fine grain structure. At the time of pouring, the melt temperature was measured using a Fluke pyrometer at around 1500°C
Heat treatment
The rod shaped castings having diameter 14 mm were homogenized at 1200°C for 2 h. The homogenized samples were then solution heat treated at 1000–1100°C for 1 hour in inert atmosphere box type furnace. The samples were then quenched in iced brine water solution. Fast cooling was used to avoid the formation of retained austenite in saturated solid solution (called TMT-0). After solution treatment, the rods were sliced to 20 mm length and subjected to pre-isothermal-magnetic treatment, where the samples were heated to 700–750°C to ensure to dissolve any undesired phases. The samples were then cooled down to isothermal-magnetic treatment (TMT) temperatures and held for specified time durations up to 20 min. For this purpose, custom designed two-poles magnetizing fixture and a tube furnace were developed and used. Scheme used for two-stage thermomagnetic treatment is illustrated in Figure 2. The temperature of the first stage thermo-magnetic treatment (called TMT-1) was selected after running a set of experiments. In these experiments, after TMT-0, the samples were heat treated between 620°C and 660°C. The magnetic properties data, presented in Figure 3, revealed that temperatures around 650°C were best for TMT-1. Therefore, the TMT-1 temperature range was set between 660 and 650°C for 20 min. This treatment was conducted to nucleate the α1 particles in the direction of applied external magnetic field. The second stage of TMT (called TMT-2) was performed at temperature range of 620–610°C for 30–60 min for further growth of α1 particles. During thermomagnetic treatments, the presence of 6 kilo Gauss magnetic field was ensured.
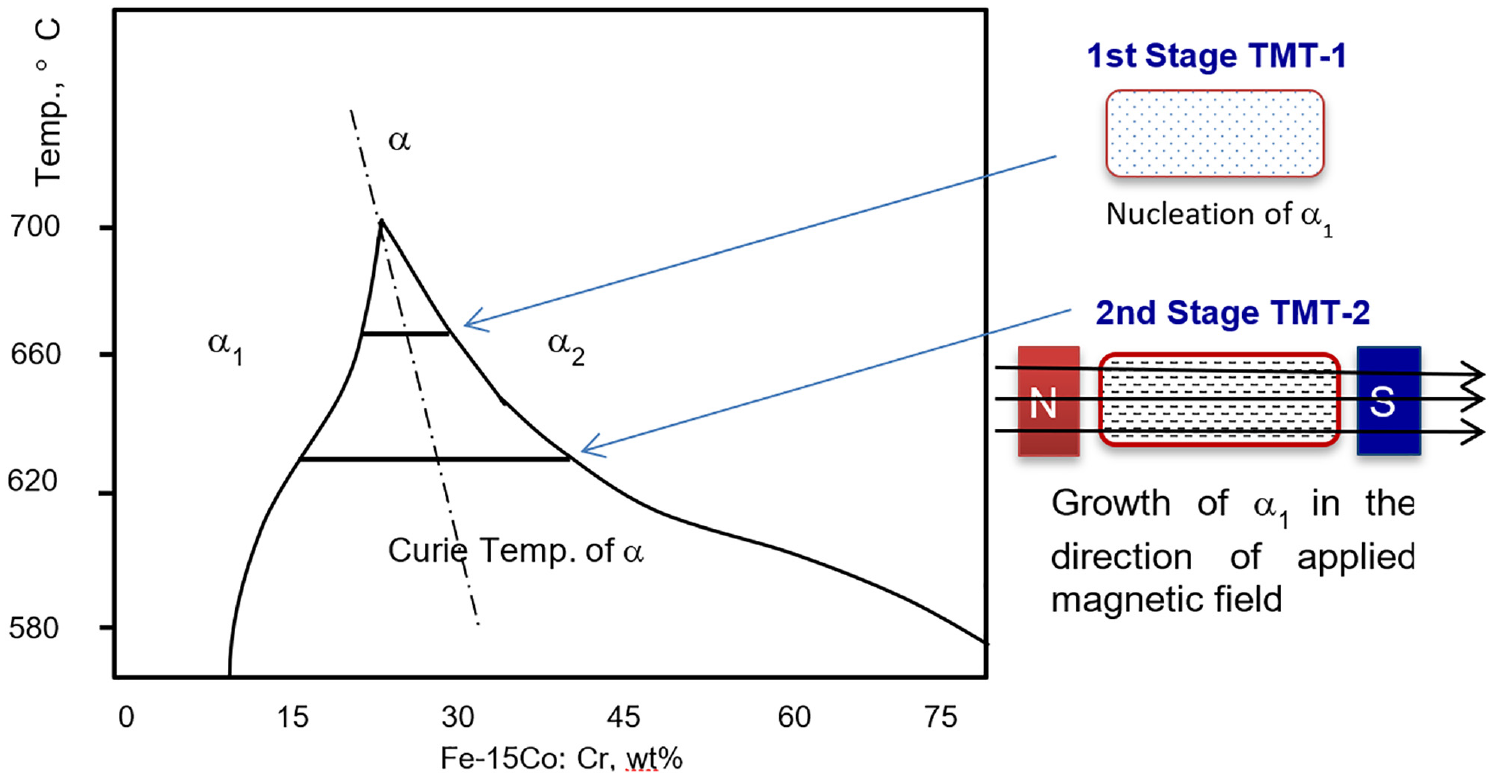
Schematic illustration of thermomagnetic treatment process for spinodal decomposition in FeCrCo alloy system.
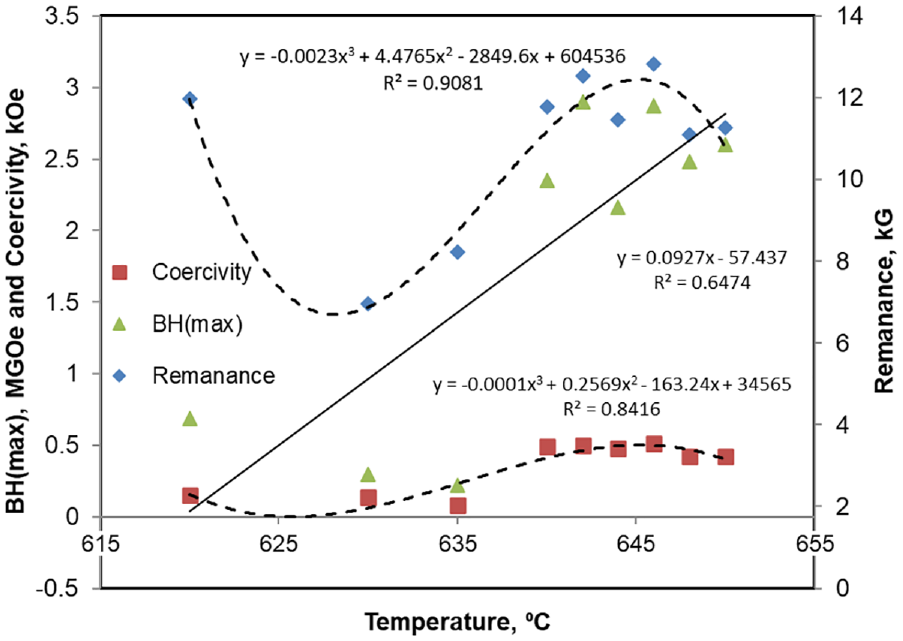
Magnetic properties demonstrated by the samples at different TMT-1 temperatures (different TMT-1 temperatures were tried to finalize the TMT-1 temperatures).
All the samples (TMT-0, TMT-1, or TMT-2) were subjected to step aging heat treatment as per GOST 24897 standard; that is, 600°C—1 h, 580°C—3 h, 560°C—1 h, 540°C—5 h and then furnace cooled. The step aging was performed with rated cooling between steps in a temperature controlled inert atmosphere furnace to avoid oxidation during prolonged heat treatments.
Development of electromagnetic system for the TMT
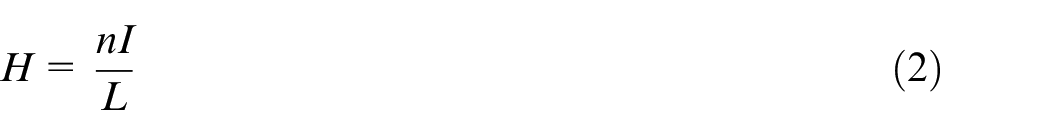
A lab scale electromagnetic system that could produce magnetic field up to 10 kilo Gauss and equipped with a tube furnace to enable controlled heating-cooling rates was used. The setup developed in-house was designed to operate at temperature up to 800°C. The design was based on Biot–Savart law for 3D distribution of magnetic field in normal air atmosphere: 20
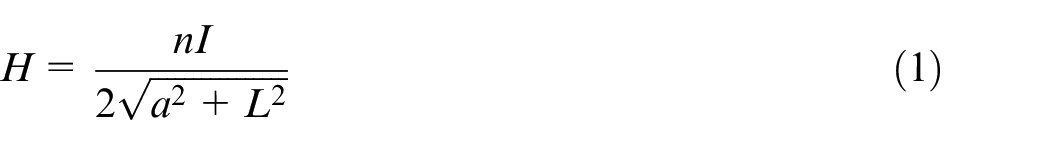
where n is number of turns, I is current through the coil, L is length of conductor wire, and “a” is radius of the coil. As per Ampere’s law, the magnetic field H generated around a current conducting closed loop is given as under:
Using ANSYS Magnetostatic module, physical parameters of the magnetic system were used for simulation along with number of turns and applied current. As a result, required magnetic flux density of 10 kilo Gauss for the electromagnetic system was obtained with magnetic flux contours.
Sample characterization
After completing the heat treatment cycle, the samples were characterized by different techniques. For this purpose, Energy Dispersive Spectrometer (EDS) attached with Scanning Electron microscope (SEM) was used to assess the chemical composition of the alloys. The SEM was also used to observe the microstructural changes in the samples. Optical microscopy was used to find the microstructure of the samples. X-ray diffraction (XRD) analysis was carried out using JEOL JDX-8030 XRD machine. A scanning step was kept at 0.05° and the samples were scanned from 20 to 90 degree 2-theta range. Differential Thermal Analysis (DTA) was done on NETZSCH Simultaneous Thermal Analyzer STA 449 F1. The sample taken for DTA was 15 mg, using alumina crucible, heated up to 1200°C while the heating rate was 10°C/min. The heating and cooling of the samples were done in inert argon atmosphere. Magnetic properties were measured by using DC magnetometer FE2100H. For this purpose, 10 mm × 10 mm (diameter × height) samples were machined to measure the hysteresis loop.
Results and discussion
Finite element analysis of electromagnet
Magnetic fields with varying intensities have been extensively utilized in several manufacturing processes to control and achieve requisite material characteristics.21–23 In this work, the required magnetic field strength was estimated by initially using integral form theoretical formulae which were then confirmed by Finite Element Analysis (FEA) ANSYS Magnetostatic module, as shown in Figures 4 and 5. ANSYS Workbench 2019 Magnetostatic Module was used for analysis of double coil magnetic field fixture. Due to the complexity of whole domain, unstructured mesh was applied. To capture small features and curvatures in the geometry, both proximity and curvature options were utilized in ANSYS Mesher. Mesh size for sample and core were kept fine with size of 10 mm, while remaining was left as default. Based on these settings, tetra dominant mesh was obtained with acceptable quality. Total number of elements obtained was 52,468. To improve accuracy, second order elements were used for the model. Accordingly, a multilayer solenoid coil utilizing enameled high purity copper wire was developed to reduce maximum voltage drop between windings. Comparison of magnetic field strength estimated by FEA and actual physical measurements for variant applied current are shown in Figure 6. It can be seen that the experimental values are well close to the simulation results. The developed system was used for the isothermal thermomagnetic treatment experiments, to produce requisite magnetic field strength for FeCrCo samples placed between the solenoid poles by variation in the applied current.
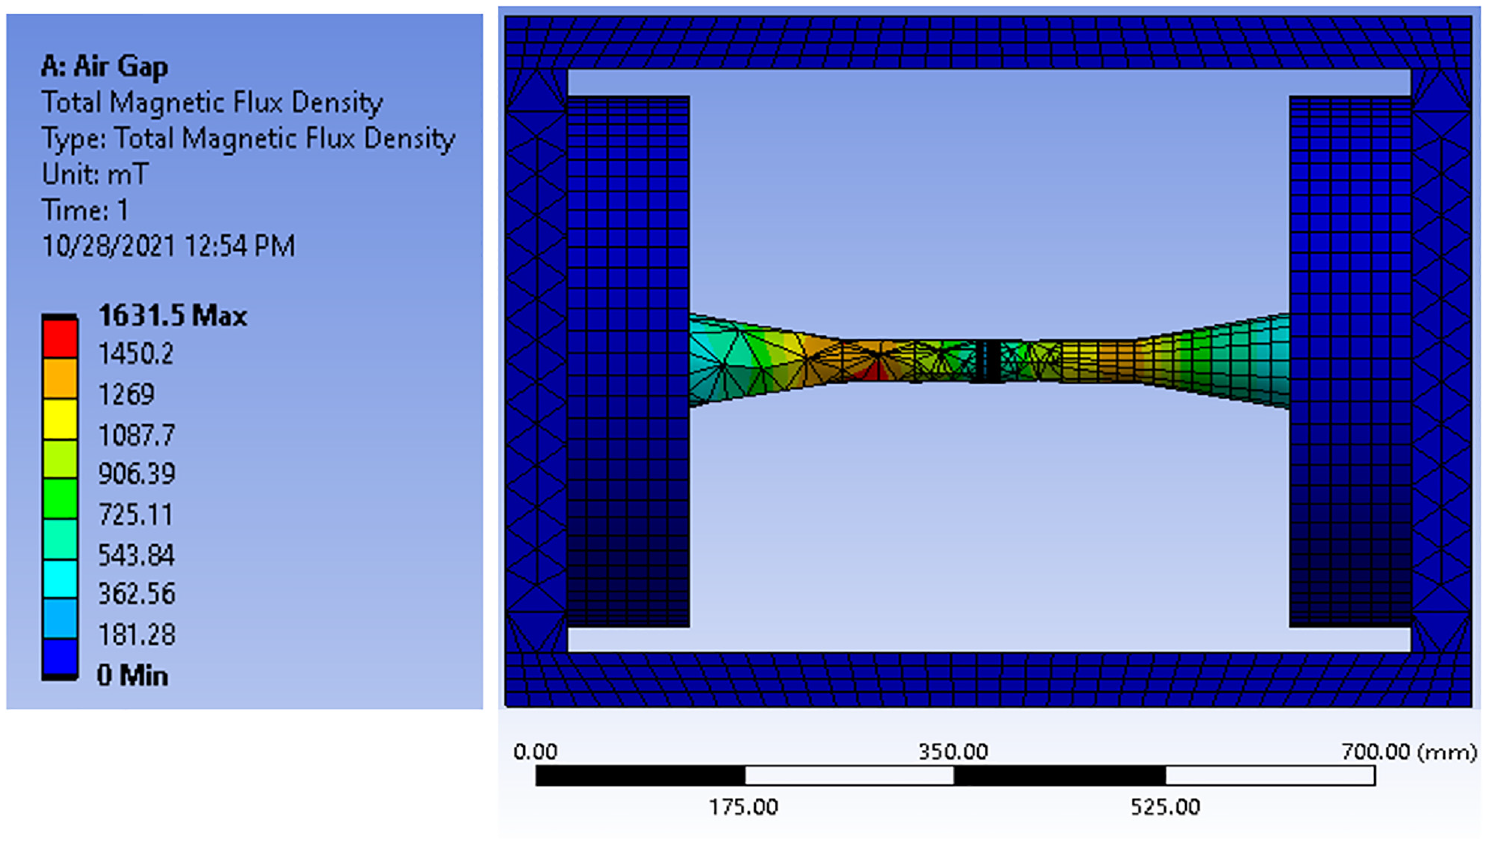
FEA model showing the total magnetic flux density in overall electromagnetic system with 20 mm air gap.
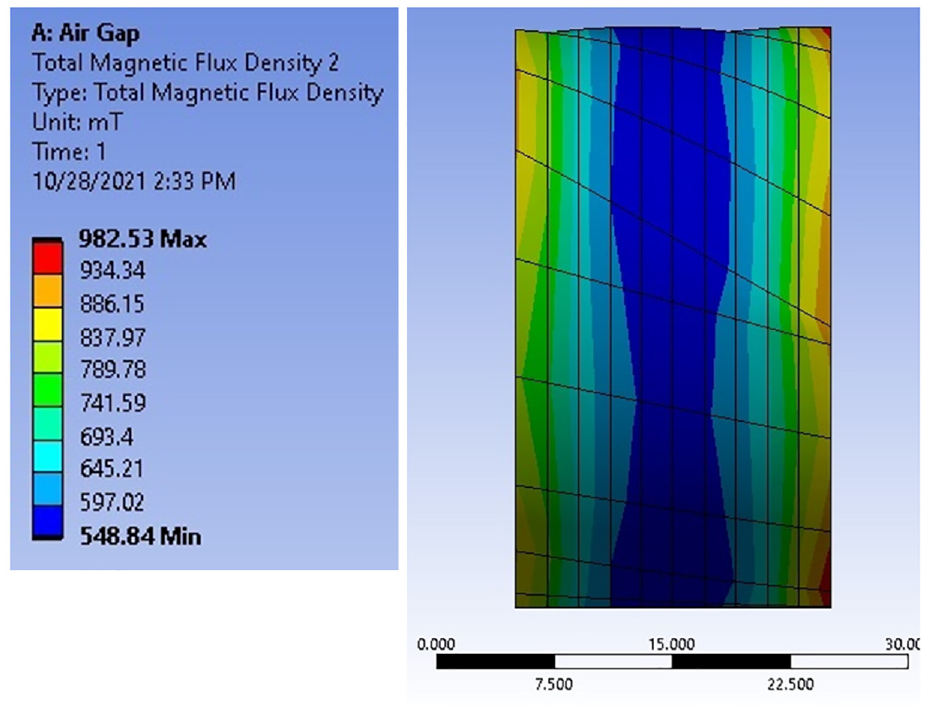
FEA model showing total magnetic flux density in 20 mm iron sample in the electromagnetic system.
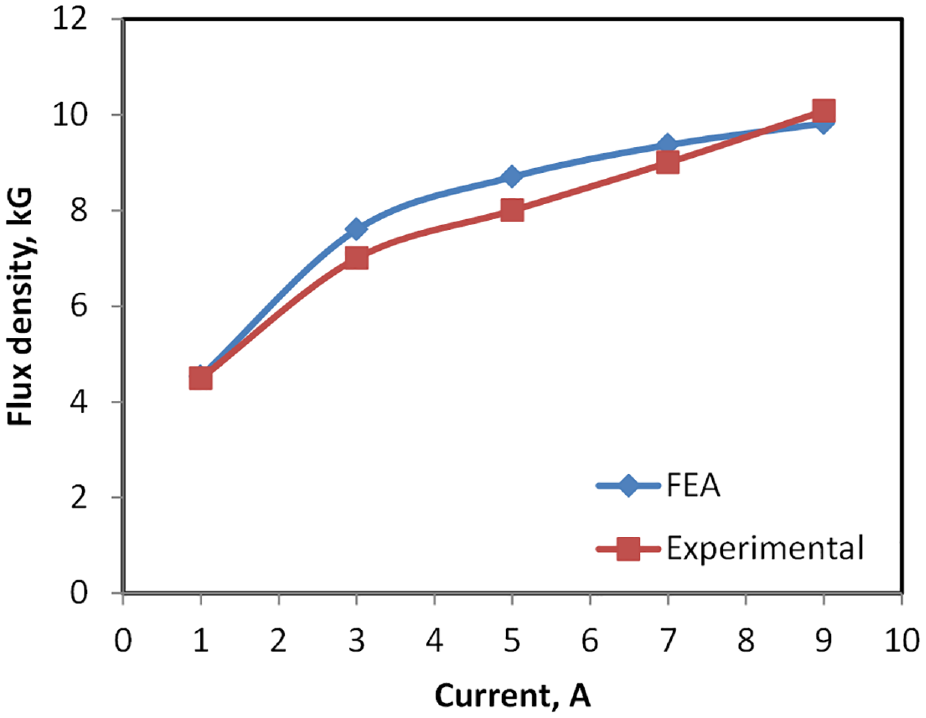
Comparison of experimental and simulation data of flux density at varying applied current.
Chemical composition
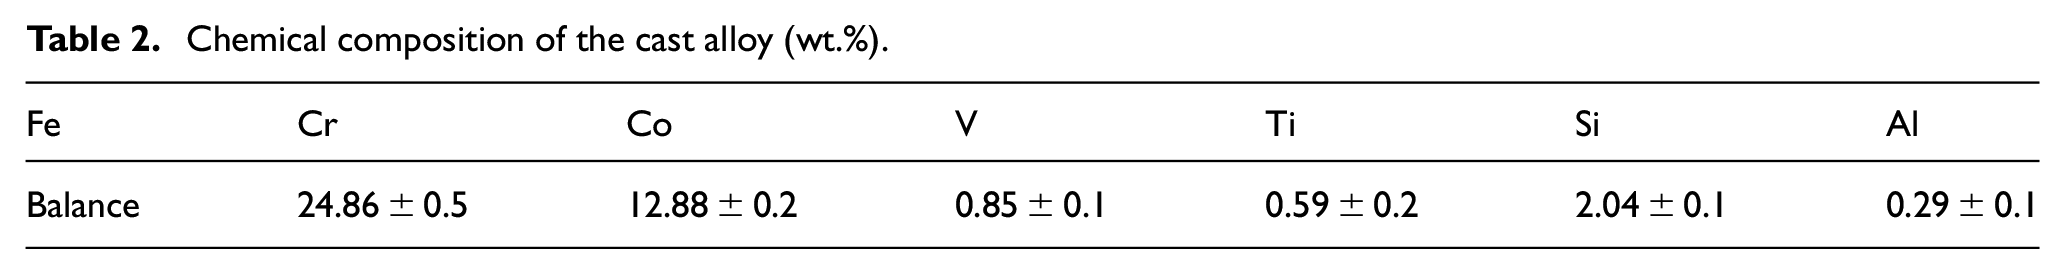
The chemical composition of the cast alloy is provided in Table 2. It can be seen that the cobalt concentration was decreased to around 13 (wt.)%, while 2 (wt.)% silicon was added in the alloy.
Chemical composition of the cast alloy (wt.%).
Metallography
Microscopic analysis revealed that the coarse grains were formed during the casting of alloy as in Figure 7. The grain size varied from 150 to 250 μm. Moreover, non-metallic inclusions of TiS, TiO2, and Al2O3 were also observed in the sample, which were found to be dispersed in the matrix of the sample. Scanning electron microscopy revealed the formation of α1 structure in the samples, after final heat treatment (Figure 8(a)). The calculated size of α1 was around 30 nm. This type of structure is formed due to miscibility gap of α-phase that exists in FeCrCo alloys. In FeCrCo alloy system, the structure formed is two phase α1 and α2 obtained by spinodal decomposition of αbcc-phase. The α1 is FeCo rich magnetic phase and the α2 is Cr rich paramagnetic phase.
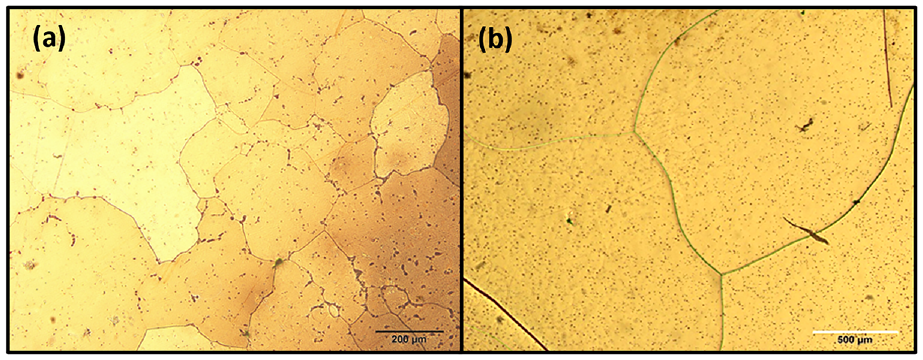
Micrographs showing (a) coarse alpha grains and (b) black dots in the matrix are non-metallic inclusions.
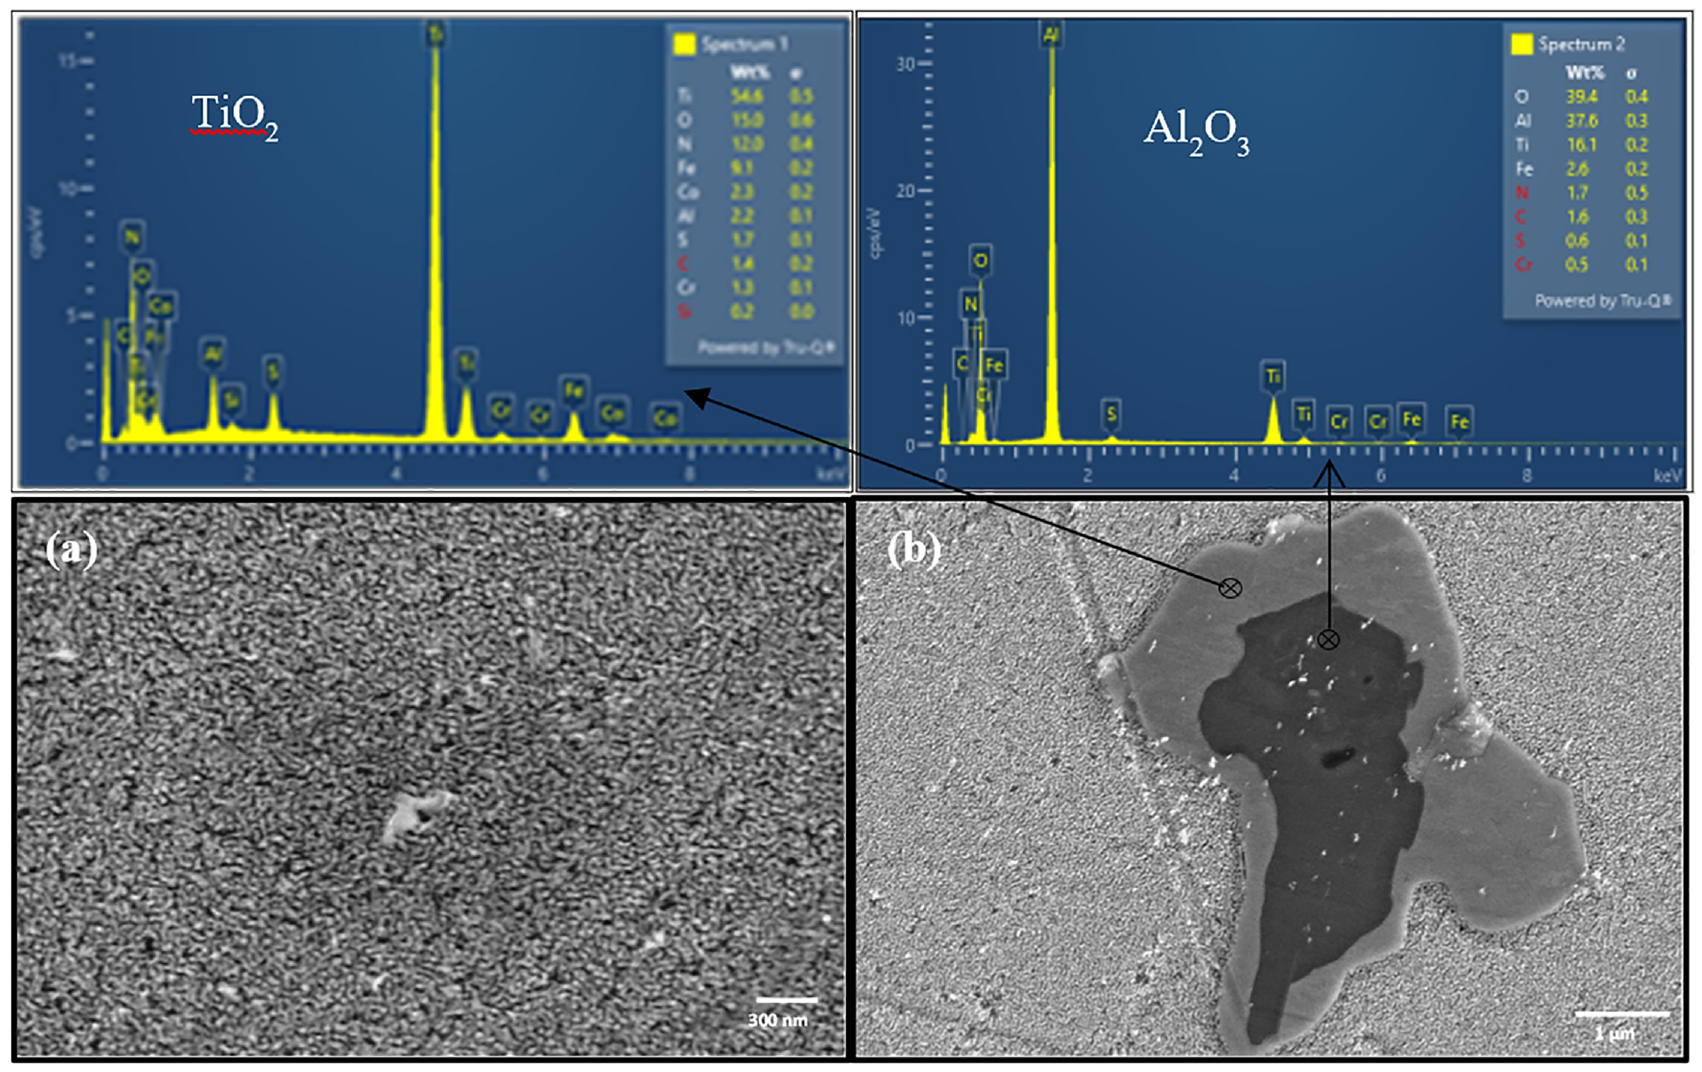
(a) Microstructure revealing the presence of α1 phase and (b) formation of some impurities in the sample.
The FeCrCo alloy is based on spinodal decomposition theory. During spinodal decomposition process, a metastable solid solution decomposes into two distinct phases each having different properties. 24 This mechanism differs from the phenomenon of nucleation. In spinodal decomposition, the phase separation is much fine and occurs uniformly throughout the alloy. Cahn 25 explained this phenomenon of spinodal decomposition in the heat treatments of supersaturated phases. Spinodal decomposition is a functional phenomenon utilized in processing of hard magnetic materials like Alnico and FeCrCo alloys, as the structure formed favors stable magnetic characteristics. Microstructure thus formed could be optimized by thermomagnetic treatments and step aging treatments. 26 Phase separation in FeCrCo alloy occurs in temperature range of 700–500°C and produces a highly inter connected three dimensional network structure. Chemistry of the formed phases progressively changes with time until the equilibrium is attained. Coarsening of the microstructure occurs with time during step aging treatments. Thermomagnetic treatment (TMT) temperature, applied magnetic field intensity, and holding time all have effect on magnetic characteristics of the FeCrCo alloys. The high intensity of applied magnetic field combined with appropriate temperature and holding time during TMT are favorable to form proper size and morphology of particles of α1 and α2 phases. In the FeCrCo alloy system, separation of α1 and α2 phases initiates at low super saturations by the process of nucleation, and un-mixing occurs at high super saturations by spinodal decomposition.27,28 Nucleation is associated with metastability in the miscibility gap of FeCrCo alloy system and requires large composition fluctuation to overcome the energy barrier to form a nucleus of critical size which can further grow easily.
Moreover, formation of titania and alumina impurities is evident in Figure 8(b). It can be observed that firstly aluminum oxide formed as a precursor and then it encapsulated with titanium oxide.
X-ray diffraction analysis
XRD results are shown in Figure 9. It can be seen from the graphs that the main phase in FeCrCoSi alloy is body centered cubic (bcc) type ferrite. All the main peaks are matched with PDF card number 06-0696. The (110) peak of ferrite is prominent in all the samples. Austenite peak (111) is also observed in three samples, PDF card number 52-0513. The relative content of the austenite was calculated by using the maximum intensity peaks, that is, (111) of austenite and (110) peak of ferrite. It was determined that small amount of austenite was present in all the samples. Aging treatment had no effect on the amount of the austenite since it was performed at relatively lower temperatures.
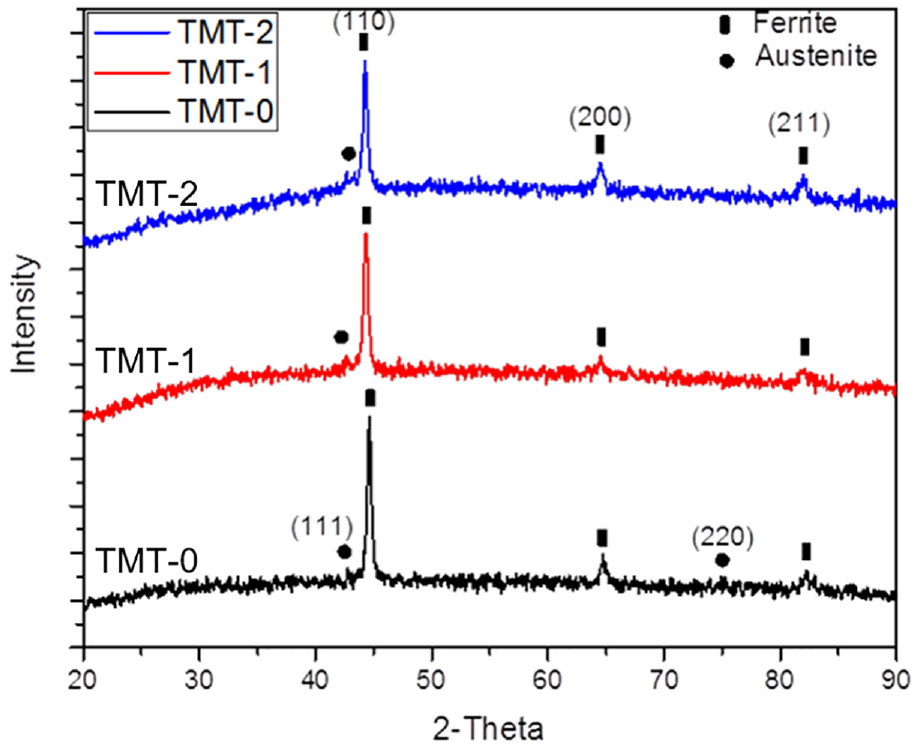
XRD patterns of the three samples showing the formation of ferrite phase along with minor quantity of austenite phase.
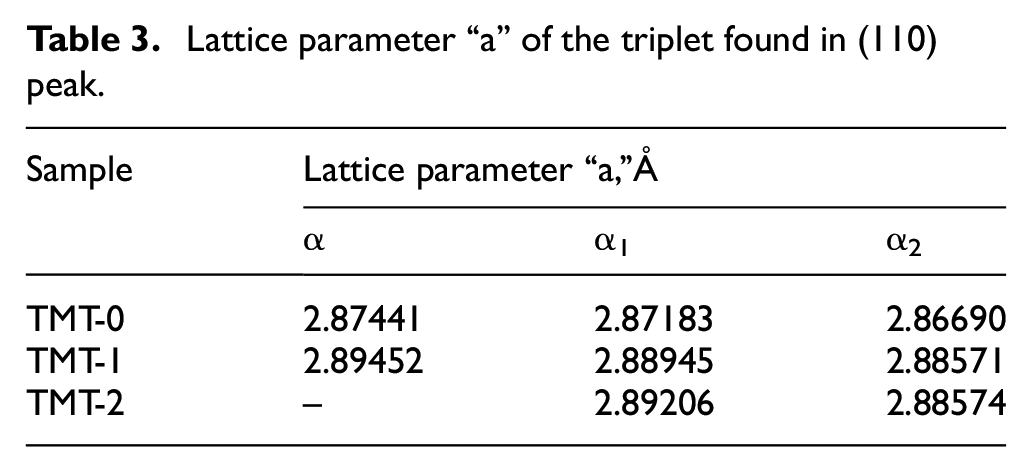
Slight shift in XRD pattern was noted after TMT-1 and TMT-2 treatments. All the peaks of TMT-1 and TMT-2 are shifted toward the left. This shows the relaxation of the stresses which may be due to the diffusion of Cr and Co elements during the thermal treatments. The magnified image of peak (110), for the three samples, is compared in Figure 10. It can be seen that (110) peak consists of three small peaks referred as α, α1, and α2. All these peaks represent the ferrite phase with minor difference in the lattice parameters. The lattice parameter for the three alpha peaks is calculated and presented in Table 3. The data show that with heat treatment lattice parameter “a” relatively expanded from TMT-0 to TMT-2 treatment. The difference between lattice parameters of α1 and α2 phases determines the importance of elastic strain energy of the phases in formation of this type of fine crystal structure. The presence of α-phase in TMT-0 and TMT-1 samples demonstrates that complete transformation is still pending until TMT-2 treatment, where only α1 and α2 phases are present. The α1 represents magnetic phase rich in iron while α2 is paramagnetic phase. Further, it can be noted that no sigma phase peak is observed in all the three samples.
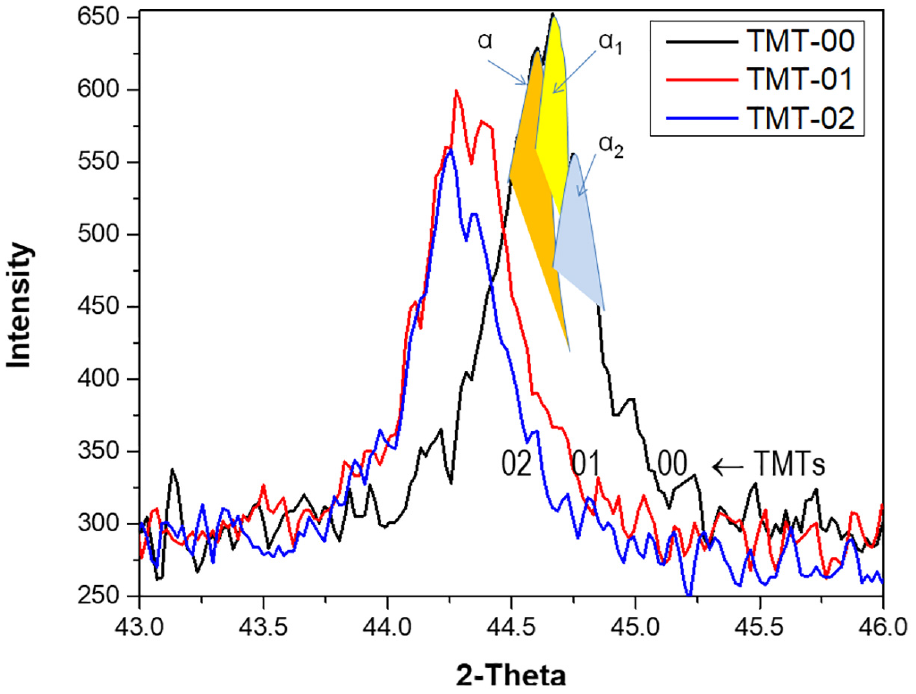
XRD pattern showing (110) peak in three TMT conditions.
Lattice parameter “a” of the triplet found in (110) peak.
Differential thermal analysis
The differential thermal analysis (DTA) curves for the three samples are shown in Figure 11. It can be seen that the first peak observed at 570°C. As per phase diagram mentioned by Zhukova et al., 29 this peak corresponds to the transformation of α“alpha” phase to γ“gamma” and σ“sigma” phase. On further increase in temperature, the exothermic behavior of the three curves continues till the temperature rises to around 800°C. This exothermic behavior may refer to the continuous increase in sigma or gamma phase. It is noted that the TMT-0 curve is more oriented toward exothermic direction while TMT-1 and TMT-2 follow comparatively lower trends. This behavior might reflect the fact that thermal treatments may promote ordering in the atomic structure and therefore, less energy gain was observed in case of TMT-2 as compared to TMT-1 and TMT-0 samples. Beyond 800°C, the three curves started to decline in energy showing dissociation of sigma phase. A comparatively sharp peak observed in TMT-0 sample at 927°C demonstrated the complete transformation of sigma phase into alpha and gamma phases. The same thermodynamic event with less intensity was also observed for TMT-1 while this further decreased for TMT-2 sample. This implies that the formation of sigma phase tends to decrease with heat treatments. The dissolution of sigma phase into the matrix alpha phase was also observed by Han et al., 30 where it was noted that the phenomenon of elemental diffusion was response for that event. The cooling curves for the same samples, shown in Figure 12, confirm the transformation of gamma phase to alpha phase at around 620°C.
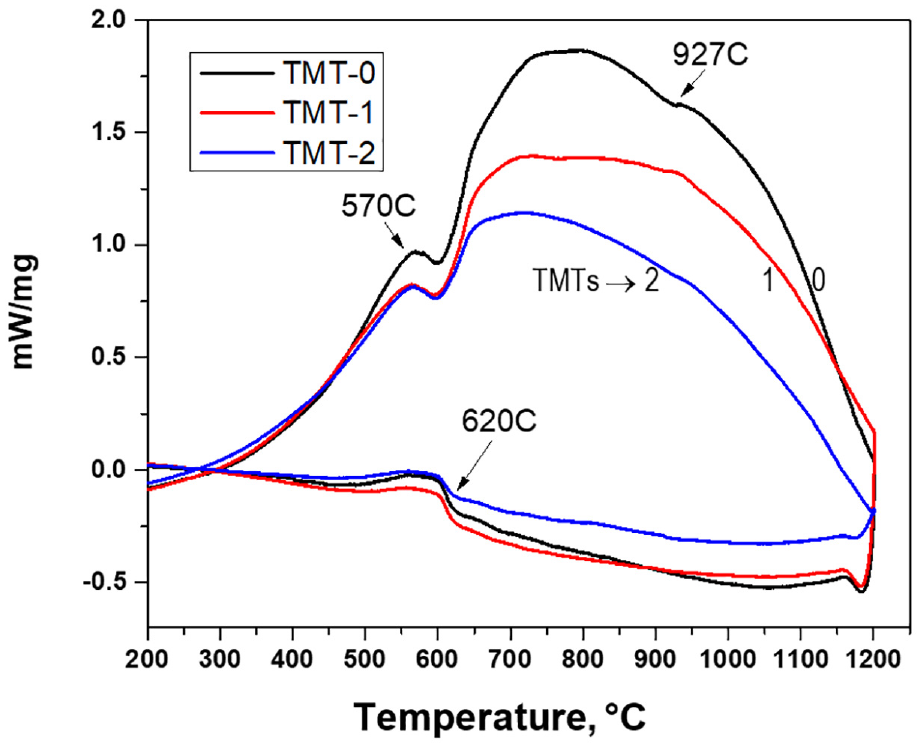
DTA heating curves for the three samples showing the thermodynamic activities at different temperatures.
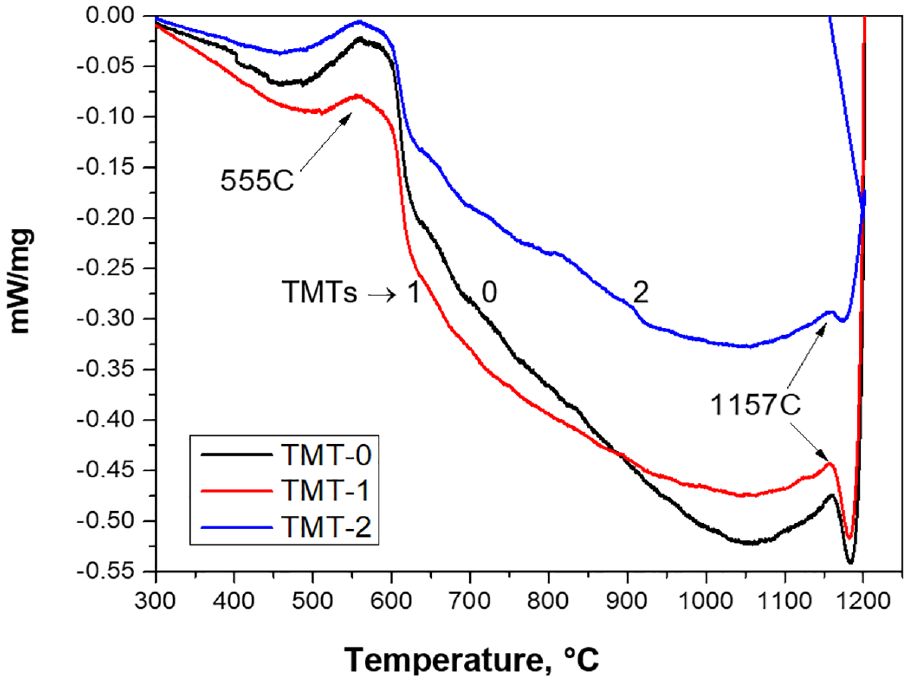
DTA cooling curves for the three samples showing the thermodynamic activities at different temperatures.
Magnetic properties
The magnetic properties on the basis of which TMT-1 cycle temperatures were finalized are shown in Figure 3. It can be seen that the energy product BHmax, coercivity, and remanence follow an increasing trend with the processing temperature. Thus, the temperatures selected for TMT-1, as discussed above, are justified. The increase in magnetic properties can be attributed to the fact that α1 nucleated easily at higher temperatures than at lower processing temperatures.
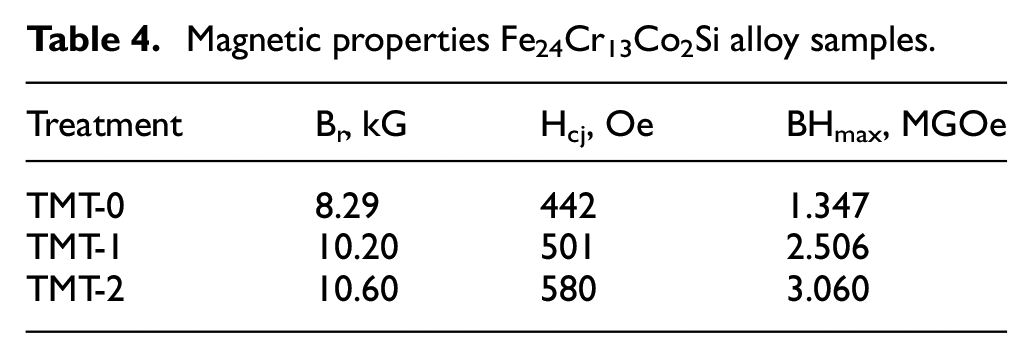
The final magnetic properties of the samples are presented in Figure 13 and Table 4. The three MH curves demonstrate no kink or any other abnormality showing that there is no other phase which has different magnetization reversal than the ferrite phase. It was also observed that the remanence value constantly increases with increase in TMT treatment, Figure 14. However, the coercivity curve firstly increased with TMT-1 treatment but decreased with TMT-2 treatment. The increase in remanence is due to the diffusion of alloying elements in α1 and α2 phases and being separated distinctively. The subsequent decrease in coercivity at the stage of TMT-2 might be related with complete disappearance of α-phase which was present at the stage of TMT-1. The presence of α-phase may pin the domain wall moments and therefore, higher coercivity can be observed at stage TMT-1 as compared to TMT-2. Further, the coercivity in the FeCrCo alloys depends upon the shape anisotropy and morphology of α1 phase that is developed by nucleation and growth of Co-rich α1-phase in Cr-rich α2-matrix. This can be ascribed to the fact that the elongated shape of α1 phase may distort in double isothermal treatment.
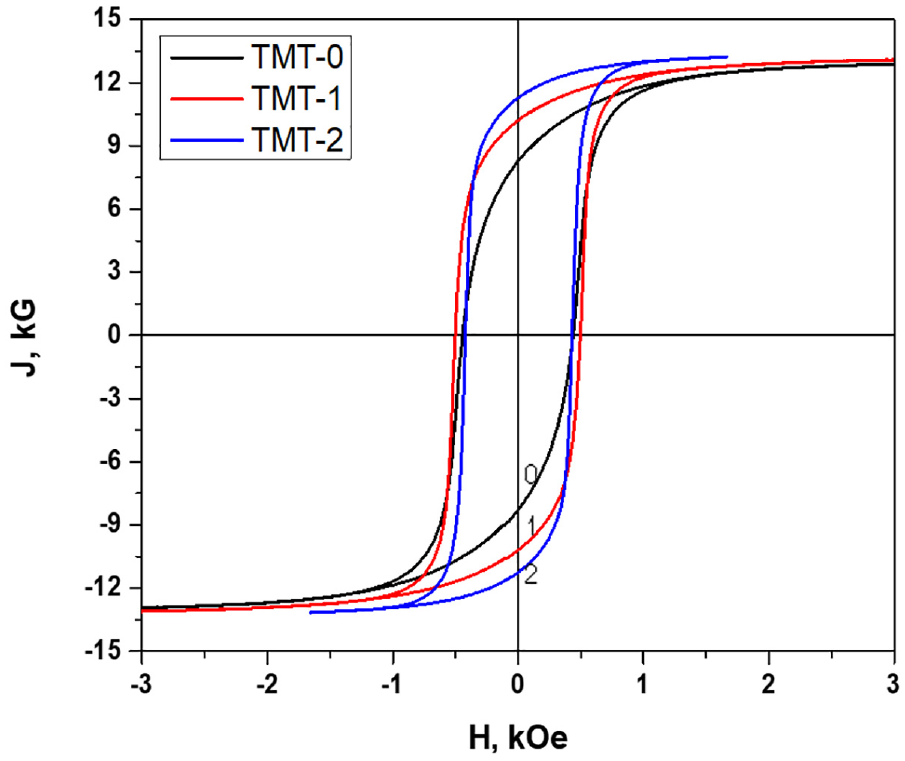
MH curves showing the different magnetic properties after heat treatment cycles.
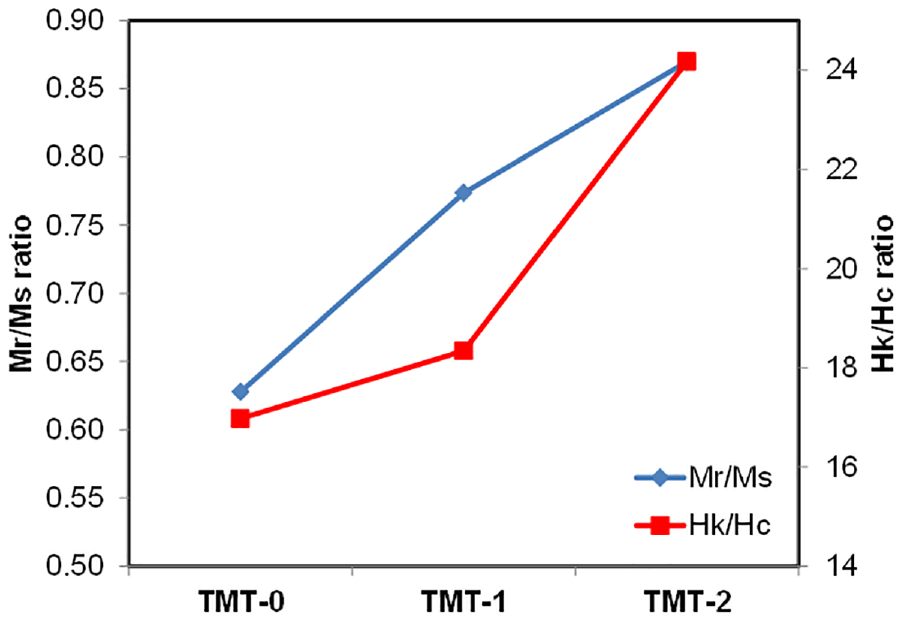
The remanence ratio (Mr/Ms) and the squareness of the MH curves (Hk/Hc) presented for different heat treatment conditions.
Magnetic properties Fe24Cr13Co2Si alloy samples.
Requisite microstructure in FeCrCo magnetic alloy system is to have isolated precipitates of α1-phase in α2-matrix. These phases which are possible in high chromium (>20 at. %) alloys, result in higher values of Br, Hc and BHmax. Squareness of the magnetic hysteresis loop also depends upon the magnitude of the applied magnetic field during thermomagnetic treatment and is governed by degree to which α1-precipitates are preferably oriented. 31
The Mr/Ms ratio, often called remanence ratio,32,33 shows the alignment of the α1 phase toward the magnetic field. This ratio varies from 0.5 to 1.0, where the values close to 1.0 refer to good magnetic alignment of the phase. In these experiments, the Mr/Ms ratio exceeds 0.85 for TMT-2 samples, as shown in Figure 14. Further, the squareness of the MH curve is found to be improved with heat treatments, Figure 14. In this regard, the ratio Hk/Hc is used to quantify the squareness of the MH curves. 34 The Hk is the reversal field, where magnetic moments 4πM drop down to 90% of the 4πMr. The increase in squareness represents the stability of the magnet which clearly improved with TMT-2 treatment as compared to TMT-1.
Conclusions
In this research, a lab scale thermo-magnetic treatment setup was designed and developed. For this purpose, finite element analysis results were utilized. The simulated and experimental flux density values were found to be very close. Further, silicon added low cobalt Fe-25Cr-13Co alloy was successfully produced and tested. The novel double isothermal thermomagnetic treatment proved to be effective in achieving high remanence ratio and improving the squareness of the MH curve. The improvement in magnetic properties was attributed to the elimination of retained α phase and formation of more α1 phase.
Footnotes
Appendix
Declaration of conflicting interests
The author(s) declared no potential conflicts of interest with respect to the research, authorship, and/or publication of this article.
Funding
The author(s) received no financial support for the research, authorship, and/or publication of this article.