
Abstract
The temporal evolution of the microstructure resulting from phase separation into Fe rich (α), Cr rich (α′), and Fe(Ti,Al) (β′) phases of an oxide dispersion strengthened ferritic steel has been analysed by thermoelectric power measurements. The early stages of decomposition and the evolution of the three-dimensional microstructure have been characterised by atom probe tomography. The roles of Cr, Al, and Ti during the decomposition process have been investigated in terms of solute partitioning between the phases. Analysis of proximity histograms revealed that significant Al and Ti partitioning occurs, which is consistent with theoretical calculations. The results indicate that both nanoscale precipitation processes occurs simultaneously, with an earlier completion time for β′ precipitation than α–α′ phase separation. Finally, a value of activation energy for α–α′ phase separation of 264 kJ mol−1 was obtained from the analysis of thermoelectric power measurements data, which is consistent with a value of 248 kJ mol−1 for self-diffusion of Cr in α-Fe.
Keywords
Introduction
In order to meet future energy demands, new materials will be required to withstand extreme environments. Ferritic FeCr(Al) oxide dispersion strengthened (ODS) steels are an example of engineered steel composite that have excellent potential for use in next generation high temperature applications where superior creep strength and oxidation resistance is paramount. Originally designed as heat resistant steels for conventional fossil fuel power plants, the high Cr ODS steels are a successful example of development to overcome the issues to meet material requirements for next generation nuclear systems. In order to maintain mechanical properties under harsh conditions, i.e. the combination of cyclic thermal loads, exposure to highly corrosive environments, and a hard and intense mixed proton/neutron fields, to the end of life of a component in a nuclear reactor, a highly stable microstructure is essential. Nanostructured ferritic FeCrAl ODS steels are ideal candidates for those applications, because these alloys usually contain a high density of Y/Al-rich and Ti/Al rich nanoparticles, high dislocation densities and fine grains.
The FeCrAl ODS ferritic steels are manufactured by a complex powder metallurgy route. Owing to their high creep rupture strength and excellent swelling resistance, many developments concerning ODS ferritic steels are underway in several types of nuclear reactors such as sodium fast reactors (SFR), very high temperature reactors (VHTR), super critical water reactors (SCWR), or other GEN IV nuclear energy systems. 1 For such applications, these alloys face a severe embrittlement problem because their service temperature lies in the range of 300–500°C. After long term service, loss of impact toughness and ductility is often observed, which may lead to the degradation of the properties of the component. It is, therefore, of technological importance to understand the underlying mechanism(s) of phase separation occurring in these FeCrAl ODS ferritic steels. In this paper, the characterisation of the simultaneous nanoscale precipitation process by two complementary techniques: thermoelectric power (TEP) and atom probe tomography (APT) in a FeCrAl ODS ferritic steel during aging at temperatures ranging from 435 to 525°C is presented. The goal is to determine the microstructural and kinetic evolution of α–α′ phase separation process and the of Fe(Ti,Al) (β′) precipitation.
Materials and experimental techniques
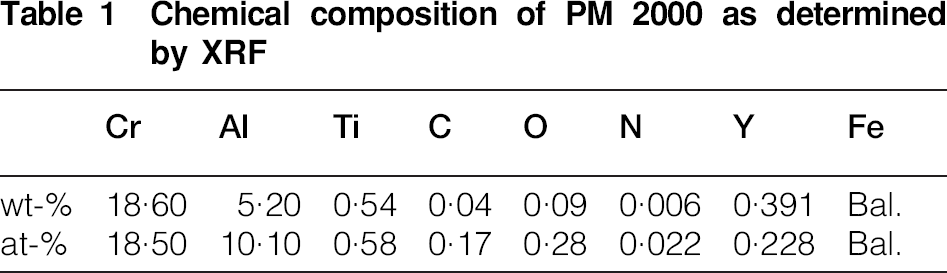
The Fe–20Cr–6Al–0·5Ti ODS alloy used in this study was manufactured by Plansee GmbH and is commercially known as PM 2000. The chemical composition is listed in Table 1. PM 2000 is a dispersion strengthened steel manufactured by a mechanical alloying (MA) process in a hydrogen atmosphere, as described elsewhere. 2
Chemical composition of PM 2000 as determined by XRF
The set-up of the TEP equipment is given elsewhere. 3 The principle of TEP is based on the Seebeck effect. If a metal sample is subjected to a temperature gradient ΔT, then a voltage difference ΔV is generated across the sample due to the Seebeck effect. For a low thermal gradient, the relationship ΔV = ΔSΔT holds, where the Seebeck coefficient, ΔS, is the difference between the TEP of the sample (ΔS1) and the TEP of the reference metal (ΔS0). Schematic representations of the TEP measurement apparatus are given elsewhere.4,5 The experimental procedure of the TEP measurement is the following: the sample is pressed between two blocks of a reference metal (in this case, pure copper). One of the blocks is held at 15°C, whereas the other is held at 25°C to obtain the ΔT. The ΔV generated is recorded instantaneously and precisely (to approximately ±0·5). The resolution is of the order of 0·001 μV K−1.
Atom probe tomography specimens were cut from the bulk material and electropolished with the standard double layer and micropolishing methods. 6 For some specimens, a focused ion beam (FIB) annular milling technique was used in the final stage of specimen preparation to ensure a circular cross section. Atom probe analyses were performed in the ORNL local electrode atom probes (LEAP 2017 and 4000X HR) manufactured by CAMECA Instruments Inc. The LEAP was operated in voltage mode with a specimen temperature of 60 K, a pulse repetition rate of 200 kHz, and a pulse fraction of 0·2 in order to mitigate the preferential field evaporation process of chromium atoms. Only data sets containing more than 2·5 million atoms were used to ensure that the reconstructed volume of material is sufficient to characterise the α–α′ phase separation. The treatment of the data is performed with standard APT analysis tools. 6
Results and discussion
General microstructure of PM 2000
The microstructure in the as extruded and hot rolled condition consists of fine grains of ferrite (Fig. 1). The transversal section observation reveals grains with ∼0·5 μm in average diameter, meanwhile the grains were slightly elongated in the extrusion and rolling direction with an average value of ∼2 μm in length. The microstructure exhibited no major rolling texture. This microstructure indicates that the rolling temperature is high enough for recrystallisation to have occurred with possibly a little grain growth. Furthermore, texture analyses reveal a weak fibre texture, ∼1·4 times random, with the <110> direction parallel to the rolling direction, i.e. the (110) plane is perpendicular to the bar axis. This texture is typical of body centred cubic materials deformed by either extrusion or rolling.
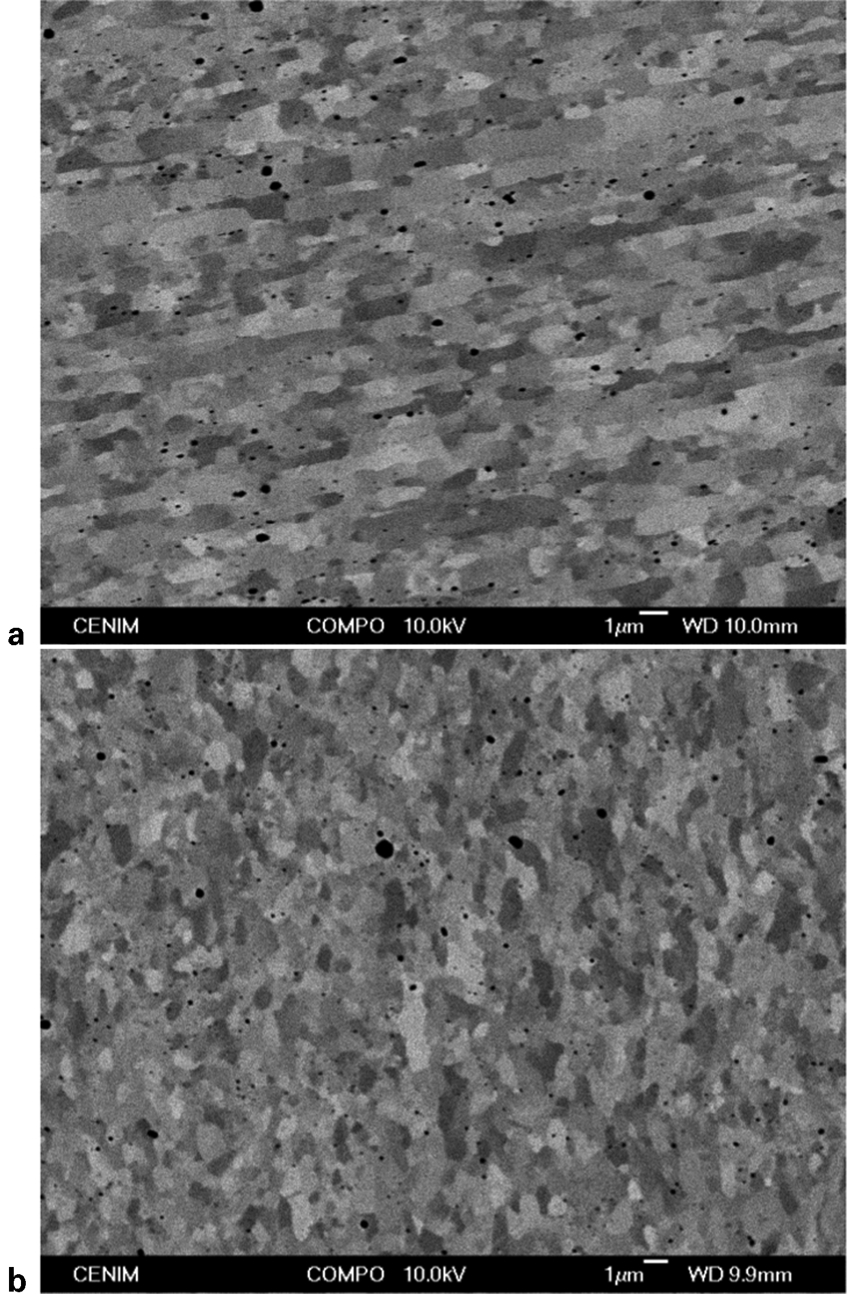
Electron backscattered images of as rolled microstructure of PM 2000 a longitudinal direction and b transverse direction
Thermodynamic calculations
Calculations to determine the miscibility gap and spinodal region in Fe–Cr–Al–Ti system has been performed under computer coupling of phase diagrams and thermochemistry (CALPHAD) formulation with the commercial software MT-DATA thermodynamic database.
7
The total molar Gibbs free energy Gtot is given by


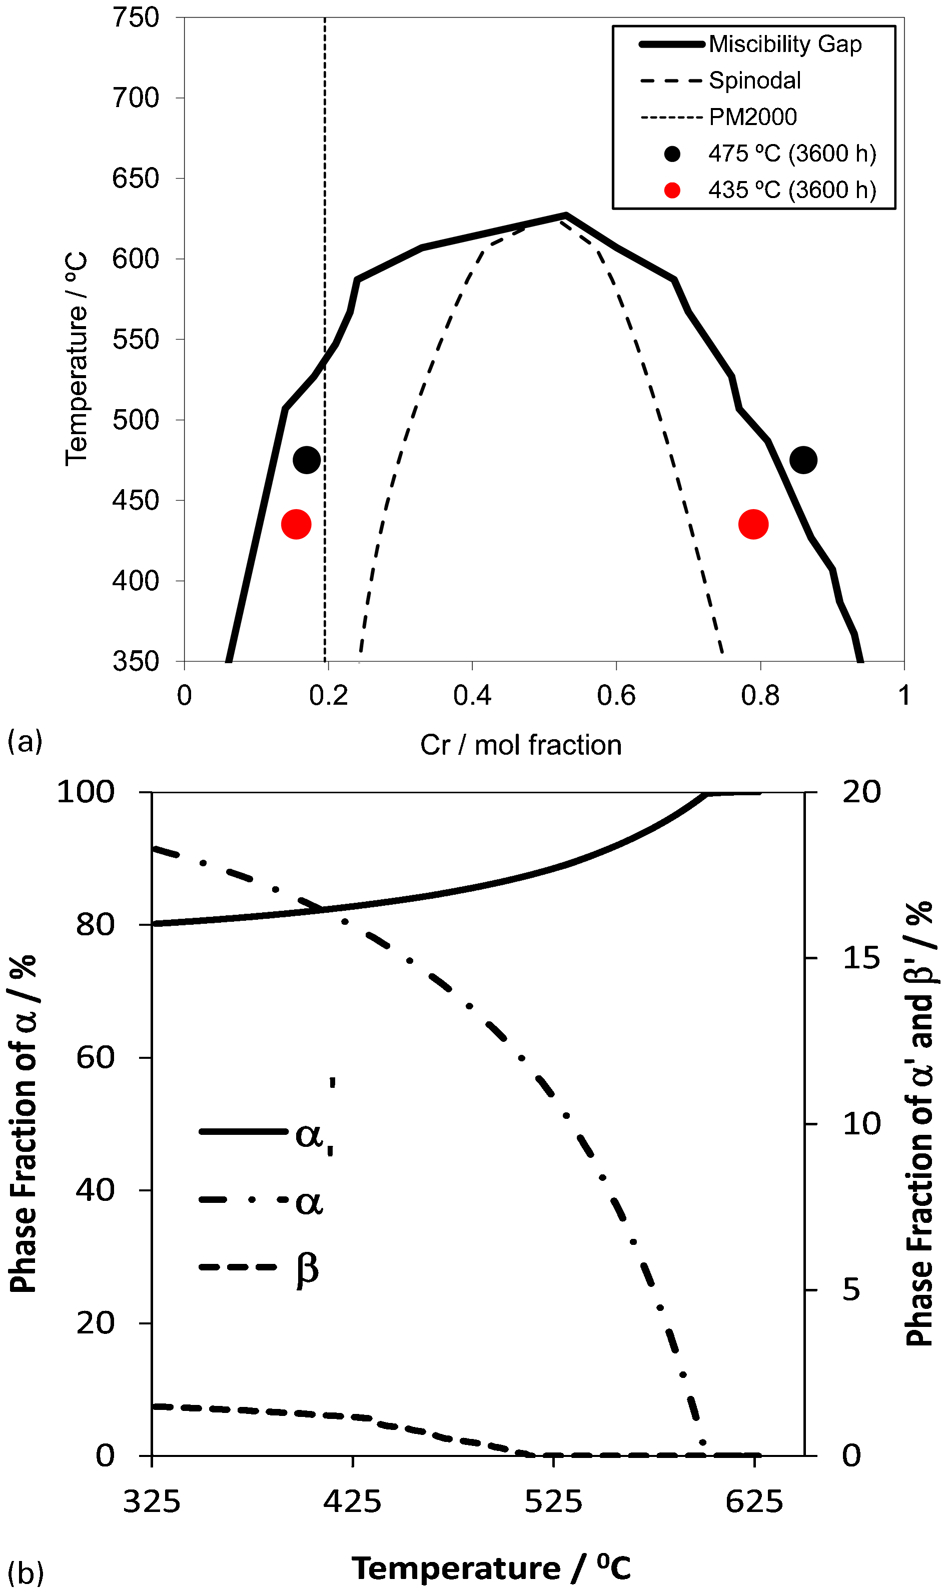
a miscibility gap calculated with composition obtained from APT for α and α′ particles and b evolution of α, α′ and β′ volume fractions with aging temperature
The compositions of the α and α′ phases determined after APT measurements at 435 and 475°C are indicated as full circles in Fig. 2a. It is clear that the compositions of both α and α′ particles indicates that the transformation is almost finished at both temperatures after 3600 h aging time. The evolution of the calculated α and α′ phases with ageing time is illustrated in Fig. 2b. Form this figure, it could be concluded that the differences in volume fraction of α′ phase after aging at 435 and 475°C is small. The evolution of Al rich and Ti rich β′ phase is also shown in Fig. 2b. It is assumed in these calculations that β′ phase corresponds to the L12 ordered Fe2AlTi phase with the Ti substituting for the Al (as it does in Ni3Al). This β′ phase is also the basis of the iron based superalloy (Fe–Al–Ni–Mo) that was shown to have an approximate composition of 51Al–38Ni–11Fe.10–12 This β′ enriched phase is predicted to have a significantly lower number density compared to that of the α′ phase.
Characterisation of nanoscale precipitation by APT
The three-dimensional microstructure, as determined by APT, resulting from aging at 435°C, is shown in Fig. 3. Because of the relatively low chromium content of the alloy, the Cr rich α′ phase is in the form of isolated particles rather than the interconnected network structure observed previously in Fe–Cr alloys containing between ∼24 and ∼45. 13
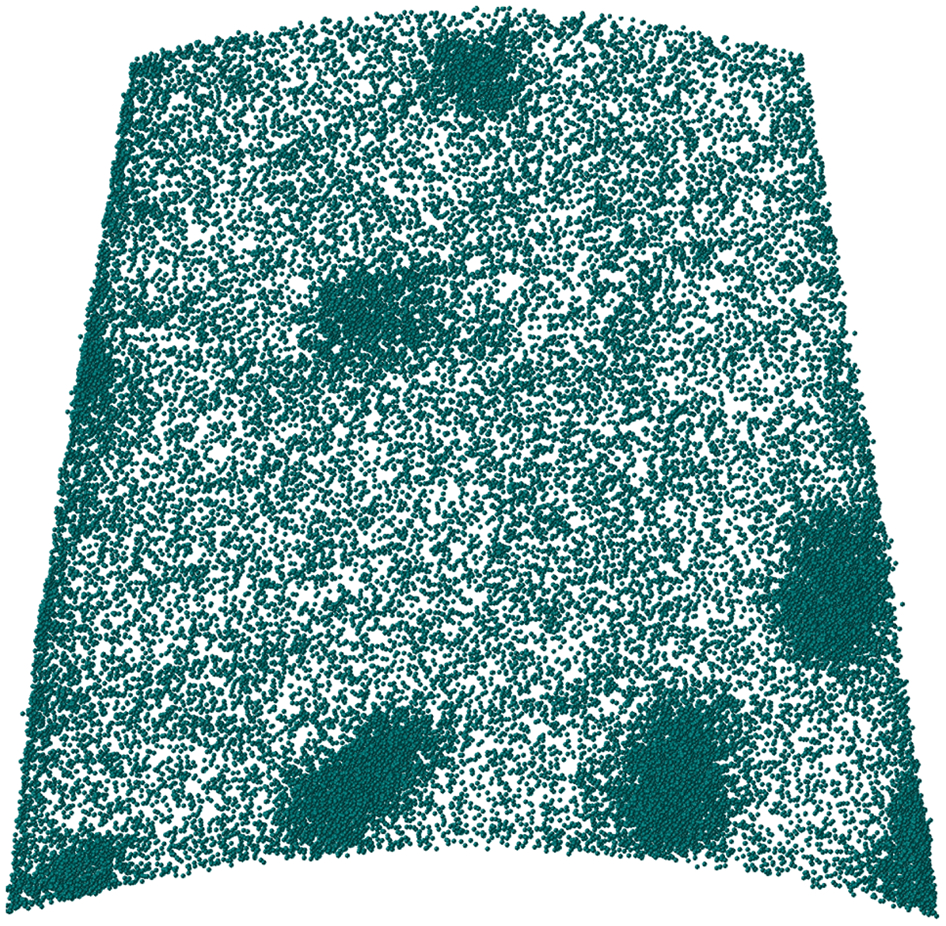
Cr atom map after aging for 2040 h at 475°C: at this late stage, α′ particles are isolated (analysis volume = 4×41×40 nm)
The kinetics of phase separation were quantitatively determined by analysing the evolution of the geometrical domain size (λ) and the composition amplitude (ΔC). The composition amplitude was determined from the proximity histograms,14,15 and the scale from the 3D autocorrelation function.16,17 The evolutions of λ and ΔC with aging time t at 435 and 475°C are shown in Fig. 4 and indicate that ΔC varies linearly with ln (t). Following the Lifshitz–Slyozov–Wagner (LSW) theory,18,19 the evolution of scale measured from the first minimum of the autocorrelation function with time were fitted to a power law. An exponent value of 0·34 (R2 = 0·84) was obtained. Therefore, the evolution of λ can be fitted to a power law, which is consistent with the power law growth of the mean precipitate size R(t) varying as ≈t1/3 predicted by LSW theory.
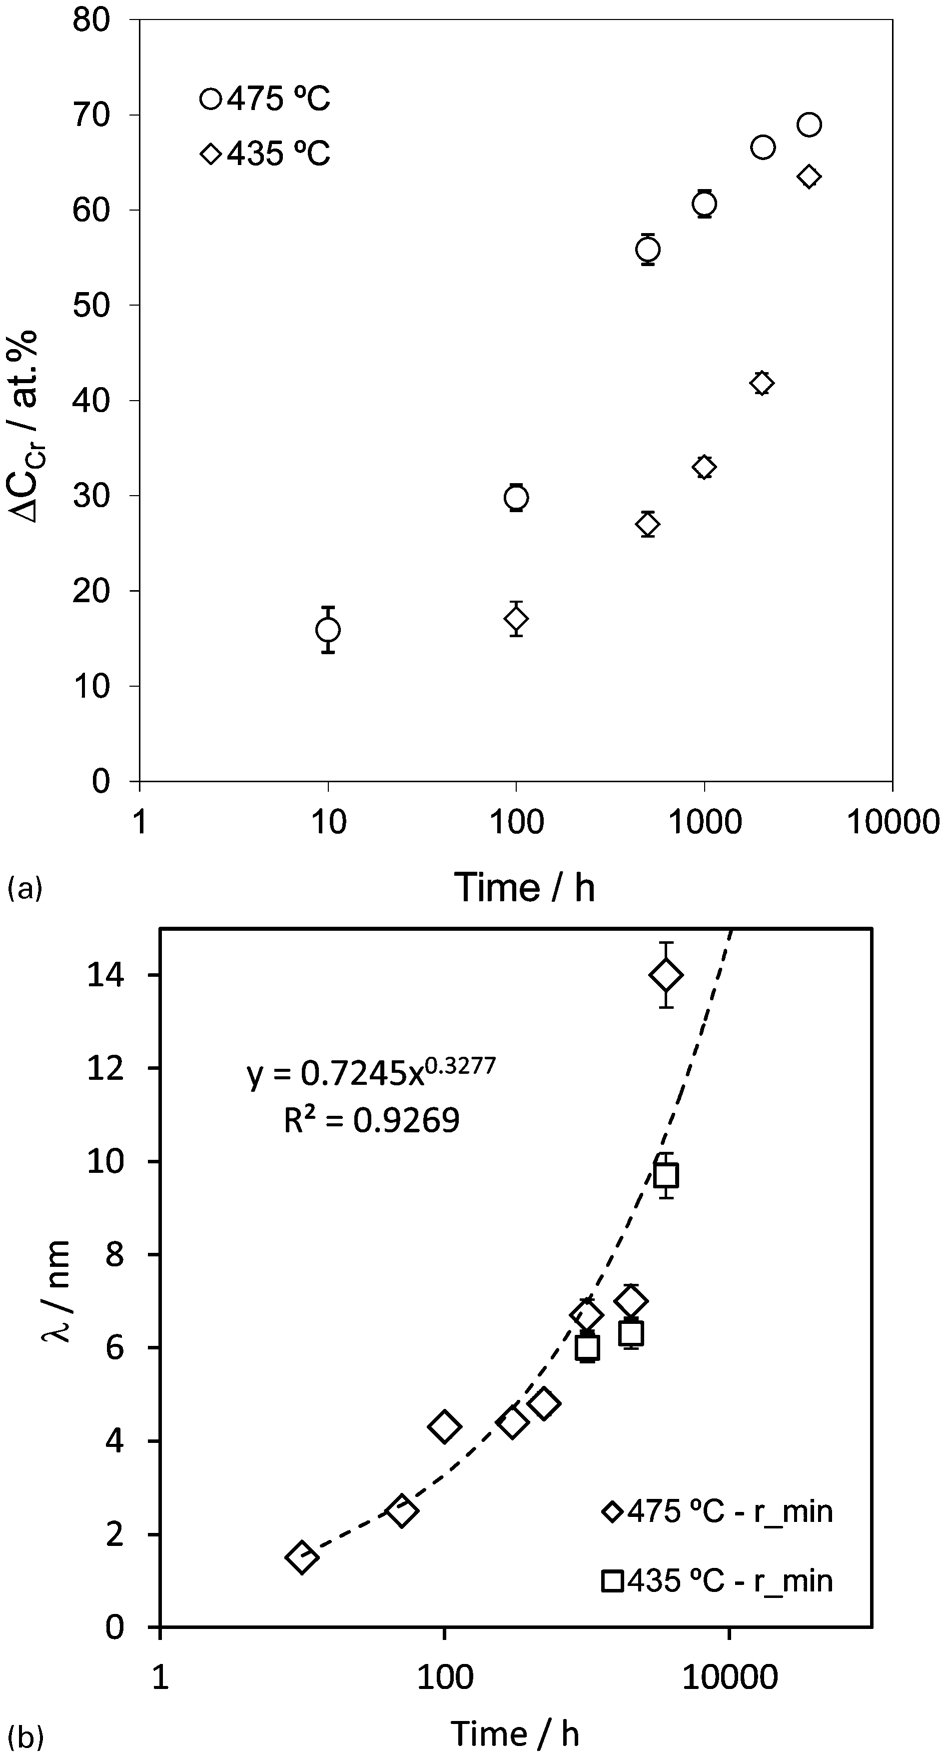
Evolution of a ΔC and b λ with time for aging at 435 and 475°C
Al partitioning occurred between the α and α′ phases during ageing at both 475 and 435°C. For example, a one-dimensional composition profile from a sample aged for 504 h at 475°C (Fig. 5) illustrates this phenomenon. The location of this composition profile was selected to also include a ∼10 nm diameter, spheroidal β′ particle. An interesting observation is the common interface between the α′ and β′ phases that could be due to the relatively fast diffusion of Al and Ti from the α′ phase.
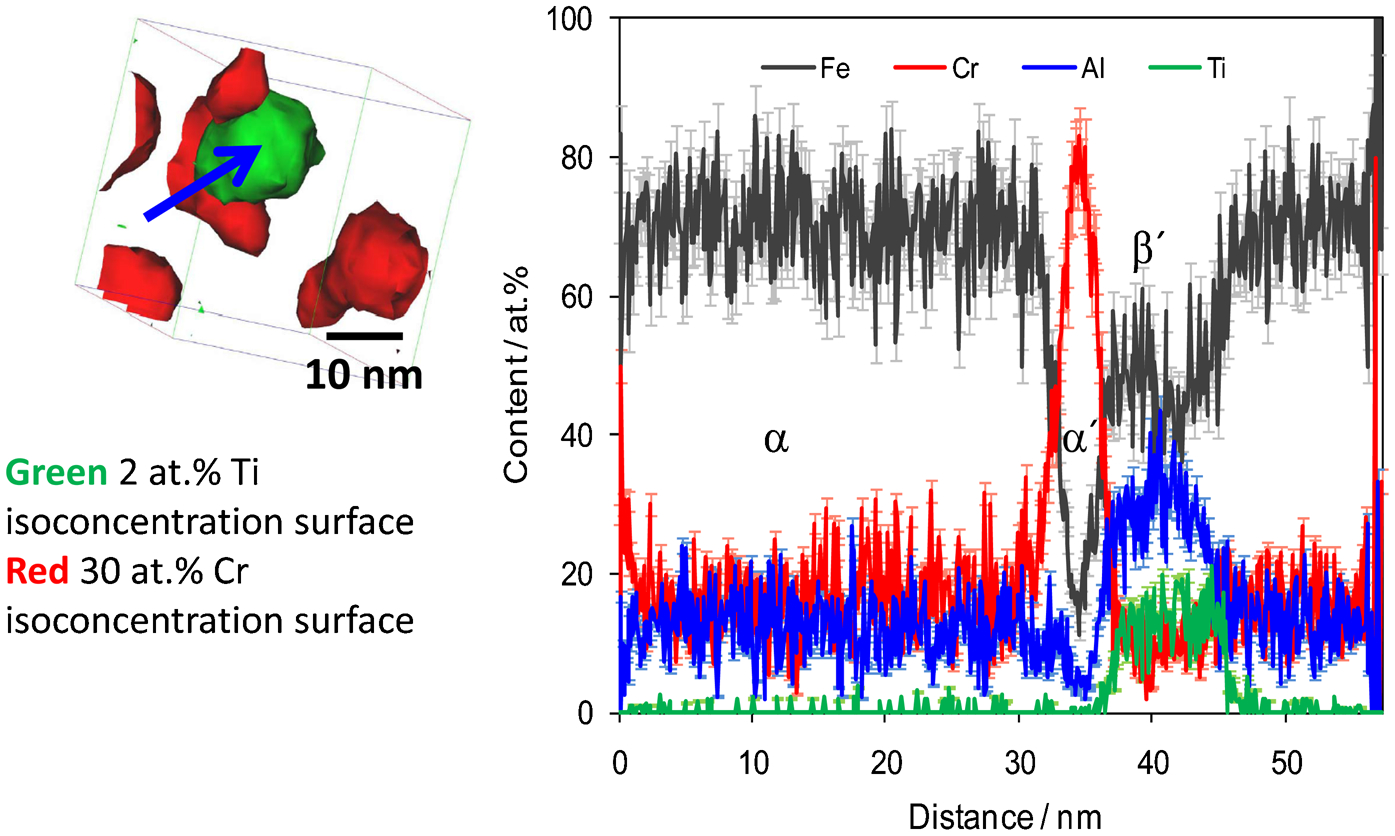
1D composition profile across α′ phase and β′ particle (see arrow) after aging at 475°C for 504 h
The Al and Ti proximity histograms across the α-α′ interface during aging at 475°C for times between 100 and 3600 h (Fig. 6), show a depletion in Al after only 100 h and then a progressive reduction of Al and Ti contents in the α′ phase with time. This simultaneous process of α–α′phase separation and β′ precipitation is consistent with the Cr content measured by APT when the transformation finishes (full circles in Fig. 1a). Proximity histograms for Al and Ti across the α–β′ interface, based on a 2 at-Ti isoconcentration surfaces, are shown in Fig. 7 for samples aged at 435°C for 100, 500, 1000 and 2016 h. Increases in the Al and Ti levels were observed with aging time. The results indicate that both nanoscale precipitation processes occurs simultaneously, with an earlier completion time for β′ precipitation than α–α′ phase separation.
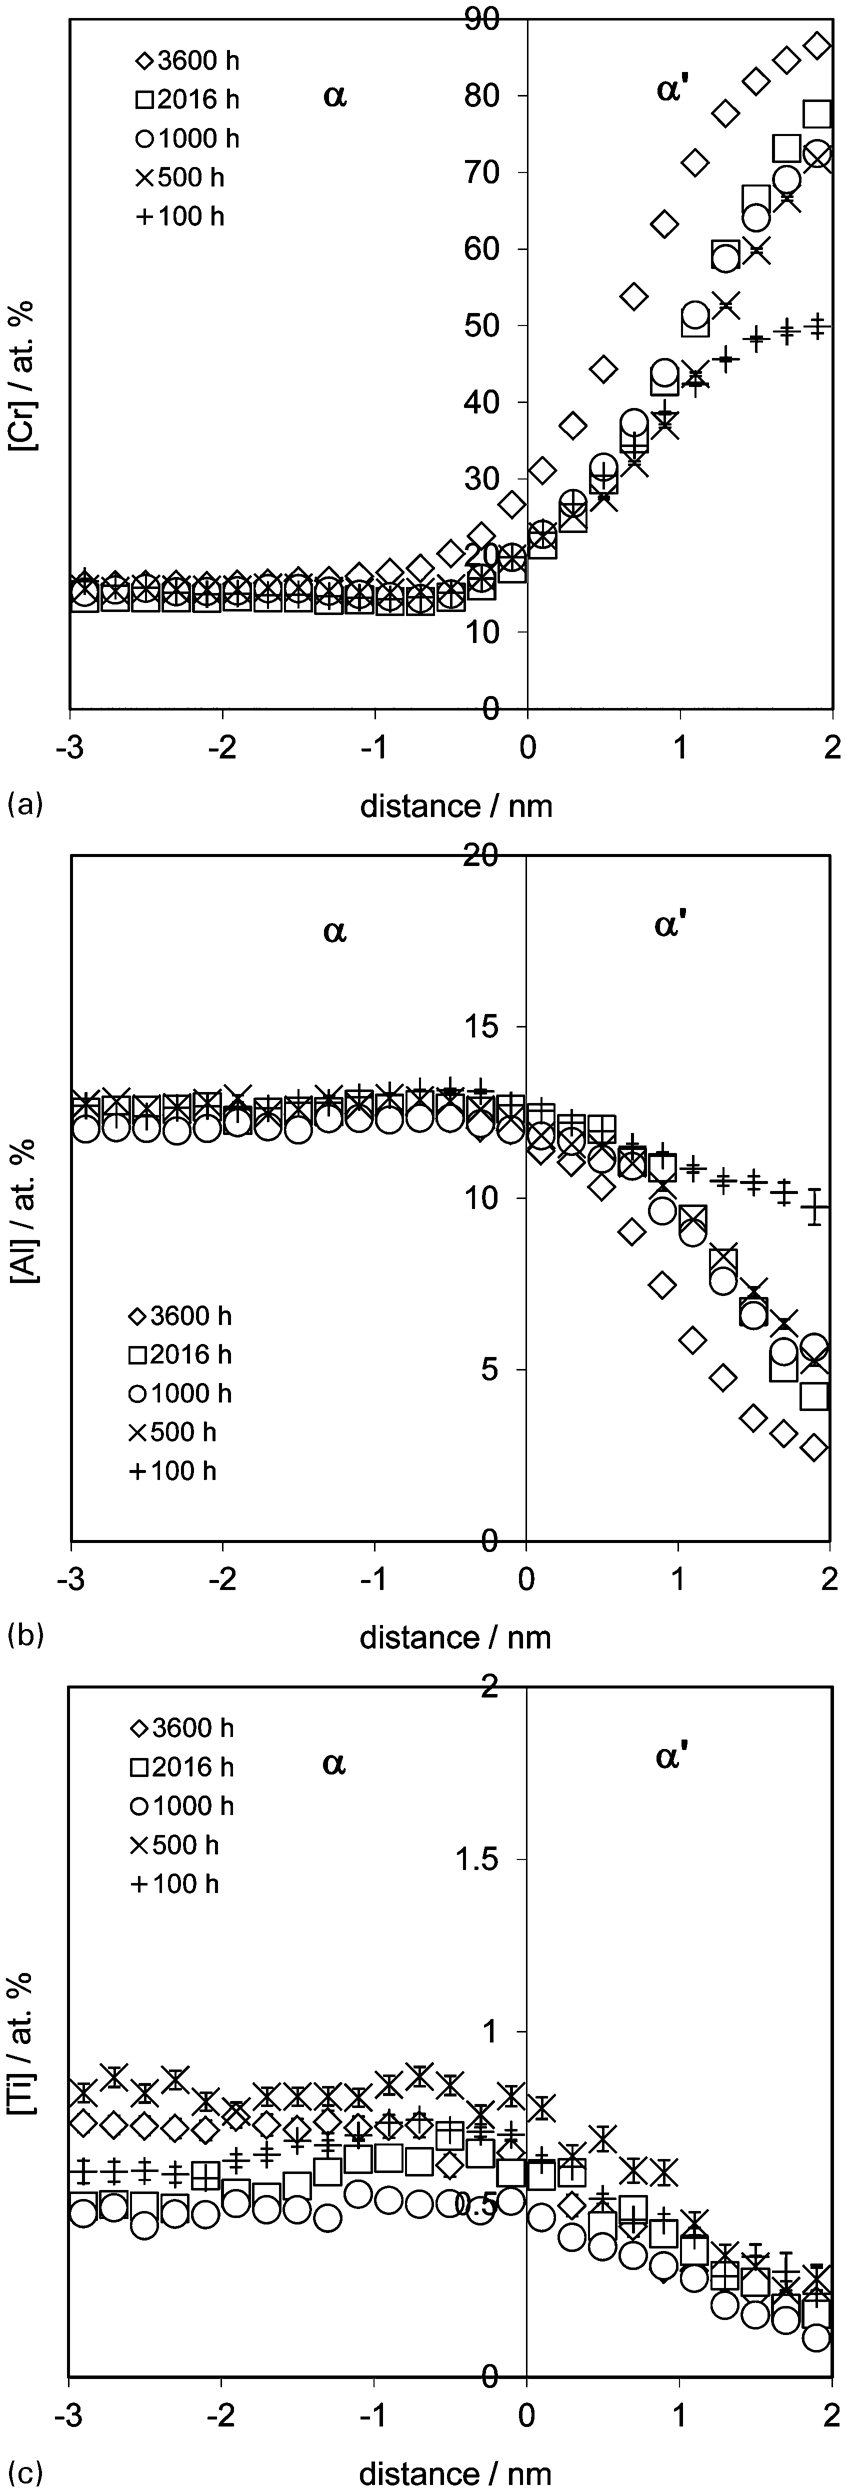
Proximity histograms of across α–α′ interfaces in material aged for several times at 475°C based on 30 at-Cr isoconcentration surface: partitioning of a Cr to Cr enriched α′ phase, b Al and c Ti portioning to Fe rich α phase is shown
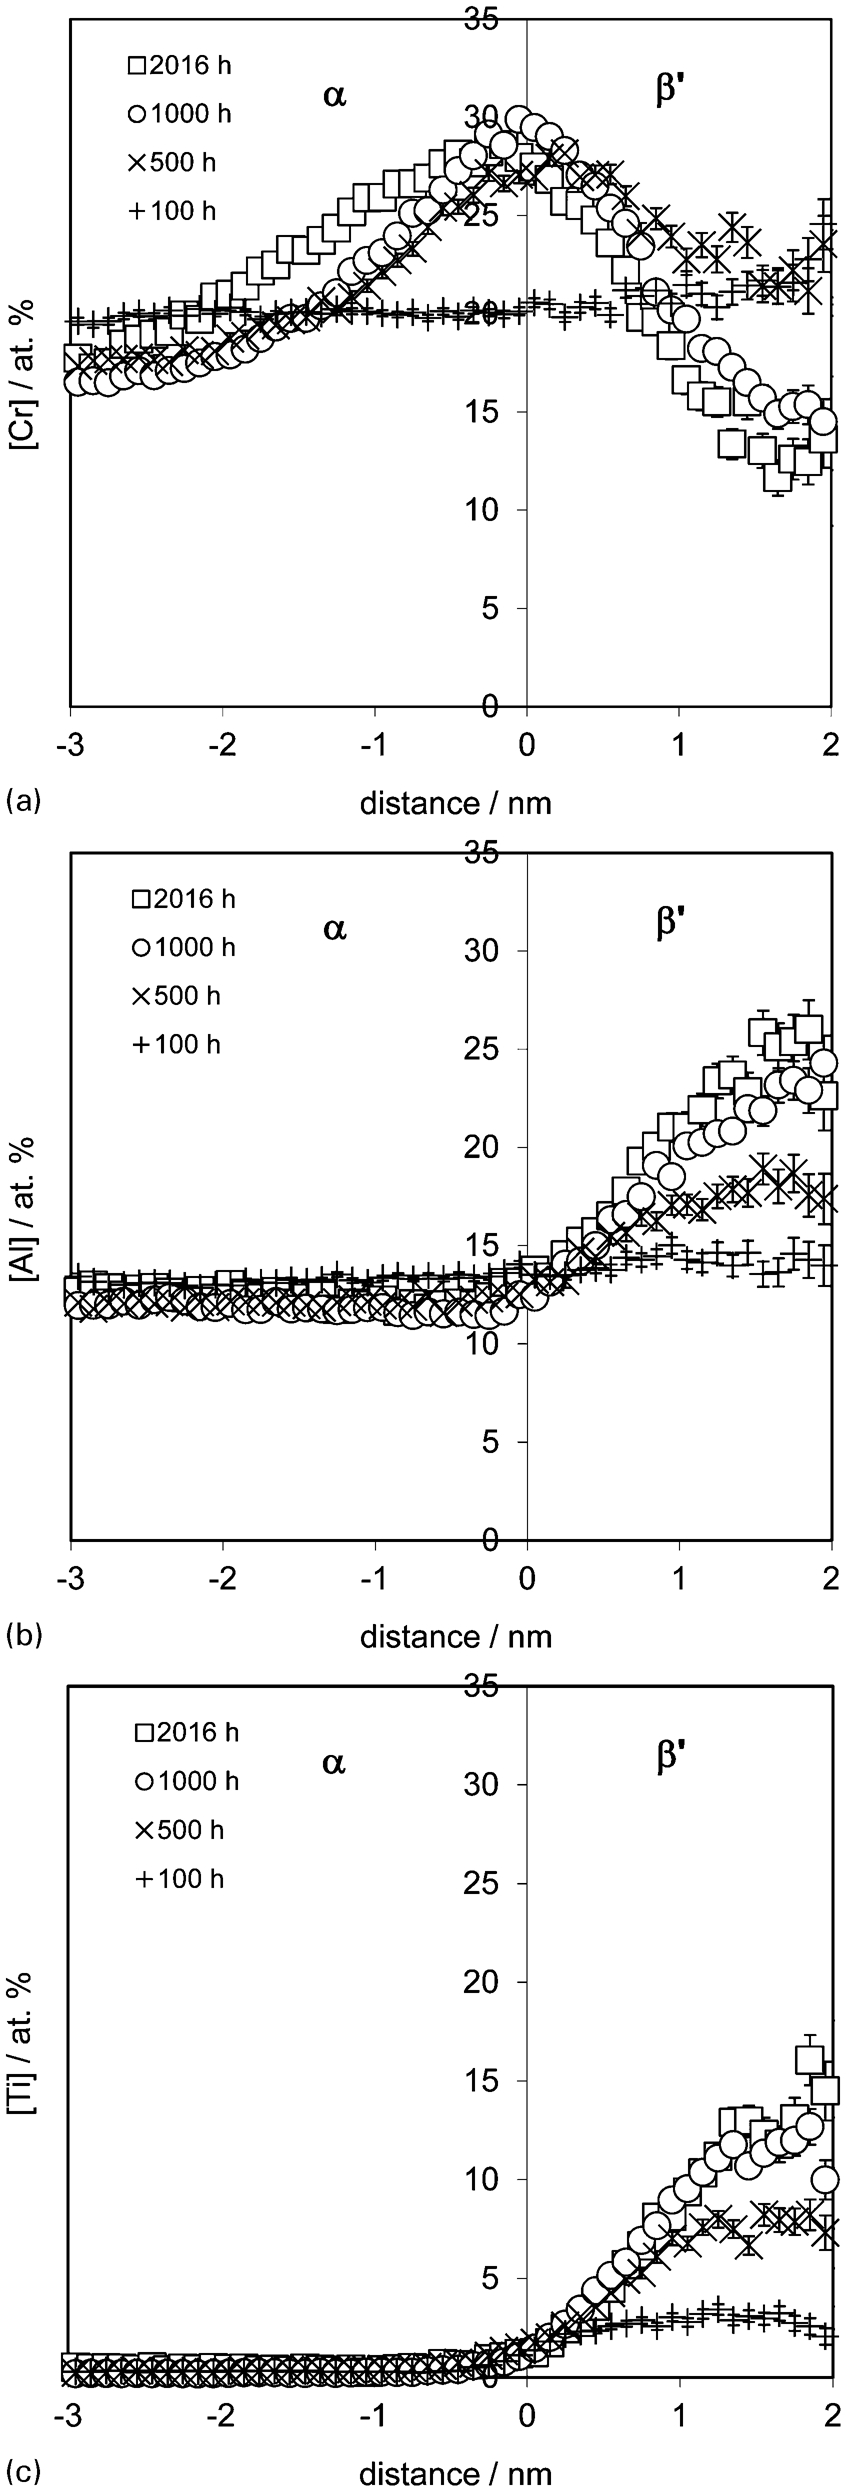
Proximity histograms across α–β′ interfaces for materials aged for several times at 435°C based on 2 at-Ti isoconcentration surface: distribution of a Cr between α and β′ phases and interface, b Al and c Ti partitioning to β′ phase is shown
Activation energy for α′ precipitation
The evolution of TEP with ageing time is shown in Fig. 8a for aging temperatures of 400, 435, 475, 500 and 525°C. Normalised TEP values, i.e. the ratio between TEP measured and the maximum TEP value achieved ΔSNORM = ΔSi/ΔSmax, are presented in this figure. An increase in TEP is clear at the early stages of phase separation for temperatures of 400, 435 and 475°C, meanwhile only a small amount is detected for 500°C. No indications of α–α′ phase separation is recorded for 525°C showing that this temperature is outside the two-phase region. Considering the differences in volume fraction between α′ and β′ phases, it is a sensible approach considering that the TEP corresponds mainly with the α–α′ phase separation process, and neglecting therefore the contribution form the β′ phase during aging.
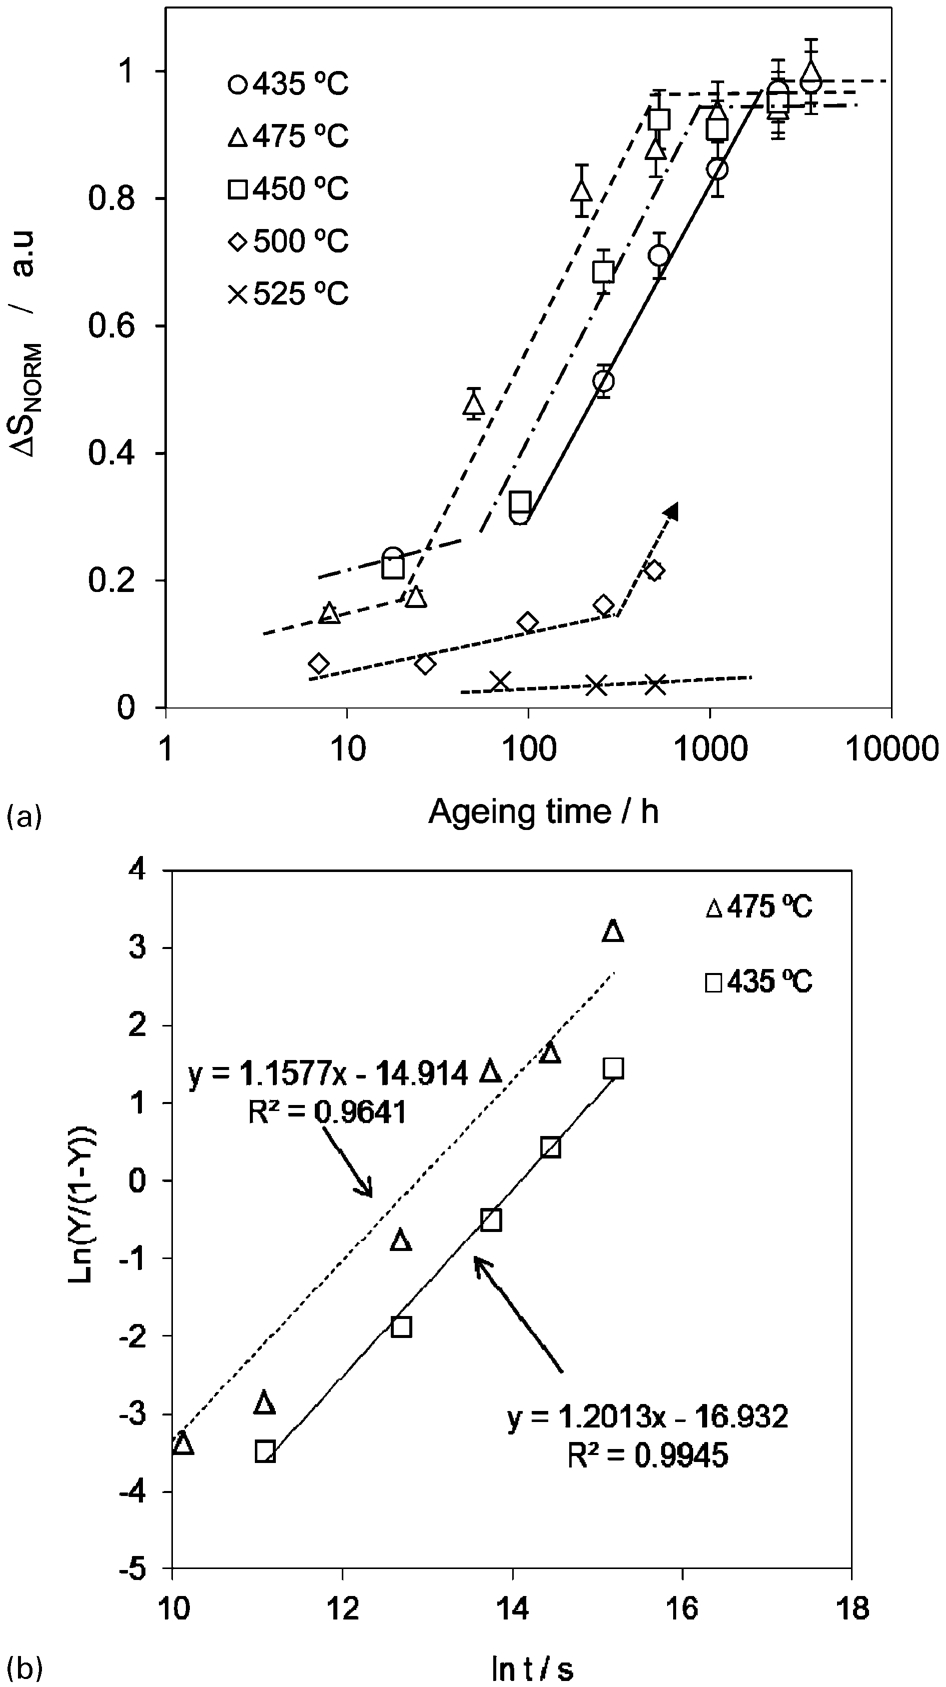
a TEP evolution with time at aging temperatures between 435 and 525°C and b TEP data fitted to AR equation
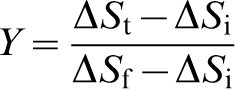
In order to analyse the TEP variations shown in Fig. 8a, the magnitude Y is defined, which is a ratio between the difference of measured TEP at a certain time and the initial time, and the difference in TEP between the initial and final stage of phase separation, where Y is expressed by
As has been demonstrated previously, APT is a unique technique that provides highly accurate quantitative data regarding the evolution of phase composition, size, and morphology in the nm scale size range during the α–α′ phase separation. TEP compliments the APT data by providing macroscopic volumetric information of the response of a material to aging treatments. Therefore, the combination of TEP and APT is ideal not only to determine the composition of the phases involved, but the kinetic parameters needed to characterise the α–α′ phase separation during aging.
The kinetics parameters of α–α′ reaction could be obtained from fitting the TEP measurements performed to an Austin–Rickett (AR) relationship.
20
The AR equation is a phenomenological equation that has been used successfully to predict the nitride precipitation process in an Fe–2Al (at-) system.
21
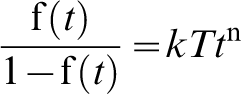
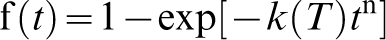
In the AR equation, the transformed fraction f(t) as a function of time t is written as
The apparent activation energy (Q) deduced from TEP variations can be derived from the ln k(T) versus 1/T plot presented in Fig. 8b. It can be concluded from this figure that the Q value for α–α′ phase separation in PM 2000 is 264 kJ mol−1. This value is quite similar to the activation energy for self-diffusion of Cr in α-Fe, which is 248 kJ mol−1, 22 which indicates that the α–α′ phase separation process in PM 2000 is mainly governed by the growth of α′ particles that lose interconnectivity at relatively early times of ageing, and with a negligible nucleation stage.
In summary, the α–α′ phase separation process in PM 2000 exhibits properties resembling spinodal decomposition, such as the increase in Cr content in α′ particles with aging time and the percolated microstructures observed in this material during the early stages of transformation as shown in previous works,17,23 although the alloy composition is well outside of chemical spinodal region in the phase diagram. In addition, the very low activation barrier for nucleation determined in this work supports the idea of a spinodal decomposition process.
On the other hand, the loss of interconnectivity between α′ regions due to the low Cr content of the alloy, is responsible of the coarsening behaviour of α′ regions that increase with a time exponent of 0·32 which is consistent with the mean precipitate size R(t) varying as ∼t1/3 predicted by the LSW theory.
Conclusions
The following conclusions raised from the experimental results presented in this paper.
The miscibility gap for the Fe–Cr–Al system has been obtained by applying the common tangent construction to the mixing free energy (ΔGmix) calculated under CALPHAD approximation with the help of MTDATA thermodynamic database. The composition of the PM 2000 ODS alloy is well inside the miscibility gap but outside the spinodal region at the temperatures studied, suggesting that the α–α′ phase separation process is governed by nucleation and growth processes.
The atom probe tomography results revealed that the Cr concentration amplitude of the α′ regions increases with ageing time. After aging at 475°C for 100 h or longer, the spheroidal α′ particles are isolated and do not form a percolated microstructure. The loss of percolation of α′ regions takes longer times as the ageing temperature decreases. From analysis of the APT data, the compositional amplitude (ΔCCr) was found to increase with a time exponent of 0·32, which is consistent with the LSW theory for coarsening of precipitates.
The fit of TEP measurements to an Austin–Rickett type equation determined an Avrami exponent of n = 1·2, which corresponds to particles growing in three dimensions starting from small sizes, with a growth rate controlled by Cr volume diffusion and with a negligible nucleation. A value of activation energy for α–α′ phase separation in PM 2000 of 264 kJ mol−1 was obtained, which is very similar with a value of 248 kJ mol−1 for self-diffusion of Cr in α-Fe.
Footnotes
Acknowledgements
PM 2000 is a trademark of Plansee GmbH. LEAP is a registered trademark of Cameca Instruments. CC acknowledges financial support to Spanish Ministerio de Ciencia e Innovación through in the form of a Coordinate Project in the Energy Area of Plan Nacional 2009 (ENE2009-13766-C04-01). Atom probe tomography and MKM were sponsored through a user project supported by ORNL's Center for Nanophase Materials Sciences (CNMS), which is sponsored by the Scientific User Facilities Division, Office of Basic Energy Sciences, US Department of Energy