Amidst fierce competition and diversifying customer needs in today’s markets, product development and design have shifted toward a more user-oriented model. This makes it common for products to have multiple quality characteristics. However, simply meeting customer needs is no longer sufficient; quality is also a key factor of a consumer’s willingness to buy a product. To this end, process capability indices have been used to measure the relationship between manufacturing specifications and processing performance, as well as serve as a bridge of communication between manufacturers and clients. In view of this, the loss-based capability index that fully reflects process loss and yield is employed in this study to analyze the process performance of each quality characteristic. However, must be estimated based on collected samples, in which the measured values of all sample data are expressed with precise values. Uncertainty and imprecision in collected data increase the risk of misjudgment. To reduce this risk, the confidence interval of is first derived to define fuzzy estimations of both the critical value and index, and develop a fuzzy process capability analysis model for a machined product with multiple quality characteristics of symmetric tolerance. Finally, an industrial example involving a five-way pipe product is presented to illustrate the applicability of the proposed approach. The results show that the proposed fuzzy analysis model makes determination of the process capability of each quality characteristic more reliable and rigorous to ensure that manufactured products meet requirements.
As production technology advances and living standards rise, consumer demand for product styles and functions have become increasingly diversified.1 Consequently, companies must make products that meet the diverse needs of consumers in order to be industrially competitive and ensure stable development of their business.2,3 For this reason, product development and design have shifted away from a producer-oriented model, which promoted manufacturing technology, to a user-oriented model, which emphasizes customer experience and participation.4 Quality function deployment (QFD) can effectively assist companies in ascertaining customer needs in the product development process as well as convert that information into engineering technology demands.5,6 Moreover, QFD can pinpoint the goalposts and direction of production quality for the product types that meet customer needs.7,8 Therefore, with the aim of enabling companies to provide products and services that meet the needs of the customer, many studies have used QFD as an auxiliary tool to evaluate whether a designed product or service meets customer needs. For example, Efe et al.9 proposed a novel QFD approach to the design of mobile phones, and Wang10 incorporated the concept of systematic innovation to QFD to develop multi-functional smart phones.
Products resulting from research-and-development processes, as well as manufacturing technology planning, usually have multiple quality characteristics.11,12 Such products can only be considered of acceptable quality if the process performance of all quality characteristics meet the required standards.13,14 Performance assessment and monitoring of each characteristic is thus essential for product conformity. Furthermore, in the era of growing consumer awareness, product quality directly affects a consumer’s willingness to buy.15,16 Ramanathan et al.17 and Zhou et al.18 claimed that product quality is not only an assurance that manufacturers give to consumers but also an important factor of corporate sustainability. Therefore, since products with multiple quality characteristics have become mainstream, assisting manufacturers in comprehensive evaluations of product quality while maintaining market competitiveness has become a pressing matter.
Kane19 indicated that the quantification of both process variation and location is crucial for the measurement of the quality of products or components from a machining process. In fact, process capability indices (PCIs) are unitless functions of manufacturing specifications (, T, ) and process parameters (, ), where and are the upper and lower specification limits for a given quality characteristic, is the process target, and and are respectively the process standard deviation and the process mean. Thus, these indices quantify the process performance of a given characteristic to enable analysis of its capability to meet required levels. For this reason, PCIs have been commonly used in the manufacturing industry to analyze process performance and product quality.
Although the aforementioned studies were able to use PCIs to help manufacturers effectively evaluate the process performance of products with multiple quality characteristics, it is worth noting that PCIs contain two unknown population parameters, that is, process mean and process variance . Moreover, under cost and time considerations, attempting to record every single data to obtain the true values of the population parameters is an impossible task. Therefore, utilization of random sample data to estimate process parameters has become common practice. Unfortunately, the data collected by random sampling is not always representative of the population.20,21 This means that the sample may deviate from the population and cause sampling errors. Furthermore, the measured sample data are represented by precise values, despite inevitable uncertainties in the data. This undermines the reliability of crisp estimates and of unknown parameters.
In order to more reliably and reasonably evaluate whether process capability meets required standards, this study uses process capability index to evaluate the process performance of each quality characteristic. This index fully reflects process loss and yield. In addition, the methodology proposed by Buckley22 and Chen and Chang23 is adopted in this study to develop fuzzy analysis of process capability for a product with multiple characteristics of symmetric tolerance. The rest of this paper is organized as follows. In Section 2, a process capability assessment model of a machined product with multiple characteristics of symmetric tolerance is proposed based on the defined index . The relationship between indices and is further presented to facilitate identification of the required value of , where is used to assess the process performance of each quality characteristic. Section 3 presents point and interval estimation for based on multiple subsamples. In Section 4, triangular-shaped fuzzy number is formed based on the confidence interval of , and used to propose a fuzzy analysis model of process capability for a machined product. The proposed model is applied to an industrial example in Section 5. Concluding remarks are summarized in Section 6.
Process capability assessment model of product with multiple characteristics of symmetric tolerance
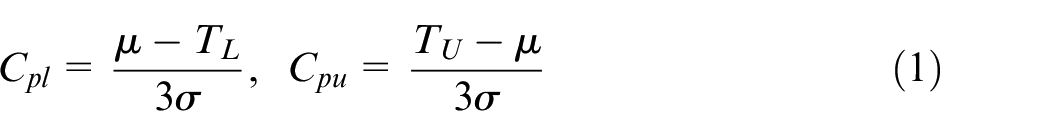
Commonly-used indices for the analysis of process capability in the manufacturing industry are , , and .24,25 The first two indices are suitable for analyzing the performance of unilateral specification processes, which respectively involve larger-the-better (LTB) and smaller-the-better (STB) quality characteristics. The last index is used to assess the performance of bilateral specification processes with nominal-the-best (NTB) quality characteristics. According to Kane,19 these indices can be defined explicitly as follows:
where is half the length of manufacturing specifications (, T, ).
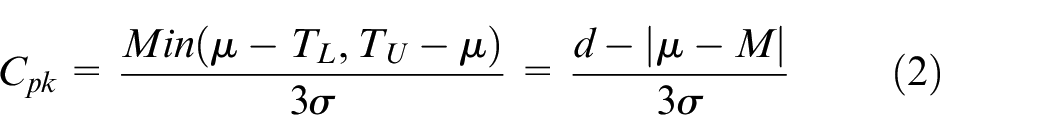
In addition, this study further considers a given quality characteristic to describe the difference among LTB, STB, and NTB. When the specification limit of is , then is considered a LTB-type quality characteristic. When the specification limit of is , then is considered a STB-type quality characteristic. When the specification limit of with a specific target value is , then is considered a NTB-type quality characteristic. Index is based on process yield to measure the process performance. Thus, it directly reflects yield. It is easy to see from equation (2) that index measures deviation from process average from the midpoint . This enables it to identify whether gross deviations are causing instability in the manufacturing process. Unfortunately, when the process changes, cannot reflect process capability. Consequently, misjudgments of process capability analysis using often occur in the case of smaller and larger . To mitigate misjudgments based on , Chan et al.26 proposed index based on Taguchi loss, which can be expressed as follows:
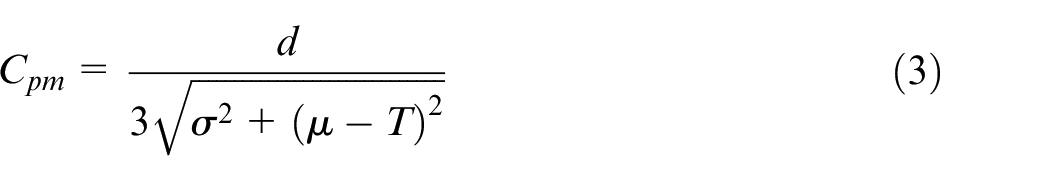
As can be seen in equation (3), when process average is the process target value , the value of is at its largest. As the gap between and widens, becomes smaller, and the expected value of process loss becomes greater. Ruczinski27 further pointed out that when the value of is greater than , the relationship between and yield can be expressed as follows:
where is the cumulative distribution function (CDF) of quality characteristic and represents the CDF of standard normal distribution . According to equation (4), the greater the value of is, the higher the process yield will be, and the better the quality of the machined product.
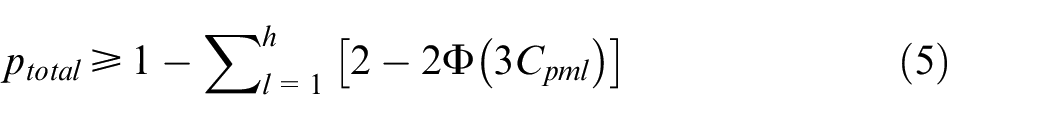
As mentioned, as multiple quality characteristics have become mainstream, this study uses products with NTB quality characteristics to preserve generality and further applies in developing a product quality evaluation model. For products with multiple quality characteristics, it has been well-documented that products can only be deemed “good quality” or “acceptable” when the process performance of all quality characteristics meet requirements.28,29 To this end, the process failure rate of the lth quality inspection characteristic is set at , , (see equation (4)). According to De Morgan’s law and Boole’s inequality, the yield rate of the production process for products with NTB quality inspection characteristics can be expressed as follows:
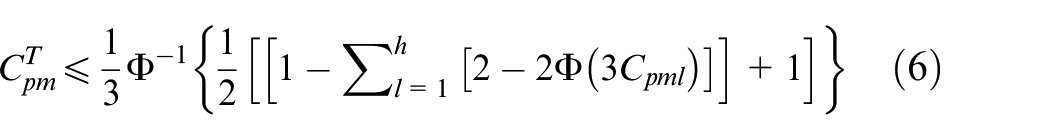
According to equation (5), a novel index that fully reflects process yield of a product can be defined as follows:
Equations (5) and (6) imply a one-to-one relationship between product yield and index . This can be expressed as follows:
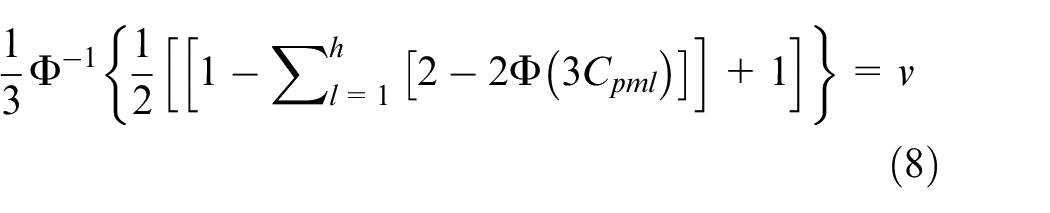
For a product with h quality characteristics to be accepted by customers, index must meet the required level. Given this, it is evident that index for each quality characteristic must be greater than index . Therefore, assuming the value of index must reach , equation (6) can be rewritten as follows:
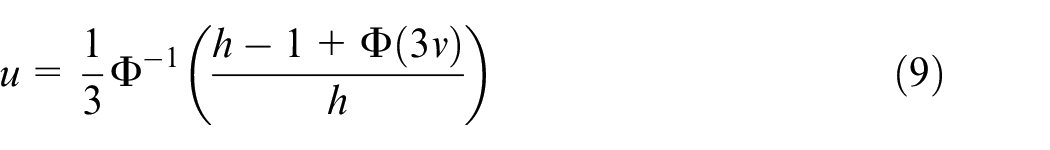
If index of all quality characteristics must equal , the one-to-one relationship between and can be derived as follows:
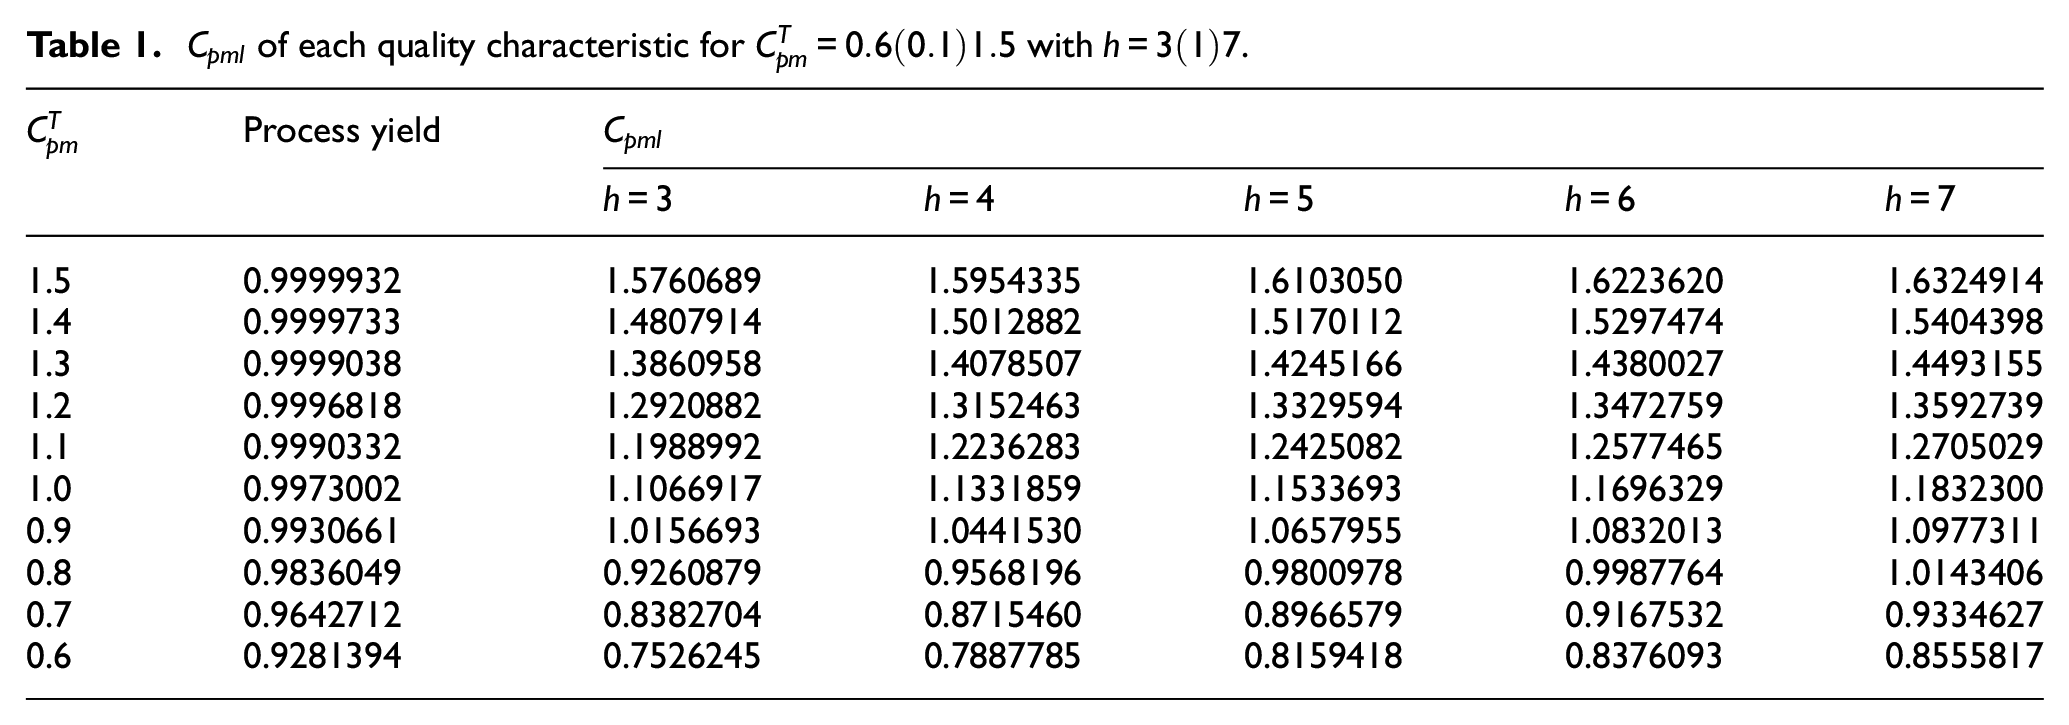
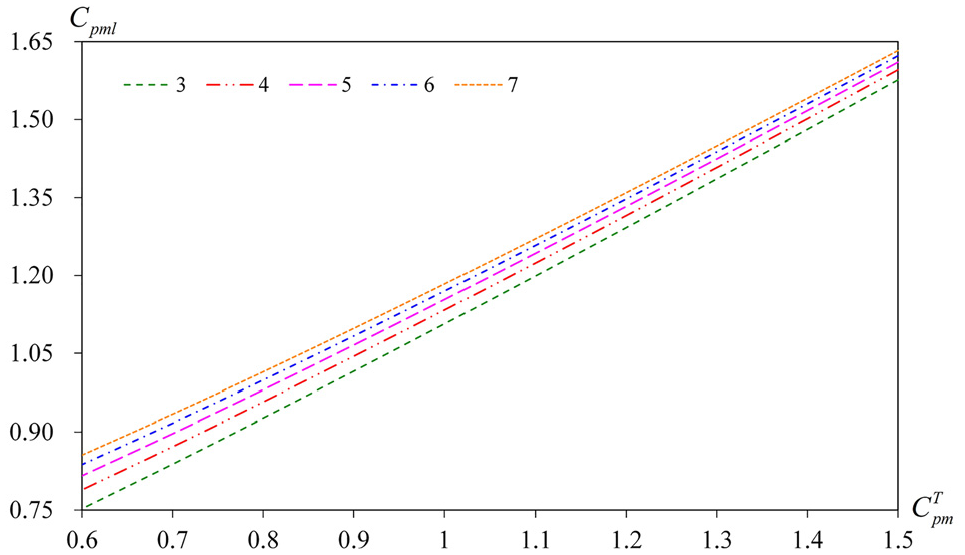
Using equation (9) and based on the assumption that for the product must be from 0.6 to 1.5, the required value of for each quality characteristic can be obtained. These are listed in Table 1. It is worth noting that must be greater than (see Ruczinski27). Furthermore, a machined product can be regarded as an inadequate if , capable if , satisfactory if , excellent if , and super if .30 Therefore, a larger means better process capability and higher process quality. Figure 1 presents the value of versus with . It is easy to see that increases with an increase in the required value of under fixed . Moreover, the value of increases with an increase in number of quality characteristics under fixed .
of each quality characteristic for with .
Process yield
1.5
0.9999932
1.5760689
1.5954335
1.6103050
1.6223620
1.6324914
1.4
0.9999733
1.4807914
1.5012882
1.5170112
1.5297474
1.5404398
1.3
0.9999038
1.3860958
1.4078507
1.4245166
1.4380027
1.4493155
1.2
0.9996818
1.2920882
1.3152463
1.3329594
1.3472759
1.3592739
1.1
0.9990332
1.1988992
1.2236283
1.2425082
1.2577465
1.2705029
1.0
0.9973002
1.1066917
1.1331859
1.1533693
1.1696329
1.1832300
0.9
0.9930661
1.0156693
1.0441530
1.0657955
1.0832013
1.0977311
0.8
0.9836049
0.9260879
0.9568196
0.9800978
0.9987764
1.0143406
0.7
0.9642712
0.8382704
0.8715460
0.8966579
0.9167532
0.9334627
0.6
0.9281394
0.7526245
0.7887785
0.8159418
0.8376093
0.8555817
Plots of versus with (bottom to top in plot).
Estimation of based on multiple subsamples
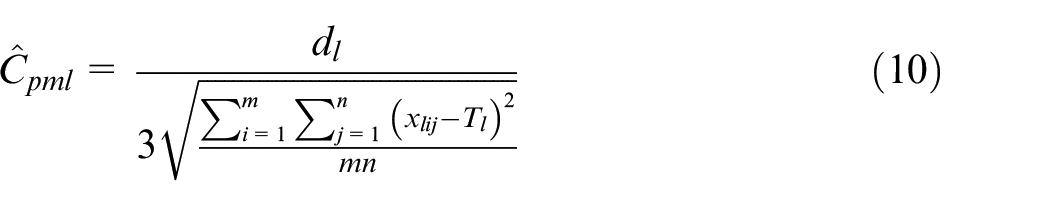
As mentioned, index can be regarded as a function of both process mean and process variance . Furthermore, and for the measured lth quality inspection characteristic are unknown process parameters in practice. Therefore, when the manufacturing process is in control and data is normally distributed , sample data is usually extracted to obtain maximum likelihood estimates (MLEs) and point estimation of . This is then used to evaluate process performance of the quality characteristics. It is worth noting that is the uniformly minimum variance unbiased estimator of .31 Montgomery32 further pointed out that a control chart can be effectively applied to monitor process changes and quickly detect traceable causes, thereby effectively diagnosing quality issues. This diagnosis facilitates corrective measures to reduce process variations to restore stability in the manufacturing process. These actions must be taken before conducting holistic analysis of process quality. Control charts are thus widely used for statistical process control.9,12,20,33 For this reason, a variable data control chart is similarly applied in this study to formulate as follows:
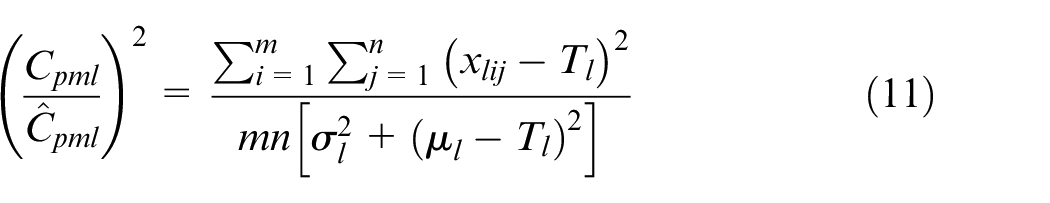
The data structure of the sample cannot fully represent the structure of the population; therefore, using to judge the process performance of the lth quality characteristic may result in misjudgment. While point estimation uses a single sample statistic to estimate population parameters, the confidence interval defines a numerical range based on the sample data to estimate the unknown population parameter. For a certain level of probability, this numerical range contains the population parameter’s true values. Therefore, this study further derived the confidence interval of index . According to equation (10) and the definition of , the square of can be derived as follows:
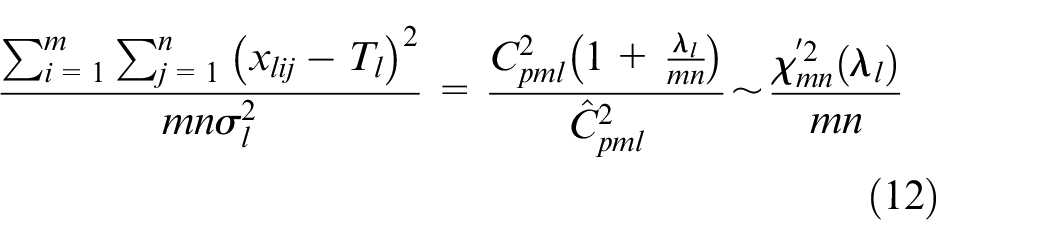
Under the assumption of normality, follows a non-central chi-square distribution with mn degrees of freedom, which can be denoted as , where the non-centrality parameter .34 For this reason, equation (11) can be re-expressed as follows:
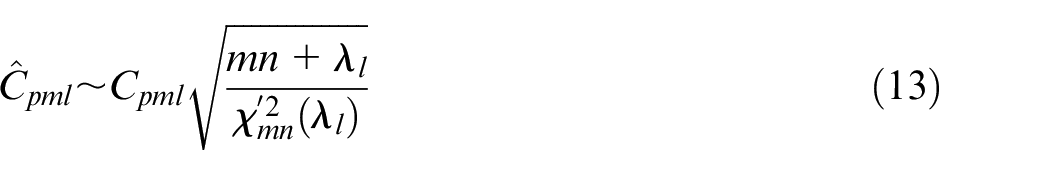
Thus, the distribution of can be presented as follows:
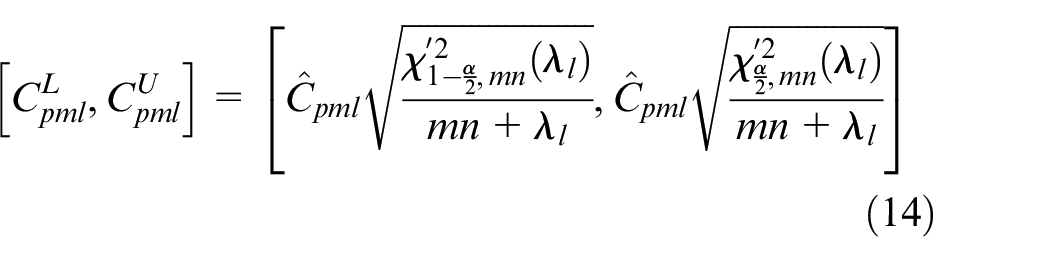
Based on equation (13), the confidence interval of can be derived as follows:
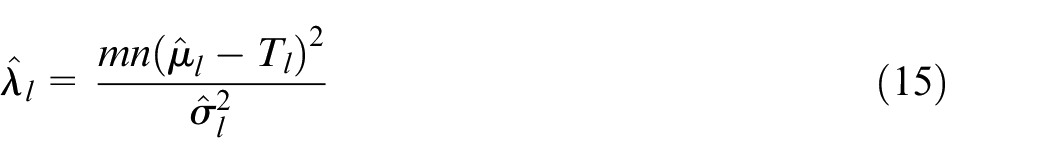
where is the level of significance, is the upper quantiles of non-central chi-square distribution with degrees of freedom, , and is the non-centrality parameter. It is worth noting that is also a function of and , so in practical applications, one must collect subsamples of observations each to estimate :
where and .
Fuzzy process capability analysis for machined product
Traditional process capability analysis based on crisp estimate
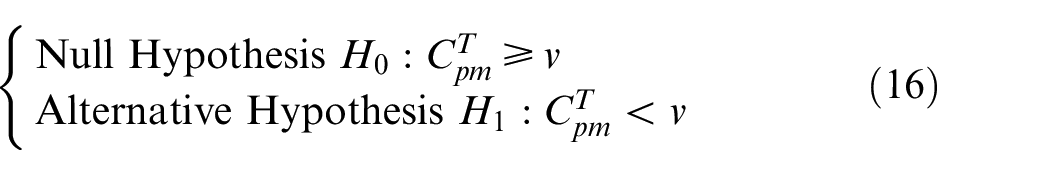
In practice, it is unfeasible to inspect an entire population; therefore, sample data is used to obtain point estimations and for calculation of point estimation . According to Montgomery and Runger,35 the statistical hypothesis test method can determine the reliability of using sampled data to make inferences. Specifically, the statistical hypothesis test constructs a hypothesis describing the process population, and then verifies whether the sample accurately represents this description. Thus, a number of studies have employed hypothesis testing to determine whether process capability achieves required standards.36–40 It is evident that when a customer requires the process capability of the NTB quality characteristics of a product to reach , the manufacturer must conduct hypothesis testing on the product’s process performance to ensure that the product quality truly meets customer requirements. This approach can be expressed as follows:
As mentioned, only when the performance capability of quality characteristics reaches can the manufacturer be assured that the product’s process capability reaches . Based on this perspective, equation (16) can be further rewritten as follows:
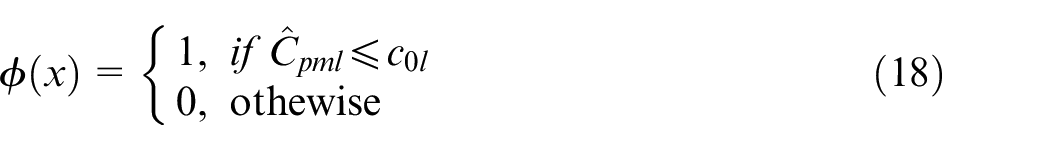
Obviously, test function can be defined as follows:
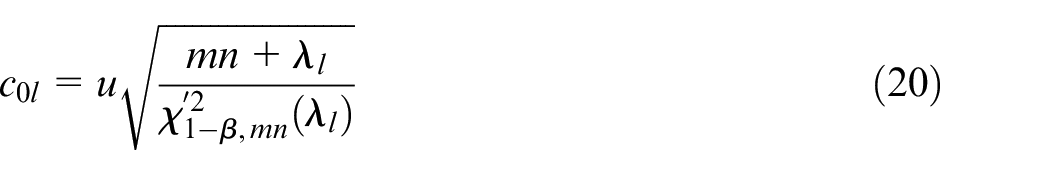
This function represents the likelihood of rejecting null hypothesis . When the probability of accepting Type-I errors is and when the decision threshold for hypothesis testing is , null hypothesis is rejected; otherwise, should not be rejected. Critical value can be determined using the following equation:
Thus, can be derived as follows:
where is the upper quantiles of .
Triangular-shaped fuzzy number
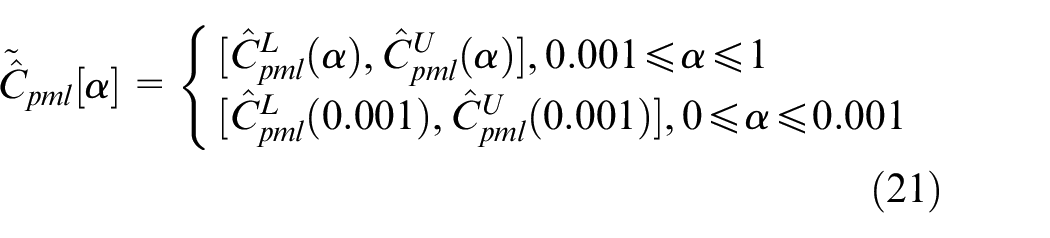
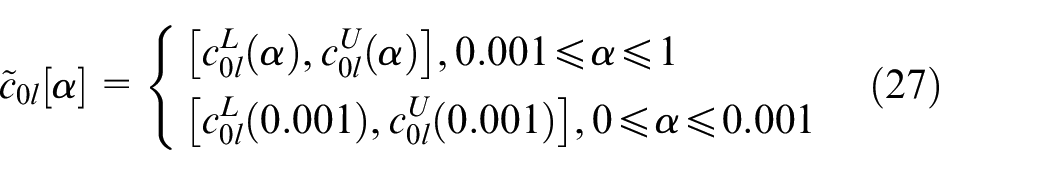
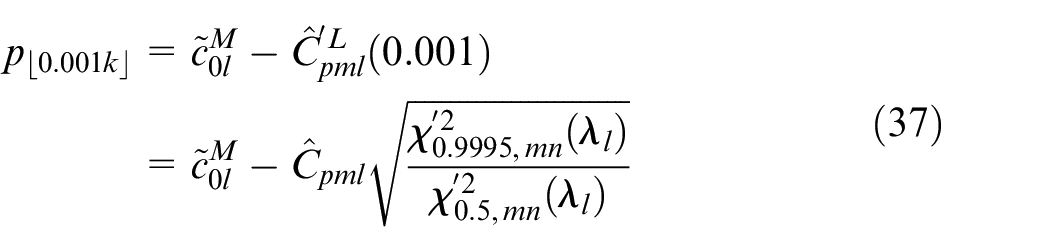
In addition, it is worth mentioning that the above methods are contingent on the condition that the sample data are presented with precise values. Unfortunately, in practice, measurement data usually contains uncertainties due to the influence of various factors,41,42 so the reliability of the estimate of the unknown population parameters is questionable. It is apparent that using crisp estimates of the parameter to obtain creates room for error. For example, Wang et al.34 utilized the crisp estimate of index to determine the performance for a nanofabrication process. Lin and Pearn43 applied the MLE of to develop a hypothesis testing model of in analyzing manufacturing performance. Thus, based on the work of Chen et al.,44 Chen and Chang,23 and Buckley,22 this study defines a fuzzy estimate and further proposes a fuzzy testing model for to evaluate the process performance of each quality characteristic. First, the confidence interval of is used to define the of triangular-shaped fuzzy number (TFN) , denoted as . This can be expressed as follows:
where and . As for , the starting value only needs to match any number greater than 0 and less than or equal to 1. That is to say, 0.001 is not a specific starting value. TFN can thus be defined as follows:
where , , and .
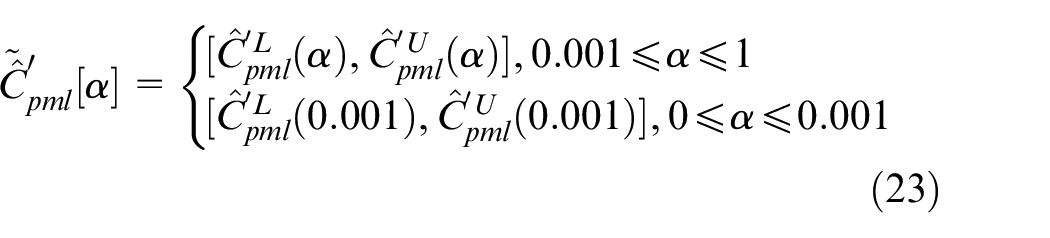
Because , it may be inconvenient for decision-makers to analyze the process capability of the lth quality characteristic. For this reason, this study utilizes the random-variable transformation method and let . Under this approach, the original can be transformed as follows:
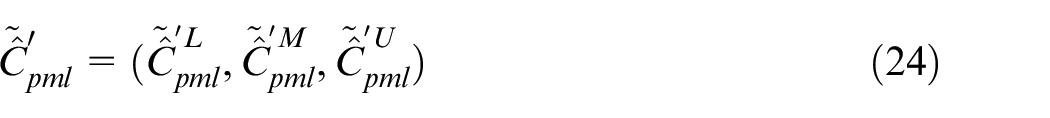
where and . In this case, . TFN can thus be expressed as follows:
Where , , and .
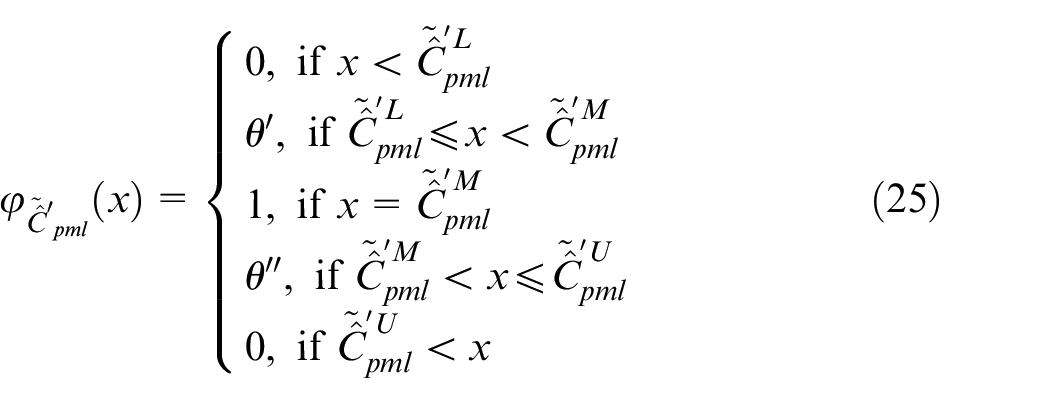
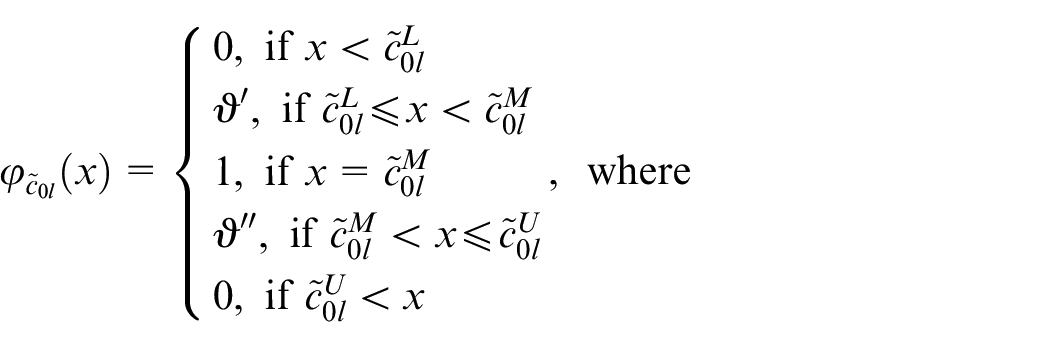
According to equations (23) and (24), the membership function of can be formed as follows:
where and are defined by the following equations:
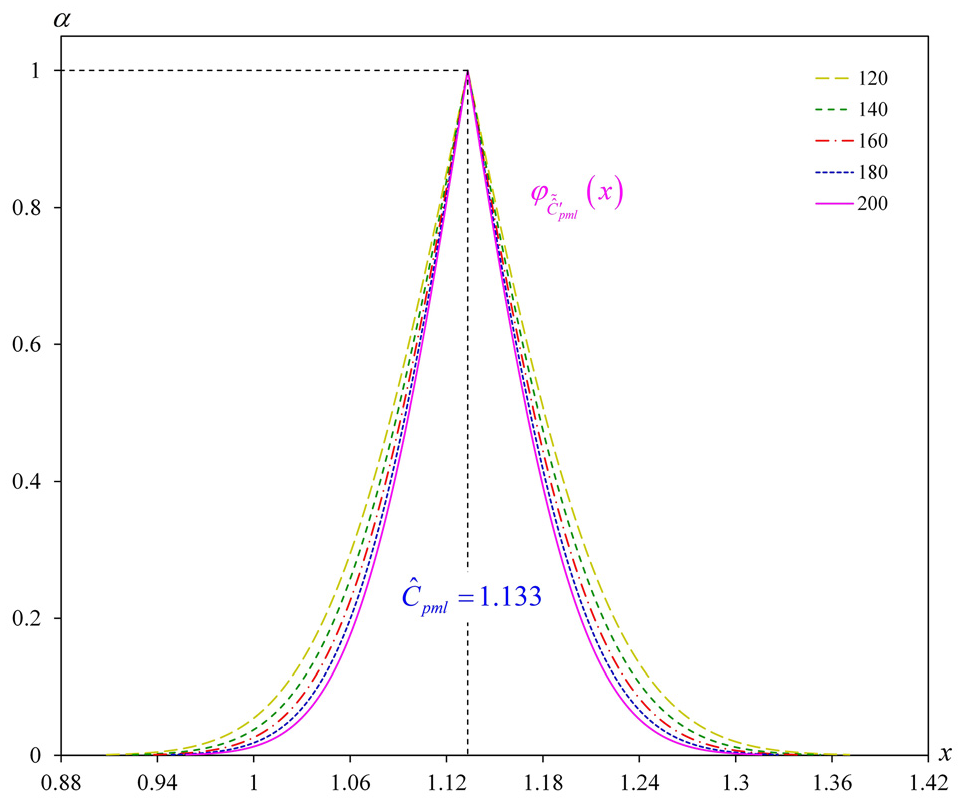
Membership function of TFN with for , , and can be displayed as shown in Figure 2. It is easy to see that the value of increases with a decrease in for fixed .
Membership function of TFN with for , , and .
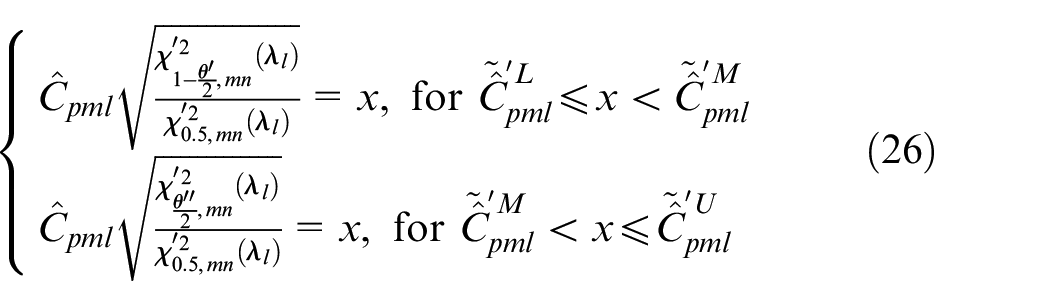
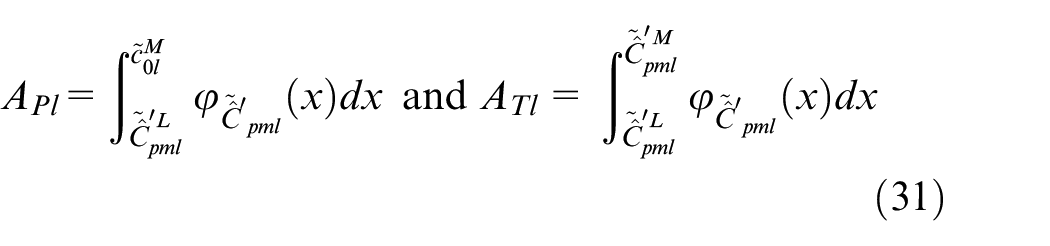
Similar to the derivation of , the of TFN can be obtained as follows:
where and . As a result, TFN can be expressed as follows:
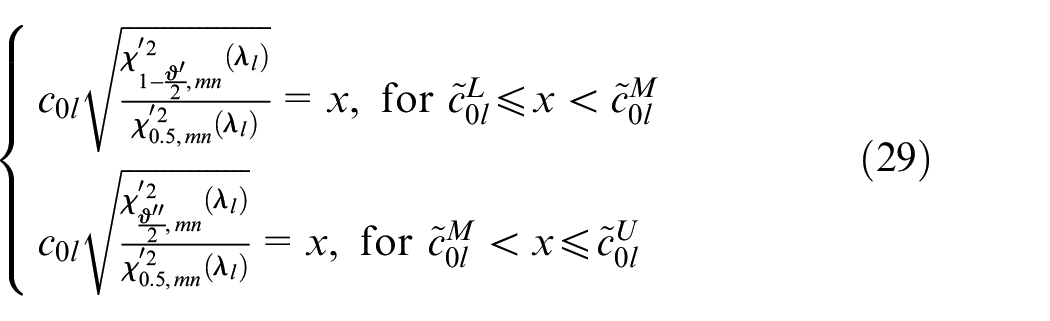
where , , and . Membership function of can be established based on equations (27) and (28), as follows:
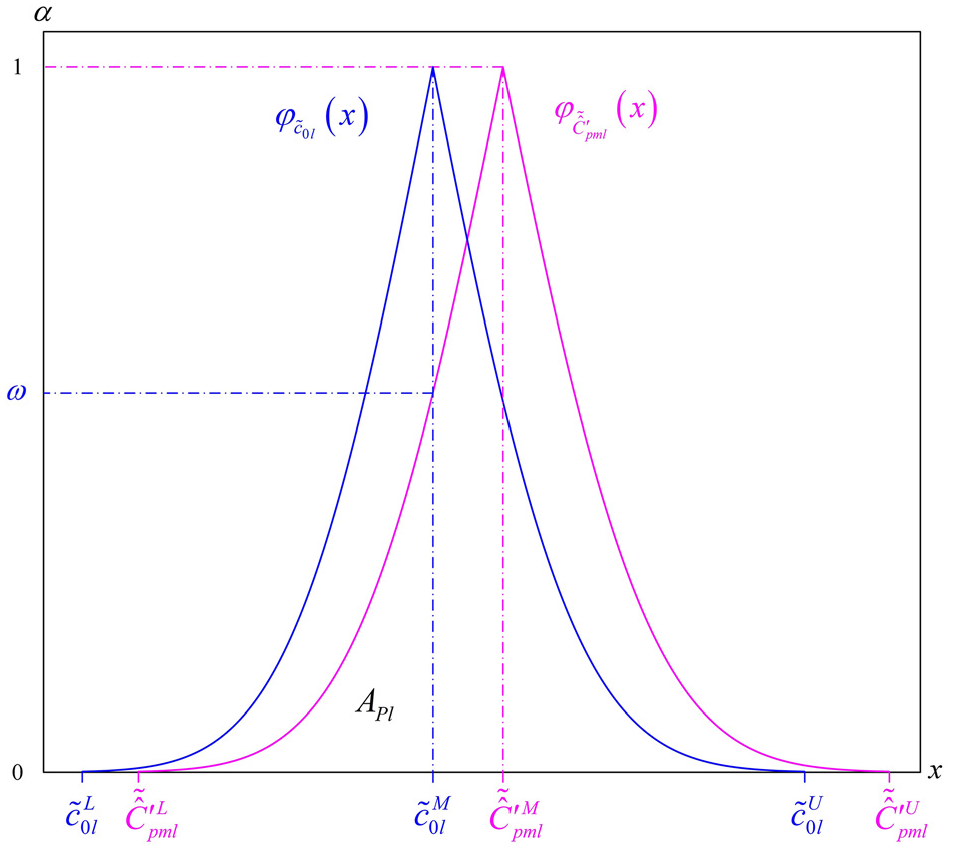
Type-II error occurs when the hypothesis testing presented in equation (17) results in failure to reject null hypothesis and the process capability of the lth quality characteristic has not reached . This misjudgment will gradually erode customer trust as well as incur irrecoverable losses for the manufacturer. Therefore, to lower the probability of Type-II errors, this study developed a fuzzy testing model for index . Figure 3 displays the relationship between TFNs and .
Relationship between and for fuzzy process capability analysis.
Fuzzy process capability analysis based on fuzzy estimate
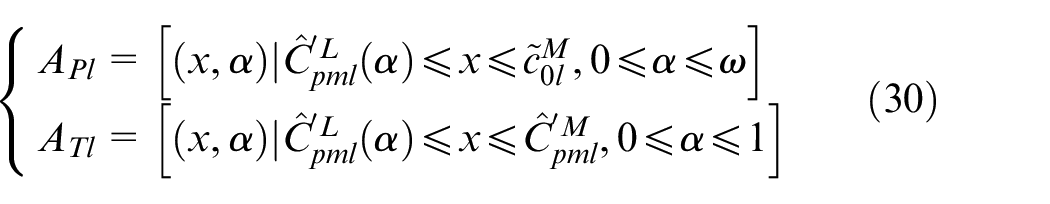
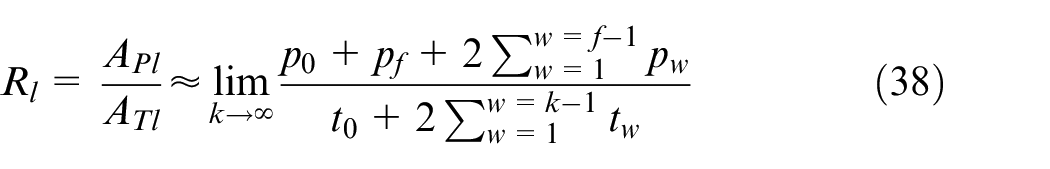
In order to develop a fuzzy hypothesis test for to make analysis of the process capability of each quality characteristic more reliable, this study draws on the work of Buckley22 in its use of ratio to establish judgment criteria. Specifically, is the ratio of two specific areas and . Area is the region bounded below by the and above by curve , the line on the right, and the line on the left. Area is the region bounded below by the below, above by curve , the line on the right, and the line on the left. Obviously, and can further be defined as follows:
where is given by . Specifically, and can be accurately calculated as follows:
Unfortunately, membership function is complex (see equation (25)), making it difficult for manufacturing enterprises to compute and . However, they can be approximated using the following approach. First, let , where k can be any positive integer that is a multiple of 1000. Furthermore, represents the largest positive integer that is less than or equal to . Since , . Clearly, horizontal line divides surface area into k blocks of height . Thus, area can be approximated as follows:
For , can be defined as follows:
For , it is easy to see that , which can be defined as follows:
For , .
Because and , can be set to compute area . Thus, and area can be approximated as follows:
For , can be defined as follows:
For , can be expressed as follows:
Subsequently, ratio can be calculated based on equations (32) and (35). This means that can be shown as follows:
In this study, and are considered simultaneously to formulate the decision threshold, in which and must comply with the following requirement: . The decision threshold for the fuzzy testing model of index is therefore as follows:
When , is not rejected, meaning the process performance of lth characteristic has reached minimum capability value .
When , the decision on whether to reject cannot be made. Thus, the manufacturer must continue to track and analyze sample data until a final decision can be made.
When , is rejected, meaning the process performance of the lth characteristic has not reached minimum capability value .
In summary, the process performance of each NTB characteristic of a machined product must be determined using the fuzzy hypothesis testing model of . If the results of fuzzy testing for all quality characteristics fail to reject , the manufacturer can conclude that the process capability of the product meets required value .
Standard operating procedure for practical application
To facilitate practical implementation of the developed fuzzy process capability analysis model, standard operating procedure is provided in the form of step-by-step instructions:
Step 1: Specify required value for a machined product with h quality characteristics of symmetric tolerance, and calculate required value of for each quality characteristic (see equation (9)).
Step 2: Determine the number of subsample sets for quality characteristic , the size of each subsample, and the level of significance .
Step 3: Utilize Kolmogorov–Smirnov test to check the normality assumption of the collected data before process capability analysis.
Step 4: Calculate and critical value for each quality characteristic based on the randomly-collected subsamples of observations each (see equation (10)).
Step 5: Calculate TFNs and for and respectively based on the derived confidence interval (see equations (14), (24), and (28))
Step 6: Formulate membership functions and of TFNs and to approximate and (see equations (32) and (35)).
Step 7: Calculate ratio based on and to formulate the decision threshold to reliably judge the process capability of each quality characteristic (see equation (38)).
Step 8: Values and must be determined by production engineers with a wealth of practical experience, such that . If , then reject and conclude that the process performance of quality characteristic does not meet the minimum acceptable capability value ; if , then make no decision; if , then do not reject .
Application example
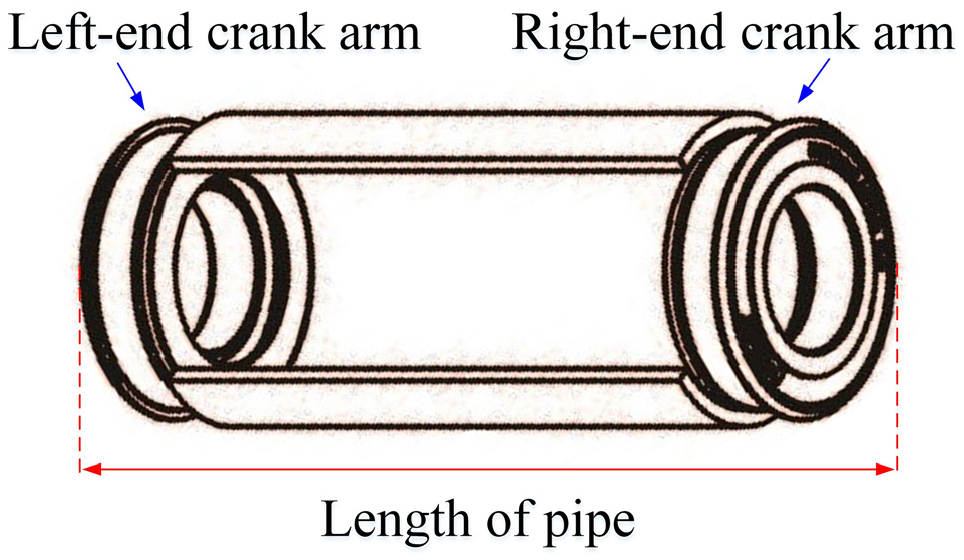
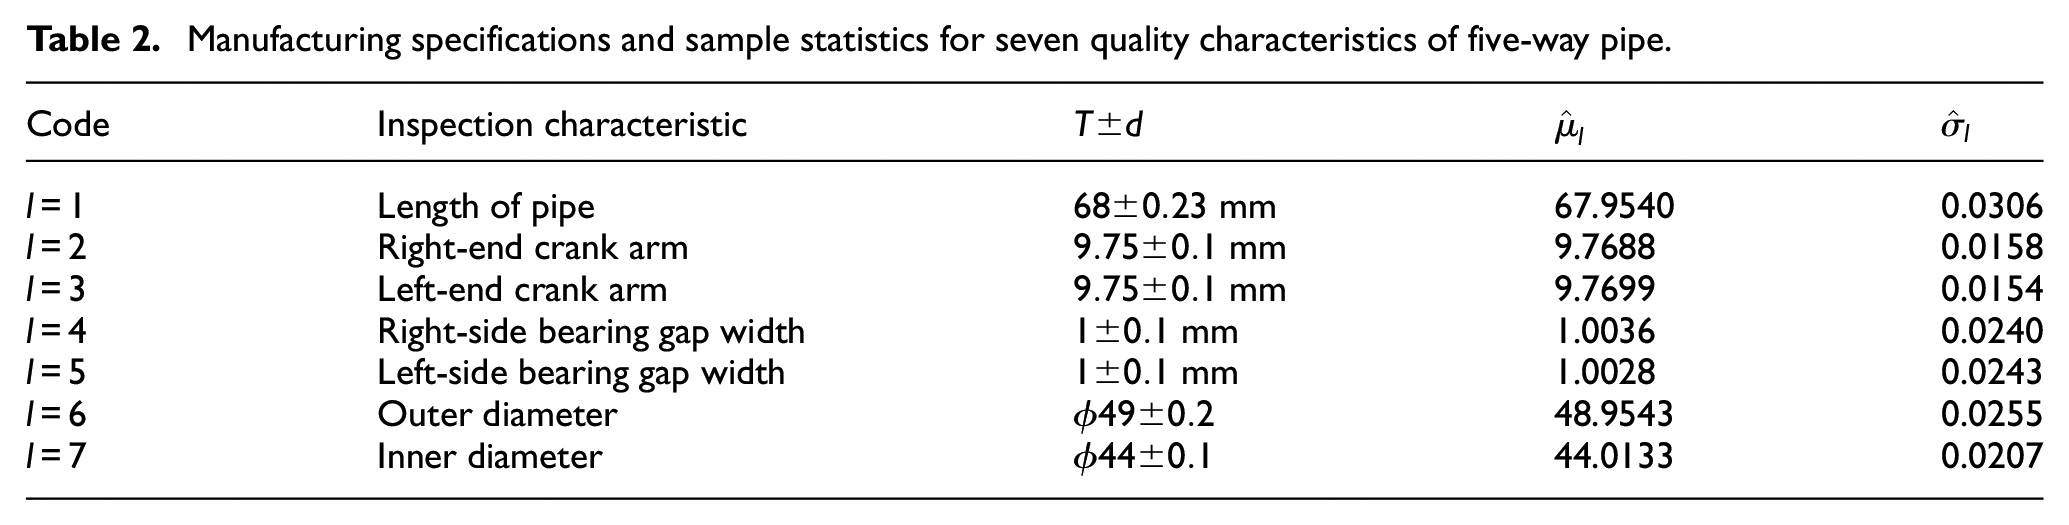
Central Taiwan has a unique machine industry cluster comprising manufacturers of machine tools, mechanical components, and metal products. Thus, Taiwan boasts a comprehensive and highly-efficient machine processing industry chain which is driving market competitiveness in manufacturing-related industries. This study selected an example of a five-way pipe product, which is a crucial component of bicycles (see Figure 4), from a machining factory located in Taichung. Table 2 presents the manufacturing specifications for seven quality characteristics of the five-pipe product. Twelve products were sampled randomly at regular time intervals from a stable manufacturing line, and the observed values of seven quality characteristics were obtained for these products. For each characteristic, subsamples of observations each in total were collected. These observations met the assumption of normality under the Kolmogorov–Smirnov test. Sample statistics and for each characteristic were calculated; these are presented in Table 2.
Five-way pipe product.
Manufacturing specifications and sample statistics for seven quality characteristics of five-way pipe.
Code
Inspection characteristic
Length of pipe
mm
67.9540
0.0306
Right-end crank arm
mm
9.7688
0.0158
Left-end crank arm
mm
9.7699
0.0154
Right-side bearing gap width
mm
1.0036
0.0240
Left-side bearing gap width
mm
1.0028
0.0243
Outer diameter
48.9543
0.0255
Inner diameter
44.0133
0.0207
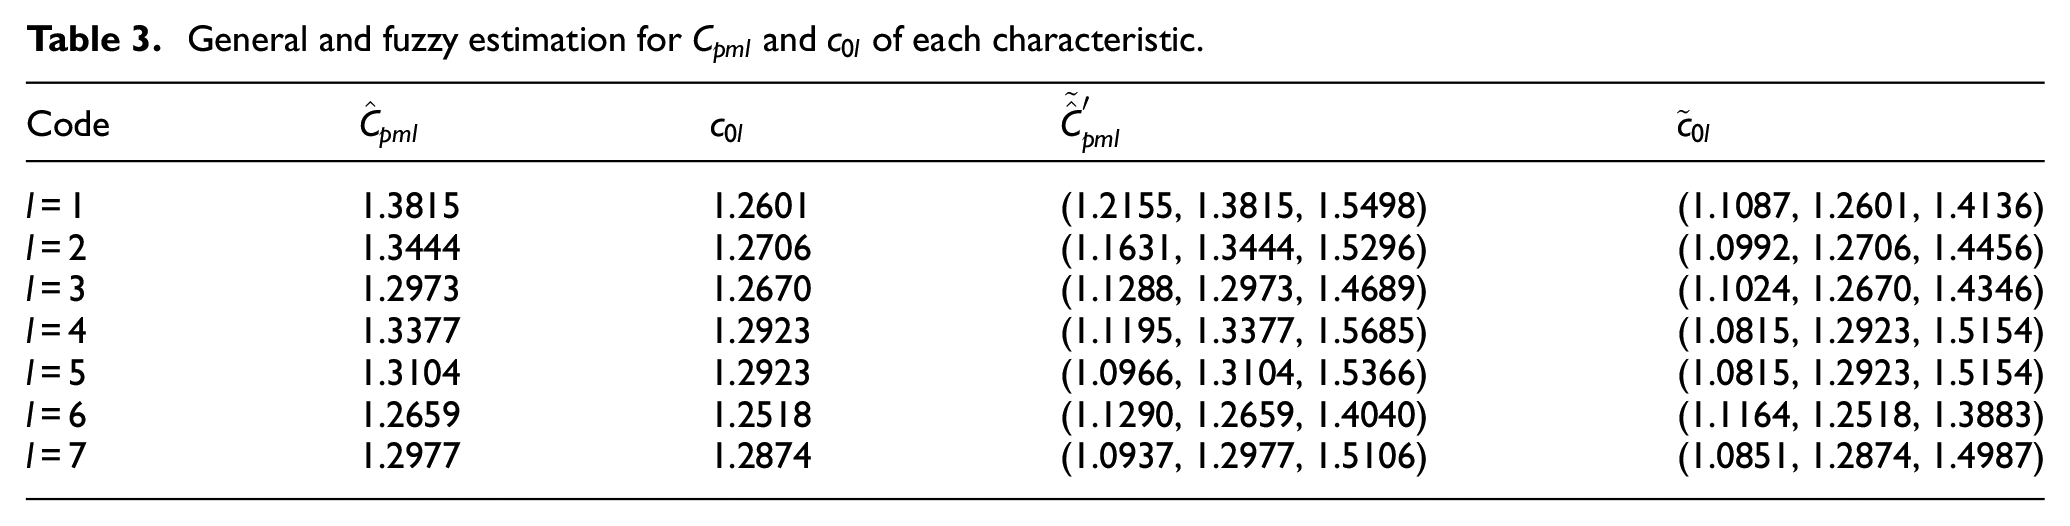
Using equation (10), the estimated value for each quality characteristic can be obtained; results are presented in Table 3. Assuming that the quality of the machined five-way pipe must meet at least 1 for the specified process capability, (i.e. ), the required capability value of each quality characteristic is 1.18323 based on Table 1. In other words, . As mentioned, hypothesis testing of can be employed to analyze process performance for each quality characteristic. Critical value and are shown in Table 3. Because , , it appears the process quality of the five-way pipe meets requirements.
General and fuzzy estimation for and of each characteristic.
Code
1.3815
1.2601
(1.2155, 1.3815, 1.5498)
(1.1087, 1.2601, 1.4136)
1.3444
1.2706
(1.1631, 1.3444, 1.5296)
(1.0992, 1.2706, 1.4456)
1.2973
1.2670
(1.1288, 1.2973, 1.4689)
(1.1024, 1.2670, 1.4346)
1.3377
1.2923
(1.1195, 1.3377, 1.5685)
(1.0815, 1.2923, 1.5154)
1.3104
1.2923
(1.0966, 1.3104, 1.5366)
(1.0815, 1.2923, 1.5154)
1.2659
1.2518
(1.1290, 1.2659, 1.4040)
(1.1164, 1.2518, 1.3883)
1.2977
1.2874
(1.0937, 1.2977, 1.5106)
(1.0851, 1.2874, 1.4987)
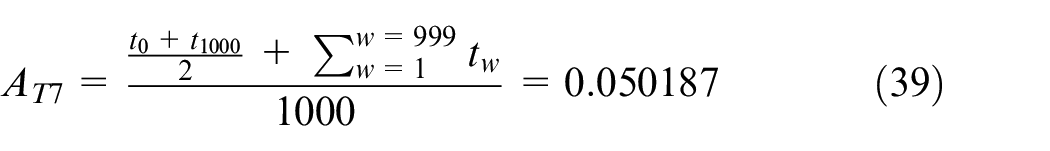
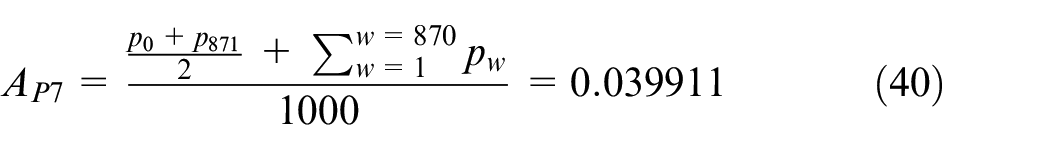
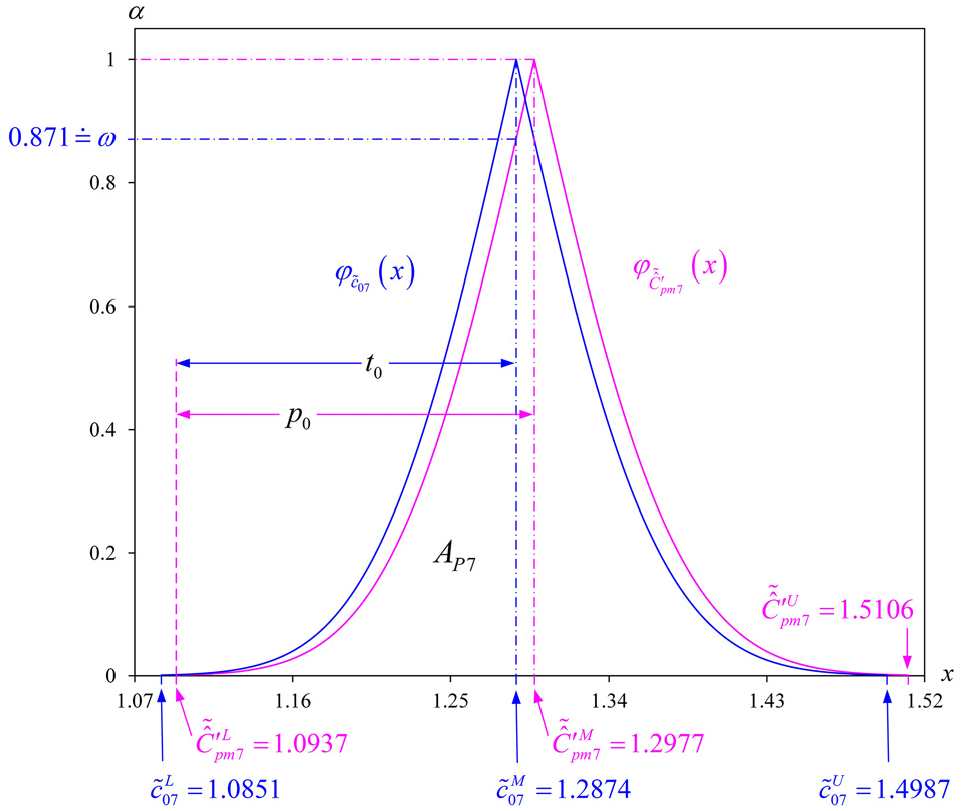
However, the use of crisp estimate to analyze process performance may result in misjudgment. In order to reduce the probability of making a Type-II error, the proposed fuzzy approach can be applied. First, for quality characteristic “inner diameter ()”, the relationship between membership functions and is as shown in Figure 5. Letting , area can be divided into 1000 areas of height 0.001. Then, can be obtained based on . That is, . Areas and can be approximated as follows:
Relationship between and for “inner diameter.”
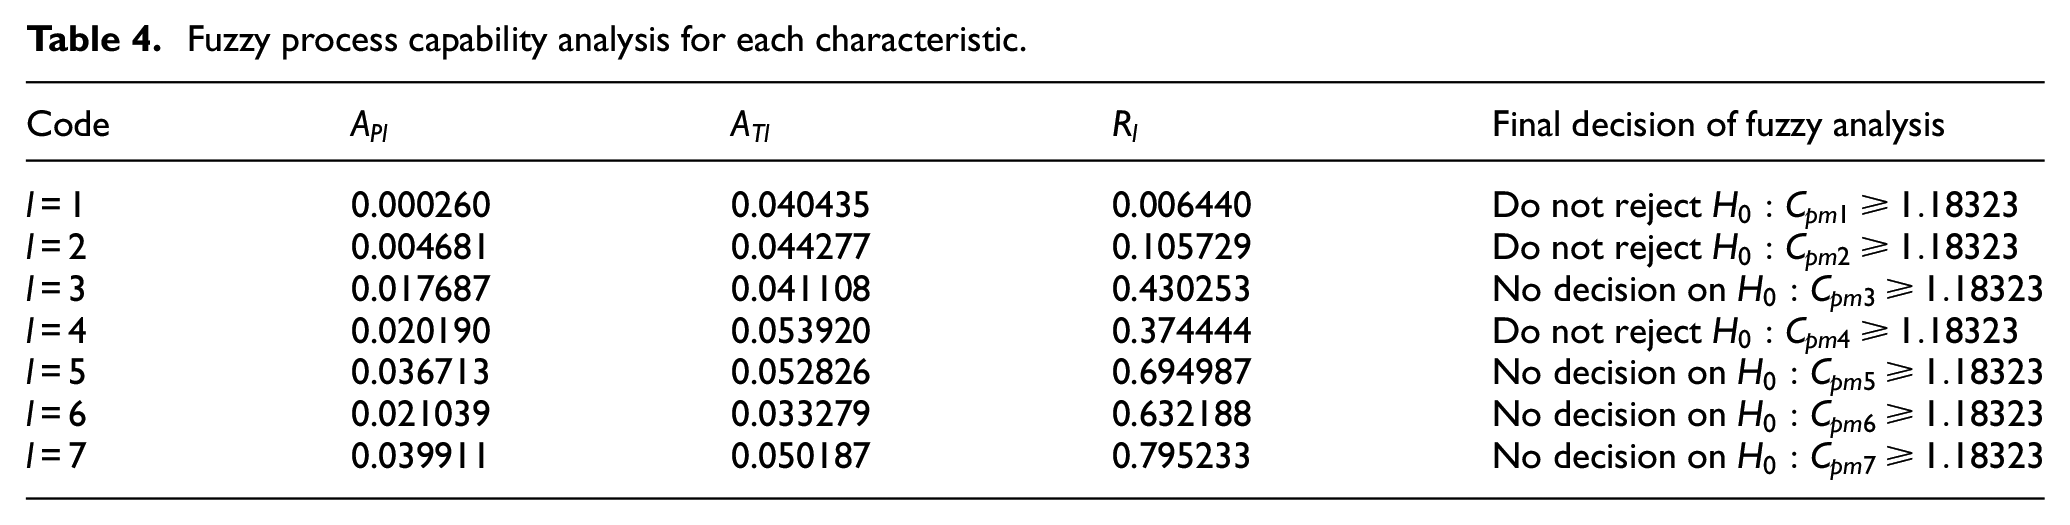
Ratio equals 0.795233. This study relied on the experience of a production engineer to set and . When , no decision on whether to reject or fail to reject can be made. This means that there is need for further analysis. Fuzzy analysis of the other characteristics is presented in Table 4. These results show that the process performance of characteristics do not necessarily meet the required value of 1.18323. Corrective measures are therefore required to improve product quality.
Fuzzy process capability analysis for each characteristic.
Code
Final decision of fuzzy analysis
0.000260
0.040435
0.006440
Do not reject
0.004681
0.044277
0.105729
Do not reject
0.017687
0.041108
0.430253
No decision on
0.020190
0.053920
0.374444
Do not reject
0.036713
0.052826
0.694987
No decision on
0.021039
0.033279
0.632188
No decision on
0.039911
0.050187
0.795233
No decision on
Conclusions
As consumer awareness grows, quality becomes not only a promise made by manufacturers to customers but also affects customer willingness to purchase. Furthermore, as many of today’s products feature multiple quality characteristics, manufacturing companies must conduct rigorous quality inspections of all characteristics to ensure product quality. To this end, the loss-based capability index was adopted in this study to evaluate the process performance of each quality characteristic. Subsequently, index was defined to analyze overall product quality. The one-to-one relationship between and can be used to ensure product quality meets requirements.
In practical applications of process performance assessment, is estimated from samples. This study thus utilized precise observations from multiple subsamples to estimate . Unfortunately, the fact that observed values are generally uncertain or imprecise means the risk of misjudgment is high. To increase the reliability of assessment and reduce the risk of Type-II error, the confidence interval of was further derived to produce TFNs and . The final decision criterion of fuzzy process capability analysis is formulated based on the relationship between these TFNs. An example of a five-way pipe product is used to illustrate the efficacy of the proposed analysis. This example demonstrates the increased reliability of process performance analysis for the proposed approach.
In the light of the above, the main contributions of this study include the following: (1) Index is proposed to analyze overall process capability of a machined product with multiple characteristics of symmetric tolerance. (2) A one-to-one relationship between and is established to easily calculate the required values of for each quality characteristic under the assumption that the quality of a machined product must meet . (3) Considering the measurement uncertainty of collected sample data, the confidence interval of is derived to produce the triangular-shaped fuzzy number of . (4) The fuzzy process capability analysis model for a machined product with multiple characteristics of symmetric tolerance is developed to prevent loss of generality.
To sum up, the proposed fuzzy analysis model can be utilized to analyze the process performance of various machined products and make decisions more reliable. Furthermore, sample data must be collected from a stable process and be normally distributed. However, process data may not be normally distributed in practice. Thus, numerous process capability indices for non-normal distribution were proposed in previous studies. Under the circumstances, the fuzzy process capability analysis for non-normal data can be further constructed based on the consideration of imprecise data in the future to extend the scope of application for the proposed fuzzy testing method.
Footnotes
Declaration of conflicting interests
The author declared no potential conflicts of interest with respect to the research, authorship, and/or publication of this article.
Funding
The author received no financial support for the research, authorship, and/or publication of this article.
ORCID iD
Tsang-Chuan Chang
References
1.
OladimejiMSUdosenI. The effect of diversification strategy on organizational performance. J Competitiveness2019; 11(4): 120–131.
2.
UngermanODedkovaJGurinovaK. The impact of marketing innovation on the competitiveness of enterprises in the context of industry 4.0. J Competitiveness2018; 10(2): 132–148.
3.
SchonbergerRJBrownKA. Missing link in competitive manufacturing research and practice: customer-responsive concurrent production. J Oper Manag2017; 49–51: 83–87.
4.
GallinoSRooderkerkR. New product development in an omnichannel world. Calif Manage Rev2020; 63(1): 81–98.
5.
SullivanLP. Quality function deployment. Quality Progress1986; 19(6): 39–50.
6.
ChanLKWuML. Quality function deployment: a literature review. Eur J Oper Res2002; 143(3): 463–497.
7.
AkaoY. Quality function deployment: integrating customer requirements into product design. New York, NY: Productivity Press, 2004.
8.
RelvasCRamosA. New methodology for product development process using structured tools. Proc IMechE, Part B: J Engineering Manufacture2021; 235(3): 378–393.
9.
EfeBYerlikayaMAEfeÖF. Mobile phone selection based on a novel quality function deployment approach. Soft Comput2020; 24(20): 15447–15461.
10.
WangCH. Incorporating the concept of systematic innovation into quality function deployment for developing multi-functional smart phones. Comput Ind Eng2017; 107: 367–375.
11.
ChenKSChangTC. A modified approach for Six sigma quality assessment of product with multiple characteristics in intelligent manufacturing environments. J Test Eval2021; 49(5): 3035–3053.
12.
ChenKSChenDFHuangMC, et al. Analyzing processing quality of machine tools via processed product: example of ball valve processing machine. Proc IMechE, Part E: J Process Mechanical Engineering2020; 234(4): 331–341.
13.
SeoSParodyR. Product quality analysis for multi-processes with multiple quality characteristics using capability indices. Int J Productivity Qual Manag2019; 28(3): 403–416.
14.
ChangTCWangKJChenKS. Capability performance analysis for processes with multiple characteristics using accuracy and precision. Proc IMechE, Part B: J Engineering Manufacture2014; 228(5): 766–776.
15.
KonukFA. The role of store image, perceived quality, trust and perceived value in predicting consumers’ purchase intentions towards organic private label food. J Retailing Consum Serv2018; 43: 304–310.
16.
BenekeJFlynnRGreigT, et al. The influence of perceived product quality, relative price and risk on customer value and willingness to buy: a study of private label merchandise. J Prod Brand Manag2013; 22(3): 218–228.
17.
RamanathanUSubramanianNYuW, et al. Impact of customer loyalty and service operations on customer behaviour and firm performance: empirical evidence from UK retail sector. Prod Plan Control2017; 28(6-8): 478–488.
18.
ZhouXJiangPWangY. Sensitivity analysis–based dynamic process capability evaluation for small batch production runs. Proc IMechE, Part B: J Engineering Manufacture2016; 230(10): 1855–1869.
19.
KaneVE. Process capability indices. J Qual Technol1986; 18(1): 41–52.
20.
ChenKSChungLChangTC. Developing a quality-based supplier selection model from the buying company perspective. Qual Technol Quant Manag2021; 18(3): 267–284.
21.
LiaoMYPearnW. Modified weighted standard deviation index for adequately interpreting a supplier’s lognormal process capability. Proc IMechE, Part B: J Engineering Manufacture2019; 233(3): 999–1008.
ChenKSChangTC. A fuzzy approach to determine process quality for one-sided specification with imprecise data. Proc IMechE, Part B: J Engineering Manufacture2020; 234(9): 1198–1206.
24.
ChenKSChenHTChangTC. The construction and application of Six sigma quality indices. Int J Prod Res2017; 55(8): 2365–2384.
25.
ChenKSWangKJChangTC. A novel approach to deriving the lower confidence limit of indices Cpu, Cpl, and Cpk in assessing process capability. Int J Prod Res2017; 55(17): 4963–4981.
26.
ChanLKChengSWSpiringFA. A new measure of process capability: Cpm. J Qual Technol1988; 20(3): 162–175.
27.
RuczinskiI. The relation between Cpm and the degree of includence. PhD dissertation, University of Würzburg, Würzburg, Germany, 1996.
28.
WuMFChenHYChangTC, et al. Quality evaluation of internal cylindrical grinding process with multiple quality characteristics for gear products. Int J Prod Res2019; 57(21): 6687–6701.
29.
HuangCFChenKSSheuSH, et al. Enhancement of axle bearing quality in sewing machines using six sigma. Proc IMechE, Part B: J Engineering Manufacture2010; 224(10): 1581–1590.
30.
PearnWLShuMHHsuBM. Testing process capability based onCpmin the presence of random measurement errors. J Appl Stat2005; 32(10): 1003–1024.
31.
BoylesRA. The Taguchi capability index. J Qual Technol1991; 23(1): 17–26.
32.
MontgomeryDC. Introduction to statistical quality control. 8th ed.New York, NY: Wiley, 2019.
33.
WuCW. Assessing process capability based on Bayesian approach with subsamples. Eur J Oper Res2008; 184(1): 207–228.
34.
WangPHLinGHChangTC. Assessing nanofabrication performance based on the estimated Taguchi capability index with subsamples. Int J Inf Manage Sci2017; 28(1): 33–52.
35.
MontgomeryDCRungerGC. Applied statistics and probability for engineers. 7th ed.New York, NY: Wiley, 2017.
36.
ChangTCChenKS. Testing process quality of wire bonding with multiple gold wires from viewpoint of producers. Int J Prod Res2019; 57(17): 5400–5413.
37.
van der MerweAJSjölanderMRvan ZylR. Bayesian testing for process capability indices. S Afr Stat J2019; 53(2): 87–113.
38.
PearnWLWuCHChuangCC. An effective powerful test for one-sided supplier selection problem with multiple independent characteristics. Qual Technol Quant Manag2016; 13(2): 182–196.
39.
ChangTCChenKS. Statistical test of two Taguchi Six-Sigma quality indices to select the supplier with optimal processing quality. J Test Eval2022; 50: 674–688.
40.
LeeWCWuJWHongCW, et al. Decision procedure of performance assessment of lifetime index of products for the Gompertz distribution. Proc IMechE, Part B: J Engineering Manufacture2010; 224(3): 493–499.
41.
AfshariRGildehBSNadiAA. A modified method on estimating and assessing the process yield with imprecise multiple characteristics. Iran J Fuzzy Syst2020; 17(6): 115–131.
42.
HuangCCChangTCChenBL. Fuzzy assessment model to judge quality level of machining processes involving bilateral tolerance using crisp data. J Chin Inst Eng2021; 44(1): 1–10.
43.
LinPCPearnWL. Testing manufacturing performance based on capability indexCpm. Int J Adv Manuf Technol2005; 27(3-4): 351–358.
44.
ChenKSLaiYLHuangMC, et al. Fuzzy judgement model for assessment of improvement effectiveness to performance of processing characteristics. Int J Prod Res. Epub ahead of print 6March2022. DOI: 10.10802075 43.2022.2044531